
Implementation: The DMAIC Tools - PBworksetshare.pbworks.com/f/Implementation The DMAIC...
53
4/26/2010 1 Implementation: The DMAIC Tools Alessandro Anzalone, Ph.D. Hillsborough Community College, Brandon Campus 1. Introduction 2. Define Tools 3. Measure Tools 4. Analyze Tools 5. Improve Tools 6. Control Tools 7. Using the Lean Six Sigma Tools 8. References
Transcript of Implementation: The DMAIC Tools - PBworksetshare.pbworks.com/f/Implementation The DMAIC...

4/26/2010
1
Implementation: The DMAIC Tools
Alessandro Anzalone, Ph.D.
Hillsborough Community College, Brandon Campus
1. Introduction2. Define Tools3. Measure Tools4. Analyze Tools5. Improve Tools6. Control Tools7. Using the Lean Six Sigma Tools8. References

4/26/2010
2
“But how the devil did you deduce that, Holmes?”
“I see that you are a medical doctor, Watson, by the stethoscope bulging in your pocket and a cane engraved with CCH for Charing Cross Hospital. I see that you are returned wounded from India because you are brown as a berry and walk with an exaggerated limp. . ..“
“Ah Holmes, I thought you’d done something clever there for a moment.”
Sir Arthur Conan Doyle (1859-1930)
The same reaction occurs when people first learn about many of the Lean Six Sigma tools described in this chapter. While some of these tools are simple and straightforward, others can be intimidating. But with training and guided practice, black belts and team members soon come to think, “What’s the big deal?”
These tools are worth the effort. They have been proven in practice, time and again, that they can bring nearly miraculous progress to what you thought were “intractable” problems. They are the tools that can achieve breakthrough performance improvement in quality, cost, and lead time. In keeping with the basic premise of this book—that a combination of Six Sigma and Lean is needed to achieve the best results— you’ll find here a mixture of tools from both of these disciplines.

4/26/2010
3
The tools used most often in Define serve two purposes:
1. Documenting key information about the project (project definition form).
2. Providing a high-level view of the value stream being targeted in the improvement effort (SIPOC diagram).
Project Definition Form
This form was introduced back in the course because it’s likely that the people responsible for selecting projects will have begun documenting information relevant to the project. The project definition form (PDF) captures key information relevant to the project, such as the problem statement, scope, assumption, resources, and schedules.
If a PDF and/or a team charter has not been completed, the team itself can take on the responsibility to prepare a draft to submit to its champion and unit manager for review and approval. This is generally accomplished using a Web-based tool.

4/26/2010
4
SIPOC Diagram
A core principle of Lean Six Sigma is that defects can relate to anything that makes a customer unhappy—long lead time, variation in lead time, poor quality, or high cost, for instance. To address any of the problems, the first step is to take a process view of how your company goes about satisfying a particular customer requirement. Because many organizations still operate as functional silos and because no one person owns the entire process, just steps in the process, it’s likely that few if any people will have looked at the process from start to finish.
SIPOC Diagram
The tool that black belts use to create a high-level map of process is called SIPOC, which stands for:
Supplier: The person/process/company that provides whatever is worked on in the process (raw material, a subassembly, information, etc.). The supplier may be an outside vendor or another division.
Input: The material or information provided. Process: The internal steps (both those that add value and
those that do not add value). Output: The product, service, or information being sent to the
customer (preferably emphasizing critical-to-quality features). Customer: The next step in the process or the final customer.

4/26/2010
5
SIPOC Diagram
SIPOC Diagram
A SIPOC diagram usually takes shape during the Define stage of DMAIC, but its impact is felt throughout the rest of the improvement project as well. In the Measure phase, the team will be measuring the lead times and quality levels wherever the process fails to meet (CTQ) requirements of the customer. In the Analyze phase, the team will be relating each CTQ and each time trap (the output, or Y, in Six Sigma parlance) to a few process parameters (the X’s) whose change will improve the CTQ or time trap. In Improve, the team makes changes to the inputs and process steps that affect the critical output. These improvements are then, in Control, the target of measures to make sure the gains are retained.

4/26/2010
6
The Measure phase of DMAIC is symbolic of a critical shift in thought patterns that has to occur in order for any project to deliver on its desired goals. No longer can team members go from thought to action; they have to go from thought to data to action. Data comes in all shapes and sizes, with a corresponding array of tools used to collect, display, and analyze it.
We’ll look at examples of five types of tools, both simple and sophisticated, that your teams will likely use in their Measure work:
A. Describing a process and its characteristicsProcess mappingLead time/cycle efficiency
B. Focusing and prioritizingPareto chartsCause-and-effect matrixFailure modes and effects analysis (FMEA)
C. Generating and organizing ideasBrainstormingNominal group techniqueMultivotingCause-and-effect diagrams (fishbones)
D. Collecting data and ensuring accuracyChecksheetsMeasurement accuracy (gage R&R)
E. Understanding and eliminating variationRun charts/control chartsProcess capability

4/26/2010
7
A. Process Characteristics Tools
Process Mapping. The foundation of the Lean Six Sigma—and virtually all modern improvement methods—is the process map (often called flowchart). Process maps are similar to SIPOC in that they show process steps, inputs, and outputs, but are different in being both more detailed and more localized. The importance of a process map to any improvement effort cannot be overemphasized: it is simply too difficult to work on a process without having a picture of it. It is often amazing to witness the constructive discussions and revelations arising from the simple exercise of getting people together to build a process map. In non-manufacturing applications, a process map generally does not exist; hence the opportunities for improving speed, reducing cost, and increasing value are all the greater.

4/26/2010
8
Process Lead Time and Cycle Efficiency. Some projects may be defined to directly attack process cycle time, lead time, or other speed issues. As you might recall from Chapter 3, the key Lean metric is process cycle efficiency, which is determined by comparing the value- added time with the total lead time.
Measuring total lead time will sound daunting if you think it involves time-coding every piece of paper or material that enters a process and tracking how long it takes to come out the other end. But, in truth, it is not as difficult as it might sound at first, because you don’t have to wait for a product (or report, order, etc.) to go through a full manufacturing process cycle (which could take many weeks). Instead, you can get a fairly accurate estimate of lead time by corn- paring work in process (WIP) with the number of completions per day:
lead time = WIP/completions

4/26/2010
9
At this time in a project, a team reaches a point where they want to calculate cycle efficiency. Some of these calculations may have already been performed as part of the value stream mapping (conducted during project selection). If the calculations were never done or if only preliminary data was collected, the team should do the following:
Confirm that the value stream map includes all the non-value- added steps, such as rework, moving to stockrooms, retrieving, etc. These non-value-added steps will provide the foundation for estimating what cost can be driven out of a process by Leaning it. While the MRP (Material Requirements Planning) routers are useful for information on the value-added steps, it is best to include people who actually work in the process to confirm all the non- value-added steps.
Estimate the value-added time and WIP at each step in the process.
After the data is recorded, the team should meet to discuss the results. A one-line diagram of the process should be written on a large white board, with Postit® notes placed along the diagram to depict value-added and non-value-added steps. A lot of discussion will ensue: steps have been missed, the diagram is wrong, the times are wrong, etc. However, the heat of this discussion will also generate some light and a clear picture of the process will emerge.
Once the team has agreed on how the process is depicted and how time is allocated between value-added and non-value-added steps, they are ready to calculate the cycle efficiency:
process cycle efficiency = value-added time/total lead time
Measuring process cycle efficiency is a way to benchmark your process performance against world-class standards. As you may recall, a Lean process is one in which the value-added time in the process is more than 25% of the total lead time of that process. Knowing the cycle efficiency, therefore, lets you judge how much improvement is possible and perhaps needed.

4/26/2010
10
B. Focus/Prioritization Tools
The “funnel” diagram in Chapter 10 showed how one purpose of the DMAIC process is to narrow down from the dozens of possible causes (X’s) to just the few that contribute the most to the key customer issues ( outputs, or Y’s). The tools below will help your teams where to focus their efforts to get the biggest impact.
Pareto Charts. The Pareto chart is simply a bar chart in which each bar represents the relative contribution of each cause or component to the total problem, with the bars arranged in descending order of importance.
Pareto charts are named for the Italian statistician who asserted the Pareto 80/20 principle: that 80% of the problem can be explained by just 20% of the causes. They are, therefore, a tool of focus and lever- age, allowing us to devote our energies to the areas that will have the biggest impact—in essence giving us five times more leverage than would be possible if we spread our energies equally among all the causes contributing to a result.
Pareto charts are extremely simple to construct and interpret and therefore are one of the tools you should expect nearly every team to use early in its project.

4/26/2010
11
Cause-and-Effect Matrix. A very effective method of capturing the Voice of the Customer and relating it to process input variables is the cause-and-effect matrix. This type of matrix helps you filter out less important steps and inputs so you can focus on the parts of your process containing the relatively few critical input variables that truly have an effect on your key process output variable.
To create a cause-and-effect matrix, list customer-related outputs across the top of a grid, along with their rating (1— 10) in terms of importance to the customer. These outputs will include the key process output(s) for your project. Then list process inputs or steps along the left side of the matrix. These process steps or inputs will typically come from the process map as well as additional brainstorming. Rate each step or input based on its relationship to the customer output, using a scale of 0, 1, 3, or 9, where 0 means no correlation and 9 is strong or heavy correlation. Finally, multiply the process correlation times the customer weighting and add the scores across the row to get a total score for each process input.

4/26/2010
12
In this way, a cause-and-effect matrix acts much like a Pareto chart by providing focus. Here, as with other tools, the inputs or steps with the highest score have the strongest relationship to customer needs, so improvements in those areas will go the furthest toward achieving gains that will be noticed and appreciated by customers. In this context, the term “customer” does not mean only those external to the organization. Here, the customer for an internal process may well be the next downstream workstation as well as the external customer.

4/26/2010
13
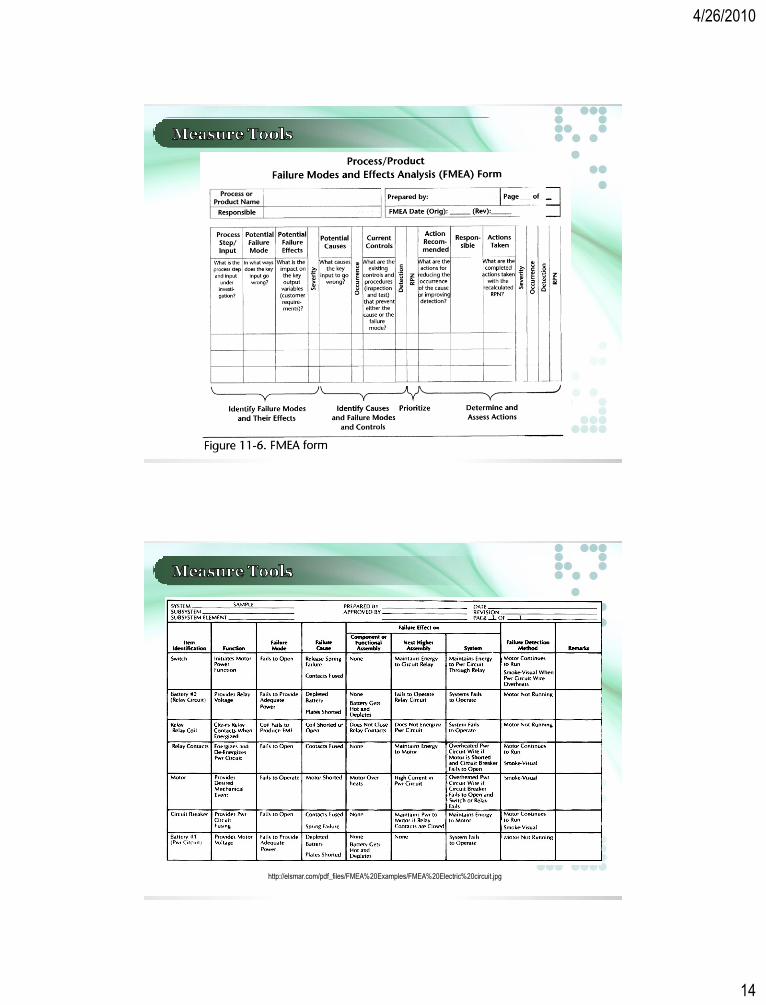
Failure Modes and Effects Analysis (FMEA). Like several other tools described previously in this chapter, failure modes and effects analysis (FMEA) is a primarily a tool of focus. FMEA is used to prioritize risks to the project and document recommended actions. Each potential type of failure of a product or process is assessed relative to three criteria on a scale of 1 to 10:
The likelihood that something will go wrong (1 = not likely; 10 = almost certain).
The detectability of failure (1 = likely to detect; 10 = very unlikely to detect).
The severity of a failure (1 = little impact; 10 = extreme impact, such as personal injury or high financial loss).
The three scores for each potential failure are multiplied together to produce a combined rating known as the Risk Priority Number (RPN): those with the highest RPNs provide the focus for further process/redesign efforts.
http://gcaptain.com/maritime/blog/wp-content/uploads/2009/10/FMEA.png
4/26/2010
14
http://elsmar.com/pdf_files/FMEA%20Examples/FMEA%20Electric%20circuit.jpg

4/26/2010
15
C. Idea-Generating and Organizing Tools
During the Define stage of DMAIC, the team is mostly confirming or fleshing out information that has already been collected. The amount of creativity required by the team is minimal at that point, a situation that reverses once the team reaches the Measure stage. Here and throughout the rest of DMAIC, a team needs to be sure that it is getting high-level involvement from all team members. There are a variety of so-called idea-generating and-organizing tools that a black belt can use to foster productive interaction with the team and help ensure the ideas that will actually result in improvement are captured.
Brainstorming. Brainstorming techniques are used to solicit unconstrained input and ideas from each team member, even ideas with which other team members (including the black belt!) might disagree. The trick to effective brainstorming is record all ideas, without discussion or comment, until a complete list is constructed. A brainstorming session may be the first time a newly minted black belt is called on to be an impartial facilitator and to actively manage team member participation—skills that take some practice to fully develop. You may want to have an experienced black belt or a master black belt act as a coach/observer during this first team facilitation to help guide the new black belt.

4/26/2010
16
Idea-Selecting Tools. There are some common and very simple prioritization tools often used in conjunction with brainstorming:
Nominal group technique (NGT) is a way to add a quantitative element to the decision making that often follows brainstorming. It is used when teams have a number of contentious members or controversial issues. During an NGT session, discussion is limited; people may ask questions of clarification and state their own personal reasons for supporting a given option, but there is no back- and-forth discussion about the pros and cons. Once everyone is clear about what each element on a brainstormed list means, they are given a limited number of votes to cast. Then, the choices that receive the most votes are singled out for further attention. The advantage of NGT is that it uncouples ideas from the team member personalities, so an idea gets evaluated on its merits, not according to the person who suggested it.
Multivoting is a means for closing in on a conclusion when con- fronted with either an initial brainstormed list or one that has been semi-prioritized through NGT. Once the team has boiled the list of possible sources of a problem down to a manageable number (anywhere from about five to 10), each team member gets a third as many votes to cast in the final vote as there are items. If there were nine items, for example, each member would have 9/3 = three votes to cast. The results are then put on a Pareto chart.

4/26/2010
17
Idea-Organizing Tool. Cause-and-Effect (C&E) or Fishbone Diagrams are a specialized idea-organizing tool that helps a team identify potential causes they need to investigate. The ideas from brainstorming are typically grouped into categories known as the Six M’s—Methods, Manpower (personnel), Machines, Materials, Measurement, and Mother Nature (environment)—and then organized in related categories into a diagram that looks like a fish skeleton. One of the major outcomes is a consensus by the team members to collect some more data to resolve the issues.
It’s important to note that C&E diagrams are structured brainstorming tools, not data! Just because something is listed on the C&E, that doesn’t mean it is an actual cause of the problem. The team still needs to collect data to verify which potential causes are actual contributors.

4/26/2010
18
http://nam726.files.wordpress.com/2008/08/fishbone.jpg
D. Data Collection/Accuracy Tools
Obviously if a team is going to be collecting data, it should have standard procedures for measuring and logging the data. There are many tools for establishing common data-collection procedures and for ensuring that the data collected is a reliable indicator of what’s really going on in the process. We’ll highlight just two of these tools here.

4/26/2010
19
Checksheets. A major activity in Measure is gathering lots of data. A simple data recording method is the checksheet, which can detect trends and allow good questions to be posed to the team in a manner understandable by all. A checksheet can take many forms. It suggests additional collection points and data that should be taken.
Checksheets are commonly needed early in a project when certain key data is not available. For example, a manufacturer was interested in reducing waste in a particular key operation. The pounds of waste being produced were known, but no information was being recorded to indicate the amount of waste resulting from the various sources within the operation. A simple checksheet was implemented at the different workstations to capture the contribution of each to overall waste.

4/26/2010
20
Gage Repeatability and Reproducibility (R&R). In some ways, it might be argued that gage repeatability and reproducibility (gage R&R) should appear first on everyone’s tool list, because it’s of fundamental importance. Implicit in our discussion is the assumption that the measurements being taken are accurate and consistent. But this assumption is not always true. Gage R&R is the method by which physical measurement processes are studied and adjusted to improve their reliability. “Repeatability” means that someone taking the same measurement on the same item with the same instrument will get the same answer. “Reproducibility” means that different people measuring the same item with the same instrument will get the same answer.
If you are a champion, sponsor, or other manager who will be reviewing a team’s work, it’s not essential that you understand how to perform a gage R&R analysis, but you should make it a habit to ask a team how much confidence they have in their measurement system and how they can tell whether their measurements are accurate.
Understanding and Eliminating Variation
As you probably know by now, there are many ways in which “variation is evil”:
Variation in product quality leads to scrap and rework, which are significant contributors to manufacturing overhead costs, delays in lead time, and product that does not meet customer requirements.
Variation in time—arrival time, processing time, etc.—contributes to congestion and other delays that prevent a process from operating at optimal speed.

4/26/2010
21
E. Understanding and Eliminating Variation
In order to reduce variation, you first have to identify it, then understand what causes it. There are several classes of tools used to understand variation. The most common are of two types:
Graphic tools used to plot data over time (and expose patterns of greatest variation) and even relate process capability to customer specifications.
Statistical analysis tools that can help pinpoint important differences in variation.
These two types of tools overlap. There are, for example, statistical tests used to analyze data on a graphic chart and results from some statistical analyses are sometimes displayed graphically. Here are some examples of these tools.
Run Charts. By definition, a process is something that is repeated periodically over time. It stands to reason, therefore, that much of the data a team collects will be produced over time as well—such as key process measures taken each shift, number of defects produced per hour or per day, total lead time each day, and so on.
There is a special subset of tools useful for displaying and analyzing data that is time-ordered, the simplest of which is called a run chart. A run chart simply displays observed data points in the order in which they are collected.
You can learn a lot simply by plotting data in time order, such as ... The general range of scatter (variation) in the points. Whether the data points are generally stable around some mean or if
there are clear trends upward or downward.
Besides these simple visual impressions, there is a set of statistical rules used to interpret the patterns (or lack thereof) on a run chart. However, detailed statistical analysis and interpretation are normally done with control charts.

4/26/2010
22
http://hab.hrsa.gov/tools/QM/images/Figure2.gif

4/26/2010
23
Control Charts. Control charts are the high-power version of run charts. The purpose of a control chart is to help a team determine whether the variation seen in the data points is a normal part of the process (known as “chance” or “common cause” variation) or if some- thing different or noticeable is happening (“special cause” or “assignable” variation). There are different improvement strategies depending on which type of variation is present (common or special cause), so it is important for a team to know the difference. There are several simple statistical rules used to analyze the patterns and trends on the control chart to determine whether special cause variation is present.
The basic structure of a control chart is always the same. The charts show the following:
Data points plotted in time order.A centerline that indicates the average.Control limits (lines drawn approximately 3 standard deviations from the
average) that indicate the expected amount of variation in the process.

4/26/2010
24
What differs from chart to chart is the type of data plotted on the chart and the specific formulas used to calculate the control limits. Being able to know what kind of data to collect and the best way to calculate control limits is a skill that a black belt will develop only through special training or under the guidance of a master black belt or other statistical expert.
It takes time and effort to create a control chart, so the first and most important decision to make is when to create one. When control charts are used as part of a DMAIC project, that decision should be fairly clear: you want to monitor variation in characteristics of the process and/or its output that are critical to quality in terms of your project goals. In other words, don’t have black belts create control charts just because they can! Pick and choose where to use these tools.
In and of itself, creating a control chart does you no good. You have to understand what the chart is telling you and take appropriate action. We create control charts for one purpose: to help us distinguish between two types of variation: common cause variation and special cause variation (also known as assignable variation).
Common cause variation is inherent in the process; it is present all the time to a greater or lesser extent.
Special cause variation is a change that occurs because of something different or unusual in the process.
As mentioned above, the reason we need to tell the difference between special and common cause variation is because there are different strategies for reacting to them.

4/26/2010
25
http://www.emeraldinsight.com/fig/0400190106001.png
Process Capability Analysis. Process capability tells you how well the natural process variation fits within the range of customer specifications. A capable process is one where all of the natural variation fits within the customer-defined target range; in a six sigma capable process, the natural process variation is only half as wide as the target range. An important point to remember is that we must have stability (no special causes) before we can assess capability. Therefore, capability analysis will be conducted only after control charts confirm that the process is stable.

4/26/2010
26
There are four possible relationships between the actual process capability (determined by the process variation) and its desired capability (determined by customer specifications):
Ideal state: The process is in control and meets customer specs. Even though you are meeting customer specs, there will still be opportunities for reducing cost and improving process speed if you are not yet operating at six sigma capability. But you’ll have to dig hard!
Threshold: The process is in control, but the process output data is wider than the spec limits. Use DOE or other problem-solving tools to tighten up the distribution (reduce variation).
Brink of chaos: The process is out of control but meets customer specs. Continue using control charts to identify and eliminate special causes of variation. This will make the process more predictable.
Chaos: The process is not in control and doesn’t meet specs. Remove special causes first to bring the process in control, then work on additional improvements to meet specs.

4/26/2010
27
The data and process tools used in Measure help a team focus on process factors that are most likely contributing to the problem at hand. But that belief is just a theory until it is tested with additional data. Two types of tools used in Analyze are causal analysis tools, used to confirm which potential causes actually contribute to a problem, and time trap analysis tools, used to locate the biggest sources of delays in the process.
Causal Analysis Tools
Scatter Plots. The scatter plot is a simple tool that can help determine if a relationship exists between two sets of data. For example, does the backlog of work correlate with the error rate of computer data entry?
The data displayed in Figure 11-12, for example, was gathered to investigate whether pizza preparation time was dependent on equipment, methods, personnel, or some other factors. In this case, the scatter of points appears almost randomly arranged, indicating that there is no relationship between this input (how busy store is) and output (pizza prep time).

4/26/2010
28
Scatter plots provide a powerful visual image of how potential inputs variables are or are not related to the targeted process outcomes. Often, the visual impression is enough to confirm or rule out a specific course of action—such as whether a potential cause should be specifically addressed by countermeasures. If necessary, more advanced statistical tools, such as regression analysis, can be used to quantify the degree of relationship between the two factors. Keep in mind that you can see a trend between variables without a cause/effect relationship. For example, insect bites and ice cream sales would show a correlation in a scatter plot. This is because both increase in warmer temperatures.
http://www.upa.pdx.edu/IOA/newsom/pa551/Image243.gif
ANOVA (Analysis of Variance). Let’s say that we have a machine that is used on all three shifts and that the average value of its output differs from one shift to the other. Like all processes, there will always be some variation present. The important improvement question is:
Are the differences in averages among the shifts significant—that is, should you investigate further and try to standardize procedures among those shifts?
What if, in addition to shifts, we have several operators, three other machines, and different ways to set up these machines? The important question becomes: Which input, or factor, has the greatest effect on my key output? Is it shift, operator, machine, or setup? Which of these areas should I explore further?
Such questions are much easier to answer with simple statistical packages like Minitab. Where once you would have had to perform complex calculations, now it is simply a matter of inputting the data, asking for an Analysis of Variance (ANOVA) evaluation, and interpreting the answer.

4/26/2010
29
Regression Analysis. ANOVA methods help us to identify which factors, or input variables, affect our output. Regression analysis carries this a step further by providing us with a mathematical model that quantifies the relationship. For example, in a polymer manufacturing process, ANOVA could tell us that temperature and line speed both have a significant effect on the tensile strength of a polymer. ANOVA alone will not tell us how much the tensile strength changes for every unit change in temperature or line speed, but regression analysis will. Regression will provide us with an equation that mathematically relates the inputs to the output. This allows us to predict process performance resulting from any changes we make in our input variables.
Time Trap Analysis: Supply Chain Accelerator Software. One of the major themes of Lean Six Sigma is that slow processes are expensive processes. In most processes, the material spends 5% of its time in “value-added.” By increasing value-added to 20%, you can reduce manufacturing overhead by 20%. How to achieve such a substantial increase in value-added time in a process? The Second Law of Lean Six Sigma taught us that 80% of the delay is caused by a few time traps. By identifying these time traps (using the First Law of Lean Six Sigma for Supply Chain Acceleration equation), you can define those improvement projects that will drive the cycle efficiency over 20% and hence make a major impact—typically improving operating profit by 5% of revenue and reducing WIP and finished goods inventory by 50%.

4/26/2010
30
Over the last decade, virtually every supplier of ERP systems has supplemented the old infinite-capacity MRP systems with Advanced Planning programs that use real capacity These systems typically store all the data necessary to perform the minimum batch size calculations described above.
In addition, specialty supply chain accelerator (SCA) software is available as a supplement to Advance Planning (AP) programs. SCA software not only calculates the minimum batch size, but also helps you identify the hidden time traps, the steps that insert the most delay time (the “20%” we want to identify according to the Second Law of Lean Six Sigma). SCA software also helps establish a true pull system, where materials are released into the process on demand.
In short, SCA software can provide a value link between traditional materials planning capability that your company likely uses already and the new information needs associated with Lean Six Sigma projects. A schematic of the data flow within the whole Lean Six Sigma process is shown in the following figure.

4/26/2010
31
One key insight of the press example was that supply chain accelerator software helps us break out of the mindset that batch sizes are fixed and instead look at them as a dynamic variable we can alter as we improve process efficiency. To achieve smaller batch sizes, however, you first have to reduce the delays at the time traps:
1. Make the improvement (e.g., setup reduction).2. Calculate the new, smaller batch size that will allow the workstation to
produce at the same rate.
If you don’t reduce the batch size, you will not reduce the delay time appreciably. One of the reasons why companies make such slow progress in reducing lead time is that they are wedded to fixed batch sizes, or economic order quantity batch sizes. These take no cognizance of the number of different parts flowing through the workstation. A workstation that produces five different parts will have the same batch sizes as one that produces 20 different parts, thus resulting in four times the delay! Conclusion: dynamic batches are required to reduce lead time and inventory.
The tools associated with Improve are incredibly diverse. They fall into two broad categories:
Simple data collection/analysis tools used to confirm improvements. Specialized tools targeted at specific types of process problems.
Knowing which of the specialized tools is appropriate in any given situation will only come with experience. Here is an overview of five common Improve tools used to make both process and product improvements.

4/26/2010
32
Mistake Proofing
The assertions of mistake proofing are both bold and startling: “To engineer and instrument an activity or workstation so it is incapable of supplying a defective product or service.”
Mistake proofing really applies to any process, but it grew up in manufacturing, so people have mistakenly thought it was correspondingly limited. Actually, the concept of mistake proofing applies to any human endeavor. The modern version of mistake proofing evolved in Japan, where it is known as poka-yoke. But it should be pointed out that the key concept was widely used by Ford in Model T production as early as 1908, and later in the Rouge plant.
So how does mistake proofing work? Here’s a quick example involving a grinding operation. At the most basic level, mistake proofing would involve installation of an independent optical gauging system that automatically measures each part after machining and kicks rejects into a “bad” bin. This at least would prevent assembly problems downstream. This would enable downstream workstations to achieve six sigma quality but it wouldn’t eliminate the cost of scrap and rework. The next step toward Lean Six Sigma quality and cost would be to optically or mechanically measure the part during grinding and provide a dynamic feedback loop to compensate for abrasive wear. By this means, no bad parts are produced, which is the basic premise of mistake proofing. Signals can be provided to alert the Total Productive Maintenance process of the degrading status of the consumable abrasive material.

4/26/2010
33
Mistake Proofing: An Important First Step. Mistake proofing reflects a key mindset that has to imbue a Lean Six Sigma orientation: it’s one thing to stop defects from reaching a customer, but a whole different game when you can prevent those defects. The impact on process speed and capability are significant. Therefore, one question you should always ask of your black belt teams is “What can we do to prevent this mistake from happening?”
The first step in a Lean Six Sigma implementation is to eliminate the customers’ critical-to-quality issues. Mistake proofing is the most powerful tool to achieve this goal.

4/26/2010
34
Kaizen
“Kaizen” means “continuous improvement” in Japanese. The kaizen process is modeled after quality circles, the team-based continuous improvement vehicle utilized in the Toyota Production System. The secret to Kaizen is that it emphasizes creativity before capital.
Kaizen is an intensive, rapid improvement model. Here’s how it works. A cross functional team is assembled to improve a process or problem identified within a specific, limited area. The team meets full time for three to five days and works rapidly through the following phases/gates:
Training: The team receives specialized training that is specifically intended to he directly applied during the kaizen event (setup reduction methodology, defect prevention, etc.).
Discovery: The team “discovers” the kaizen project area by going on a guided tour in which the guide explains the current state. This establishes a common team understanding around basic process flow, products produced, machines used, etc.

4/26/2010
35
Analysis: The team gathers data required to assess the current situation (demand, defect history, downtime history, machine processing times, etc.).
Assessment: The team uses the data and information to assess and identify opportunities for improvement in the project area (calculating takt time and comparing it with workstation processing time, deter-mining present state scrap rate and potential causes, calculating downtime, etc.).
Brainstorming: The team uses cause-and-effect fishbones and five why’s analysis to uncover root causes of problems, then brainstorms potential solutions and prioritizes them for implementation.
Implementation: The kaizen team divides into sub-teams to implement prioritized ideas.
Standardization: The team creates standard operational procedural documentation or visual management and control systems to help sustain implemented improvements.
Results: The team documents results (e.g., 25% productivity improvement, 40% scrap reduction).
Follow-up: The team creates follow-up plans to complete implementation of solutions not completed during the kaizen event.
Parking Lot: The team parks items out of solution scope for other teams or management consideration (e.g., ideas that may require capital expenditures).
Presentation: The team prepares and delivers a presentation to local top management to communicate project area findings, improvements, and results. The presentation is also a forum for management to question changes and, more importantly, publicly recognize and thank team members for their contribution.

4/26/2010
36
Using Kaizen. Kaizen efforts are often treated as an adjunct or supplement to an ongoing larger project, a time when a black belt or a champion will select resources to attack a high-priority time trap and devote an intensive week or weekend to addressing that bottleneck. The work may be done by a team that is already working on the main project, but more often is done by a larger ad hoc team composed of non-dedicated green belt resources as well as operators who have a lot of process knowledge, the line manager, and perhaps a supplier and a customer.
Generally the black belt will define and organize a few kaizen events in support of a larger black belt project. In preparation for the kaizens, the black belt will present key data to the ad hoc team members and provide training on specific tools they will need during the event. The “standardization” phase of a kaizen event is synonymous with the Control phase of a black belt project. The black belt’s core Lean Six Sigma team translates the kaizen team improvement into standard procedures that will lead to sustained reduction in lead time and cost and improvement of quality.

4/26/2010
37
Queuing Methods for Reducing Congestion and Delay Due to Time Variation
Congestion at a workstation happens when lots of different part numbers flow through the workstation, each with its own separate batch. As an activity or workstation approaches its maximum capacity any variation in demand can cause a huge increase in wait time, as was briefly discussed at the end of Chapter 3. Congestion is usually the greatest single source of delay and is the framework on which all other sources hang. It’s like the Hollywood Freeway: the speed of travel is determined more by the number of cars on the freeway than by their type—you’ll be traveling slowly no matter whether you’re surrounded by Pintos or Corvettes.
Often congestion occurs because of variation in timing, much like the effect that variation in arrival time and check-in times had on the hotel check-in process described much earlier in the book. In that case study, though the average check-in time was five minutes, guests often had to stand in line 10 minutes or more, due to congestion at the check-in counter.
Part of the supply chain accelerator analysis described earlier is identifying exactly where in your process congestion occurs. Once identified, there are three principle techniques for reducing congestion that arises from time variation:
Pooling
Triaging
Backup capacity

4/26/2010
38
Pooling. In the hotel check-in example described earlier in the book, the hotel prepared for irregular but certain “overloads” of customers by pooling (or cross-training) its staff. Having staff who could step in as needed provided an alternate path through the process and eased congestion.
The same principle works in manufacturing. When any workstation receives a statistical variation peak (an excess amount of work), the peak load can be routed to another workstation. This simple step cuts delay time approximately in half with no additional investment in staff or equipment! This “something for nothing” sounds too good to be true, but it works easily in practice.
Triaging. Another way to attack time variation is to triage the work by sorting jobs into three categories: “easy and small problems,”“real problems,” and “catastrophic problems.” Then develop different routings, strategies, or resources to deal with each. Triaging reroutes the terrible jobs so they do not bottle up the easy jobs and create huge variation in overall lead time and inventory and wreak havoc down-stream. For example, you could pool two workstations to take on the easy and small problem jobs and then reroute the harder jobs.
Triaging typically results in another 15% to 20% reduction in overall wait time, and at times it can be much more.

4/26/2010
39
Backup Capacity. Pooling and triaging are very effective in knocking the peaks off the delay due to demand variations. But what happens if the excess demand for a given product is sustained? You’ve already used up all the possible alternate sources of capacity through pooling and intelligently quarantined the troublesome products by triaging. You could use overtime for short periods of time to cover a peak, but this is an expensive and non-sustainable approach.
To deal with a sustained peak, the best approach is to cross-train operators who work on all of your stations that have high demand fluctuations. By juggling scheduled downtimes (such as lunch, coffee breaks, etc.) among your various lines, you can then staff these lines, which can add 20% more capacity. Finally, if the demand is truly sustained, you will have to add equipment.
Pre-Testing the Solutions. If you have access to supply chain accelerator software, you can play “what if” games with ideas for reducing congestion. In effect, you can measure the effectiveness of each method before spending any resources or capital expenditures or disrupting work.

4/26/2010
40
The Four-Step Rapid Setup Method
The four-step rapid setup method was initially developed to reduce the setup time of large presses used to stamp out parts like fenders in auto plants. The method is of general application and has been used in everything from time manufacturing to medical devices. The generality and power of the method is amazing, given the simplicity of the process.
Step 1 : Separate Internal and External Setup. Observe the setup process and categorize each step as either internal setup or external setup work by asking the question, “Can this step he accomplished only with the machine shut down, or can we do this while the machine is working on the previous batch?”
Internal setup is work that can be accomplished only while the machine is shut down.
External setup is work that can be done while a machine is operating. For example, if the operator has to find material, a work order, the correct tool, or fasteners, etc., to begin the setup, each of these steps could be done while the machine is operating—e.g., material could be brought up by another worker whose machine is in the middle of a run, tools can be brought by the tool crib, etc.
By finding alternative ways to accomplish external setup, you can often reduce setup time by 30% to 50%. In one case the overall setup time of a punch press was reduced by 60% just by cataloguing, classifying, racking, and precleaning of the die.

4/26/2010
41
Step 2. Convert Internal Setup to External Setup. Some steps will currently require the machine to be shut down before a step can be accomplished. For example, in an automatic molding machine, a new die may have to be heated before it can be operated. This heating step can be converted to external setup by preheating the die and using a system of rails to safely load it into the machine.
As with Step 1, the work of converting internal to external setup starts with a simple question: “Why do we have to shut the machine down to take this step?”
Just asking this question of the team inevitably raises many ideas that are supported by a lot of tacit knowledge team members have encountered. Typically, the ideas require only a modest amount of capital. The amount of setup reduction accomplished by this step can vary from 10% to 60%, depending on the machine.
Step 3. Streamline Internal Setup. By now, you will have organized the flow of material and information to the machine, but the machine is still shut down for what appears to be an irreducible period for internal setup steps.
For example, if you are changing the dies of a press, you clearly have to stop the machine. However, you can still reduce the time needed by streamlining the process. Dies are often fastened with bolts through holes that are internal to the die. Attaching these bolts requires the operator to stand in the press window and make the connections, which takes 20 turns to remove the bolts of the current die, time to switch dies, then another 20 turns to fasten the new die.
You can streamline the process by welding “ears” on the die and cutting a pear-shaped hole in the ears. The large part of the hole is large enough to clear the head of the bolt. The die is then slid forward until the bolt is against the small end of the pear-shaped hole and the motor is energized, which tightens the die.

4/26/2010
42
Step 4. Eliminate Adjustments. The final step in this method is another example of using intelligence instead of money to solve problems. The setup is not complete until the output of the process is “in spec” and under statistical control (meaning the amount of variation is within predictable limits). After a machine or process is set up, the first few parts or feet of output is not “in spec” and the operator needs to make adjustments to the machine. Whether or not you count such adjustments as part of setup time or not, it is still time when the process is not producing “in spec, in control” parts that can be sent to the downstream process or customer.
Part of a Lean Six Sigma mindset is looking at non-value-added work and asking why it is necessary. In this case it means questioning whether adjustments really are necessary to produce high-quality output.
The reason that people need to make adjustments is that they don’t know enough about the process to “set” the machine correctly so the first part is good. That may sound like an impossible goal, but method, example, intellect, energy, and teamwork conquer all!
Total Productive Maintenance (TPM)
Did you know that roughly 35% of machine capacity is lost to downtime? As you might expect, reducing downtime speeds up process speed. Once again, the First Law can be applied and it shows that reducing machine downtime from 20% to 2% will reduce delay time from 70 hours to 29 hours!
An even more insidious result of machine downtime is that it effectively makes the machines run at a higher percentage of available capacity. A machine that is running at 65% of capacity is really running near 100% of available capacity—because the other 35% of the time is downtime! All of the effects that variation in arrivals and service times has on total lead time are enormously amplified if a workstation is operating near capacity.

4/26/2010
43
Machine downtime not only impacts the output of the station itself, but if it is severe enough it may cause a significant variation in the arrival of parts at the downstream workstations, leading to congestion and delay. This problem can cascade throughout the whole factory. As interim measures, we may he able to reduce variation of output as much as possible, understand the maximum capacity, and provide downstream buffers of material to cover times when capacity is exceeded. Ultimately, however, the goal is to remove the need for such buffer inventories by making the machine more reliable.
Machine downtime can have a bad impact on quality, as a degrading machine is more likely to produce out-of-control parts. Moreover, machine downtime robs a plant of productive capacity and leads to the procurement of “newer, better, more reliable” machines. Estimates show that as much as 50% of the capital expenditures budget is wasted in unnecessary expenditures that freeze capital.
What can be accomplished with Total Productive Maintenance ( TPM)? Some factories have reduced the number of unscheduled downtime events from 300 per month to fewer than 10.
Together, steps taken to reduce machine downtime act on all of Lean Six Sigma’s shareholder value drivers, increasing productivity and profit while decreasing invested capital.
Implementing TPM. TPM implementation occurs through a wide variety of specialized tools, including some standard Lean Six Sigma tools and some that are unique to TPM.
After training on the tools and TPM principles, the next step is to take curative actions to stop the breakdowns that currently occur. As with all Lean Six Sigma actions, this starts with data on just when and which breakdowns occur and investigations into why. Breakdowns come in two flavors:
Breakdowns of extended duration (> five minutes) Micro-stops (< five minutes)

4/26/2010
44
The long breakdowns get significant attention, but generally account for less total downtime than do micro-stops, which go virtually unnoticed. TPM reverses that emphasis.
The last component of TMP is prevention, methods that make it unlikely that breakdowns will occur in the first place. These methods include techniques like the 5S method: sort, set in order, shine, standardize, and sustain.
http://www.lean.state.mn.us/images/5S_circle.gif

4/26/2010
45
Design of Experiments
In many improvement projects, the true causes of the problem jump out when a team uses simple methods like creating process maps and charting data. But in other situations, it’s not totally clear what caused the problem or there are so many process parameters to consider that it appears nearly impossible to find the right combination to provide optimum performance.
The tool of choice in these situations is Design of Experiments (DOE).
To understand what DOE is and how it can help, let’s consider a simple simulation used in training courses: trying to improve gas mileage. In this simulation, students are told that initial data suggests that five factors (or inputs)—speed, octane rating, tire pressure, driver habits, and whether the radio is on—are mostly like to have the biggest impact on gas mileage (the output, or response).
The class is charged with improving the current process and finding an optimal combination of the five factors under consideration and is given a reasonable budget for performing experiments to find this optimal combination. (The budget emphasizes that, in the real world, resources are always limited—and ultimately drives home the point that there’s only so much time a team can spent attempting to solve this problem without a methodology.)

4/26/2010
46
Most classes will use one of two approaches to finding the best combination:
Trial-and-Error: People randomly manipulate all five inputs, often all at once, and hope they stumble on a combination that seems to work. This approach is time-consuming and requires quite a bit of luck to achieve an improvement.
One-Factor-at-a-Time: People who remember their school science classes commonly use this method of experimentation. It involves holding all of the input variables constant except one—so they change one input, then observe the results, reset everything, change a different input, observe the results, and so on.
What do think the odds are that either of these methods leads to the best combination?
If you guessed “close to 0,” you’re right!
Neither of these approaches can tell you which of the factors are significant and which aren’t. In this case, most people would guess that whether the radio is on or off would have little impact on mileage, but it’s seldom that obvious in real situations.
Trial-and-error is least likely to be successful, but used amazingly often, even in serious improvement efforts conducted by smart people. Think about this way: without an analysis plan, it is impossible to track the source of a change in output.
The one-factor-at-a-time approach is more organized and helpful than trial-and-error, but is much less successful than you might think. It misses the mark completely when two of the inputs work together, or interact, to affect the output. A textbook example is baking a cake, popularized by the success that Duncan Hines had with experimentation on cake mixes in the 1950s. To bake a good cake, you need to consider both oven temperature and bake time. If you tried testing oven temperature and bake time separately, you wouldn’t get an accurate result.

4/26/2010
47
A Designed Experiment. DOE is the best alternative to both trial-and- error and one-factor-at-a-time approaches. With DOE, all factors are tested simultaneously in very specific patterns.
Table 11-2 shows the design for basic experiments on the five factors associated with the gas mileage example. There are eight runs, or trials, in this experiment, each representing a different combination of the factors. Note that each factor is tested at only two settings, or levels: speed is set at either 55 mph or 65 mph, octane at 85 or 91, and so on. This restriction is a critical element of DOE. The point is that you don’t set levels for each factor randomly, but rather select specific settings you want to test.
To conduct the experiment, the factors are set at one of the combinations shown in the table and the car is operated to determine the gas mileage. Then the factors are reset to a different combination and again the output (gas mileage) is measured.

4/26/2010
48
After the factors have been tested at each of the combinations, the gas mileage for each run is entered into a statistical software package. (Actually, it’s fairly easy to do the calculations by hand, because you just need to calculate averages, but most people use software these days.) The most common output from such software is graphical images that depict the relationships between the factors and the output.
The first such image is called the main effects plot. This output for the gas mileage is shown the following figure.
Interpreting these plots is straightforward: the steeper the slope of the line, the more significant the input factor. The direction of the slope indicates whether the relationship is positive or negative. From the figure, for example, you can tell at a glance that average mileage improves with higher octane and tire pressure, but decreases at higher speeds. More specifically:
Speed has a strong, negative effect on average gas mileage. The slope is very steep and it angles downward from left to right, meaning that the higher the speed, the lower the mileage.
Both octane and tire pressure have less strong (but still significant), positive effects on mileage. The higher the octane and the higher the tire pressure, the better the average gas mileage.

4/26/2010
49
Often it is equally important to learn which of the inputs have no effect on the output variable. In this case, both driver and radio are insignificant. You can easily see this in the figure below, because both of the lines are flat. Finding insignificant factors like these in a designed experiment is a good thing, because it means you can set them at whatever level is most convenient and/or least expensive without affecting the output.
Based on the main effects plot, the best gas mileage will still be obtained driving at 55 mph, with 91 octane and 35 psi tire pressure. Driver and radio have no effect.
The analysis of the designed experiment will provide important information needed to optimize a process. The black belt can understand which inputs affect the average and the standard deviation. These can be the focus of the improvement process and additional experimentation, if necessary. It is often valuable to understand the factors that have little effect as well, as these can be significant opportunities for cost savings.

4/26/2010
50
Applications of DOE: Robust Design. Modern experimental design methods are broadly used in manufacturing, product development, marketing, and transactional applications. They are used to determine input values in an existing process to optimize results and minimize costs. DOE can also be used to define the optimum set of tests that will verify whether a new design meets spec much faster and more reliably. Common applications have grown, from scrap/rework reduction and scientific method for setting tolerances to the improvement of the capability of any process.
The machining process is often a target of black belt improvement projects, and Design of Experiments is used both to reduce defects and to increase throughput. Machine parameters significantly impact both, but often parameter settings have not been evaluated in many years or are frequently changed based on operator preferences.
The purpose of Control tools is very simple: to make sure that any gains made in process performance are maintained (until and unless new knowledge reveals an even better way to carry out the procedures). One issue the team has to think about is all the ways that knowledge of operating the process is learned by the process staff/operators: through formal documentation, training, procedures/diagrams posted at work stations, instructions encoded into software, and so on. The other key element is providing ways for the staff to monitor the process performance so they’ll know when some- thing happens that must be resolved. One of the most common tools for that purpose is Statistical Process Control (SPC).

4/26/2010
51
Statistical Process Control (SPC)
The important lesson to remember is that the power of SPC lies in applying it to the key process input variables (KPIVs) identified with the DMAIC process. A common mistake is to try to use SPC on the process output variables only. Process control will be achieved only through the key inputs. After all, uncovering these key inputs was the path to dramatic process improvement in the first place!
There are three main components of SPC:1. Creating a control chart.2. Isolating and removing special (assignable) causes of variation.3. Instituting procedures for immediate detection and correction of future
problems.
1. Creating a Control Chart. The basics of control charts were covered earlier in this chapter. Very briefly, someone working on the process has to know what data to gather and how to plot that data (e.g., by hand or through graphing software).
2. Isolating and Removing Special Causes of Variation. The key to using control charts is understanding the meaning of the control units. These lines are determined by moving out from the average approximately three standard deviations (3σ) on both sides. Finding one or more points outside the control limits is just one signal that a special cause has appeared. (There is a whole series of tests that look for more subtle patterns or signals. These tests are taught in the black belt curriculum.)
The obvious question is “So what?” Once you have a signal of a special cause, what do you do?

4/26/2010
52
To eliminate a special cause of variation, you need to investigate what is different or changed in the process—something that isn’t always evident. There are specific statistical techniques (also taught to black belts) that help them identify patterns of cause-and-effect related to when the special cause appears and when it doesn’t. Once the source is isolated, they can use standard DMAIC techniques to come up with creative ways to minimize or prevent that source of variation.
After all of the special cause variation has been removed, a process is left with only common cause variation and is said to be stable and in control. Common cause variation is predictable: it is always present in the process to some degree because of the way the process is structured- the steps followed, the equipment used, the training given to staff, etc. The only way to reduce common cause variation is to make a fundamental change in the structure of the process.
Control charts tell us if our process is stable and predictable, not if the process is acceptable to our customers. If you want to know how well the process is performing relative to customer requirements, you would need to conduct a process capability.
3. Instituting Procedures for Immediate Detection and Correction of Future Problems. By now, your process should be in control and producing output that meets customer specifications. But just because the process is operating well today, that doesn’t mean something new won’t happen tomorrow. So the last ingredient in SPC is making sure that immediate action is taken should the process drift in any way or a new special cause appear. The elements of this step include the following: Train operators to use control charts (including who will be
responsible for collecting and charting the data). Provide clear instructions on how to respond if a special cause
appears, including both ... Damage control: How can any poor output be prevented from
affecting the next process and the ultimate customer? Remedial actions: Who should be notified? Can the process be
stopped? Who will be responsible for tracking down and eliminating the special cause?
Provide clear instructions on when and how to update process documentation to make sure new corrective actions are preserved.

4/26/2010
53
There is one way in which these advanced Lean Six Sigma tools are identical to the basic tools described in the previous chapter: their effectiveness is limited only by the intellect, imagination, and effectiveness of the team that is attacking the problem. No matter how daunting the task, a solution is possible.
Some of these tools may appear too difficult or time-consuming to apply. But remember: you are going to apply them judiciously on the leading quality problems and time traps—representing the biggest opportunities for improving shareholder value. You also don’t need to use them on every process, every step, or every workstation in the factory; rather, as you know from the Second Law of Lean Six Sigma, you’ll need to use them only on less than 20% of the workstations that are contributing to 80% of your problems. In addition, the black belts and their teams will be trained in these tools; they will receive expert coaching on their first few projects. The Lean Six Sigma culture leaves nothing to chance.
1. Michael George, Lean Six Sigma : Combining Six Sigma Quality with Lean Production Speed, McGraw-Hill, first edition , 2002, ISBN-13: 978-0130176158.
2. http://upload.wikimedia.org/wikipedia/commons/a/a2/Sir_Arthur_Conan_Doyle_1890.jpg