IMPACTS OF HARNESSING TRAFFIC ENERGY ON VEHICLES AND …
73
IMPACTS OF HARNESSING TRAFFIC ENERGY ON VEHICLES AND USERS LIEW HONG THYE A project report submitted in partial fulfilment of the requirements for the award of Bachelor of Engineering (Hons.) Electrical and Electronic Engineering Faculty of Engineering and Science Universiti Tunku Abdul Rahman September 2016
Transcript of IMPACTS OF HARNESSING TRAFFIC ENERGY ON VEHICLES AND …

IMPACTS OF HARNESSING TRAFFIC ENERGY ON VEHICLES AND
USERS
LIEW HONG THYE
A project report submitted in partial fulfilment of the
requirements for the award of Bachelor of Engineering
(Hons.) Electrical and Electronic Engineering
Faculty of Engineering and Science
Universiti Tunku Abdul Rahman
September 2016

ii
DECLARATION
I hereby declare that this project report is based on my original work except for
citations and quotations which have been duly acknowledged. I also declare that it
has not been previously and concurrently submitted for any other degree or award at
UTAR or other institutions.
Signature :
Name : Liew Hong Thye
ID No. : 12UEB06617
Date :

iii
APPROVAL FOR SUBMISSION
I certify that this project report entitled “IMPACTS OF HARNESSING TRAFFIC
ENERGY ON VEHICLES AND USERS” was prepared by LIEW HONG THYE
has met the required standard for submission in partial fulfilment of the requirements
for the award of Bachelor of Engineering (Hons.) Electrical and Electronic
Engineering at Universiti Tunku Abdul Rahman.
Approved by,
Signature :
Supervisor : Dr Stella Morris
Date :

iv
The copyright of this report belongs to the author under the terms of the
copyright Act 1987 as qualified by Intellectual Property Policy of Universiti Tunku
Abdul Rahman. Due acknowledgement shall always be made of the use of any
material contained in, or derived from, this report.
© 2016, Liew Hong Thye. All right reserved.

v
Specially dedicated to
my beloved grandmother, mother and father

vi
ACKNOWLEDGEMENTS
I would like to express my deepest gratitude to everyone who had contributed to the
successful completion of this project. Apart from that, I would also like to thank my
research supervisor, Dr. Stella Morris and co-supervisor, Dr Chew Kuew Wai for
their invaluable advices, useful guidance and their enormous patience throughout the
period of the research.
Besides that, I would like to express my deepest gratitude to my parents and
friends who had helped and given me encouragement to complete this project. Apart
from that, I want to express my thanks to Universiti Tunku Abdul Rahman (UTAR)
for providing sufficient and advanced facilities for me to complete this project.
Furthermore, I also would like to thank my fellow teammate, Goh Jin Long who
have been very helpful and offering helps and attention for completing this project.
Furthermore, I would also like to thank the seniors (Liew Shin Yin and Mark Lau for
their guidance during my completion of the project.

vii
IMPACTS OF HARNESSING TRAFFIC ENERGY ON VEHICLES AND
USERS
ABSTRACT
The reasons of carrying out this research are to investigate the impacts of traffic
energy harnessing generating system on the vehicles and users and to find out
whether is it practical to implement the traffic energy harnessing generating system
into our daily life. One of the traffic energy harnessing systems is the smart speed
breaker. The smart speed breakers will cause more discomfort to the vehicles’
occupant as compared to conventional speed breakers because they are more
focusing on obtaining the mechanical energy, which is the vibration to generate the
electrical energy. Apart from that, the smart speed breaker also will implant more
forces on the suspension of the vehicle. The smart speed breaker tries to obtain as
much force as possible from the vehicle to produce higher electric energy and by
Newton’s third law there will be more force on the car suspension system as well.
Besides that, the smart speed breaker also will cause higher fuel consumption as
compare to the convention speed breaker. The smart speed breaker tries to obtain
more force from the vehicle and this in turn increase the torque required by the
vehicle to pass through the speed breaker and this in turn increase the fuel
consumption of the vehicle. Furthermore, the vehicles’ tyre wear rate is also higher
when going through the smart speed breaker as the smart speed breaker emphasizes
more on friction to obtain more force from the vehicle. As a conclusion, smart speed
breakers did indeed cause negative impacts. The negative impact on the
comfortability level of vehicle occupants is huge while the impacts on the fuel
consumption rate and tyre wear rate are almost negligible. By implementing some
recommendations such as undergoing the experiment practically, results that are
more accurate can be obtained.

viii
TABLE OF CONTENTS
DECLARATION ii
APPROVAL FOR SUBMISSION iii
ACKNOWLEDGEMENTS vi
ABSTRACT vii
TABLE OF CONTENTS viii
LIST OF TABLES xi
LIST OF FIGURES xii
LIST OF SYMBOLS / ABBREVIATIONS xiv
LIST OF APPENDICES xvi
CHAPTER
1 INTRODUCTION 1
1.1 Background 1
1.2 Problem Statement 3
1.3 Aims and Objectives 3
1.4 Structure of the Research Report 4
2 LITERATURE REVIEW 6
2.1 Introduction 6
2.2 Generation of Electricity with Use of Speed Breaker 6
2.2.1 Roller Mechanism Speed Breaker 7
2.2.2 Crank Shaft Speed Breaker 7
2.2.3 Rack and Pinion Speed Breaker 8
2.3 Vehicular Discomfort 9
2.4 Suspension Analysis 10
ix
2.5 Effect of Road Geometry on Fuel Consumption 11
2.6 Impact of Pavement Roughness on Tire Wear Costs 12
2.7 Conclusion 13
3 METHODOLOGY 14
3.1 Introduction 14
3.2 Project Pathway 15
3.3 Modelling of Vehicles’ Suspension System 16
3.4 Suspension Analysis 17
3.5 Vehicular Discomfort 17
3.6 Fuel Consumption 18
3.7 Tyre Wear Rate 19
3.8 Conclusion 22
4 RESULTS AND DISCUSSION 23
4.1 Introduction 23
4.2 Suspension Analysis 24
4.2.1 Simulation Results 24
4.2.2 Discussion on The Suspension Graphs 27
4.3 Vehicular Discomfort 29
4.3.1 Calculation Results for Vehicular Discomfort 29
4.3.2 Discussion for Vehicular Discomfort 33
4.4 Fuel Consumption 34
4.4.1 Calculation Results for Fuel Consumption 34
4.4.2 Discussion for Fuel Consumption 38
4.5 Tyre Wear Rate 39
4.5.1 Calculation Results for Tyre Wear Rate 39
4.5.2 Discussion for Fuel Consumption 45
4.6 Conclusion 46
5 CONCLUSION AND RECOMMENDATIONS 47
5.1 Introduction 47
5.2 Conclusion 47

x
5.3 Recommendations 48
REFERENCES 49
APPENDICES 54

xi
LIST OF TABLES
TABLE TITLE PAGE
2.1 RMS Acceleration Correspond to Comfort Level 9
2.2 Table of Fuel Consumption Correspond to the
Road Geometry 11
2.3 Adjustment Factors for Pavement Roughness
levels for Passenger vehicles 12

xii
LIST OF FIGURES
FIGURE TITLE PAGE
1.1 Figure of World Energy Consumption 1
1.2 Figure of Electricity Generation Efficiencies 2
2.1 Figure of Speed Breaker with Roller Mechanism to
Generate Electricity 7
2.2 Figure of Speed Breaker with Crank Shaft
Mechanism to Generate Electricity 8
2.3 Figure of Speed Breaker with Rack and Pinion
Mechanism to Generate Electricity 8
2.4 Figure of Active Suspension System. 10
2.5 Bar Graph of Fuel Consumption Correspond to the
Road Geometry 12
3.1 Figure of car suspension system 16
3.2 Figure of motorcycle and its suspension system 16
4.1 Suspension Graph of Car for Conventional Speed
Breaker 24
4.2 Suspension Graph of Car for Rack and Pinion with
helical Speed Breaker 25
4.3 Suspension Graph of Car for Hydraulic Speed
Breaker 25
4.4 Suspension Graph of Motorcycle for Conventional
Speed Breaker 26
4.5 Suspension Graph of Motorcycle for Rack and
Pinion with Helical Speed Breaker 26

xiii
4.6 Suspension Graph of Motorcycle for Hydraulic
Speed Breaker 27
4.7 Suspension Graph of Car 27
4.8 Suspension Graph for Motorcycle 28
4.9 Figure of RMS Acceleration and VDV value 33
4.10 Sample Figure of Speed Breaker 35
4.11 Figure of Fuel Consumption 38
4.12 Figure of Tyre Wear Rate 45

xiv
LIST OF SYMBOLS / ABBREVIATIONS
a0,a1,a2 dimensionless model parameter
a0,a1,a2,a3 model coefficient
A tyre rolling resistance coefficient
b11,b12,b13 rolling resistance parameter
B speed-correction to rolling resistance
C air drag coefficient
CD drag coefficient
Cf front suspension damping rate
Cr rear suspension damping rate
CDmult Drag Coefficient Multiplier
Cotc tread wear rate constant (dm3/1000km)
Cs tyre stiffness (kN/rad)
Ctcte tread wear coefficient (dm3/MNm)
CR1 rolling resistance tyre factor
CR2 rolling resistance surface factor
e superelevation (m/m)
f coefficient of friction
Fa aerodynamic force (N)
Fg gradient force (N)
Fr rolling resistance force (N)
g gravitational constant (9.81 ms-2)
K friction factor of engine (kJ/revL)
KCr2 calibration factor
L engine displacement (L)
LHV the factor lowers heating value of the fuel
m mass of vehicle
N number of data points
N speed of engine (rps)

xv
P power output of engine (kW)
Pacc power for accessories (kW)
Pb brake power (kW)
R curvature radius (m)
RMS root mean square
VDV vibration dose value
v velocity, ms-1
a acceleration, ms-2
fs frequency, Hz
efficiency of engine
t transmission efficiency
μ coefficient of friction of different materials
ϕ fuel/air ratio
ρ mass air density (kg/m3)
CONFAC congestion modification factor
CTCON increase of tyre consumption due to congestion
dFUEL increase of fuel consumption due to congestion
DEF Benklemen Beam rebound deflection (mm)
NT new tyre (%/km)
F friction force (N)
FCR fuel consumption rate
IRI international roughness index (m/km)
MODFAC tyre life modification factor
mph miles per hour
NW number of wheels
TWR Tyre Wear Rate (%/km)
Tdsp texture depth using sand patch (mm)
TYREFA tyre type modification factor
VEHFAC vehicle specification modification factor

xvi
LIST OF APPENDICES
APPENDIX TITLE PAGE
A Table of RMS Acceleration Correspond to
Comfort Level 52
B Table of Parameters Used for Validation of
Vehicle 53
C Table of Parameters Used for Validation of
Vehicle 54

CHAPTER 1
1 INTRODUCTION
1.1 Background
Nowadays, the energy consumption is increasing dramatically. Day by day, the
energy required to be used by humanity increases due to the advanced in technology,
which uses massive amount of energy such as air conditioner, refrigerator, water
heater and others. The amount of people using those high energy-consuming
technologies is always increasing thus the energy consumption also increase.
Figure 1.1: Figure of World Energy Consumption
There are many different types of energy sources such as oil, coal, natural gas,
hydro, nuclear and others. However, most of the main energy sources of the world

2
are all non-renewable such as oil, coal and natural gas. They are all obtained from
fossil fuels, which only formed after millions of years through anaerobic
decomposition. This means that they will be a time that all of the resources will be
exhausted and this arise major issue of one day there will be no more resources to
produce the energy required.
Thus, to prevent and overcome this issue, many researches on renewable
energy such as hydro, solar, geothermal, biomass and others are carried out in the
present. Although many researches have been carried out on the renewable energy,
there are other concerns that the efficiency of renewable energy generation is not
high thus it may not be able to supply sufficient energy if the fossil fuels resources
run out.
Figure 1.2: Figure of Electricity Generation Efficiencies
Therefore, more researches are carried out to find more ways to provide
energy for humanity. This is where research about harnessing traffic energy comes in.
The idea of harnessing traffic energy is by using the kinetic energy from the vehicles

3
travelling through the traffic to generate electricity. Generation of road traffic aims to
convert the force exerted by the moving vehicles on the road into useable electrical
energy. There are some methods proposed to harness the traffic energy such as smart
road and smart speed breaker. For smart road, the travelling vehicle will produce
vibration, which is the mechanical energy to the piezoelectric surface of the road.
The piezoelectric effect will then convert the mechanical strain into electrical energy.
Both the smart road and smart speed breaker used the same concept of converting
mechanical energy produced by kinetic energy of travelling vehicle into electrical
energy.
1.2 Problem Statement
There are many researches on the ways to generate energy from the travelling vehicle
on the road. However, there are not many researches on the impacts of generating the
energy from travelling vehicle. This is extremely important since even if the
generation of energy is very high or very efficiency, it is not practical to implement it
in our daily life if it brings many disadvantages. Most of the researches on the
generation of energy from harnessing the traffic energy tend to hide or do not expose
much of the disadvantages of the system. Thus, it is hard to find out whether the
generation of energy system they proposed is practically implementable or the other
way round.
1.3 Aims and Objectives
The aim of carrying out this research is to investigate the impacts of those traffic
energy harnessing generating systems on the vehicles and users.
4
The objectives of carrying out this research are:
1) Find out the possible impacts of traffic energy harnessing generating system
on vehicles and users.
2) Find out whether is it practical to implement the traffic energy harnessing
generating system into our daily life.
3) Investigate the impact of traffic energy harnessing generating system on
suspension system of the vehicles.
4) Investigate the impact of traffic energy harnessing generating system on the
comfortable rate of the passengers.
5) Investigate the impact of traffic energy harnessing generating system on the
fuel consumption rate of vehicle.
6) Investigate the impact of traffic energy harnessing generating system on the
tyre wear rate of vehicle.
7) Compare and find out which types of traffic energy harnessing produces less
negative impacts.
1.4 Structure of the Research Report
This research report consists of five main chapters:
1) Chapter 1 (Introduction). In this chapter, the brief background of the research,
the problem statement as of why we need to carry out this research and the
aims and objectives of this research are stated.
2) Chapter 2 (Literature review). In this chapter, some information from journals
on the types of traffic energy harnessing system and the information on the
possible impacts or ways to find the possible impacts of the traffic energy
harnessing system are discussed.
3) Chapter 3 (Methodology). In this chapter, the software used to investigate the
impacts is stated and the methods to investigate the impacts are narrated. The
equations used to investigate the impacts are also stated clearly in this chapter.

5
4) Chapter 4 (Results and Discussions). In this chapter, the results such as
graphs are covered and discussed. The calculation process is also covered in
this chapter.
5) Chapter 5 (Conclusion and Recommendations). In this chapter, the
conclusion is drawn by using the results obtained from the research. Some
recommendations are also given.

CHAPTER 2
2 LITERATURE REVIEW
2.1 Introduction
In this chapter, the first part will be explaining the mechanism of generating of
electricity using smart speed breakers while the second part will be explaining the
possible impacts of the smart speed breakers on vehicle and users. This chapter will
be talking about:
1) Generation of electricity with the use of speed breaker
1.1) Roller mechanism speed breaker
1.2) Crank shaft speed breaker
1.3) Rack and pinion speed breaker
2) Vehicular discomfort
3) Suspension analysis
4) Effect of road geometry on fuel consumption
5) Impact of pavement roughness on tyre wear costs
2.2 Generation of Electricity with Use of Speed Breaker
By using the typical change of energy, the kinetic energy of a car pass through a
speed breaker can be converted into electrical energy.

7
2.2.1 Roller Mechanism Speed Breaker
One type of design for generation of electricity by using speed breaker is the roller
mechanism design. (Piyush Bhagdikar, May, 2014). The spinning motion of the
rollers connected to the generator when a vehicle passes through generates the
mechanical energy required to be converted into electrical energy. The chain drive
mechanism is used to transfer the mechanical motion to the generator for generation
of electricity.
Figure 2.1: Figure of Speed Breaker with Roller Mechanism to Generate
Electricity
2.2.2 Crank Shaft Speed Breaker
Apart from that, another type of design for generation of electricity by using speed
breaker is the crank shaft design. (A.Padma Rao, February, 2014). When a vehicle
passes through the speed breaker, the speed breaker will be forced down, a lever will
be cranked to fit into the ratchet-wheel type mechanism, and that will rotate the
geared shaft, which is loaded with designed recoil springs. After that, the output of
the shaft of the speed breaker is then coupled to a dynamo. Through the dynamo, the
kinetic energy will then be converted into electrical energy.

8
Figure 2.2: Figure of Speed Breaker with Crank Shaft Mechanism to Generate
Electricity
2.2.3 Rack and Pinion Speed Breaker
Besides that, by using rack and pinion mechanism, when the vehicles travel through
the speed breaker, the speed breaker will be compressed with the help of spring and
the rack. When the teeth of the rack are connected to the gear, the up and down
motion of rack will be converted into the rotary or spinning motion of gears which
will then produce the mechanical energy required to generate electrical energy.
(K.Ravivarma, June, 2013).
Figure 2.3: Figure of Speed Breaker with Rack and Pinion Mechanism to
Generate Electricity

9
2.3 Vehicular Discomfort
By using different types of vehicle such as motorcycle, car and bus to go over a
speed breaker, the comfortable rate of the driver and the passenger can be known.
(Lima E.A, 2015). The models were simplified to facilitate the simulation. A
constant initial speed and gravitational acceleration was used on the model so that the
dynamic analysis can be performed. The whole simulations were carried out with the
same conditions on the distance from the speed breaker, velocity of the vehicle and
simulation time to ensure consistency and accuracy on the comparison of the results.
Various methods can be used to find out about the comfort level of the driver and
passenger. One of it is the RMS acceleration value. A table to is used to compare the
calculated value of the RMS acceleration value to find out the comfort level of the
driver and passenger.
Table 2.1: RMS Acceleration Correspond to Comfort Level
RMS Acceleration (ms-2) Comfort Level
Lower than 0.315 Comfortable
Between 0.315 and 0.63 A bit uncomfortable
Between 0.5 and 1 Middling uncomfortable
Between 0.8 and 1.6 Uncomfortable
Between 1.25 and 2.5 Highly uncomfortable
Higher than 2 Extremely uncomfortable
Besides, the crest factor can also be used as a method to know the comfort
level of the driver and passenger. Crest factor is the total damage of the vehicle
occupants suffers due to the vibration of vehicle. Thus, the crest factor is preferred to
be as low as possible to ensure the vehicle occupants are at a comfortable level. The
VDV (vibration dose value) can also be used to know the discomfort rate of vehicle
occupants. The magnitude of VDV value of 8.5ms-1.75 will cause medium discomfort
to occupants of the vehicle while the magnitude of VDV value of of 15ms-1.75 will
cause severe discomfort to the occupants of the vehicle. (Castro, 2014). The results

10
showed that the heavier vehicles such as buses and trucks have VDV values around
8.5ms-1.75, which cause medium discomfort to the occupant of the vehicle.
2.4 Suspension Analysis
A transient analysis can be applied to find out the dynamic interaction between a
vehicle and speed bump. Suspension designs have three major criteria, which are the
road handling, load carrying and passenger comfort. (Abdolvahab, 2012). Same
vehicle with the same suspension system pass through different types of road profiles
such as normal road, road with bump and others. The suspension analysis is obtained
and by comparing the suspension analysis which road or type of suspension will
provide best comfort of the vehicle occupants can be concluded.
Figure 2.4: Figure of Active Suspension System.
Mathematical model of a quarter car was designed and the simulation is
carried out by using MATLAB SIMULINK software. The performance of the
vehicle suspension system in terms of ride quality of the vehicle and vehicle handling
were observed. The parameters that observed are suspension displacement, wheel
deflection and the acceleration of the car body. Different types of road conditions are

11
also taken into account. The performance of both the passive and active vehicle
suspension system is compared and it was proven that the active vehicle suspension
system performs better. IF the improving of the occupant’s ride comfort and better
road handling is desired, active vehicle suspension system with LQR controller
design can be used.
2.5 Effect of Road Geometry on Fuel Consumption
There are strong relationships between fuel consumption of vehicles and the other
independent variables such as gradient of the road, curvature of the road and the
roughness of the road surface. (Gunnar Svenson, 2014). The collection of data of fuel
consumption, vehicle speed, road geometry and surface roughness enables the
comparison of fuel consumption between smooth road and bump road. The influence
of road characteristics on fuel consumption on a truck is observed. The average fuel
consumption of a truck is around 91.8 litres/100km while the fuel consumption of a
truck while travelling bump roads are 162.8 litres/100km. Thus, the increases in fuel
consumption where vehicle travels on the bumpy road can be explained by greater
curvature and rougher road surface.
Table 2.2: Table of Fuel Consumption Correspond to the Road Geometry
Road Class Fuel
consumption
per
litters/100km
Velocity,
ms-1
Gradient Curvature IR1,
mm/m
No of
Observation
1-4 71.3 17.7 0.2 1.5 2.1 201
5 81.1 13.2 -0.1 3.7 3.6 150
7 93.3 10.1 0 2.8 6.2 39
8 104.1 11.2 0.1 3.1 5.3 123
9 162.8 7.6 0.3 4.9 7.4 38

12
Figure 2.5: Bar Graph of Fuel Consumption Correspond to the Road Geometry
2.6 Impact of Pavement Roughness on Tire Wear Costs
Cost adjustment factors increased with the decreasing of SI (serviceability index)
which indicates that rougher pavements will result in a higher tire expenses related to
tire wear. (Mary M.Robbins, May, 2015). Costs associated with tire wear,
maintenance and repair and depreciation were found to be influenced by pavement
roughness. Although the researches in areas of tire weariness are still limited, some
statistical data proves tire wears off faster while vehicle travels on bumpy roads.
Various adjustment factors for various levels of pavement roughness are defined by
PSI and IRI.
Table 2.3: Adjustment Factors for Pavement Roughness levels for Passenger
vehicles
PSI IRI (in/mile) IRI (m/km or
mm/m)
Adjustment
multiplier
≤ 2.0 170 2.7 1.25
2.5 140 2.2 1.15
3.0 105 1.7 1.05
≥ 3.5 80 1.2 1.00

13
It has been concluded from statistical data that the rougher the surface of the
road, the higher the tire wear costs.
2.7 Conclusion
In the present, there are many studies on the design of traffic energy harvester based
speed breakers such as rack and pinion mechanism based speed breaker, roller
mechanism based speed breaker and hydraulic mechanism based speed breaker but
no research is done on the impacts of harnessing traffic energy by using these traffic
energy harvester speed breakers. Possible impacts of the traffic energy harvester
based speed breakers such as comfortability level of vehicle occupants, fuel
consumption rate and tyre wear rate are listed down and the methods to investigate
them are researched.

14
CHAPTER 3
3 METHODOLOGY
3.1 Introduction
This Chapter 3, which is the methodology section, is to clarify the methods that
going to be used to study the possible impacts of harnessing traffic energy on
vehicles and users.
This methodology will focus on the possible impacts of vehicular discomfort,
suspension analysis, fuel consumption of the vehicles and the tyre wear rate of the
vehicles. Three different types of vehicles, which are motorcycle, car and truck, will
be used to find out the impacts on them. The analysis of the vehicles pass through
normal conventional speed breaker will be compared to the analysis of the vehicles
pass through different types of smart speed breakers such as rack and pinion, air
compressor mechanism.
This chapter covers:
1) Project pathway
2) Modelling of vehicles’ suspension system
3) Suspension analysis
4) Vehicular discomfort
5) Fuel consumption
6) Tyre wear rate

15
3.2 Project Pathway
Start
Literature Review
1) Find out how smart speed breaker works
2) Find out possible impacts of harnessing traffic
energy using speed breaker
3) Find out the useful equations to be used in finding
the impacts of harnessing traffic energy using
speed breaker
Methodology
1) Find possible software to use for simulation
2) Modelling of vehicles suspension system
3) Combine the modelling of vehicles with modelling
of speed breakers
4) Simulate the results
Results and Discussion
1) Obtain the graph from Solidworks and analyze it
2) Substitute some value obtain from simulation into
equations
3) Evaluate and compare the impacts.
4) Discuss on the results obtained.
Conclusion
1) Conclude the results of the research
2) Recommend which speed breaker is better

16
3.3 Modelling of Vehicles’ Suspension System
The modelling of all two types of vehicles’ suspension system is done in a software
called SOLIDWORKS.
Figure 3.1: Figure of car suspension system
Figure 3.2: Figure of motorcycle and its suspension system

17
3.4 Suspension Analysis
The suspension analysis is going to be done using SOLIDWORKS. By entering the
parameter of the vehicle suspension system and the parameter of the conventional
and smart speed breaker, the graph for the movement of the suspension system
should be able to be generated. After that, the graphs of different types of vehicles
passing through different types of smart speed breaker will be compared and the
impact can be studied.
3.5 Vehicular Discomfort
In order to find out the vehicular discomfort, we will need to find the vertical
acceleration of the vehicles while passing through the speed breaker. From the graph
simulated from the suspension analysis, the vertical acceleration of the vehicles can
be found out using the formula
𝑎 =𝑑𝑣
𝑑𝑡𝑚𝑠−2 (3.1)
𝑎 is the vertical acceleration of the vehicle (ms-2)
There are three types of vehicles used, which are motorcycle, car and truck.
However, all of the initial conditions of the vehicles are assume to be constant. The
differences between all the three vehicles are the mass of the vehicle and the force
exerted on the speed breaker. The RMS (root mean square) vertical acceleration is
calculated using the formula
𝑎𝑅𝑀𝑆 = (1
𝑁∑ 𝑎2𝑁
𝑖=1 )1
2 (3.2)
𝑁 is the number of data points
The RMS acceleration is then used to determine the comfort level. The RMS
acceleration is desired to be as lower as possible to obtain the best comfortable rate.
Thus, if the calculated RMS acceleration is high then it is not comfortable.

18
The Vibration Dose Value (VDV) is also calculated using the formula
𝑉𝐷𝑉 = (1
𝑓𝑠∑ 𝑎4𝑁
𝑖=1 )1
4 (3.3)
𝑓𝑠 is the frequency of acquisition (Hz)
The VDV is then used to determine the comfort level. The VDV is also desired to be
as lower as possible. The VDV value of 8.5 will start to trigger discomfort while the
VDV value of 15 will trigger severe discomfort.
3.6 Fuel Consumption
In order to find out the impact of harnessing traffic energy on fuel consumption, the
fuel consumption rate (FCR) is calculated using the formula
𝐹𝐶𝑅 =𝛷[𝐾𝑁𝐿 +
(𝑃𝑏Ƞ𝑡
+ 𝑃𝑎𝑐𝑐)
Ƞ]
𝐿𝐻𝑉 (3.4)
Φ is the fuel to air ratio
K is the friction factor of engine (kJ/revL)
N is the speed of engine (rps)
Ƞ is the efficiency of engine
L is engine displacement
Pb is the braking power (kW)
Ƞt is the transmission efficiency of the engine
Pacc is the power for accessories (kW)
LHV is the factor lower heating value of the fuel
The braking power Pb is calculated using the formula
𝑃𝑏 = 𝐴𝑣 + 𝐵𝑣2 + 𝐶𝑣3 + 𝑚𝑣 (𝑎 + 𝑔 × 𝑔𝑟𝑎𝑑𝑖𝑒𝑛𝑡) (3.5)

19
A is the tyre rolling resistance coefficient
B is the speed-correction to rolling resistance
C is the air drag coefficient
v is the vehicle speed (ms-1)
m is the mass of vehicle (tonne)
a is the vehicle acceleration (ms-2)
g is the acceleration due to gravity (ms-2)
The acceleration of the vehicle is calculated using equation derived from Newton’s
third law.
𝐹 = 𝑚𝑎 − 𝜇(𝑚𝑔) (3.6)
m is the mass of vehicle (tonne)
a is the vehicle acceleration (ms-2)
g is the acceleration due to gravity (ms-2)
𝜇 is the coefficient of friction
3.7 Tyre Wear Rate
The tyre wear rate can be calculated by using the formula
𝑇𝑊𝑅 = 𝑁𝑊 ×𝑁𝑇
𝑀𝑂𝐷𝐹𝐴𝐶 (3.7)
TWR is the tyre wear rate (% / km)
NW is the number of wheels
NT is new tyre (% / km)
MODFAC is the tyre life modification factor
𝑁𝑇 = 𝑇𝑜𝑡𝑎𝑙 𝑐ℎ𝑎𝑛𝑔𝑒 𝑖𝑛 𝑇𝑟𝑒𝑎𝑑 𝑊𝑒𝑎𝑟
10 ×𝑉𝑜𝑙𝑢𝑚𝑒 𝑜𝑓 𝑇𝑦𝑟𝑒 (3.8)
𝑇𝑜𝑡𝑎𝑙 𝑐ℎ𝑎𝑛𝑔𝑒 𝑖𝑛 𝑇𝑟𝑒𝑎𝑑 𝑊𝑒𝑎𝑟 = 𝐶𝑜𝑡𝑐 + 𝐶𝑡𝑐𝑡𝑒 × 𝑇𝑦𝑟𝑒 𝐸𝑛𝑒𝑟𝑔𝑦 (3.9)
Cotc is the Tread Wear Rate Constant (dm3/1000km)

20
Ctcte is the Tread Wear Coefficient (dm3/MNm)
𝑇𝑦𝑟𝑒 𝐸𝑛𝑒𝑟𝑔𝑦 = (𝐶𝑖𝑟𝑐𝑢𝑚𝑓𝑒𝑟𝑒𝑛𝑡𝑖𝑜𝑙 𝐹𝑜𝑟𝑐𝑒 𝑜𝑛 𝑇𝑦𝑟𝑒)2+ (𝐿𝑎𝑡𝑒𝑟𝑎𝑙 𝐹𝑜𝑟𝑐𝑒 𝑜𝑛 𝑇𝑦𝑟𝑒)2
𝑁𝑜𝑟𝑚𝑎𝑙 𝐹𝑜𝑟𝑐𝑒 𝑜𝑛 𝑇𝑦𝑟𝑒 (3.10)
𝐶𝑖𝑟𝑐𝑢𝑚𝑓𝑒𝑟𝑒𝑛𝑡𝑖𝑜𝑙 𝐹𝑜𝑟𝑐𝑒 𝑜𝑛 𝑇𝑦𝑟𝑒 = (1+𝐶𝑇𝐶𝑂𝑁 ×𝑑𝐹𝑈𝐸𝐿)×(𝐹𝑎+ 𝐹𝑟+ 𝐹𝑔)
𝑁𝑊 (3.11)
CTCON is the increase of tyre consumption due to congestion
dFUEL is the increase of fuel consumption due to congestion
Fa is aerodynamic forces (N)
Fr is the rolling resistance forces (N)
Fg is the gradient forces (N)
𝐹𝑎 = 0.5 × 𝜌 × 𝐶𝐷𝑚𝑢𝑙𝑡 × 𝐶𝐷 × 𝐹𝑟𝑜𝑛𝑡 𝑎𝑟𝑒𝑎 𝑜𝑓 𝑣𝑒ℎ𝑖𝑐𝑙𝑒 × 𝑣2 (3.12)
𝜌 is the air mass density (kgm-3)
CDmult is the drag coefficient multiplier
CD is drag coefficient
v is the vehicle speed (ms-1)
𝐹𝑔 = 𝑚 × 𝐺𝑟𝑎𝑑𝑖𝑒𝑛𝑡 × 𝑔 (3.13)
𝐹𝑟 = 𝐶𝑅2 × (𝑏11 × 𝑁𝑊 + 𝐶𝑅1(𝑏12 × 𝑚 + 𝑏13 × 𝑣2)) (3.14)
CR1 is the rolling resistance tyre factor
b11, b12, b13 are the rolling resistance parameter
CR2 is the rolling resistance surface factor
𝑏11 = 37 × 𝑊ℎ𝑒𝑒𝑙 𝐷𝑖𝑎𝑚𝑒𝑡𝑒𝑟 (3.15)
𝑏12 =0.064
𝑊ℎ𝑒𝑒𝑙 𝐷𝑖𝑎𝑚𝑒𝑡𝑒𝑟 (3.16)
𝑏13 = 0.012 ×𝑁𝑊
(𝑊ℎ𝑒𝑒𝑙 𝐷𝑖𝑎𝑚𝑒𝑡𝑒𝑟)2 (3.17)

21
𝐶𝑅2 = 𝐾𝐶𝑟2(𝑎0 + 𝑎1 × 𝑇𝑑𝑠𝑝 + 𝑎2 × 𝐼𝑅𝐼 + 𝑎3 × 𝐷𝐸𝐹) (3.18)
KCr2 is the calibration factor
Tdsp is the texture depth using sand patch (mm)
a0, a1, a2, a3 are the model coefficient
IRI is the International Roughness Index (mkm-1)
DEF is the Benklemen Beam Rebound Deflection (mm)
𝐿𝑎𝑡𝑒𝑟𝑎𝑙 𝐹𝑜𝑟𝑐𝑒 𝑜𝑛 𝑇𝑦𝑟𝑒 =𝐹𝑐
𝑁𝑤 (3.19)
Fc is Curvature Forces (N)
𝐹𝑐 = max( 0 ,(
𝑚× 𝑣2
𝑅−𝑚 ×𝑔 ×𝑒)2
𝑁𝑊 ×𝐶𝑠 × 10−3) (3.20)
R is the curvature radius (m)
e is superelevation
Cs is tyre stiffness (kNrad-1)
𝑁𝑜𝑟𝑚𝑎𝑙 𝐹𝑜𝑟𝑐𝑒𝑠 𝑜𝑛 𝑇𝑦𝑟𝑒 = 𝑚 ×𝑔
𝑁𝑊 (3.21)
Since there are different types of smart speed breaker, there are also different
materials used to build the speed breaker thus there will be different coefficient of
friction. Thus, by obtaining the coefficient of friction of the materials, the wear rate
experienced by the vehicles’ tyre can be calculated and compared. From the
comparison, the impact of tyre wear rate can be studied.

22
3.8 Conclusion
The SOLIDWORKS software is used for the modelling of the vehicles and to
simulate the suspension analysis to obtain the velocity-time graphs. From the
velocity-time graphs, arms and VDV are calculated to investigate the impact on
comfortability level of vehicle’s occupant. Impacts of fuel consumption rate and tyre
wear rate are investigated by calculation based on the formulas.

23
CHAPTER 4
4 RESULTS AND DISCUSSION
4.1 Introduction
After finding out the methods to investigate the possible impact of the smart speed
breaker, the parameters needed are collected from trusted online sources. The vehicle
models chosen for this research are Honda Civic Dx for car and Kawasaki Ninja
650R for motorcycle. The smart speed breaker models chosen for this research are
conventional speed breaker, hydraulic mechanism speed breaker and rack and pinion
with helical speed breaker.
By entering the models’ parameters into SOLIDWORKS, the suspension
graphs are then obtained and the calculation results are obtained by substituting the
parameters into the equation. This chapter covers:
1) Suspension analysis
2) Vehicular discomfort
3) Fuel consumption
4) Tyre wear rate

24
4.2 Suspension Analysis
4.2.1 Simulation Results
In order to obtain the suspension graphs when the vehicles travel through the speed
breaker, the parameters were entered into SOLIDWORKS for the simulation results
after the modelling has been completed.
Figure 4.1: Suspension Graph of Car for Conventional Speed Breaker
-0.6
-0.4
-0.2
0
0.2
0.4
0.6
0 1 2 3 4 5 6 7 8 9
velo
city
, m/s
time, s
Suspension Graph of Car for Conventional Speed Breaker

25
Figure 4.2: Suspension Graph of Car for Rack and Pinion with helical Speed
Breaker
Figure 4.3: Suspension Graph of Car for Hydraulic Speed Breaker
-0.8
-0.6
-0.4
-0.2
0
0.2
0.4
0.6
0 1 2 3 4 5 6 7 8 9
velo
city
, m/s
time, s
Suspension Graph of Car for Rack and Pinion with Helical Speed Breaker
-0.6
-0.4
-0.2
0
0.2
0.4
0.6
0 1 2 3 4 5 6 7 8 9
velo
city
, m/s
time, s
Suspension Graph of Car for Hydraulic Speed Breaker

26
Figure 4.4: Suspension Graph of Motorcycle for Conventional Speed Breaker
Figure 4.5: Suspension Graph of Motorcycle for Rack and Pinion with Helical
Speed Breaker
-0.8
-0.6
-0.4
-0.2
0
0.2
0.4
0.6
0 1 2 3 4 5 6 7 8 9
velo
city
, m/s
time, s
Suspension Graph of Motorcycle for Conventional Speed Breaker
-0.8
-0.6
-0.4
-0.2
0
0.2
0.4
0 1 2 3 4 5 6 7 8 9
velo
city
, m/s
time, s
Suspension Graph of Motorcycle for Rack and Pinion with Helical Speed Breaker

27
Figure 4.6: Suspension Graph of Motorcycle for Hydraulic Speed Breaker
4.2.2 Discussion on The Suspension Graphs
Figure 4.7: Suspension Graph of Car
Based on the suspension graphs of car for different types of speed breakers obtained
from the simulation results, it is clear that the shapes of the graphs are the same.
However, the velocities of the suspension during certain time are different and this
-0.8
-0.6
-0.4
-0.2
0
0.2
0.4
0 1 2 3 4 5 6 7 8 9
velo
city
, m/s
time, s
Suspension graph of motorcycle for hydraulic speed breaker
-0.8
-0.6
-0.4
-0.2
0
0.2
0.4
0.6
0 2 4 6 8 10
velo
city
, m/s
time, s
Suspension Graph for Car
Conventional SpeedBreaker
Rack and Pinion withHelical Spring
Hydarulic Speed Breaker

28
will result in different accelerations experienced by the car. From the graph, we can
deduce that the car experienced most acceleration when it is passing through
hydraulic speed breaker while the car experienced a little more acceleration when it
is passing through rack and pinion with helical speed breaker as compared to
conventional speed breaker.
Figure 4.8: Suspension Graph for Motorcycle
As for the suspension graphs of motorcycle for different types of speed
breakers, the shapes of the graphs are also the same as compared to each other.
However, identical to the suspension graphs of car, the velocities of the suspension
during certain time are different which will result in different accelerations. From the
graph, we can deduce that the motorcycle also experienced most acceleration when it
is passing through hydraulic speed breaker and the motorcycle experienced a little
extra acceleration when it is passing through rack and pinion with helical speed
breaker as compared to conventional speed breaker. Therefore, it is concluded that
the smart speed breaker will affect the suspension of the vehicle however the impact
is not that significant as it only produces a small amount of differences in the
acceleration of the suspension of the vehicles.
-0.8
-0.6
-0.4
-0.2
0
0.2
0.4
0.6
0 2 4 6 8 10
velo
city
, m/s
time, s
Suspension Graph for Motorcycle
Conventional SpeedBreaker
Rack and Pinion withHelical Speed Breaker
Hydraulic Speed Breaker

29
4.3 Vehicular Discomfort
4.3.1 Calculation Results for Vehicular Discomfort
The RMS acceleration of the vehicles and the VDV values are calculated using the
values obtained from the suspension graphs simulated.
4.3.1.1 RMS Acceleration for Car for Conventional Speed Breaker
𝑎𝑅𝑀𝑆 = (1
13[(−0.0333)2 + (0.0143)2 + (−0.0333)2 + (0.0333)2 + (−2.5)2
+ (2.67)2 + (−1)2 + (−0.75)2 + (1.67)2 + (−0.67)2 + (1.67)2
+ (−1.75)2 + (0.67)2)12
𝑎𝑅𝑀𝑆 = 1.3723𝑚𝑠−2
4.3.1.2 RMS Acceleration for Car for Rack and Pinion with Helical Speed
Breaker
𝑎𝑅𝑀𝑆 = (1
13[(−0.0333)2 + (0.0143)2 + (−0.0333)2 + (0.0333)2 + (−6)2
+ (4.75)2 + (−1.75)2 + (−1.167)2 + (1.45)2 + (−0.77)2
+ (1.67)2 + (−1.75)2 + (2)2)12
𝑎𝑅𝑀𝑆 = 2.41𝑚𝑠−2

30
4.3.1.3 RMS Acceleration for Car for Hydraulic Speed Breaker
𝑎𝑅𝑀𝑆 = (1
13[(−0.0333)2 + (0.0143)2 + (−0.0333)2 + (0.0333)2 + (−5.5)2
+ (2.9)2 + (−1.6)2 + (−1.367)2 + (1.675)2 + (−0.87)2 + (1.5)2
+ (−1.36)2 + (0.77)2)12
𝑎𝑅𝑀𝑆 = 1.9895𝑚𝑠−2
4.3.1.4 VDV value for Car for Conventional Speed Breaker
𝑉𝐷𝑉 = (1
3[(−0.0333)4 + (0.0143)4 + (−0.0333)4 + (0.0333)4 + (−2.5)4
+ (2.67)4 + (−1)4 + (−0.75)4 + (1.67)4 + (−0.67)4 + (1.67)4
+ (−1.75)4 + (0.67)4)14
𝑉𝐷𝑉 = 2.4965𝑚𝑠−1,75
4.3.1.5 VDV value for Car for Rack and Pinion with Helical Speed Breaker
𝑉𝐷𝑉 = (1
3[(−0.0333)4 + (0.0143)4 + (−0.0333)4 + (0.0333)4 + (−6)4
+ (4.75)4 + (−1.75)4 + (−1.167)4 + (1.45)4 + (−0.77)4
+ (1.67)4 + (−1.75)4 + (2)4)14
𝑉𝐷𝑉 = 4.987𝑚𝑠−1,75

31
4.3.1.6 VDV value for Car for Hydraulic Speed Breaker
𝑉𝐷𝑉 = (1
3[(−0.0333)4 + (0.0143)4 + (−0.0333)4 + (0.0333)4 + (−5.5)4
+ (2.9)4 + (−1.6)4 + (−1.367)4 + (1.675)4 + (−0.87)4 + (1.5)4
+ (−1.36)4 + (0.77)4)14
𝑉𝐷𝑉 = 4.2868𝑚𝑠−1,75
4.3.1.7 RMS Acceleration for Motorcycle for Conventional Speed Breaker
𝑎𝑅𝑀𝑆 = (1
13[(−0.05)2 + (0.02)2 + (−0.0286)2 + (0.05)2 + (−1.833)2 + (4.1)2
+ (−1.35)2 + (−0.66)2 + (2.65)2 + (−0.5)2 + (0.94)2 + (−3.4)2
+ (0.7)2)12
𝑎𝑅𝑀𝑆 = 1.811𝑚𝑠−2
4.3.1.8 RMS Acceleration for Motorcycle for Rack and Pinion with Helical
Speed Breaker
𝑎𝑅𝑀𝑆 = (1
13[(−0.0333)2 + (0.025)2 + (−0.0333)2 + (0.0333)2 + (−7)2
+ (3.167)2 + (−2.5)2 + (−1.0333)2 + (1.767)2 + (−0.55)2
+ (0.775)2 + (−1.7)2 + (1)2)12
𝑎𝑅𝑀𝑆 = 2.39𝑚𝑠−2

32
4.3.1.9 RMS Acceleration for Motorcycle for Hydraulic Speed Breaker
𝑎𝑅𝑀𝑆 = (1
13[(−0.0333)2 + (0.025)2 + (−0.0333)2 + (0.0333)2 + (−5.8)2
+ (1.68)2 + (−1.3)2 + (−1.067)2 + (1.833)2 + (−0.767)2
+ (0.875)2 + (−1.933)2 + (0.767)2)12
𝑎𝑅𝑀𝑆 = 1.9152𝑚𝑠−2
4.3.1.10 VDV value for Motorcycle for Conventional Speed Breaker
𝑉𝐷𝑉 = (1
3[(−0.05)4 + (0.02)4 + (−0.0286)4 + (0.05)4 + (−1.833)4 + (4.1)4
+ (−1.35)4 + (−0.66)4 + (2.65)4 + (−0.5)4 + (0.94)4 + (−3.4)4
+ (0.7)4)14
𝑉𝐷𝑉 = 3.5592𝑚𝑠−1,75
4.3.1.11 VDV value for Motorcycle for Rack and Pinion with Helical Speed
Breaker
𝑉𝐷𝑉 = (1
3[(−0.0333)4 + (0.025)4 + (−0.0333)4 + (0.0333)4 + (−7)4
+ (3.167)4 + (−2.5)4 + (−1.0333)4 + (1.767)4 + (−0.55)4
+ (0.775)4 + (−1.7)4 + (1)4)14
𝑉𝐷𝑉 = 5.4055𝑚𝑠−1,75

33
4.3.1.12 VDV value for Motorcycle for Hydraulic Speed Breaker
𝑉𝐷𝑉 = (1
3[(−0.0333)4 + (0.025)4 + (−0.0333)4 + (0.0333)4 + (−5.8)4
+ (1.68)4 + (−1.3)4 + (−1.067)4 + (1.833)4 + (−0.767)4
+ (0.875)4 + (−1.933)4 + (0.767)4)14
𝑉𝐷𝑉 = 4.4442𝑚𝑠−1,75
4.3.2 Discussion for Vehicular Discomfort
From the results obtained, the following figure is generated using Microsoft Excel.
Figure 4.9: Figure of RMS Acceleration and VDV value
By comparing the calculated results with the RMS table for comfort level, the
passenger of the car is found to be uncomfortable when it is passing through
conventional speed breaker while the passenger of the car is found to be highly
uncomfortable when it is passing through the hydraulic speed breaker and the
passenger of the car is found to be extremely uncomfortable when it is passing
1.3723
2.4965
1.811
3.5592
2.41
4.987
2.39
5.4055
1.9895
4.2868
1.9152
4.4442
0
1
2
3
4
5
6
Car RMSacceleration
Car VDV MotorcycleRMS
acceleration
MotorcycleVDV
Figure of RMS Accleration and VDV Value
Conventional Speed Breaker
Rack and Pinion with HelicalSpeed Breaker
Hydraulic Speed Breaker

34
through the rack and pinion with helical speed breaker. As for the VDV value, none
of the VDV calculated reaches 8.5ms-1,75 which will trigger medium discomfort.
As for the motorcycle part, the user of the motorcycle will be highly
uncomfortable when it is passing through the hydraulic speed breaker while the use
of the motorcycle will be extremely uncomfortable when it is passing through the
rack and pinion with helical speed breaker. As for the VDV value, it is same with the
results of the car which is none of the VDV calculated reaches 8.5ms-1,75.
From Figure 4.7, it is clear that hydraulic speed breaker will causes more
discomfort compare to conventional speed breaker while rack and pinion with helical
speed breaker will causes most discomfort compare to the other speed breakers.
Therefore, it is proven that the smart speed breakers will bring more discomfort to
the users than conventional speed breaker.
4.4 Fuel Consumption
4.4.1 Calculation Results for Fuel Consumption
4.4.1.1 Fuel Consumption for Car
The car model used in this research is Honda Civic Dx, which has mass of 1239kg,
and the coefficient of friction of the conventional speed breaker is 0.7
𝐹 = 1239 × 0 − 0.7(1239 × 9.81)
𝐹 = −8508.213 𝑁
while F=ma, therefore
| − 8508.213| = 1239 × 𝑎
𝑎 = 6.867𝑚𝑠−2
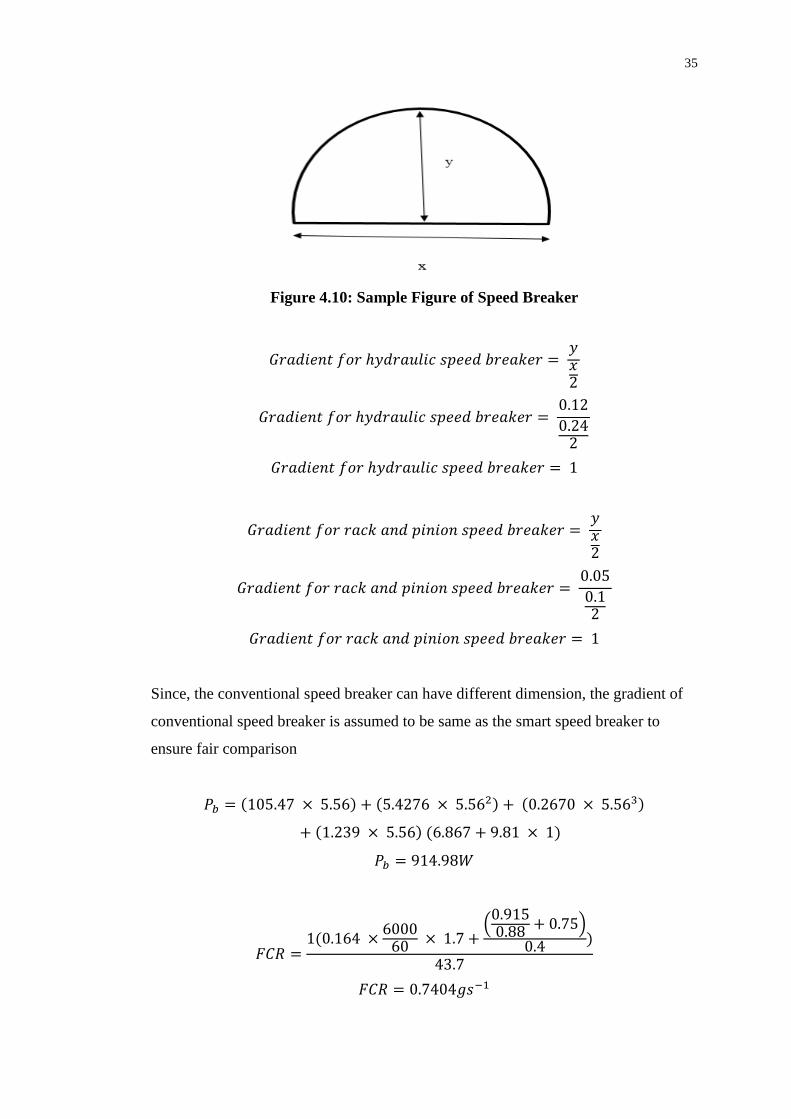
35
Figure 4.10: Sample Figure of Speed Breaker
𝐺𝑟𝑎𝑑𝑖𝑒𝑛𝑡 𝑓𝑜𝑟 ℎ𝑦𝑑𝑟𝑎𝑢𝑙𝑖𝑐 𝑠𝑝𝑒𝑒𝑑 𝑏𝑟𝑒𝑎𝑘𝑒𝑟 = 𝑦𝑥2
𝐺𝑟𝑎𝑑𝑖𝑒𝑛𝑡 𝑓𝑜𝑟 ℎ𝑦𝑑𝑟𝑎𝑢𝑙𝑖𝑐 𝑠𝑝𝑒𝑒𝑑 𝑏𝑟𝑒𝑎𝑘𝑒𝑟 = 0.12
0.242
𝐺𝑟𝑎𝑑𝑖𝑒𝑛𝑡 𝑓𝑜𝑟 ℎ𝑦𝑑𝑟𝑎𝑢𝑙𝑖𝑐 𝑠𝑝𝑒𝑒𝑑 𝑏𝑟𝑒𝑎𝑘𝑒𝑟 = 1
𝐺𝑟𝑎𝑑𝑖𝑒𝑛𝑡 𝑓𝑜𝑟 𝑟𝑎𝑐𝑘 𝑎𝑛𝑑 𝑝𝑖𝑛𝑖𝑜𝑛 𝑠𝑝𝑒𝑒𝑑 𝑏𝑟𝑒𝑎𝑘𝑒𝑟 = 𝑦𝑥2
𝐺𝑟𝑎𝑑𝑖𝑒𝑛𝑡 𝑓𝑜𝑟 𝑟𝑎𝑐𝑘 𝑎𝑛𝑑 𝑝𝑖𝑛𝑖𝑜𝑛 𝑠𝑝𝑒𝑒𝑑 𝑏𝑟𝑒𝑎𝑘𝑒𝑟 = 0.05
0.12
𝐺𝑟𝑎𝑑𝑖𝑒𝑛𝑡 𝑓𝑜𝑟 𝑟𝑎𝑐𝑘 𝑎𝑛𝑑 𝑝𝑖𝑛𝑖𝑜𝑛 𝑠𝑝𝑒𝑒𝑑 𝑏𝑟𝑒𝑎𝑘𝑒𝑟 = 1
Since, the conventional speed breaker can have different dimension, the gradient of
conventional speed breaker is assumed to be same as the smart speed breaker to
ensure fair comparison
𝑃𝑏 = (105.47 × 5.56) + (5.4276 × 5.562) + (0.2670 × 5.563)
+ (1.239 × 5.56) (6.867 + 9.81 × 1)
𝑃𝑏 = 914.98𝑊
𝐹𝐶𝑅 =1(0.164 ×
600060 × 1.7 +
(0.9150.88 + 0.75)
0.4 )
43.7
𝐹𝐶𝑅 = 0.7404𝑔𝑠−1

36
As for hydraulic and rack and pinion with helical speed breakers, since the
coefficient of friction for both the speed breakers are the same which is 0.8 and the
gradients are also the same which is 1. The calculation is as follows
𝐹 = 1239 × 0 − 0.8(1239 × 9.81)
𝐹 = −9723.672 𝑁
while F=ma, therefore
| − 9723.672| = 1239 × 𝑎
𝑎 = 7.848𝑚𝑠−2
𝑃𝑏 = (105.47 × 5.56) + (5.4276 × 5.562) + (0.2670 × 5.563)
+ (1.239 × 5.56) (7.848 + 9.81 × 1)
𝑃𝑏 = 921.7348𝑊
𝐹𝐶𝑅 =1(0.164 ×
600060 × 1.7 +
(0.9220.88 + 0.75)
0.4 )
43.7
𝐹𝐶𝑅 = 0.7408𝑔𝑠−1
4.4.1.2 Fuel Consumption for Motorcycle
The motorcycle model used in this research is Kawasaki Ninja 650R which has mass
of 186kg and the coefficient of friction of the conventional speed breaker is 0.7
𝐹 = 186 × 0 − 0.7(186 × 9.81)
𝐹 = −1277.262 𝑁
while F=ma, therefore
| − 1277.262| = 186 × 𝑎
𝑎 = 6.867𝑚𝑠−2

37
𝑃𝑏 = (53.47 × 5.56) + (3.326 × 5.562) + (1.3 × 5.563)
+ (0.186 × 5.56) (6.867 + 9.81 × 1)
𝑃𝑏 = 640.802𝑊
𝐹𝐶𝑅 =1(0.108 ×
600060 × 1.5 +
(0.641
0.9 + 0.77)
0.43 )
43.7
𝐹𝐶𝑅 = 0.44959𝑔𝑠−1
As for hydraulic and rack and pinion with helical speed breakers, since the
coefficient of friction for both the speed breakers are the same which is 0.8 and the
gradients are also the same which is 1. The calculation is as follows
𝐹 = 186 × 0 − 0.8(186 × 9.81)
𝐹 = −1459.728 𝑁
while F=ma, therefore
| − 1459.728| = 186 × 𝑎
𝑎 = 7.848𝑚𝑠−2
𝑃𝑏 = (53.47 × 5.56) + (3.326 × 5.562) + (1.3 × 5.563)
+ (0.186 × 5.56) (7.848 + 9.81 × 1)
𝑃𝑏 = 641.817𝑊
𝐹𝐶𝑅 =1(0.108 ×
600060 × 1.5 +
(0.642
0.9 + 0.77)
0.43 )
43.7
𝐹𝐶𝑅 = 0.44965𝑔𝑠−1

38
4.4.2 Discussion for Fuel Consumption
From the results obtained, the following figure is generated using Microsoft Excel.
Figure 4.11: Figure of Fuel Consumption
From the calculated results, it is proven that the fuel consumption of a vehicle
passing through smart speed breakers is indeed higher than the fuel consumption of a
vehicle passing through conventional speed breaker. However, the difference is very
small can be said that to be insignificant especially for the fuel consumption of a
motorcycle travelling through the speed breakers. From Figure 4.9, it is clear that
there are slight differences between the fuel consumption for car while travelling
through smart speed breakers and conventional speed breaker while as for the
differences in the fuel consumption for motorcycle while travelling through smart
speed breakers and conventional speed breaker is very hard to be noticed as the
differences is too small.
0.7404 0.7408 0.7408
0.44959 0.44965 0.44965
0
0.1
0.2
0.3
0.4
0.5
0.6
0.7
0.8
ConventionalSpeed Breaker
Rack and Pinionwith Helical Speed
Breaker
Hydraulic SpeedBreaker
Figure of Fuel Consumption (g/s)
Fuel Consumption for Car
Fuel Consumption forMotorcycle

39
4.5 Tyre Wear Rate
4.5.1 Calculation Results for Tyre Wear Rate
4.5.1.1 Fuel Consumption for Car
𝑁𝑜𝑟𝑚𝑎𝑙 𝐹𝑜𝑟𝑐𝑒𝑠 𝑜𝑛 𝑇𝑦𝑟𝑒 = 1239 × 9.81
4
𝑁𝑜𝑟𝑚𝑎𝑙 𝐹𝑜𝑟𝑐𝑒𝑠 𝑜𝑛 𝑇𝑦𝑟𝑒 = 3038.6475𝑁
Malaysia air mass density is given as 0.924kgm-3
𝐹𝑎 = 0.5 × 0.924 × 0.9 × 0.32 × 2.3 × 5.562
𝐹𝑎 = 9.4605𝑁
𝐹𝑔 = 1239 × 1 × 9.81
𝐹𝑔 = 12154.59𝑁
𝐹𝑐 = max( 0 ,(1239 × 5.562
3000 − 1239 × 9.81 × 0)2
4 × 43 × 10−3)
𝐹𝑐 = max( 0 , 0.07423 × 10⁻³)
𝐹𝑐 = 0.07423 × 10⁻³𝑁
𝑏11 = 37 × 0.508 = 18.796
𝑏12 =0.064
0.508= 0.126

40
𝑏13 = 0.012 × 4
0.5082= 0.186
IRI for conventional speed breaker is 2.5mkm-1
𝐶𝑅2 = 0.5(0.5 + 0.02 × 1.3 + 0.1 × 2.5 + 0 × 1)
𝐶𝑅2 = 0.388
𝐹𝑟 = 0.388 × (18.796 × 4 + 1(0.126 × 1239 + 0.186 × 5.562))
𝐹𝑟 = 91.9746𝑁
𝐶𝑖𝑟𝑐𝑢𝑚𝑓𝑒𝑟𝑒𝑛𝑡𝑖𝑜𝑙 𝐹𝑜𝑟𝑐𝑒 𝑜𝑛 𝑇𝑦𝑟𝑒
= (1 + 0 × 0) × (9.5605 + 91.9746 + 12154.59)
4
𝐶𝑖𝑟𝑐𝑢𝑚𝑓𝑒𝑟𝑒𝑛𝑡𝑖𝑜𝑙 𝐹𝑜𝑟𝑐𝑒 𝑜𝑛 𝑇𝑦𝑟𝑒 = 3064.0313𝑁
𝐿𝑎𝑡𝑒𝑟𝑎𝑙 𝐹𝑜𝑟𝑐𝑒 𝑜𝑛 𝑇𝑦𝑟𝑒 =0.07423 × 10⁻³
4
𝐿𝑎𝑡𝑒𝑟𝑎𝑙 𝐹𝑜𝑟𝑐𝑒 𝑜𝑛 𝑇𝑦𝑟𝑒 = 0.01856 × 10⁻³𝑁
𝑇𝑦𝑟𝑒 𝐸𝑛𝑒𝑟𝑔𝑦 = (3064.031)2 + (0.01856 × 10⁻³)2
3038.6475
𝑇𝑦𝑟𝑒 𝐸𝑛𝑒𝑟𝑔𝑦 = 3089.6265
𝑇𝑜𝑡𝑎𝑙 𝑐ℎ𝑎𝑛𝑔𝑒 𝑖𝑛 𝑇𝑟𝑒𝑎𝑑 𝑊𝑒𝑎𝑟 = 0.01747 + 0.001 × 3089.6265
𝑇𝑜𝑡𝑎𝑙 𝑐ℎ𝑎𝑛𝑔𝑒 𝑖𝑛 𝑇𝑟𝑒𝑎𝑑 𝑊𝑒𝑎𝑟 = 3.1071

41
𝑁𝑇 = 3.1071
10 × 14
𝑁𝑇 = 0.02219
𝑇𝑊𝑅 = 4 × 0.02219
2.4
𝑇𝑊𝑅 = 0.03698%/𝑘𝑚
IRI for smart speed breaker is 2.86mkm-1
𝐶𝑅2 = 0.5(0.5 + 0.02 × 1.3 + 0.1 × 2.86 + 0 × 1)
𝐶𝑅2 = 0.406
𝐹𝑟 = 0.406 × (18.796 × 4 + 1(0.126 × 1239 + 0.186 × 5.562))
𝐹𝑟 = 96.2415𝑁
𝐶𝑖𝑟𝑐𝑢𝑚𝑓𝑒𝑟𝑒𝑛𝑡𝑖𝑜𝑙 𝐹𝑜𝑟𝑐𝑒 𝑜𝑛 𝑇𝑦𝑟𝑒
= (1 + 0 × 0) × (9.5605 + 96.2415 + 12154.59)
4
𝐶𝑖𝑟𝑐𝑢𝑚𝑓𝑒𝑟𝑒𝑛𝑡𝑖𝑜𝑙 𝐹𝑜𝑟𝑐𝑒 𝑜𝑛 𝑇𝑦𝑟𝑒 = 3065.098𝑁
𝑇𝑦𝑟𝑒 𝐸𝑛𝑒𝑟𝑔𝑦 = (3065.098)2 + (0.01856 × 10⁻³)2
3038.6475
𝑇𝑦𝑟𝑒 𝐸𝑛𝑒𝑟𝑔𝑦 = 3091.7787
𝑇𝑜𝑡𝑎𝑙 𝑐ℎ𝑎𝑛𝑔𝑒 𝑖𝑛 𝑇𝑟𝑒𝑎𝑑 𝑊𝑒𝑎𝑟 = 0.01747 + 0.001 × 3091.7787
𝑇𝑜𝑡𝑎𝑙 𝑐ℎ𝑎𝑛𝑔𝑒 𝑖𝑛 𝑇𝑟𝑒𝑎𝑑 𝑊𝑒𝑎𝑟 = 3.1092

42
𝑁𝑇 = 3.1092
10 × 14
𝑁𝑇 = 0.02221
𝑇𝑊𝑅 = 4 × 0.02221
2.4
𝑇𝑊𝑅 = 0.03702%/𝑘𝑚
4.5.1.2 Fuel Consumption for Motorcycle
𝑁𝑜𝑟𝑚𝑎𝑙 𝐹𝑜𝑟𝑐𝑒𝑠 𝑜𝑛 𝑇𝑦𝑟𝑒 = 186 × 9.81
4
𝑁𝑜𝑟𝑚𝑎𝑙 𝐹𝑜𝑟𝑐𝑒𝑠 𝑜𝑛 𝑇𝑦𝑟𝑒 = 456.165𝑁
Malaysia air mass density is given as 0.924kgm-3
𝐹𝑎 = 0.5 × 0.924 × 0.8 × 0.3 × 1.2 × 5.562
𝐹𝑎 = 4.1132𝑁
𝐹𝑔 = 186 × 1 × 9.81
𝐹𝑔 = 1824.66𝑁
𝐹𝑐 = max( 0 ,(186 × 5.562
3000 − 186 × 9.81 × 0)2
2 × 43 × 10−3)
𝐹𝑐 = max( 0 , 0.02229 × 10⁻³)

43
𝐹𝑐 = 0.02229 × 10⁻³𝑁
𝑏11 = 37 × 0.4572 = 16.9164
𝑏12 =0.064
0.4572= 0.14
𝑏13 = 0.012 × 2
0.45722= 0.1148
IRI for conventional speed breaker is 2.5mkm-1
𝐶𝑅2 = 0.5(0.5 + 0.02 × 1.3 + 0.1 × 2.5 + 0 × 1)
𝐶𝑅2 = 0.388
𝐹𝑟 = 0.388 × (16.9164 × 2 + 1(0.14 × 186 + 0.1148 × 5.562))
𝐹𝑟 = 24.6076𝑁
𝐶𝑖𝑟𝑐𝑢𝑚𝑓𝑒𝑟𝑒𝑛𝑡𝑖𝑜𝑙 𝐹𝑜𝑟𝑐𝑒 𝑜𝑛 𝑇𝑦𝑟𝑒
= (1 + 0 × 0) × (4.1132 + 24.6076 + 1824.66)
2
𝐶𝑖𝑟𝑐𝑢𝑚𝑓𝑒𝑟𝑒𝑛𝑡𝑖𝑜𝑙 𝐹𝑜𝑟𝑐𝑒 𝑜𝑛 𝑇𝑦𝑟𝑒 = 926.6904𝑁
𝐿𝑎𝑡𝑒𝑟𝑎𝑙 𝐹𝑜𝑟𝑐𝑒 𝑜𝑛 𝑇𝑦𝑟𝑒 = 0.02229 × 10⁻³
2
𝐿𝑎𝑡𝑒𝑟𝑎𝑙 𝐹𝑜𝑟𝑐𝑒 𝑜𝑛 𝑇𝑦𝑟𝑒 = 0.01115 × 10⁻³𝑁
𝑇𝑦𝑟𝑒 𝐸𝑛𝑒𝑟𝑔𝑦 = (926.6904)2 + (0.01115 × 10⁻³)2
456.165

44
𝑇𝑦𝑟𝑒 𝐸𝑛𝑒𝑟𝑔𝑦 = 1882.5537
𝑇𝑜𝑡𝑎𝑙 𝑐ℎ𝑎𝑛𝑔𝑒 𝑖𝑛 𝑇𝑟𝑒𝑎𝑑 𝑊𝑒𝑎𝑟 = 0.00639 + 0.0005 × 1882.5537
𝑇𝑜𝑡𝑎𝑙 𝑐ℎ𝑎𝑛𝑔𝑒 𝑖𝑛 𝑇𝑟𝑒𝑎𝑑 𝑊𝑒𝑎𝑟 = 0.9477
𝑁𝑇 = 0.9477
10 × 11
𝑁𝑇 = 0.008615
𝑇𝑊𝑅 = 2 × 0.008615
2.4
𝑇𝑊𝑅 = 0.007179%/𝑘𝑚
IRI for smart speed breaker is 2.86mkm-1
𝐶𝑅2 = 0.5(0.5 + 0.02 × 1.3 + 0.1 × 2.86 + 0 × 1)
𝐶𝑅2 = 0.406
𝐹𝑟 = 0.406 × (16.9164 × 2 + 1(0.14 × 186 + 0.1148 × 5.562))
𝐹𝑟 = 25.7492𝑁
𝐶𝑖𝑟𝑐𝑢𝑚𝑓𝑒𝑟𝑒𝑛𝑡𝑖𝑜𝑙 𝐹𝑜𝑟𝑐𝑒 𝑜𝑛 𝑇𝑦𝑟𝑒
= (1 + 0 × 0) × (4.1132 + 25.7492 + 1824.66)
2
𝐶𝑖𝑟𝑐𝑢𝑚𝑓𝑒𝑟𝑒𝑛𝑡𝑖𝑜𝑙 𝐹𝑜𝑟𝑐𝑒 𝑜𝑛 𝑇𝑦𝑟𝑒 = 927.2612𝑁
𝑇𝑦𝑟𝑒 𝐸𝑛𝑒𝑟𝑔𝑦 = (927.2612)2 + (0.01115 × 10⁻³)2
456.165

45
𝑇𝑦𝑟𝑒 𝐸𝑛𝑒𝑟𝑔𝑦 = 1884.8735
𝑇𝑜𝑡𝑎𝑙 𝑐ℎ𝑎𝑛𝑔𝑒 𝑖𝑛 𝑇𝑟𝑒𝑎𝑑 𝑊𝑒𝑎𝑟 = 0.00639 + 0.0005 × 1884.8735
𝑇𝑜𝑡𝑎𝑙 𝑐ℎ𝑎𝑛𝑔𝑒 𝑖𝑛 𝑇𝑟𝑒𝑎𝑑 𝑊𝑒𝑎𝑟 = 0.9488
𝑁𝑇 = 0.9488
10 × 11
𝑁𝑇 = 0.008625
𝑇𝑊𝑅 = 2 × 0.008625
2.4
𝑇𝑊𝑅 = 0.007188%/𝑘𝑚
4.5.2 Discussion for Fuel Consumption
From the results obtained, the following figure is generated using Microsoft Excel.
Figure 4.12: Figure of Tyre Wear Rate
0.03698 0.03702 0.03702
0.007179 0.007188 0.007188
0
0.005
0.01
0.015
0.02
0.025
0.03
0.035
0.04
ConventionalSpeed Breaker
Rack and Pinionwith Helical Speed
Breaker
Hydraulic SpeedBreaker
Figure of Tyre Wear Rate (%/km)
Tyre Wear Rate for Car
Tyre Wear Rate forMotorcycle

46
From the calculated results, it is proven that the tyre wear rate of a vehicle passing
through smart speed breakers is indeed higher than the tyre wear rate of a vehicle
passing through conventional speed breaker. However, the difference is very small
can be said that to be insignificant especially for the tyre wear rate of a motorcycle
travelling through the speed breakers. From Figure 4.10, it is very hard to notice the
slight differences between the tyre wear rate for car while travelling through smart
speed breakers and conventional speed breaker and the situation is the same for the
tyre wear rate for motorcycle while travelling through smart speed breakers and
conventional speed breaker.
4.6 Conclusion
The results showed that the traffic energy harvester based speed breakers did indeed
brings negative impacts to the comfortability level of vehicle occupants, fuel
consumption rate and the tyre wear rate. However, the impacts on the fuel
consumption rate and tyre wear rate are not so significant since they only increased
slightly.

47
CHAPTER 5
5 CONCLUSION AND RECOMMENDATIONS
5.1 Introduction
After acquiring all the results and undergo analysis, the conclusion is drawn. This
chapter covers:
1) Conclusion
2) Recommendations
5.2 Conclusion
As a conclusion of the analysis on the results, the harnessing of traffic energy by
using smart speed breaker does indeed causes some impacts, which are impacts on
the vehicle’s suspension system, vehicular discomfort of the users, increase of fuel
consumption and increase of tyre wear rate. For the impacts on vehicle’s suspension
system, the shape of the suspension graph is the same indicates the ways of affecting
the vehicle’s suspension system by the smart speed breaker is the same as the
conventional speed breaker and the differences in suspension graph is not that huge.
As for the impacts on the increase of fuel consumption, it is very insignificant as the
increase is only 0.0004gs-1 for car and 0.00006gs-1 for motorcycle, it is very small as
compared to what the vehicle used during daily travels. Apart from that, the impacts
on the increase of tyre wear rate is also very insignificants as the increase is only

48
0.00004%/km for car and 0.000009%/km for motorcycle. This kind of small increase
will not really affect the lifetime of a tyre. However, a different story is on the
impacts of vehicular discomfort, the smart speed breakers causes the vehicle users to
be more uncomfortable as compared to the conventional speed breaker especially for
rack and pinion with helical speed breaker which causes extreme discomfort when
vehicle travels through it.
Thus, it is proven that the smart speed breakers will cause these four possible
impacts and by comparing both rack and pinion with helical and hydraulic speed
breakers, hydraulic speed breaker will produce smaller negative impacts, which is
better if it can produce the same amount of electric power as the rack and pinion with
helical speed breakers. Therefore, from the results obtained, the smart speed breakers
can be said to be practical to be implemented in our daily lives.
5.3 Recommendations
This research is based on the focus of investigating the possible impacts of smart
speed breakers by using simulation by software. Therefore, most of the parameters
used are ideal parameters, which are not the case in real life. Thus, it is
recommended that the real life model of the speed breakers and vehicle is used to
produce actual results in real life. This will provide the most accurate results, which
may prove the simulation results to be wrong. Besides that, more advanced software
can be used to investigate the impacts in order to obtain results that are more accurate.
Finally, a few more types of vehicles and smart speed breakers should be modelled to
provide a better comparison of the impacts of harnessing traffic energy using smart
speed breakers.

49
REFERENCES
#1, A.A., Ghobad, S., Sabet and Barouz, A. (2012) ‘Simulation and analysis of
passive and active suspension system using quarter car model for different road
profile’, International Journal of Engineering Trends and Technology, .
A, L.E., E, S.M., Júnior, J.A., Carvalho, C.A.S., Antunes, M.F.L., Junqueira, D.M.,
Scientific and Publishing, A. (no date) ‘Evaluation of vehicular discomfort
measures produced by speed bumps using numerical simulation’, Journal of
Mechanical Engineering and Automation, 5(4), pp. 113–123.
Ali, G. and Hassaan (2014) ‘Car dynamics using quarter model and passive
suspension, part I: Effect of suspension damping and car speed’, International
Journal of Computer, 1(2).
Anderson, S.T., Parry, I.W.H., Sallee, J.M. and Fischer, C. (2009) ‘Apsf reep’, and
Wolverton Wolverton, . doi: 10.1093/reep/req021.
Aswal, P., Dave, J. and Ansari, P. (2013) ‘ELECTRICITY GENERATION BY
VIBRATING PIEZOELECTRIC CRYSTAL IN ROADWAY USING
SIMULINK’, International Association of Scientific Innovation and Research, .
Bhagdikar, P., Gupta, S., Rana, N. and Jegadeeshwaran, R. (2014) ‘GENERATION
OF ELECTRICITY WITH THE USE OF SPEED BREAKERS’, International
Journal of Advances in Engineering & Technology, 7(2), pp. 589–595.
Bhagdikar, P., Gupta, S., Rana, N. and Jegadeeshwaran, R. (2014) ‘GENERATION
OF ELECTRICITY WITH THE USE OF SPEED BREAKERS’, International
Journal of Advances in Engineering & Technology, 7(2), pp. 589–595.
Castro-Llach, C., Fiumicelli, D., George, P., Lockwood, R. and Villa, S. (2012) ‘The
draft network rail (Norton bridge area improvements) order environmental
statement – volume 3, report 6 noise and vibration technical report status: Draft -
for consultation purposes only the draft network rail (Norton bridge area
improvements) order E’, .
Chikhale, S.J. and Deshmukh, P. (2013) ‘Comparative analysis of vehicle suspension
system in Matlab-SIMULINK and MSc- ADAMS with the help of quarter car
model’, International Journal of Innovative Research in Science, Engineering and
Technology (ISO Certified Organization), 3297(8).

50
Faraz, A., Ansari and Taparia, R. (2013) ‘Modeling, analysis and control of active
suspension system using sliding mode control and disturbance observer’,
International Journal of Scientific and Research Publications, 3(1).
Kumar, N.C., Gowtham, K., Manikandan, M., Bharathkanna, P. and Kumar, M.T.
(2015) ‘A review on various method of power generation in automobile
suspension system’, .
Lee, M.G., Park, Y.K., Kwon, K., Jung and Yoo, J.J. (2011) ‘Estimation of fuel
consumption using in-vehicle parameters’, International Journal Science and
Technology, 4(4).
Olugboji, O.A., Abolarin, M.S., Ohiemi, I.E. and Ajani, K.C. (2015) ‘Modelling and
design of an auto street light generation speed breaker mechanism’, American
Journal of Mechanical Engineering, 3(3), pp. 84–92. doi: 10.12691/ajme-3-3-3.
Pathmasharma, S., Suresh, J.K., Viswanathan, P., Subramanian, R., Scholar, P., Head
and Professor & Dean (2013) ‘Analysis of passenger car suspension system using
Adams’, International Journal of Science, Engineering and Technology Research,
2(5), pp. 2278–7798.
Pranesh, B., Bamankar, Joshi, G.V. and Professor, A. (2015) ‘A REVIEW ON
VIBRATIONAL ANALYSIS OF SUSPENSION SYSTEM FOR QUARTER
AND HALF CAR MODEL WITH VARIOUS CONTROLLERS address for
correspondence’, International Journal of Advanced Engineering Research and
Studies, , pp. 2249–8974.
Ravivarma, K., Divya, B., Prajith, C.P., Sivamurugan, A. and Vengatesan, K. (2013)
‘Power generation using hydraulic mechanism at speed bumper’, International
Journal of Scientific & Engineering Research, 4(6).
Reddy, A.K.V., Shankar, S.M. and Apparao, K. (2010) ‘EXPERIMENTAL
DETERMINATION OF BRAKE THERMAL EFFICIENCY AND BRAKE
SPECIFIC FUEL CONSUMPTION OF DIESEL ENGINE FUELLED WITH
BIO- DIESEL’, International Journal of Engineering and Technology, 2(5), pp.
305–309.
Robbins, M.M. and Tran, N. (2015) ‘NCAT report 15-‐ 02 LITERATURE
REVIEW: THE IMPACT OF PAVEMENT ROUGHNESS ON VEHICLE
OPERATING COSTS’, .
Roth, F.L. and Holt, W.L. (2011) ‘MEASURING THE RATE OF WEAR OF TIRE
TREADS’, Part of Journal of Research cJf the National Bureau of Standards, 32.
Sharma, P., Saluja, N., Saini, D. and Saini, P. (2013) ‘Analysis of automotive passive
suspension system with Matlab program generation’, International Journal of
Advancements in Technology©IJoAT Mechanical Engg., JMIT, Radaur
(Yamunanagar), 4(2).
Song, Y.-Y., Yao, E.-J., Zuo, T. and Lang, Z.-F. (2013) ‘Emissions and fuel
consumption modeling for evaluating environmental effectiveness of ITS

51
strategies’, Discrete Dynamics in Nature and Society, 2013. doi:
10.1155/2013/581945.
Svenson, G. and Fjeld, D. (2014) ‘The impact of road geometry and surface
roughness on fuel consumption for Swedish logging trucks’, Transport Research
Arena, 2014.
Szurgott, P., Kwasniewski, L. and Wekezer, J.W. (2009) ‘DYNAMIC
INTERACTION BETWEEN HEAVY VEHICLES AND SPEED BUMPS’, .
Todaria, P., Wang, L., Pandey, A., ’connor, J.O., Mcavoy, D., Harrigan, T., Chernow,
B. and Zuo, L. (2015) ‘Design, modeling and test of a novel speed bump energy
Harvester’, .
Tong, G. and Jin, X. (2012) ‘Study on the simulation of radial tire wear
characteristics’, .
Venkateswarulu, E., Raju, R.N. and Seshadri, G. (2014) ‘THE ACTIVE
SUSPENSION SYSTEM WITH HYDRAULIC ACTUATOR FOR HALF CAR
MODEL ANALYSIS AND SELF-TUNING WITH PID CONTROLLERS’,
IJRET: International Journal of Research in Engineering and Technology, , pp.
2321–7308.
Ȧ P.R.A., Kumar, K.A. and Suresh, S. (2014) ‘Power generation from speed breaker
by rack and ratchet mechanism’, Research Article International Journal of
Current Engineering and Technology, . doi: 10.14741/ijcet/spl.2.2014.104.
Cappiello, A. et al., 2002. A Statistical Model of Vehicle Emissions and Fuel
Consumption. 2002 The IEEE 5th International Conference on Intelligent
Transportation Systems, Singapore, 3-6 September. Available at: <
http://dspace.mit.edu/bitstream/handle/1721.1/1675/A_Statistical_Model_of_Vehi
cle_.pdf>. [Accessed 18 August 2015].
Ardekani, S.A. and Sumitsawan, P., 2010. Effect of Pavement Type on Fuel
Consumption and Emissions in City Driving. Available at http://www.rmc-
foundation.org/images/UTA%20Fuel%20Consumption-
Emissions%20Study%20Final%203-10.pdf [Accessed 20 May 2016].
Cheah et al., 2007. Factor of two: Halving the Fuel Consumption of New U.S.
Automobiles by 2035. Laboratory for Energy and Environment Massachusetts
Institute of Technology. Available at: http://mitei.mit.edu/system/files/2007-04-
rp.pdf [Accessed 19 August 2015].
Crolla, D.A. and JEl-Razaz, A.S.A., 1987. A REVIEW OF THE COMBINED
LATERAL AND LONGITUDINAL FORCE GENERATION OF TYRES ON
DEFORMABLE SURFACES. Physical Therapy. Journal of Terramechanics.
[online] 24(3), pp.199-225. Available at: <http://
ptjournal.apta.org/content/88/2/251.full> [Accessed 23 May 2016].
EJM, 2014. Air resistance and rolling resistance losses. [lecture note] The University
of Chicago at:<

52
http://geosci.uchicago.edu/~moyer/GEOS24705/Readings/Air_and_rolling_resista
nce.pdf> [Accessed 24 July 2016]
Flintsch, G.W. at al., 2012. The Little Book of Tire Pavement Friction. Available at:
https://secure.hosting.vt.edu/www.apps.vtti.vt.edu/1-
pagers/CSTI_Flintsch/The%20Little%20Book%20of%20Tire%20Pavement%20F
riction.pdf [Accessed 2 September 2015].
Fueleconomy.gov., N.D. Where the Energy Goes: Gasoline Vehicles [electronic print]
Available at: < https://www.fueleconomy.gov/feg/atv.shtml> [Accessed 20 May
2016].
Institute for Research in Technology, N.D. Tire-road friction. Available at
http://www.iit.upcomillas.es/pfc/resumenes/521c4728d1aa8.pdf [Accessed 29
April 2015]
Lenngren, C.A. and Fäldner, L., 2010. FUEL COST CONSIDERATIONS
REGARDING TRUCK ROLLING RESISTANCE ON
M&F Auto Sales, N.D. How Speed Bumps Destroy Your Car. [online] Available
at: < http://blog.mandfauto.com/speed-bumps-destroy-car/ >[Accessed 28 April
2016].
Nam,E.K. and Giannelli, R., 2005. Fuel Consumption Modeling of Conventional and
Advanced Technology Vehicles in the Physical Emission Rate Estimator (PERE).
[pdf] United States Environmental Protection Agency. Available at:
<https://www3.epa.gov/otaq/models /ngm/420p05001.pdf> [Accessed 3 May
2016].
Nave,R., N.D. Friction and Automobile Tires. [online] Available at:
<http://hyperphysics.phy-astr.gsu.edu/hbase/mechanics/frictire.html> [Accessed
24 May 2016].
Roymech, 2013. Coefficient of Friction. [online] Available at:
<http://www.roymech.co.uk/Useful_Tables/Tribology/co_of_frict.htm#coef>
[Accessed 21 April 2016].
Suleiman Arafat Yero, Mohd. Rosli Hainin & Haryati Yacoob, 2012.
DETERMINATION OF SURFACE ROUGHNESS INDEX OF VARIOUS
BITUMINOUS PAVEMENTS. International Journal of Recent Research and
Applied Studies. [online] 13(1) Available at: <
http://www.arpapress.com/Volumes/Vol13Issue1/IJRRAS_13_1_10.pdf>
[Accessed 6 May 2016].

53

54
APPENDICES
APPENDIX A: Table of RMS Acceleration Correspond to Comfort Level
55
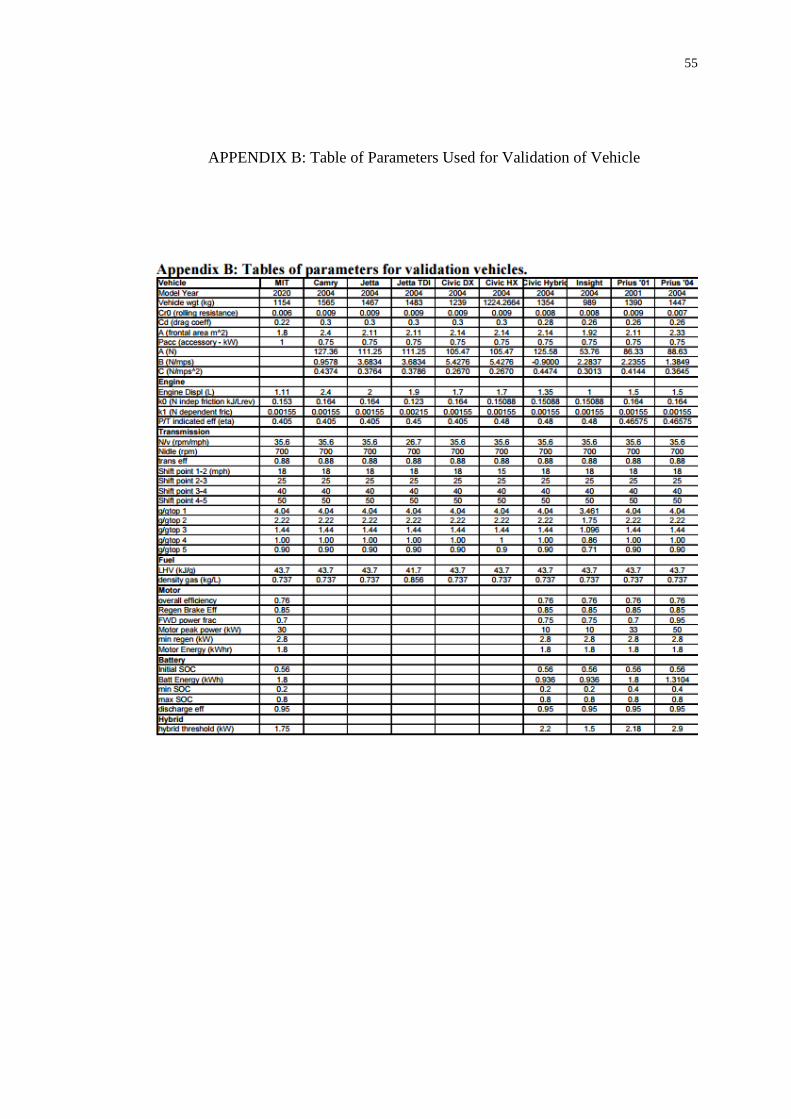
APPENDIX B: Table of Parameters Used for Validation of Vehicle

56
APPENDIX C: Table of Parameters Used for Validation of Vehicle

57