Used Vehicles Survival Rates and Their Impacts on Urban ...
9
Used Vehicles Survival Rates and Their Impacts on Urban Air Quality of Addis Ababa, Ethiopia Yilak A Kebede Lantern Institute of Data Science Abstract:- The longevity of imported used vehicle determines urban outdoor air pollution and affects government’s regulatory policy measures to balance the benefit of used vehicle usage and its negative externalities. This paper estimates the life expectancy of vehicles in Ethiopia for a maximum of 30 years. The study used four different models to determine the total vehicle stock, survival rate and scrap rate of vehicles at different age and the total emission respectively. The models support different estimation, where there is difficulty to find actual data related to scrap vehicles. The total emission calculation serves policy makers to make a learned and informed decision that improves urban air quality. Key words: Survival rate, scrap rate, urban air quality, vehicle stock, total emission 1. INTRODUCTION Transportation is one of the single most polluting emission sources in African cities and motor-traffic has a major share in the total outdoor air pollution. Air pollutants such as particulate matter (PM) are affecting the public health of developing nations and some studies indicate that environmental pollution has become one of the major sources of health risk throughout African cities (UNEP, 2005). The immediate risks are generally higher in developing countries due to weak environmental legislation and lack of technologies to control air pollution (David, 2003). Especially, concerns arise when the majority of vehicle fleets are old. The air pollution costs peoples’ health and incurs billions of dollars in medical bills and working days lost. According WHO (2016) report, air pollution has become a growing concern in the past few years and kills around 3 million people related to ambient air pollution. This report also indicates that pedestrians are the major victim of ambient air pollution caused by motorized transport in developing cities. Total emission from vehicles is directly correlated with service age. Alen Greenspan and Cohen (1999) have put forward their empirical preposition that very few vehicles are scrapped during the first three to four years of life. During this period, most scrappage presumably results from accidents; in later years, scrappage may result from an economic decision by the owner to replace an increasingly unreliable vehicle with a more reliable alternative. 2. VEHICLE CLASSIFICATION IN ETHIOPIA Generally, vehicle ownership levels depend on the national GDP/Capita; and compared with other regions, sub-Saharan African countries have the lowest motorization level. Ethiopian vehicle ownership may be categorized into five broad groups; private, public transport, commercial, governmental, international / non- governmental organizations (shown in figure 1). Compared with Kenya and Tanzania by average vehicle age, Ethiopia has an older vehicle fleet.. From the September 2009 UNEP report, the average age of Tanzania’s vehicle population was 15 years. Simi lar average ages have been reported in Uganda (>13 years), Ethiopia (20 years) and Kenya (13 years). (UNEP, September 09). Light and heavy trucks usually stay longer than passenger vehicles. International Journal of Engineering Research & Technology (IJERT) ISSN: 2278-0181 http://www.ijert.org IJERTV10IS010257 (This work is licensed under a Creative Commons Attribution 4.0 International License.) Published by : www.ijert.org Vol. 10 Issue 02, February-2021 726
Transcript of Used Vehicles Survival Rates and Their Impacts on Urban ...

Used Vehicles Survival Rates and Their Impacts
on Urban Air Quality of Addis Ababa, Ethiopia Yilak A Kebede
Lantern Institute of Data Science
Abstract:- The longevity of imported used vehicle determines
urban outdoor air pollution and affects government’s
regulatory policy measures to balance the benefit of used
vehicle usage and its negative externalities. This paper
estimates the life expectancy of vehicles in Ethiopia for a
maximum of 30 years. The study used four different models to
determine the total vehicle stock, survival rate and scrap rate
of vehicles at different age and the total emission respectively.
The models support different estimation, where there is
difficulty to find actual data related to scrap vehicles. The
total emission calculation serves policy makers to make a
learned and informed decision that improves urban air
quality.
Key words: Survival rate, scrap rate, urban air quality, vehicle
stock, total emission
1. INTRODUCTION
Transportation is one of the single most polluting
emission sources in African cities and motor-traffic has a
major share in the total outdoor air pollution. Air pollutants
such as particulate matter (PM) are affecting the public
health of developing nations and some studies indicate that
environmental pollution has become one of the major
sources of health risk throughout African cities (UNEP,
2005). The immediate risks are generally higher in
developing countries due to weak environmental legislation
and lack of technologies to control air pollution (David,
2003). Especially, concerns arise when the majority of
vehicle fleets are old.
The air pollution costs peoples’ health and incurs billions
of dollars in medical bills and working days lost.
According WHO (2016) report, air pollution has become a
growing concern in the past few years and kills around 3
million people related to ambient air pollution. This report
also indicates that pedestrians are the major victim of
ambient air pollution caused by motorized transport in
developing cities.
Total emission from vehicles is directly correlated with
service age. Alen Greenspan and Cohen (1999) have put
forward their empirical preposition that very few vehicles
are scrapped during the first three to four years of life.
During this period, most scrappage presumably results
from accidents; in later years, scrappage may result from an
economic decision by the owner to replace an increasingly
unreliable vehicle with a more reliable alternative.
2. VEHICLE CLASSIFICATION IN ETHIOPIA
Generally, vehicle ownership levels depend on the
national GDP/Capita; and compared with other regions,
sub-Saharan African countries have the lowest
motorization level. Ethiopian vehicle ownership may be
categorized into five broad groups; private, public transport,
commercial, governmental, international / non-
governmental organizations (shown in figure 1).
Compared with Kenya and Tanzania by average
vehicle age, Ethiopia has an older vehicle fleet.. From the
September 2009 UNEP report, the average age of
Tanzania’s vehicle population was 15 years. Similar
average ages have been reported in Uganda (>13 years),
Ethiopia (20 years) and Kenya (13 years). (UNEP,
September 09). Light and heavy trucks usually stay longer
than passenger vehicles.
International Journal of Engineering Research & Technology (IJERT)
ISSN: 2278-0181http://www.ijert.org
IJERTV10IS010257(This work is licensed under a Creative Commons Attribution 4.0 International License.)
Published by :
www.ijert.org
Vol. 10 Issue 02, February-2021
726
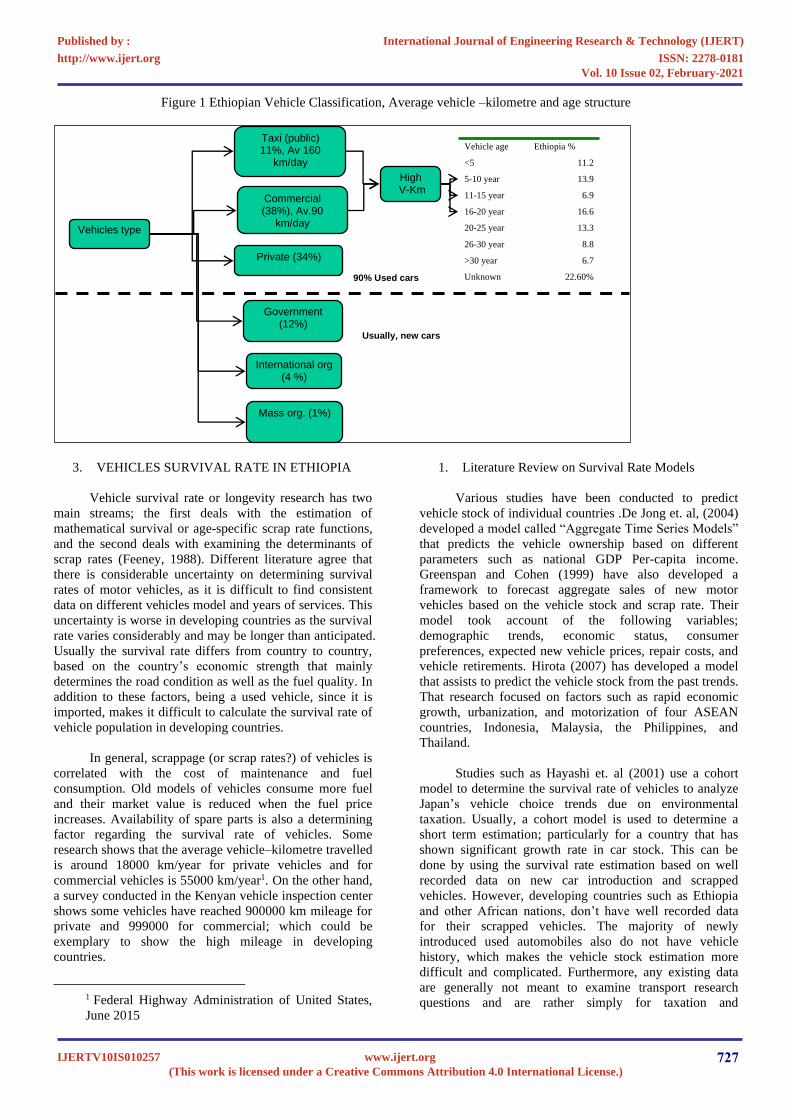
Figure 1 Ethiopian Vehicle Classification, Average vehicle –kilometre and age structure
3. VEHICLES SURVIVAL RATE IN ETHIOPIA
Vehicle survival rate or longevity research has two
main streams; the first deals with the estimation of
mathematical survival or age-specific scrap rate functions,
and the second deals with examining the determinants of
scrap rates (Feeney, 1988). Different literature agree that
there is considerable uncertainty on determining survival
rates of motor vehicles, as it is difficult to find consistent
data on different vehicles model and years of services. This
uncertainty is worse in developing countries as the survival
rate varies considerably and may be longer than anticipated.
Usually the survival rate differs from country to country,
based on the country’s economic strength that mainly
determines the road condition as well as the fuel quality. In
addition to these factors, being a used vehicle, since it is
imported, makes it difficult to calculate the survival rate of
vehicle population in developing countries.
In general, scrappage (or scrap rates?) of vehicles is
correlated with the cost of maintenance and fuel
consumption. Old models of vehicles consume more fuel
and their market value is reduced when the fuel price
increases. Availability of spare parts is also a determining
factor regarding the survival rate of vehicles. Some
research shows that the average vehicle–kilometre travelled
is around 18000 km/year for private vehicles and for
commercial vehicles is 55000 km/year1. On the other hand,
a survey conducted in the Kenyan vehicle inspection center
shows some vehicles have reached 900000 km mileage for
private and 999000 for commercial; which could be
exemplary to show the high mileage in developing
countries.
1 Federal Highway Administration of United States,
June 2015
1. Literature Review on Survival Rate Models
Various studies have been conducted to predict
vehicle stock of individual countries .De Jong et. al, (2004)
developed a model called “Aggregate Time Series Models”
that predicts the vehicle ownership based on different
parameters such as national GDP Per-capita income.
Greenspan and Cohen (1999) have also developed a
framework to forecast aggregate sales of new motor
vehicles based on the vehicle stock and scrap rate. Their
model took account of the following variables;
demographic trends, economic status, consumer
preferences, expected new vehicle prices, repair costs, and
vehicle retirements. Hirota (2007) has developed a model
that assists to predict the vehicle stock from the past trends.
That research focused on factors such as rapid economic
growth, urbanization, and motorization of four ASEAN
countries, Indonesia, Malaysia, the Philippines, and
Thailand.
Studies such as Hayashi et. al (2001) use a cohort
model to determine the survival rate of vehicles to analyze
Japan’s vehicle choice trends due on environmental
taxation. Usually, a cohort model is used to determine a
short term estimation; particularly for a country that has
shown significant growth rate in car stock. This can be
done by using the survival rate estimation based on well
recorded data on new car introduction and scrapped
vehicles. However, developing countries such as Ethiopia
and other African nations, don’t have well recorded data
for their scrapped vehicles. The majority of newly
introduced used automobiles also do not have vehicle
history, which makes the vehicle stock estimation more
difficult and complicated. Furthermore, any existing data
are generally not meant to examine transport research
questions and are rather simply for taxation and
Vehicles type
Taxi (public) 11%, Av 160
km/day
Private (34%)
Commercial (38%), Av.90
km/day
Government (12%)
International org (4 %)
High V-Km
Mass org. (1%)
22.60% Unknown
6.7 >30 year
8.8 26-30 year
13.3 20-25 year
16.6 16-20 year
6.9 11-15 year
13.9 5-10 year
11.2 <5
Ethiopia % Vehicle age
90% Used cars
Usually, new cars
International Journal of Engineering Research & Technology (IJERT)
ISSN: 2278-0181http://www.ijert.org
IJERTV10IS010257(This work is licensed under a Creative Commons Attribution 4.0 International License.)
Published by :
www.ijert.org
Vol. 10 Issue 02, February-2021
727

administration purposes (Hirota, 2007).
Survival rate estimation is necessary to estimate passenger
car ownership in the country as well as the total emission
from vehicles that help to analyze and formulate policies in
relation to transportation, urban environment, and macro-
economic policies (Yan et. al, 2011). Researchers in
developing countries are often forced to employ simplified
methods as they usually face data shortage and
inconsistency. Table 1 shows some of published vehicle
scrappage models that determine survival rate. R is
retirement rate, Su is survival rate, t is lifetime years (based
on Yan et.al, 2011).
Table 1. Models literature summery
Citation Equation Key parameters
Walker, 1968, logistic
)/1(exp
1)(
50LsBsR
−+=
B tail representing old vehicles,
shape factor, L50median
life time
Zacharidis et.al 1995
−=
b
t
bssSu exp)(
b, failure steepness, t
characteristic service life,
Modified Weibull US,
EPA 2005
−−=
2
22
0exp
2
1)(
sssSu
s0, age at onset of significant
retirement , steepness of
change
Hiroto, 2007 `)/( mtt
t aP −= t: vehicle age at the year M:
maximum age (M=30)
a: constant ( elasticity of scrap
in terms of sales in the year )
p: survival rate p(0)=1, P(m)=0
Hayashi et.al (2001) k
ta
k
ta
k
ta CCL )1(),1(,, / ++= age a and class k in the year t
In most developing countries where Hirota’s (2007)
cohort model use to analyze vehicle emission by vehicle
stock with poor recording on scrapped vehicle. And in this
condition, it is difficult to implement directly the equation
of Hayashi et. al (2001) that need year-based data.
However, Greenspan and Cohen (1999;in Hiroto, 2007),
have introduced a method to determine survival rate with
variables that represent the physical deterioration and
vehicle market value. This model is helpful to estimate the
survival rate of vehicle in countries with poor recording
tradition.
Due to a relatively high road accident rate in Africa,
scrap estimation is more complicated. Greenspan and
Cohen model determine the survival rate from the elasticity
of new car sales and scrap. Generally, scrap could be
calculated as follows:
Scrap= car stock of previous year + new cars sale of
present year- car stock of present year
In most African countries, including Ethiopia, the
government does not decide when the vehicle is to be
scrapped. It is individuals or vehicle sales agent that make
the choice; by weighing the benefit between being scrapped
and extended maintenance expenses. A focal discussion
with Ethiopian local dealers showed that new vehicle price
and repairing/maintenance cost plays a key role in the
owners’ scrap decision.
2. Methodology
Because of poor scrap data recording in Ethiopia, this
research used a set of models to predict the country vehicle
stock and scrap rates, and then total air emission in a time
series. The models used four important steps to calculate
the total emission as shown in the Figure 2.
Figure 2 Steps flow to calculate the total emission of
vehicles stock
Step 1: - Calculating Total vehicle ownership at
year i
Aggregate Time Series Models relate different
economic parameters, which could be found from statistical
records to estimate the overall car ownership. Comparing to
other models, this model requires less detailed data. Thus,
due to inadequate Ethiopian data recording system, this
model is used to calculate total vehicle population.
Total vehicle ownership at
year i
Survival rate of vehicles at
year i
Total scrap rate at year i
Total emission calculation at
year i
Step 1 Step 2
International Journal of Engineering Research & Technology (IJERT)
ISSN: 2278-0181http://www.ijert.org
IJERTV10IS010257(This work is licensed under a Creative Commons Attribution 4.0 International License.)
Published by :
www.ijert.org
Vol. 10 Issue 02, February-2021
728

The total passenger vehicle stock can be estimated by
using Gompertz function (Used by M.Wang et.al, 2006)
that may be expressed as tEF
e
st eVV=
(1)
Where:
iV -Vehicle ownership in year i (vehicles per 1,000);
sV -Ultimate saturation level of vehicle ownership
(vehicles per 1000 people);
tiEF
,- Represents the economic factor (per capita GDP) of
country i in year t;
and - Two negative parameters that determine the
shape of the S-curve. The increase of α and β would lead to
a steep S-shape curve against the economic factors.
The ultimate saturation level could be based on the
existing economic performance of countries and previous
trends seen in other countries. There are three typical
vehicle ownership trends in the last century; the North
American growth pattern that grows faster with the
increase of per-capita GDP and stopped at a level of 800
vehicles per 1000 people. The second is European which
the vehicle ownership growth shows comparatively slower
relationship with the total per capita GDP and reaches to
the level of 600 vehicles per 1000 people. The third is
Japan’s vehicle ownership trend that reaches 550 vehicles
per 1000 people.
To use the Gompertz function 2 , knowing the
saturation level of vehicle ownership is important. This
paper uses Button et. al (1993) ranges for low income
countries vehicle saturation of 300-450 cars/1000 people.
Thus, given the current economic situation and vehicle
ownership of Ethiopia, taking the lower value of 300
vehicles/ 1000 people is reasonable.
Model 2: Survival rate of vehicles at year i
To determine the scrap or retirement rate of vehicle
stock, it is necessary to determine the survival rate.
Different studies have estimated survival rate based on
different parameters explained in Table 1.
However, Okamoto’s model is important to estimate
survival rates based on the car stock, the maximum service
age of a passenger vehicle. This research assumes 30 years
as a maximum service age, given most research shows
service ages ranging between 15 to 35 years. Due to data
limitations, the authors chose the logistic function of
Hiroto’s model (2007), which is based on Greenspan and
Cohen (1999?) estimation models, to determine the
survival rate and scrap rate of Ethiopian vehicle stock. In
Greenspan & Cohen (1999) the main concept revolves
around determining the survival rate of vehicle stock by the
elasticity of the new sales unit.
2 Gompertz function is a type of mathematical
model for a time series, where growth is slowest at
the start and end of a time period.
Elasticity of scrap is assumed to be constant in terms
of sales in the year t
)/( mtt
t aP −= (2)
t: vehicle age at the year (to compare with the data
available)
M: maximum length of service year for passenger vehicle
(M=30)
a: constant ( elasticity of scrap in terms of sales in the
year )
p: survival rate p(0)=1, P(M)=0
In order to estimate M and a in the above equation is
converted in to Log form.
An average value ==
A (equation 3) is supposed to be
equal to the fixed value of alog and b and an average
value of ==
M (equation 4) is supposed to be equal to the
fixed value of M.
Therefore, the simultaneous equation of (equation 3
and 4) estimate alog and M. The author used
simultaneous equations to get the variable that expressed in
the form of a single variable.
−=
=====
tt t
tp
nMtp
nA
)(log1)(log
1 (3)
−=
======
tt tp
t
nAt
nM
)(log
11 (4)
==
A : Average value of various result of alog
(elasticity varies by country and by year) ==
M : Average value of various results of M
(maximum length of service year for passenger vehicle).
According to a sample survey at Kenyan vehicle inspection
center on 247 vehicles, most of the commercial trucks and
big public transport have longer service year and mileage
coverage.
n: the number of new cars sales ( in Ethiopian or
other developing case, it could be considered relatively new
vehicles with service age of 0-5 years).
Model 3: Retirement’s (scrap) rates,
Scrap or permanent retirement rate provides a
relationship of vehicles either in the form of a fraction or
fraction of vehicles surviving at specific age t. Therefore
the retirement rate R during the time period of △t that
begin at time t can be determined from the survival rate
(Su) ( Yan et.al, 2011):
( )( )
+−=
)(1,
tSu
ttSuttR (5)
International Journal of Engineering Research & Technology (IJERT)
ISSN: 2278-0181http://www.ijert.org
IJERTV10IS010257(This work is licensed under a Creative Commons Attribution 4.0 International License.)
Published by :
www.ijert.org
Vol. 10 Issue 02, February-2021
729

There are many factors that affect the vehicle
retirement rates both temporarily and permanently, such as
vehicle age, measure of service, economic considerations,
fuel price, emission test requirement, availability of spare
parts, etc. Greenspan and Cohen (1999) relate that “scrap is
favoured when the cost of repairs is relatively high in the
price of new cars”. Greenspan and Cohen (1999) also
mention that scrap could have an inverse relationship with
the price of gasoline as vehicles are less driven in this
condition.
Model 4: Total emission calculation at year i
Vehicle emission rate has a direct relationship with
the vehicle service age. Model of vehicles doesn’t represent
that the vehicle is old or new, rather the service age
explains the degradation of engine performance and air
pollution equipments. The total stock of vehicles could be
calculated by subtracting the scrapped from the total
estimated vehicles.
= existing vehicles by age+ imported vehicles by age-
scraped (either by age or by accident)
(6)
Based on the total vehicle stock estimation at time t,
the Yan et.al (2011) total emission model could be
employed to calculate the total emission E(t) in g.
sisi
i s
si EFFtVtE ,,, )()( = (7)
Where Fi,s are the fuel consumption ( in kg Vehicle-
1) and emission factor (in gkg-1) for vehicle of type I and
age s.
Both of the equations require an estimation of new
vehicles and fuel consumption, however, in the Ethiopian
case, we can consider that close to 95% of private vehicles
are used with fuel consumption of an average 10 kilometer/
liter.
3. Results and Analysis
National GDP per capita is usually used as an
economic parameter to estimate national vehicle
ownership; however it might not reflect the reality in
developing countries. Thus, this research narrows down the
focus on Addis Ababa city’s GDP rather than the country’s
total GDP. Besides, high income per capita disparity
among consumers distorts the real capacity of consumers to
buy new cars (including imported used vehicles).
According to UN data, the GDP per capita of Ethiopia has
increased from 116.9 dollars in the year 2000 to 318.7
dollars in the year 2008. Figure 3 shows the GDP per capita
growth and vehicle ownership have strong co-relation in
Ethiopia’s case.
Figure 3- Per-capita GDP and vehicle ownership rate from 2001/02- 2010
0
50
100
150
200
250
300
350
400
450
500
2001
/2002
2002
/2003
2003
/2004
2004
/2005
2005
/2006
2006
/2007
GD
P p
er
cap
ita
0
5
10
15
20
25
30
Veh
icle
ow
ners
hip
/1000 p
eo
ple
GDP per capita
vehicle ownership
International Journal of Engineering Research & Technology (IJERT)
ISSN: 2278-0181http://www.ijert.org
IJERTV10IS010257(This work is licensed under a Creative Commons Attribution 4.0 International License.)
Published by :
www.ijert.org
Vol. 10 Issue 02, February-2021
730

Figure 4. Vehicle stock estimation till 2001-2015 based on Compertz’s function
Based on GDP per capita and private car ownership
growth rate, the total vehicle stock of the city at different
years is calculated as shown on Figure 4. The total vehicle
stock is estimated assuming that the rate of average
GDP/capita growth and the average vehicle ownership
growth rate between 2006 and 2009 stay the same till 2015.
By using the logistic function equation (2), it is possible to
calculate the survival rate vehicles at different age.
Vehicles are usually considered as fixed assets in Ethiopia
and this extends the vehicle life expectancy further to
protect the asset value. Usually, vehicles survive 20-40
years in Ethiopia but for this study 30 years is considered
as shown in Figure 5. This wider range of survival rates
have its own impact on the total air pollution. Besides, lack
of regular maintenance and high vehicle-kilometres
travelled (private automobile is more than 20,000 km-year
for private and 62,000 km-year for public) further
exaggerates its environmental impact.
Figure 5. Survival rate percentages for 1000-1300 cc private vehicles
0%
10%
20%
30%
40%
50%
60%
70%
80%
90%
100%
1 3 5 7 9 11 13 15 17 19 21 23 25 27 29
Vehicle age
Su
rviv
ial
rate
2006
2001
2003
0
10000
20000
30000
40000
50000
60000
70000
2001/2
002
2003/2
004
2005/2
006
2007/2
008
2009/2
010
2011/2
012
2013/2
014
Priv
ate
Ve
chic
le s
tock
es
tim
atio
n
Estimation
Existing stock (assuming the cityoccupy 64% of countriesprivate car)
International Journal of Engineering Research & Technology (IJERT)
ISSN: 2278-0181http://www.ijert.org
IJERTV10IS010257(This work is licensed under a Creative Commons Attribution 4.0 International License.)
Published by :
www.ijert.org
Vol. 10 Issue 02, February-2021
731

Figure 6. Comparisons of vehicles survival rates in different countries (Wang et.al, 2006)
Figure 7. Vehicle scrap rate at time t
Figure 6 shows that China’s survival rate swiftly changed
because of regulation and have shown positive results in
emission reduction. However, further consideration should
be taken to minimize negative externalities of the emission
reduction policy on economic and social wellbeing. Thus, it
is advisable for developing countries to take a step by step
protection and restriction on the survival rate of vehicle
through different policy instruments such as taxation and
inspection. The higher the survival rates of old vehicles,
the greater the impact on overall public health of the city
dwellers and pedestrians (accounts to 54% of totally
mobility3) are affected outdoor air pollution.
The scrap rate could be calculated by using equation
(5). The scrap rate differs from country to country and on a
yearly bases, however ,this study uses an average survival
rate constant to calculate the scrap rate at time t, and the
result is shown on Figure 7 (for the sake of simplicity up to
15 years of service is considered).
Therefore, as Figure 8 shows, the total vehicle stock in
the country by age group is calculated based on the three
models and the total stock equation expressed in equation
3 World Bank Project Information Document on
Addis Ababa Transport (2016)
(6). The scrapped vehicle data is difficult to find in
Ethiopia, hence, this research used only registered and
licensed vehicles. Besides, the research ignored vehicles
scrapped as a result of an accident, as the opportunity for
the damaged car to be overhauled and reuse is very high.
By using equation (7) it is possible to calculate the
total emission at different years. However, the emission
factor has to be adjusted to the context of the country. Yan
et. al. (2011) also mentioned that emission factor can be
presented as a mass-based (eg. Grams of pollutants per
kilogram of fuel) or service-based emission factor (eg.
grams of pollutant per kilometre driven). Usually the
emission factor increases with the age of vehicle. He also
summarizes the emission factor by using baseline emission
factors for U.S. and European standards and by using the
degradation rate for used vehicles. Averaged emission
factors as 1.7 g /kg fuel from data reported by EEA (2002)
for Euro I, and as 1.3 g/kg fuel for the US standard. Then,
emissions increase linearly with a rate depending on
technology during degradation phase. During the final
years of vehicle service, emissions maintain a maximum
level. 0.04 g kg_1-fuel/year for pre-baseline standards and
0.005 g kg_1-fuel/year for post-baseline standards could be
considered as degradation rate.
0.00%
10.00%
20.00%
30.00%
40.00%
50.00%
60.00%
70.00%
80.00%
90.00%
100.00%
1 3 5 7 9 11 13 15 17 19 21 23 25 27
scrappage percentile
International Journal of Engineering Research & Technology (IJERT)
ISSN: 2278-0181http://www.ijert.org
IJERTV10IS010257(This work is licensed under a Creative Commons Attribution 4.0 International License.)
Published by :
www.ijert.org
Vol. 10 Issue 02, February-2021
732

Figure 8 2002/03 imported used car vehicle stock at different time
Figure 9 total used cars vehicle emission imported in 2002/03
Table 1 European Emission Standards for passengers cars g/km
Therefore, based on the existing stock of vehicles and expectation of 10% annual importing of vehicles out of which 85 % is
used vehicle, and the survival rate described above, it is possible to calculate the emission based on the stock of vehicles
Hirota (2007) has also used cohort model to estimate the passenger car ownership that eventually used in the analysis of
emission reduction. His analysis could help to understand and determine how much the share of vehicle control by vehicle
regulation, such as environmental labelling of the vehicles. The model uses the concept of survival rate to estimate emission
from car stocks.
However, this study used a time range of 0-5, 5-10,
10-15, >15 years. And based on the above baseline
emission factor and degradation rate, four emission factors
are calculated to suit each time range and the total emission
from the vehicles from 2002/03 to 2015 as shown in the
Figure 9. Therefore, the following emission factors used to
estimate the total emission; 1.3 g/Kg, 1.7 g/kg, 1.98 g/kg
and 2.1 g/kg respectively to the time –range mentioned
above. Besides the fuel efficiency also decreased through
time and it is calculated as an average of 14 km/ Kg,
12km/kg, 10km/kg and 8km/kg respectively to the time
range.
7. CONCLUSION
This paper has shown the relationships between
vehicle survival rate, total emission, and fuel consumption.
The result and analysis of estimation models entails that the
older vehicles accounts for a large percentage of the total
emission. Therefore, governments should introduce new
regulatory policy instruments to inhibit the usage of less
efficient imported used cars such as employing pre-
1 y
ear
3year
5 y
ear
7 y
ear
9 y
ear
11 y
ear
13 y
ear
15 y
ear
17 y
ear
19 y
ear
21 y
ear
23 y
ear
25 y
ear
27 y
ear
29 y
ear
0 - 5
>15
02000000
4000000
6000000
8000000
10000000
12000000
14000000
16000000
18000000
tota
lem
issio
nin
gra
ms
per
year 0 - 5
5-10 year
11 – 15
>15
0
1000
2000
3000
4000
5000
6000
7000
8000
1 yea
r
4 ye
ar
7 ye
ar
10 yea
r
13 yea
r
16 yea
r
19 yea
r
22 yea
r
25 yea
r
28 yea
r Nu
mb
er
of
Veh
icle
in
each
ag
e
gro
up
>15
11 – 15
5-10 year
0 - 5
International Journal of Engineering Research & Technology (IJERT)
ISSN: 2278-0181http://www.ijert.org
IJERTV10IS010257(This work is licensed under a Creative Commons Attribution 4.0 International License.)
Published by :
www.ijert.org
Vol. 10 Issue 02, February-2021
733

shipment inspection, environmental policing, and
introducing environmental based taxation systems.
Understanding the vehicle survival rate and associated the
total emission emitted in total lifetime is useful for
policymakers to make a learned and informed decision to
choose the right regulatory as well as economic mitigation
instruments. Furthermore, to minimize outdoor pollution,
the author also encourages facilitation for free taxation and
other incentives to green transportation such as electric
vehicles and scooters. Hence, government policy makers
should look at long-term effects of transportation planning
and management, especially in calculating cost benefit
analysis for the incentive they provide to used car
importation.
REFERENCE
[1] De Jong et. al, 2004, A comparison of car ownership models.
Transport Reviews, 24 (4). Pp. 397-408. ISSN 1464-5327
[2] Briggs, David, 2003, Environmental pollution and the global
burden of disease, British Medical Bulletin; 68: 1–24 [3] Feeney, Bernard P. 1988, Car longevity in Sweden: a revised
estimate, Transportation Research A, 22A No 6, pp. 455-465 [4] M Wang, H. Huo, L.Johnson, D.He, 2006, Projection of
Chinese Motor Vehicle Growth, Oil Demand, and CO2
Emission through 2050, Argonne National Laboratory[5] Yan, fang; Winijul Ekbordin; Jung, Soonkyu; Bond Tami;
Streets, David, 2011, Global emission projections of particulate
matter (PM); I. Exhaust emission from on-road vehicles, atmospheric environment, doi:
10.1016/j.atmosenv.2011.06.018
[6] Hirota, Keiko, Policy for better air quality in Asia: proposal for a policy evaluation method for four ASEAN countries, studies
in regional science. Vol.28 No 4, pp 1093-1104
[7] Hayashi, Yoshitsugu; Kato, Hirokazu; Teodoro, Rene; 2001, Journal of the Eastern Asia Society for Transportation Studies,
Vol 4, No 5
[8] Greenspan, Alan; Cohen, Darrel, 1999, The Review of Economics and Statistics, 81(3); 369-383
[9] Walker, F. 1968, Determinant of Auto Scrappage” Rev. Econ.
Statist, 50, 503-506[10] Zachariadis, T., Samaras,Z., K.-H., 1995 Dynamic modeling of
vehicle populations: an engineering approach for emission
calculations. Technological Forecasting and Social Change 50, 135-149
International Journal of Engineering Research & Technology (IJERT)
ISSN: 2278-0181http://www.ijert.org
IJERTV10IS010257(This work is licensed under a Creative Commons Attribution 4.0 International License.)
Published by :
www.ijert.org
Vol. 10 Issue 02, February-2021
734