Economic Geography “Development” Cultural Geography C.J. Cox.

WHAT IS THE IMPACT OF TRANSPORT SCHEMES ON ECONOMIC GEOGRAPHY? SUMMARY OF POSITION IN DfT GUIDANCE, AND SUPPORTING EVIDENCE 1. Introduction
Background 1. The impacts of potential improvements to transport networks are appraised by DfT
using its WebTAG guidance, in line with HMT’s Green Book appraisal guidance.
The resulting evidence informs the five cases used to present the business case
for potential improvements, as set out in DfT’s ‘Transport Business Case’1, which
itself follows HMT’s ‘five case’ investment appraisal guidance.
2. The Department adopted ‘The Transport Business Case’ in April 2011, as its basis
for informing Ministers’ decision on transport investment options, superceding the
‘New Approach to Appraisal’. This five case approach shows whether schemes:
• are supported by a robust case for change that fits with wider public policy
objectives – the ‘strategic case’;
• demonstrate value for money – the ‘economic case’;
• are commercially viable – the ‘commercial case’;
• are financially affordable – the ‘financial case’; and
• are achievable – the ‘management case’.
3. The economic case aligns closely with the familiar NATA approach of cost-benefit
analysis, and multi-criteria impact assessment. Impacts are presented in the
Appraisal Summary Table, and translated into a Value for Money Assessment,
using the established DfT VfM process2.
4. The appraisal approach in the economic case involves estimating all impacts of the
scheme (i.e. the ‘welfare’ approach advocated by economics), whether or not they
1 http://www.dft.gov.uk/publications/transport-business-case/ 2 http://www.dft.gov.uk/publications/value-for-money-assessments-guidance

directly take the form of measured economic activity (i.e. GDP3). This is the
established requirement for government appraisal, as set out in HMT’s Green
Book, and is not in question.
5. However, there is often interest in understanding the impacts of a proposed
scheme which take the form of measured economic activity, and in particular, what
the impact of a scheme will be on ‘economic geography’ – locally, regionally, and
nationally. For example, the ‘strategic case’ asks what the case for action is, and
how well a proposal fits with wider government objectives. Government objectives
favouring higher GDP at the national, local or regional level, therefore mean that
information about possible GDP impacts can be called for in assessing a proposed
scheme’s strategic case. Also, there have been recent examples of scheme
promoters offering estimates of local GDP impacts.
6. The relationship between welfare impacts and GDP impacts was set out in the
2005 DfT discussion paper ‘Transport, Wider Economic Benefits and Impacts on
GDP’4. This showed how the ‘traditional’ impacts measured in transport appraisal,
along with the then ‘new’ wider economic benefits, could be viewed in welfare and
GDP terms.
3 Throughout this paper, ‘GDP’ and ‘economic activity’ are taken as interchangeable. 4 http://webarchive.nationalarchives.gov.uk/+/http:/www.dft.gov.uk/pgr/economics/rdg/webia/webmethodology/sportwidereconomicbenefi3137.pdf

Figure 1: Welfare and GDP impacts
7. Also, the way that the evidence on a scheme’s impacts gathered through a
WebTAG appraisal can feed into the five parts of a business case is summarised
below.

Figure 2: ‘The Transport Business Case’ Evidence Framework
Purpose, scope, and status
8. The overarching question addressed in this paper is: What is our current
understanding of the impact of transport schemes on the size, nature, and
distribution of economic activity? This is not a new question, and the
Department has previously provided its view on this in various reports, at various
times. Also, it has distilled its assessment of how these effects should be included
in the appraisal of transport schemes into WebTAG guidance (most recently the
Wider Impacts guidance).

9. However, as explained further below, finding the answers to the questions
underlying this involves accessing knowledge from various of these sources.
Hence this paper aims to summarise in one place the Department’s
assessment of the answers to this question in general, in line with the
guidance in WebTAG on how to include these effects in appraisal, to assist those
in the Department involved in assessing the business case for specific proposed
transport schemes, where they deem such information relevant (such as in a
strategic case).
10. It therefore does not attempt to record or explore every piece of evidence on the
subject, and it is not intended to be an academic paper. Importantly, while many of
the questions we ask here push at the edges of the capabilities and understanding
of transport modelling and economics, the paper does not intend to solve currently
unsolved issues and challenges. Lastly, it does not attempt to draw conclusions
for any specific scheme.
11. The paper’s focus is on measured economic activity, i.e. GDP. Although the
assessment of a scheme’s full economic case is concerned with all impacts
(whether they impact directly on GDP or not) this paper is likely to be relevant
when assessing evidence put forward about the GDP element of a scheme’s
economic case. It is also likely to be relevant for a scheme’s strategic case, where
local, regional, or national economic geography impacts (additional or
redistributive) may be relevant.
12. This paper (including annexes) does not constitute guidance to scheme promoters,
nor does it supercede any part of the Department’s ‘Transport Business Case’,
WebTAG, Value for Money, or other guidance.
13. Conclusions are summarised, in Q&A form, in section 3 (p).33)
The questions
14. The above overarching question is broken down into the following sub-questions,
which often arise as questions of interest in considering a potential transport
investment:
A: Impacts:
• Do transport schemes lead to greater economic activity (i.e. higher GDP)
overall?
• Do they lead to changes in economic activity location?
• Where business relocation and new economic activity opportunities are to be
expected:
- Will the transport scheme alone deliver them? Or are further
investments/decisions required?
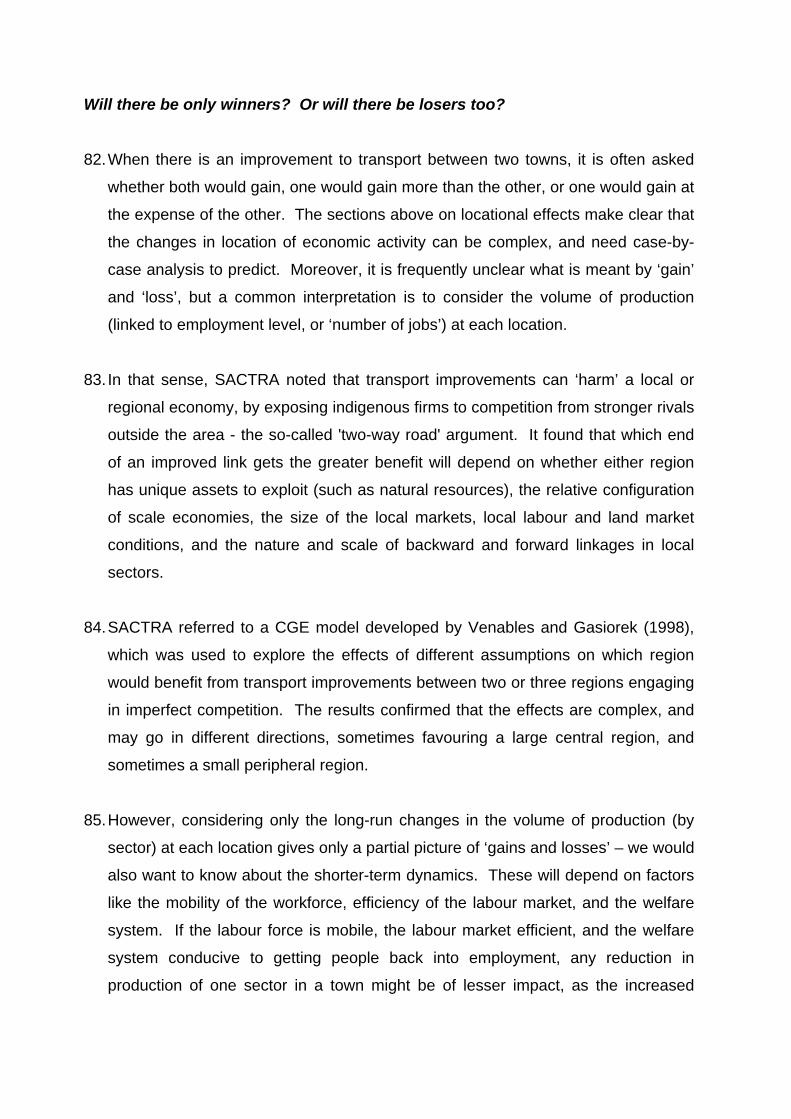
- Will there be only winners? Or will there be losers too?
• Have ex-post studies of transport schemes been able to show the existence of
impacts on business location and new economic activity opportunities?
B: Measurement:
• Do the Department’s standard CBA and transport modelling approaches
capture the full (net) impact of a scheme on national economic activity?
C: Regeneration & Employment:
• Do transport schemes help with regeneration?
• Do they boost employment in a regeneration area?
D: Size of scheme:
• How do the answers to these questions vary with size of a scheme’s relative
impact on connectivity?
Approach, evidence sources, and structure ,,
15. The impact of the transport network on economic activity has been studied for
many years, generating a large volume of evidence. The Government has
investigated this and published conclusions on a number of occasions. The 1977
ACTRA report, 1999 SACTRA report, and the 2006 Eddington report considered

the available evidence exhaustively, providing a framework for understanding
these effects, and clear statements of the Government’s conclusions on the
evidence. The Department distilled its conclusions on these matters into its
WebTAG guidance5.
16. This paper relies on these reports and ensuing WebTAG guidance, supplemented
by other surveys of the evidence, with examination of specific studies only when
necessary to illustrate the conclusions further. It does not attempt to examine and
critically assess every detailed study, nor does it aim to explore detailed reasoning
on every subject it looks at.
17. This paper is structured around the questions above. For each question, it
summarises the key points in the Department’s assessment of the evidence, and
its guidance on how to assess the impacts in question. It also considers to what
extent an answer can be given to the question in general, or can only be assessed
on a case-by-case basis, following WebTAG guidance. For question D, however,
the answers are brought out as far as possible within the discussion of questions A
to C.
18. In practice, the answer to any one of these questions requires an understanding of
the evidence on some, or all, of the other questions, as the evidence and issues
overlap considerably. Where this is particularly relevant, cross-references are
included.
5 See WebTAG units 2.8D and 3.5.14D – these are ‘in draft’ at the time of writing, pending a decision to make them ‘definitive’ in June 2012

2. Key evidence to answer the questions
Do transport schemes lead to greater economic activity (i.e. higher GDP)? Do they lead to changes in economic activity location? 19. This section summarises the key points from economic theory underpinning the
Department’s assessment of the evidence for this question. It then looks at
evidence on the possible scale and degree of certainty over such effects, from ex-
ante modelling, and ex-post evaluation studies.
Theory Overall scale of economic activity 20. Both ACTRA and SACTRA established that there are strong grounds, on the basis
of economic theory, to expect an improved transport network to boost GDP. Such
an improvement reduces the costs of economic production (i.e. it increases the
efficiency with which factors of production are combined to generate goods and
services). This increases overall GDP.
21. The Eddington Study extended these arguments to include the role of transport in
facilitating geographic division of labour and specialisation, and also structural
economic change by supporting the internal migration and labour market flexibility.
It broke the overall effect down into a series of mechanisms, which can be
summarised as:
Costs and speed or travel time – specifically, the time spent travelling and the
economic value of travel time savings. Travel time savings to users from improved transport is a key area in which benefits to the economy can be accrued from transport improvements, although quantifying the impacts of journey time savings in terms of economic growth is recognised as being difficult.
Journey time reliability – this is important to business freight as well as
business travellers and commuters.
Network coverage or “connectivity”. Network connectivity enhancements can help people and goods travel more quickly (i.e. linked to journey time and journey time reliability), as well as open up new destinations and new journeys.

Comfort and quality. Lack of comfort, particularly relevant to public transport, can deter journeys at particular times or by certain modes (e.g. overcrowding), whilst it can also impact on productivity at work for commuters.
Safety and security – this is important not only due to loss of output from
workers but for the costs associated with disruption to networks through journey time reliability.
22. Of course, the above analysis of a transport improvement’s impact on GDP
assumes that the improvement is in a place that is actually useable in economic
production, and that at least some of the efficiency gains are experienced by those
conducting activities in the traded economy.
23. Nonetheless, it is clear that improvements to transport networks which boost the
efficiency of productive processes in the measured economy will increase GDP.
However, at the national level, it is important to ensure this increase in GDP is not
outweighed by the reduction in GDP caused by the use of resource in delivering
the improvement (and, as stressed at the outset, the broader question of whether
the overall benefits exceed the costs is the most relevant one when considering
the economic case and value for money of a proposed scheme).
Location of activity
24. SACTRA argued that an improved transport network would also change the
optimal location for production and patterns of distribution, by changing the costs of
operating from, or supplying to, each location. Firms could choose to relocate to
lower cost (or more productive) areas, and/or change the areas they supply goods
and services to. Also, workers could change where they work, and / or live and
consume. So, within the overall net increase in GDP, there is likely to be some
relocation of production, consumption, distribution, and population.
25. However, this relocation of activity is not necessarily purely redistributional.
Following SACTRA, DfT published its 2005 Discussion Paper on Wider Economic
Benefits and Impacts on GDP. This set out a framework of ‘Wider Economic
Benefits’, aimed at capturing a number of welfare and GDP impacts which would
not be captured by ‘traditional’ appraisal methods. Two types of wider impacts

were identified: those that affect GDP referred to as GDP effects; and those that
affect wider welfare issues, referred to as Wider Benefits. Overall, there are
seven aspects of WIs to be considered:
increased labour force participation (GDP1) people working longer (GDP2) jobs moving to more productive areas (GDP3) agglomeration benefits (WB1, GP4) increased competition (WB2) imperfect competition (WB3) exchequer consequences of increased GDP (WB4).
26. The first four impacts listed contribute to economic output. The final three generate
increased economic welfare to individuals, but do not contribute to economic
growth.
27. These impacts were accepted into WebTAG, in the Wider Impacts guidance.
Annex A explains the meaning of each of these wider impacts, but the key point
here is that:
a. There can be economic benefits from the relocation of economic activity,
reflecting e.g. increased specialisation or other improvements in
productivity; and,
b. These wider impacts should, in principle, fully capture a transport
scheme’s effects on the location of economic activity - but, as we will
shall see later, whether or not in practice the appraisal of a specific
scheme does so is not straightforward.
Modelling: ex-ante evidence
28. Estimates of changes in the location of economic activity, and the breakdown of
economic activity between sectors, resulting from transport improvements can in
principle be provided by LUTI and CGE models (respectively). Recently, a class of
‘new real economy’ models, such as those of KPMG and SERC have been
developed, with the aim of showing both sectoral and locational impacts. This
section considers what these models, and their applications, can tell us in general.
about the likelihood and possible scale of impacts on economic activity.

29. It is important to be clear at this point about the relative maturity of the modelling
and appraisal methods used for the ‘traditional’ transport user benefits, and those
which aim to estimate additional GDP effects. The former, although always a
subject of discussion and refinement, is relatively mature; whereas, methods to
estimate additional GDP impacts are still in their infancy.
30. SACTRA looked at LUTI and CGE models. It concluded that while they had some
reservations about the assumptions made in terms of the operation of markets in
such models, as well as the data and estimation implications, they believed that
LUTI models were worthy of further development. It also recommended that the
Department develop a CGE model. The Department responded that it did not
intend to require LUTI modelling in its appraisal guidance, nor did it believe there
was a strong enough case to develop a CGE model.
LUTI models and their applications
31. There are very few LUTI packages readily available in the UK. Until recently, the
main contenders have been the MEPLAN package and the DELTA package.
However, the current and future availability of MEPLAN is now in considerable
doubt. Also, LUTI models are complex, as they try to estimate how households,
population, and employment respond to a transport scheme. They start with
national accounts input-output data on production and consumption flows by
economic sector, and add assumptions about how changes in the relative
productivity of sectors will cause production and consumption of sectors to change
(often derived from external data sources). Together, these can be used to
simulate the impact of an intervention that reduces the costs of production in some
sectors (such as a transport improvement), estimating how it would cause
production/consumption in each sector to change, including the knock-on effects
between sectors. For example, such a model could show how lower transport
costs in one sector could cause it’s production to rise, increasing demand for its
inputs from other sectors. This would result in a rise in production in those other
sectors, but also the costs of those outputs, tending to diminish the initial increase
in demand. For example, the DELTA model incorporates models of output, trade,
labour and housing markets, and interfaces with a conventional transport model.

However, there have been applications of these models since the SACTRA report
was published, enabling the modellers to refine their methods.
32. LUTI modelling has been used to address two issues: strategic land use planning;
and transport policy and project appraisal. In particular, the DELTA model has
been quite extensively used in London and in Scotland.
33. In London, the model – known as LONLUTI – was subject to a form of peer review
to provide an independent assessment of the models capabilities. A paper
summarising the work of the peer review group was presented to the 2009
European Transport Conference. The paper highlighted the differences in the
approach to calibration and validation of the land use and transport elements of the
model, but concluded that the combined model provided a better basis for
understanding the impacts of major schemes than would be provided by a free
standing transport model.
34. The LONLUTI model was used to examine the impact of a number of large scale
transport projects or policies. The peer group concluded that the impacts on land
use of quite major schemes were ‘quite small’. For example, impacts on
employment were typically of the order of 1-2% (note, however, that these
percentages are likely to be based on large base figures, and could be significant
in absolute terms). At these levels, considerable care is needed to avoid being
misled by model noise and anomalous model responses.
35. Within the context of the present enquiry, it is worth noting that a key
recommendation of the peer group is to reconsider the assumption that study area
land use totals are fixed, since this means that increases in one location have to be
offset by reductions elsewhere.
36. The DELTA model for Scotland – TelMOS – has been developed to examine
strategic planning and transport infrastructure policies. Application to major
transport proposal suggest that the model’s outputs are plausible. Impacts on land
use tend to be modest, though – at around 3-4% - a little greater than those from
LONLUTI.

37. It might be argued that the larger a scheme’s impact on the relative connectivity
within a study area, the larger should be the impact on land use, and resulting
GDP impacts. However, HS2 Ltd reported6 that GreenGauge 21 considered the
scope for wider economic impacts from a large HSR network in the GB, including
the potential for land use change, using a version of DELTA to model the impact of
accessibility change on employment in different zones. They concluded that, while
wider economic impacts could add up to 20% benefits to the traditional transport
appraisal, the bulk of these impacts came from the ‘conventional’ assessment of
Wider Economic Impacts, and not changes in land use driven by high speed rail.
The implication is that even for as large a scheme as the HSR network considered
by GreenGauge21 (considerably larger than the currently proposed HS2 scheme),
large-scale land use change (and resulting GDP impacts) should not necessarily
be expected.
38. The 2005 Crossrail Economic Appraisal is also worth including in this section -
although it did not use a LUTI model, it used an alternative approach in its place.
In a forthcoming paper to the ITF December 2011 Round Table (The Evolution of
London’s Crossrail Scheme and the Development of the Department for
Transport’s Economic Appraisal Methods), Tom Worsley of ITS Leeds explains
that the Crossrail appraisal estimated the full set of Wider Impacts, but as no
suitable LUTI model was available, an alternative approach was used to estimate
the responses of firms and workers to the reduction in the costs of access to
central London, and resulting economic benefits.
39. The benefits of agglomeration using the Department’s estimate of the change in
productivity with respect to effective density were estimated at £3.1bn, an addition
of 20% to the benefits of the scheme. Using an elasticity of estimated by TfL’s
consultants, the value increased to £4.5bn. The increase in labour force
participation was estimated using the labour supply elasticity value, wage levels
and tax rates set out in the 2005 Paper and estimates of changes in commuting
costs derived from the model. A further addition to the benefits from the 6 High Speed Rail – London to the West Midlands and Beyond; HS2 Demand Model Analysis, Appendix 3

conventional estimate was the effects of imperfect competition, restricted to
changes in travel time for those travelling on business. These two additions made
up a further £0.8bn of benefits.
40. .To estimate the effect of job relocation (without a LUTI model), TfL assessed the
extent to which the lack of transport capacity constrained the growth of
employment in Central London, and hence how Crossrail would lift the constraint
on the expansion of Central London employment.
41. A forecast of Central London employment to 2026 based broadly on past trends
was established and this forecast was assumed to be unconstrained by the
transport network’s capacity. Having established an unconstrained forecast of
employment, the next stage of the analysis was to estimate the extent to which
prospective commuters would be crowded off the network. Analysis of cordon
crossings and of select links on the underground and rail networks showed a clear
relationship over time between growth in demand and the level of crowding, with
evidence of growth being constrained by crowding. From this it was possible to
estimate a constrained growth scenario, and a less constrained alternative with the
Crossrail scheme in place. Since the increase in the labour supply had already
been estimated using the elasticity based approach, all of the increase in Central
London’s employment attributed to the relaxing of the capacity constraint was
attributed to people moving from other locations to more productive Central
London jobs. The result was an estimated of £3.2bn of benefits from the shift to
more productive jobs on account of the capacity provided by Crossrail (using the
Department’s estimate of a 30% premium on output per job in Central London).
42. The inclusion of these wider impacts increased the overall BCR in the Crossrail
2005 business case from 1.80 to 2.60, with a range of 2.3-3.2 based on different
assumptions about the elasticity and other values used in the estimates of these
wider benefits.
43. Aside from the total effect, LUTI models have also given some evidence on the
possible direction of impacts. Mike Mann’s paper inputting to the Eddington report
“Step Change Transport Improvements: An Assessment Of The Potential For 'Step

Change' Transport Improvements To Generate Wider Economic Benefits”
reported that land-use modelling of the high speed rail link proposal in South Korea
suggested it should result in some dispersion of employment and economic activity
from Seoul towards other cities made more accessible through the high speed link
CGE models and their applications7
44. The Department’s guidance does not call for CGE modelling to be employed in
estimating wider impacts, such as relocation effects. However, it is still potentially
instructive to consider what can be learned from them.
A CGE model has some similarity to a LUTI model in that it has an economic model of
production and consumption, known as a Social Accounting Matrix, but goes further in
distinguishing between households, government, and industry The strength of CGE
models over the input-output model (in a LUTI) is that it allows prices and wages to
rise with increased demand thereby crowding out growth/output in other sectors
(reflecting the supplied side constraints faced by a real economy). Furthermore
general equilibrium modelling allows substitutability between capital and labour and
also if well developed between transport intensive and non-transport intensive modes
of production. Both internal and external economies of scale can be incorporated into
a CGE model. They also have the added advantage of working at a micro level
thereby giving indicators of welfare at a household level - which is useful in a CBA
framework. The difficulty with CGE is picking up the migration of people and
economic activity. This is circumvented in some applications by having large zones
(so migration is all intra-zonal).
45. However, CGE models are very complex to create, rely on externally calibrated
elasticities, and do not always have a spatial dimension to them. The application
of CGE modelling to transport has been very limited, and there are uncertainties
about whether the approach can be applied to assess economic impacts of specific
transport schemes. Also, there are difficulties in integrating transport models with
7 This section has particularly benefitted from the expert input of James Laird of ITS Leeds.

CGE models. (Note that as LUTI models also use a regional economic model
based on input-output tables, much of the above can apply to LUTI models too).
46. A recent example of this approach is the development by consultants Steer Davies
Gleave (SDG) of a Computable General Equilibrium model – Spatial Economic
Consequence of Transport (SpECTra). SDG argues that, based on standard
outputs from transport appraisal and published official statistics, the model can
help to understand how a scheme affects the economy ‘on the ground’. Time
savings to business travellers, for instance, are converted into productivity gains to
the firms employing them – giving a boost to their production. This in turn forces a
reduction in prices, which ensures demand for their products keeps up. In order to
increase production, the firms will increase the use of labour and other inputs,
bidding up the price for those. Households are better off because of a combination
of higher real wages, lower prices and, ultimately, higher consumption. The final
outcome is a composite of all these effects. SDG note that the model is focussed
on understanding the distribution of impacts of a transport scheme across locations
and economic sectors, but does not generate additional benefits at the national
level.
47. Although the above provides some insights to the possible effects of transport
schemes that could be looked for, our review of CGE evidence at this point has not
revealed any applications to transport schemes. Hence, there is little information
on scale or likelihood of economic impacts of transport schemes in general to draw
from here.
‘New Real Economy’ models, and their applications
48. There has recently been development of a modelling approach which is neither
LUTI, nor CGE, but aims to show both economic sector, and locational, impacts of
a transport scheme, within an area of interest to the scheme promoter. This work
includes a study of the trans- Pennine corridor by the Spatial Economic Research
Centre (SERC) at the London School of Economics for the Northern Way, work
looking at a national high speed rail network by KPMG for Greengauge 21, as well
as unpublished work by KPMG for GMPTE looking at enhancements to urban

public transport. Each of these pieces of work has produced estimates of GDP
growth, although they have not followed the methods set out in the WebTAG Wider
Impacts guidance.
49. KPMG’s modelling of economic output effects by zone has two strands to it. Firstly
they estimate productivity impacts in zones arising from increased agglomeration,
and secondly they estimate re-distribution of economic activity between zones.
Their experience is that, at a local level, re-distribution effects are the largest
component of the economic impact. As most of their analysis has been within a
local or sub-national area they tend to find that employment related GDP gains
dominate the analysis.
50. KPMG report findings that the productivity impact is both from increasing
productivity within sectors, and altering the sectoral mix of business activity. Their
employment density model is used to estimate the increase in employment at
locations which have been affected by changes in rail accessibility. An analysis of
the proportion of each business sector that is mobile at the local and regional
levels is then used to estimate where this business activity relocates from. As
mentioned above this re-distribution can lead to significant local GDP impacts
being reported.
51. SERC has also estimated the labour productivity impacts of increased accessibility
to economic mass by rail and by road. The model estimated has some similarities
to the KPMG model, but does differ in that the SERC model uses a measure of
accessibility to economic mass comparable to the one suggested by the DfT’s
WebTAG guidance.
52. SERC distinguishes between whether the observed spatial variation in productivity
arises as a consequence of a people based effect or a place based effect. The
place based effect refers to the fact that a particular location is inherently more
productive than another location due to (for example) agglomeration economies,
whilst the people based effect refers to the act that some people are more
productive than others irrespective of where they live. A transport improvement can
therefore improve productivity by enhancing the place based effect (increasing

agglomeration) or by inducing high quality labour to migrate to the city (the people
based effect), or through a combination of both of these effects. The people based
effect is therefore a productivity effect arising through re-distribution.
53. SERC also estimates a separate model which suggests that local GDP impacts
can be very large due to re-distribution effects. It also demonstrates that there will
be winners and losers in terms of changes in economic output at a local level. It
indicates that re-distribution of workers between areas is a much more significant
impact than changes in output per worker (productivity). A particular feature of
some of SERC’s modelling is that it assumes varying productivity of firms within
each area, so that greater accessibility between areas leads, through competition,
to ‘winners and losers’ by sector in each zone.
54. The work by KPMG and SERC indicates that redistribution of economic activity can
affect economic output at a local or sub-national level, and is usually a much
greater impact of transport provision than the impact on increasing productivity per
worker. Productivity differences between agglomerations principally arise due to
people based effects. That is the most productive people locate in the largest
agglomerations. Transport policy by re-distributing these productive people
between different locations in the UK can therefore substantially affect local
productivity, but potentially have offsetting impacts in other locations.
55. However, as with all work in this field the challenges of reverse causality and
confounding effects remain a considerable risk, especially in simulation /
forecasting which assumes all observed correlation between accessibility and
economic activity is causal. Also, the estimated impacts from these models and
studies implicitly assume other investments and decisions are made. For the
‘economic potential’ predicted by these studies to be realised it is necessary that
the observed correlation between accessibility and economic activity is indeed
causal. They therefore implicitly assume that:
• Transport investment will act as a catalyst for economic growth; • Land uses and availability are fully flexible; • Other investments and decisions will follow the transport investment.

56. Clearly any of these requirements may be violated in reality for a variety of
reasons. So insights about the scale and likelihood of GDP impacts from this
approach should be treated with considerable caution.
Evaluation studies: ex-post evidence
The above sections gave some insights to the possible scale and likelihood of the
economic benefits arising from the relocation of economic activity due to a transport
scheme from ex-ante analysis. This section now considers what insights ex-post
evaluation evidence can provide.
Macro studies
57. A number of ‘macro-level’ empirical studies have looked at the relationship
between public infrastructure investment and GDP growth at the national level.
Eddington showed that on average these studies have indicated that a 10 per cent
increase in public capital stock increases GDP by around 2 per cent. Looking
more specifically at transport, RAND’s survey of such studies found that spend on
transport infrastructure was associated with greater GDP, though the effect was
stronger in developing nations.
58. However, although many of these ‘macro’ studies are informative and shed some
light on the relationship between transport and the performance of the economy,
the method of analysis does not establish the direction of causality. Added to our
expectation that the impacts of schemes would be very specific to their context,
these studies are of limited use as evidence for the questions in this paper.
Scheme studies 59. ACTRA looked at ex post scheme studies in US, Italy, France, Germany,
Scandinavia, London, and found scant evidence of economic restructuring. It
argued that the Severn Bridge showed changes in accessibility of an unusually
high order, but little effect on business location (though noted the study only looked
at the first three years after the bridge opened).

60. SACTRA concluded that there are few, if any, ex-post studies that successfully
identify economic geography impacts in a sufficiently rigorous way. This is
perhaps not surprising, given the cost, data collection requirements, forward
planning, and complexity involved in a study that both measures GDP before and
after a transport improvement, and can compare the after case to a suitable
counterfactual. They are often undertaken not long after a scheme has opened,
which makes data less robust and the benefits less visible.
61. The ITF provided a world-wide survey of ex-post studies, which tended to confirm
the picture that most studies do not provide clear answers to the questions we are
addressing here. Specific UK studies include the M25, M62, M40, A55, Severn
Bridge, and Humber Bridge. These were able to provide commentary on the
before and after economic pictures, often from surveys of businesses, but were not
able to conclude what the GDP impacts had been. The DfT study of the
Manchester Motorway Box involved before and after surveys of traffic, and
transport modelling work, to identify the induced traffic impacts of the scheme, but
was not intended to measure GDP or other economic geography impacts.
62. In his ITF Round Table paper, Tom Worsley summarises the findings of an
extensive impact study of the Jubilee Line Extension (JLE), which opened in 2000,
that was commissioned by Transport for London. He explains that the modelling
and economic appraisal of this scheme was carried out as part of the East London
Rail Study (ELRS), and provided extensive data on the use of the new line, trends
in property prices, employment and rental values, and comparisons of the outturn
data with the forecasts used in the ELRS. It showed the JLE increased land prices,
but it could not provide an assessment of what might have happened to the level
and geographical distribution of employment in the absence of the line. However, it
argued that the development of Docklands provided a unique opportunity to extend
London’s financial business district; and, it concluded that the density of
development and levels of employment in Docklands would have been lower
without the line, although there was no way of quantifying this effect or attributing
causation.

63. DfT completed an econometric study of productivity impacts of road schemes
completed between 1998 and 2003. . This used estimates of cost savings from
the schemes, and before and after data on the productivity of firms in locations
near road schemes. Despite extensive modelling effort, it concluded that it was not
possible to distinguish a ‘signal’ of the cost reduction from the background ‘noise’
of other influences on productivity in the area. A particular challenge for this
project was that the road schemes in the sample tended to be incremental
adjustments to a developed network, strategic network schemes, impacting on
trips with very dispersed origins and destinations.
64. The expansion of High Speed Rail lines in Europe has provided some further
studies. Mike Mann’s paper considered the literature on the ex-post impact of High
Speed Rail lines. It showed that the experience of the TGV in France and the
Shinkansen in Japan have demonstrated that a high speed rail service can
influence the development of urban centres, and that a number of studies have
reported evidence of new development clustering around major rail terminals,
resulting in significant local increases in commercial and business activity.
65. It found that the TGV has provided greater opportunities for the development of
regional cities, previously disadvantaged by distance from core areas. New high
speed rail stations at Lyon and Lille were found to have provided a boost to local
service economies, encouraging a range of new development in commercial,
business, and tourism activities.
66. However, within regions it found some evidence of displacement of economic
activity leading to distributional impacts, with nodal points such as Lille, connected
to the new high speed rail links benefiting at the expense of more remote areas
and resulting in a widening of economic disparities within Nord Pas-de-Calais.
67. Also, the paper is careful to point out that these studies only consider local, or at
best regional impacts; the beneficial impacts could well be offset by reductions in
economic activity elsewhere.

68. Evidence from High Speed 1 is limited. The studies carried out were carried out
before the commuter services were fully implemented by South Eastern Trains.
Much of the evidence is anecdotal, businesses see the benefits of the high speed
link, but there is no robust evidence to say that the link has benefitted local
businesses and the surrounding area.
69. A report by GreenGauge 21 draws upon French evidence which suggests that
there is a limited time period for regeneration effects, before the link is considered
to be the ‘status quo’. Many of the papers looking at evidence of regeneration
benefits in foreign HSR links conclude that other regeneration policies must be
introduced in conjunction with the new link for benefits to be realised.
70. In his forthcoming paper ‘High Speed Rail - The European Experience’, Roger
Vickerman mentions that HS1 one is fairly unique in the segregation of services.
The services provided by South Eastern Trains are a direct substitute for classic
commuter trains to London. Vickerman quotes from ‘Modern Railways’ that only
2% of the passengers on the new high speed services are new travellers, which
leads to little impact on the areas in Kent served by the services (there are no
change in commuting patterns), however, there is likely to be increases in property
prices.
71. HS2 Ltd’s assessment of the potential impacts of High Speed Rail on the location
of economic activity (HS2 Demand Analysis paper, App3) states that while there
are examples from across the world where high speed rail has resulted in
significant economic geography effects, there are also many where they have
failed to materialise. It argues that Lille and Lyon are good examples where HSR
has driven economic restructuring or development, (at least as part of a package of
measures). However it acknowledges there have been some cases where a high
speed rail connection has had very limited (and even negative) impacts, including:
• Vendome, where – despite plans for redevelopment of the area, the station is
primarily used for commuting to Paris and has lead to very little economic
development in the area

• Haute Picardie, where there has been relatively limited economic development
– and indeed use of the high speed rail station.
72. Drawing on papers such as Bonnafous and Willigers, it concludes that where HSR
has been successful in promoting development it has been in conjunction with
other policies, and where a region has had the right skills and productive
capabilities to take advantage of the new opportunities. It concludes that there are
many reasons for the success or failure of individual high speed rail stations –
often specific to the local circumstances. However there are some consistent
messages in this literature:
• Integration is Key – Simply building a station or link to the high speed network
is not enough. For success to be achieved the station has to be integrated into
the wider strategic plans of local agencies, especially integration with the local
transport network. There are many factors which are more important in
regeneration than transport alone. It not surprising therefore that wider
strategies on land use planning and even education and skills are needed to
successfully integrate a station into the local and regional economy.
• Role as a hub – Whilst not always the case, there are examples of success
where the high speed rail station also has hub-like connectivity with good links
to the local/regional rail network as well as the high speed network. Thus the
station becomes a focus for the regional economy as well as a wider market
supported by high speed.
• This is not win-win – Although there are many examples where growth and
regeneration has been delivered around a high speed rail station, this may be
to the detriment of the surrounding region. Economic activity tends to move
away from the peripheries and towards the high speed station or hub. The
extent to which this happens is not clear, nor the key factors that may affect it.
One might hypothesise the greater degree of competition there is between
firms in the periphery and around the station, the greater the loss to the
surrounding area, but more research is needed here.

Conclusion
73. There are strong grounds, on the basis of economic theory, to expect an improved
transport network to boost GDP – so long as the improvement impacts on trips
undertaken in the course of measured economic activity. And the full economic
case requires assessing non-GDP impacts, too. Similarly, there are strong
grounds to expect a transport improvement to change the location of economic
activity. However, it is not possible to say in general much about the likelihood or
scale of relocation effects. To estimate these impacts for a particular scheme, a
case by case assessment would be needed, as called for in WebTAG’s Wider
Impacts guidance.
74. Evidence from ex-ante modelling suggests that economic activity relocation is to
be expected to some degree, in some circumstances. Where it is to be expected,
the scale of impacts appears variable, and confirms that a case-specific
assessment would be needed to assess such effects for a scheme.
75. Overall, there is not enough information from ex-post studies to rigorously quantify
the impact of transport improvements on economic geography. Hence, there is
little that can be concluded from them in general about the scale and likelihood of
location impacts. However, this does not mean the effects are not there – most of
the studies have either not rigorously sought out GDP impacts, or didn’t have large
schemes in their samples. And specific studies of schemes having a relatively
large impact on connectivity (e.g. the HSR case studies) can sometimes provide
useful insights to the types of effects that might be possible – although case by
case analysis would still be needed for specific schemes, and caution should be
exercised in transferring conclusions from an ex-post study to a proposal. The
recent analysis of the characteristics of HSR schemes (and associated, wider
strategies) which have had greater impact on local economic geography, could be
useful in forming expectations of the effects from large schemes.

Where business relocation and new economic activity opportunities are to be expected, will the transport scheme alone deliver them? Or are further investments/decisions required? 76. SACTRA looked at a variety of approaches to estimating such GDP impacts (using
LUTI and CGE models), and concluded that while most impacts did not explicitly
require further public sector investment, they all required additional private sector
investment. For example, if better connectivity makes a new location attractive to
a firm, it will need to invest in that location before it can begin production; or, a firm
might need to invest in different vehicles or distribution centres to supply a new
area. Also, other decisions will be needed, such as planning consents for
development.
77. Figure 1.7 (reproduced below) of Volume 1 of the Eddington Transport Study Main
Report reviews the evidence of conditions necessary for transport to impact on the
performance of the economy.
Figure 1.7 from the Eddington Report Canning and Fay (1993) assert that infrastructure should not be seen as a factor of production but as a condition for high growth. Kessides (1993) notes that infrastructure does not create economic potential; it only develops such potential where appropriate conditions exist, i.e. other inputs such as labour and capital are available to drive output growth. • Indeed, Lynde and Richmond (1993), Trinder (2002) and O’Fallon (2003) assert that public and private capital are complements: that physical infrastructure requires the existence of available productive private capital (human or physical) in order to realise economic growth potential, and that infrastructure investment can boost the productivity of such private capital.a Infrastructure investment may also indirectly feed through to increased labour productivity. • Canning and Pedroni (1999), Banister and Berechman (2000), Trinder (2002) and O’Fallon (2003) highlight other important underlying conditions that will influence the impact of transport investment on the economy.b In summary:
• economic conditions: a stable macroeconomic policy climate, local market circumstances, agglomeration, and labour market conditions; • investment conditions: availability of funds, timing and structure of investment, type of infrastructure investment, location of investment in terms of network structure; and • political and institutional conditions: decision making, planning, sources and methods of finance, level of investment (local, regional or national), supporting legal and organisational/institutional policies and processes, and method and governance of infrastructure delivery and provision.

a See: Public capital and long-run costs in the UK, Lynde and Richmond, 1993; Economic growth and transport infrastructure appraisal, Trinder, 2002; and Linkages between infrastructure and economic growth, O’Fallon, 2003. b See: Infrastructure and long-run economic growth, Canning and Pedroni, 1999; Transport investment and economic development, Banister and Berechman, 2000; and Linkages between infrastructure
and economic growth, O’Fallon, 2003.
78. The Study cited the Jubilee Line Extension as an example of where ‘other factors
contributed, and were essential, to the area’s success. For example, the area
benefited from favourable business rates that attracted business investment and it
met the existing demand for a convenient alternative office centre to the City, as
well as access to London’s skilled labour pool.’
79. In light of the evidence, the Eddington Study concluded that ‘Whilst transport can
play an important role in facilitating productivity growth, transport infrastructure
alone does not create economic potential. In particular, it is widely accepted that
the positive effects of transport investment, and its magnitude, are conditional on
certain external pre-conditions complementing any transport provision, namely:
stable macroeconomic conditions; the availability of skilled labour; and a
favourable environment for business investment to drive output growth.’
80. Later on, the findings from ex-post studies of HSR lines confirm this view, and give
further insights to the conditions necessary for such schemes to impact on
economic activity.
Conclusion
81. This understanding remains a consensus throughout the more recent literature,
too. Thus, a transport scheme purely on its own is usually not sufficient to deliver
all the potential impacts on business location - further investments and decisions
will usually be required.
Will there be only winners? Or will there be losers too?
82. When there is an improvement to transport between two towns, it is often asked
whether both would gain, one would gain more than the other, or one would gain at
the expense of the other. The sections above on locational effects make clear that
the changes in location of economic activity can be complex, and need case-by-
case analysis to predict. Moreover, it is frequently unclear what is meant by ‘gain’
and ‘loss’, but a common interpretation is to consider the volume of production
(linked to employment level, or ‘number of jobs’) at each location.
83. In that sense, SACTRA noted that transport improvements can ‘harm’ a local or
regional economy, by exposing indigenous firms to competition from stronger rivals
outside the area - the so-called 'two-way road' argument. It found that which end
of an improved link gets the greater benefit will depend on whether either region
has unique assets to exploit (such as natural resources), the relative configuration
of scale economies, the size of the local markets, local labour and land market
conditions, and the nature and scale of backward and forward linkages in local
sectors.
84. SACTRA referred to a CGE model developed by Venables and Gasiorek (1998),
which was used to explore the effects of different assumptions on which region
would benefit from transport improvements between two or three regions engaging
in imperfect competition. The results confirmed that the effects are complex, and
may go in different directions, sometimes favouring a large central region, and
sometimes a small peripheral region.
85. However, considering only the long-run changes in the volume of production (by
sector) at each location gives only a partial picture of ‘gains and losses’ – we would
also want to know about the shorter-term dynamics. These will depend on factors
like the mobility of the workforce, efficiency of the labour market, and the welfare
system. If the labour force is mobile, the labour market efficient, and the welfare
system conducive to getting people back into employment, any reduction in
production of one sector in a town might be of lesser impact, as the increased

unemployment might be short-lived. If, in contrast, the opposite conditions applied,
the increased unemployment could be longer-lasting.
86. Mike Mann’s paper concludes that case study evidence from the TGV in France
(Bruyelle and Thomas, 1994, Greengauge 21 cities report, 2006) and the work by
Vickerman (1992), Vickerman, Spiekermann and Wegener (1997) on links
between transport accessibility and regional development confirms that a new
transport link on its own is unlikely to improve local productivity and growth, if local
people do not have the skills and qualifications needed by prospective employers.
This means that local economic conditions and links with the local transport
network will influence the extent to which a major transport project or policy results
in local and national economic benefits.
87. Vickerman (in High Speed Rail – The European Experience) argues that the core
urban areas can grow at the cost of the outskirts because, in an imperfectly
competitive world, they are better placed to profit from a larger market. Therefore
better transport can harm certain areas with increased accessibility, rather than
benefit them. This is particularly true in a country where the service industry is
large and the labour market is very important, as many HSR focus on passengers
and not freight.
88. Another point made by Vickerman is that HSR has limited potential for intermediate
stops and therefore, many of those who bear the environmental, noise and other
costs are often not the users of the link.
89. However, a report by Urena (et al), ‘New Metropolitan Processes encouraged by
HSR: The Cases of London and Madrid’ states there is evidence of benefits for
‘intra-metropolitan’ areas (which have small intermediate stations very close to a
large metropolitan area). These areas can attract large businesses looking for
office space at a reduced cost, such as Toledo and Segovia near Madrid.

Conclusion
90. It is not possible to say in general to what extent two areas experiencing an
improvement in transport would gain or lose. We can say the impacts are likely to
be complex, varying between economic sectors, with each area seeing gains and
falls in activity in the sectors they produce in. But careful case-by-case analysis
would be required to say more than this, such as called for in WebTAG’s guidance
on measuring Wider Impacts, and Regeneration.
Do the Department’s standard CBA and transport modelling approaches capture the full (net) impact of a scheme on national economic activity? 91. ACTRA concluded that the then standard transport modelling and appraisal
methods should pick up all the economic impacts of a scheme in the ‘traditional’
measures (i.e. time savings). However, this was investigated further, and very
thoroughly, by SACTRA. It showed that a comprehensive, standard CBA of the
type conducted by the Department, should capture all the increase in economic
activity (GDP) from a transport scheme, so long as:
- all markets are undistorted; and, - the CBA (and transport modelling feeding into it) correctly estimates the full
range of transport demand responses. 92. These GDP increases should be estimated directly from the immediate changes in
vehicle operating costs and journey time savings, and although they will be
translated into other forms (e.g. more and cheaper goods and services), this
immediate measure is equivalent to the final GDP impact.
Undistorted markets 93. However, SACTRA showed that it is not reasonable to assume all markets are
undistorted – imperfect competition in product markets, agglomeration effects,
labour market deepening, etc. are part of reality. Hence, these impacts should be
assessed, and resulting benefits (or disbenefits) added on to the ‘standard’ CBA
results. Following SACTRA’s recommendations, DfT introduced its ‘Wider
Impacts’ guidance, some parts of which addressed these impacts (see annex A).

Range of transport demand responses
94. The degree to which modelling, and the resulting appraisal, fully estimates the
GDP impacts depends on the modelling approach used. If the modelling follows a
‘fixed trip matrix’ approach, where travel and land-use patterns do not respond to
improvements in accessibility, it would not capture the impacts of economic activity
relocation, as set out in the WebTAG ‘wider impacts’ guidance. In practice such a
modelling approach is rarely adopted, particularly for large schemes.
95. It is now far more commonplace for transport models to at least represent changes
in individuals’ choice of destination (and mode) in response to changes in travel
times and costs (in line with the Department’s ‘variable demand modelling’
guidance). It should be noted, however, that such modelling is typically based on a
representation of peoples propensity to travel different distances, for different
journey purposes, for a given set of travel times and costs; it does not involve
explicitly modelling employers’ location choices, nor workers’ choices of where to
work.
96. To comprehensively capture these economic activity relocation effects, the
WebTAG Wider Impacts guidance calls for the full set of wider impacts to be
measured. The extent to which these can be robustly produced depends on the
type of modelling used. Some can be estimated using simpler model types, while
others require more complex approaches. Importantly, though, WebTAG states
that robustly estimating the ‘move of jobs to more productive locations’ effect
requires a LUTI model, alongside the ‘standard’ transport modelling.
97. Annex B sets out an approach to understanding the extent to which a particular
piece of modelling, for a specific potential scheme, might be able to capture the full
set of GDP impacts. It shows that the conclusions can vary. A comprehensive,
LUTI-complemented modelling approach should be able to capture all the GDP
impacts, while less comprehensive approaches might not. However, with some
simpler approaches, it might not be possible to say whether or not GDP impacts
have been fully captured.
98. We can reason, though, that: the smaller is the change in accessibility a potential
transport scheme offers, the smaller is the scale of possible relocation effects, and
thus the smaller is the probability that a less comprehensive modelling approach
would miss significant GDP impacts. Similarly, the greater the change in
accessibility on offer, the more likely it is that relocation effects could be significant.
Conclusion
99. Answering this question is complicated by the fact that, while WebTAG puts
forward some standard modelling approaches, in practice, there is a range of
approaches applied to transport modelling. The extent to which modelling, and the
resulting appraisal, fully estimates the GDP impacts depends on the modelling
approach used.
100. But, for schemes with small impacts on accessibility, where relocation effects
are likely to be small, it is less likely that the modelling would omit significant GDP
impacts. For schemes with larger impacts on accessibility, the possibility is
greater. However, careful examination of the comprehensiveness of the modelling
approach used, on a case by case basis, will be necessary if a judgement is to be
formed..
Do transport schemes help with regeneration?
Do they boost employment in a regeneration area?
101. SACTRA note that conventional economics assumes rapid market clearing,
which implies that a transport scheme would have no net effect on employment,
and no addition should be made to a scheme’s net benefit, or GDP impact, for
such impacts. However, they also note that if the labour market is slow to clear,
then in principle a transport scheme (by shifting economic activity, or enabling new
economic activities) could have net employment effects, for a certain length of
time. SACTRA recommended that scheme appraisal include some assessment of
employment impacts.
102. Following this, the Department developed its guidance to include a requirement
to assess employment impacts of transport schemes serving a regeneration area.
It explains that (as should be expected from the above discussions on location
impacts) increased accessibility can have positive and negative effects for
employment in a regeneration area, and states that a careful, locally-specific study
should be undertaken, on a case-by-case basis. It also provides the expected
method and process for achieving this.
103. The guidance identifies that transport improvements might contribute to the
regeneration of a local economy and the creation of new jobs or increased
employment in the following ways:
• Jobs associated with construction of the scheme; • Jobs associated with operating and maintaining the scheme; • Jobs arising as a result of the improved travel conditions the scheme
delivers; and • Increased employment by giving residents of the RA access to jobs that
were previously inaccessible. 104. The guidance indicates that the first of these should not be included.
Construction jobs are temporary, often using outside labour, and are therefore
unlikely to contribute to local employment in the longer term. Jobs which may be
filled primarily by residents of the RA associated with operating or maintaining the
scheme may be included as a regeneration benefit. The third and the fourth
categories are likely to be the ones of greatest interest and relevance in a
regeneration report, and where much of the focus of effort in the analysis will lie.
105. The end product is a ‘regeneration report’, giving qualitative and quantitative
assessments of the impact on employment in the regeneration area. However, it
does not consider to what extent these impacts are additional at the national level,
nor does it place a monetised value on the employment impacts. Nonetheless, the
Department’s detailed VfM guidance goes further, and gives values that
Government is prepared to spend per extra person employed, to allow a monetised
value to be placed on any net additions to employment.

The two-way road
106. The section on ‘winners and losers’ above is very relevant here. It concluded
that it is not possible to say in general to what extent two areas experiencing an
improvement in transport would gain or lose. We can say the impacts are likely to
be complex, varying between economic sectors, with each area seeing gains and
falls in activity in the sectors they produce in. In regeneration areas, the same
conclusion applies, but with perhaps greater complexity. Greater accessibility to
an area could create greater competition for scarce jobs, and greater competition
from outside firms. Like any other, a regeneration area would need to have a
comparative advantage in some aspect of production, for it to become more
attractive to new employers upon an improvement in its accessibility. The
interaction of the ‘winners and losers’ effects with the causes of an area needing
regeneration in the first place would need careful consideration.
Conclusion
107. Outside ‘regeneration areas’, transport schemes could lead to better jobs (e.g.
more productive and higher paid), jobs in different locations, and access to a
greater variety of jobs from a given location. In regeneration areas, a transport
scheme could help a wider regeneration programme move people into employment
or reduce length of time in unemployment. But, there is the well known ‘two way
road’ argument, which means a regeneration area could see both gains and losses
in economic activity.
108. Overall, there is a consensus that transport schemes can help regeneration
schemes achieve their aims. However, transport schemes on their own are very
unlikely to lead to regeneration – they need to be part of a complementary package
of regeneration measures.

3. Summary of conclusions 109. The answers to the key questions, drawing on the conclusions in section two,
are summarised below.
Do transport schemes lead to greater economic activity (i.e. higher GDP)?
110. Yes, if… There are strong grounds, on the basis of economic theory, to expect
an improved transport network to boost GDP – so long as the improvement
impacts on trips undertaken in the course of measured economic activity.
111. Evidence from ex-ante modelling suggests that economic activity relocation is
to be expected to some degree, in some circumstances. Where it is to be
expected, the scale of impacts appears variable, and confirms that a case-specific
assessment would be needed to assess such effects for a scheme.
112. Overall, there is not enough information from ex-post studies to rigorously
quantify the impact of transport improvements on economic geography. However,
this does not mean the effects are not there. Most of the studies have either not
rigorously sought out GDP impacts; were undertaken within a few years of the
scheme opening (making it difficult to collect evidence of short term effects, let
alone longer term regeneration); or, didn’t have large schemes in their samples.
And ex-post studies of schemes can sometimes provide useful insights to the
types of effects that might be possible – although case by case analysis would still
be needed for specific schemes, and caution should be exercised in transferring
conclusions from an ex-post study to a proposal.
Do they lead to changes in economic activity location?
113. Yes,, there are strong grounds to expect a transport improvement to change
the location of economic activity, and to make previously unprofitable activities
profitable. However, it is not possible to say with accuracy more about what the
scale of these impacts would be in general. To estimate these impacts, an
assessment would be needed, case by case, for a scheme, following WebTAG
guidance.

Where business relocation and new economic activity opportunities are to be
expected:
– Will the transport scheme alone deliver them? Or are further investments /
decisions required? No. Transport schemes alone are unlikely to deliver substantial relocation or new
economic activities, because other complementary investments or decisions are
needed (e.g. private sector investment, or land use planning decisions). How to
appraise net extra impacts of that chain of investments / decisions is currently
unclear.
– Will there be both winners and losers?
Yes. It is not possible to say in general to what extent two areas experiencing an
improvement in transport would gain or lose. We can say the impacts are likely to
be complex, varying between economic sectors, with each area seeing gains and
falls in activity in the sectors they produce in. But careful case-by-case analysis
would be required to say more than this..
.
Do the Dept’s standard CBA and transport modelling approaches capture the
full (net) impact of a scheme on national economic activity? 114. In principle, the modelling and appraisal methods in WebTAG (including the
Wider Impacts guidance) should cover the full net impact of a transport scheme on
economic activity. However, in practice, the extent to which the modelling, and
resulting appraisal, of a specific scheme fully estimates the GDP impacts depends
on the modelling approach(es) used.
115. A scheme-specific assessment of the extent to which the modelling meets
WebTAG expectations, and the degree of change in connectivity in the area that
would be caused by the scheme, will be needed. The more comprehensive the
modelling approach (as measured by WebTAG standards, including Wider
Impacts), and/or the smaller the relative impact of the scheme on connectivity in

the area affected, the more likely it is that all economic activity impacts will be
captured.
Do transport schemes help with regeneration?
116. Transport schemes can help regeneration schemes. However, transport
schemes on their own are very unlikely to lead to regeneration – they need to be
part of a complementary package of regeneration measures.
Do they boost employment in a regeneration area?
117. Outside regeneration areas transport schemes could lead to better jobs (e.g.
more productive and higher paid), and jobs in different locations. In regeneration
areas, a transport scheme could help a wider regeneration programme move
people into employment or reduce length of time in unemployment. But, there is
the well known ‘two way road’ argument, which means a regeneration area could
see both gains and losses in economic activity.
TASM November 2011
ANNEX A DfT’s WebTAG Wider Impacts guidance
1. The Wider Impacts guidance identifies a number of impacts of transport
schemes beyond the direct benefits to transport users. Two types of wider
impacts are identified: those that affect GDP referred to as GDP effects; and
those that affect wider welfare issues, referred to as Wider Benefits. Overall,
there are seven aspects of WIs to be considered:
increased labour force participation (GDP1) people working longer (GDP2) jobs moving to more productive areas (GDP3) agglomeration benefits (WB1, GP4) increased competition (WB2) imperfect competition (WB3) exchequer consequences of increased GDP (WB4).
118. The first four impacts listed contribute to economic output. The final three
generate increased economic welfare to individuals, but do not contribute to
economic growth. Increased labour force participation (GDP1) 119. When deciding to go to a certain place for work, people are likely to weigh up
their gains, from wages, and their costs, from items such as travel. Reductions to
travel costs are perceived as increases to the net return from working. In general,
the higher the wages offered, the more people put themselves forward for
employment. GDP1 measures the change in GDP resulting from a change in the
number of people working.
120. The labour supply impact is essentially computed by looking at how the
estimated change in transport costs affects the incentives for an individual to work,
therefore affecting the overall level of labour supplied, the additional value added
to the economy and the resulting tax revenue to the government. People working longer (GDP2)

121. Intuitively, there may also be an “hours” effect in that less time travelling to and
from work could lead to some people working longer – more hours. However, little
empirical evidence has been found to support this intuition, and therefore, in the
absence of better evidence, this impact is assumed to be zero. Jobs moving to more productive areas (GDP3) 122. The same job may have different levels of productivity depending on the area.
Because transport improvements have the potential to make some areas become
more attractive and accessible to firms and workers, some jobs may be attracted to
these areas and thereby increase their productivity.
123. Recent research indicates that the majority of the variation in productivity
between cities and regions is due to the quality of the workforce. Transport
investment by encouraging the migration of productive workers raises the average
productivity of the recipient regions.
124. To estimate the scale of this impact, a LUTI model is usually required to model
changes in employment location between areas. The estimation of the ‘move to
more productive jobs’ impact is therefore in two parts: modelling the impact of the
transport scheme on the location of employment, and estimating the impact of the
changes in employment location on productivity.
Agglomeration benefits (WB1, GP4) 125. It has long been observed that incomes are significantly higher in large cities
than in smaller ones. Close physical proximity facilitates the sharing of knowledge,
greater access to more suppliers and larger labour markets. This means that some
firms derive productivity benefits by being located close to other firms. Thus, when
a firm relocates to an area of agglomeration it may raise the output of other firms
through one or other of these channels
126. The argument is that agglomeration economics is a function of “effective
density”. Effective density allows for interactions with the number of workers in

neighbouring areas. Because transport improvements reduce travel cost, they
increase effective density even when with no change in location of employment.
127. Empirical studies of the relationship between agglomeration and productivity
have generally found that urban scale or density has a positive and significant
effect on productivity. The WebTAG methodology is based on the observed
correlation between density of employment and productivity. Density in this
situation is most appropriately understood in terms of the cost of accessing other
jobs both in the study zone but also in adjacent and more distant areas. There
exists a substantial literature on the variation in worker productivity with
agglomeration size, though much of this data is international rather than from the
UK. WebTAG guidance uses UK based research on the relationship between
productivity and population mass in deriving estimates of changes in productivity
as a consequence of improved accessibility.
128. Although theory does not preclude the existence of agglomeration benefits
across inter-regional distances, the empirical data indicates that the geographic
scope of agglomeration externalities is relatively localized, and that the impacts
across inter-regional distances is likely to be very small.
129. Evidence also shows that the geographic scope of agglomeration effects differs
depending on which particular source or mechanism is being considered. Studies
looking at knowledge spillovers and human capital externalities tend to find small
geographic scope, while studies looking at input sharing linkages find effects over
larger spatial scales. Also, a transport improvement can create a net reduction in
agglomeration if it tends to disperse activity.

ANNEX B WHAT QUESTIONS ARE NEEDED TO DETERMINE WHETHER A SCHEME HAS CAPTURED ALL ITS GDP IMPACTS? PRELIMINARY FRAMEWORK Introduction 1. The paper to which this annex is attached has found that, in principle, a scheme
appraisal following DfT’s WebTAG guidance should capture all the economic activity impacts. However, in practice, whether or not this is the case for a specific scheme appraisal depends on the type(s) of modelling and appraisal used for the scheme. This annex therefore suggests a set of questions that can be used to guide thinking on whether the modelling and appraisal used to assess a scheme has captured all the economic activity impacts.
2. This analysis is tentative, and best seen as an initial guide to thinking about this
question. It should not be seen as a firm and complete framework at this stage. Also, it does not address the question of scale of such impacts. In circumstances where it is logically possible that the specific modelling and appraisal approach has not covered all impacts, it is still possible that the impacts are small relative to the other costs and benefits.
A possible guide to thinking 3. Following SACTRA, and the WI guidance that followed, DfT concluded that if the
modelling and appraisal for a scheme’s impacts followed WebTAG guidance, including all the ‘Wider Impacts’, it would capture all the GDP impacts in the resulting BCR.
4. It follows that a checklist can be written, as follows:
• Has the modelling and appraisal followed WebTAG guidance, excluding. WIs? That is, has the ‘normal’ TEE table of benefits to various groups been reported?
• Has the transport modelling and ensuing appraisal included all Wider
Impacts: - Agglomeration? - Output change in imperfect competition? - Labour supply impact? - Move to more/less productive jobs?
5. The answers to these questions can be:
• Explicitly Yes • Implicitly Yes • No

6. Combining these gives a matrix for each scheme (as shown below). If the
answer to every question is ‘Explicitly Yes’, then all GDP impacts are included in the resulting BCR. If one or more answers is ‘Explicitly No’, and none are ‘Implicitly Yes’, then not all GDP impacts are included. If one or more answers is ‘Implicitly Yes’, and none is ‘Explicitly No’, then it is not possible to say with certainty whether all GDP impacts are included.
Explicitly Yes Implicitly Yes Explicitly No
Followed WebTAG (exc WIs)?
Agglomeration?
Output change in imperfect competition?
Labour supply impact?
Move to more/less productive jobs?
7. We now set out some generic examples of how this framework could be applied
to specific modelling and appraisal of schemes. The following assumes that all the modelling is done ‘well’, i.e. free from significant errors, and that the modelling structures, parameters etc. represent reality well.
a) Uni-modal transport model (only) Where does this occur? Frequently the case in rail demand modelling and appraisal Answers are: EY, IY?, IY?, IY?, IY? Conclusion: Very difficult to say whether or not some GDP impacts have been omitted (because the uni-modal demand elasticities might have implicitly captured some of the WEBs effects – or they might not have done). Bespoke analysis of how the model’s demand parameters were estimated would be needed to form an opinion. Certainty over all GDP impacts being captured? Low. b) Multi modal transport model (only, i.e without ensuing WEBs analysis it enables)) Where does this occur? Many HA and LA schemes, where WEBs not seen as important Answers are: EY, EN, EN, EN, EN Conclusion: likely to be missing several welfare, and some GDP impacts (but difficult to say how large these might be) Certainty over all GDP impacts being captured? Low

c) Multi modal transport model + ensuing WEBs analysis it enables (which does not include MtMPJ) Where does this occur? Some large LA and metropolitan schemes; Crossrail Answers are: EY, EY, EY, EY, EN Conclusion: likely to have captured all but one type of GDP impacts – move to more/less productive jobs would be missing (because WebTAG requires a LUTI model for that). Still difficult to say how large the missing effect might be. Certainty over all GDP impacts being captured? Medium d) Multi modal transport model + ensuing WEBs analysis it enables (which does not include MtMPJ), complemented by LUTI model (which enables the MtMPJ effect to be estimated). Where does this occur? Rare. Answers are: EY, EY, EY, EY, EY Conclusion: All GDP impacts captured. Certainty over all GDP impacts being captured? High (subject to caveat above that this assumes the LUTI modelling has represented such effects well, which would need case-by-case investigation). Caveats 8. The above is intended only to be an illustration of how this framework can be
applied. Applying this framework in the generic way above, without looking into the depths of each scheme’s modelling, can suggest only the most tentative of conclusions. However, those tentative conclusions might, in some circumstances, still be valuable.
9. In particular, it’s worth noting that the assumption that the modelling used
represents reality well could be very bold in some cases. For example, for a scheme which significantly impacts on international connectivity to capture all such effects would require a LUTI model spanning international borders, to capture impacts like changes in FDI. And even for less dramatic schemes, the degree to which (e.g.) a LUTI model represents subtle but important aspects of reality (e.g. extent of ‘two way road’ impacts) would need careful examination on a case-by-case basis.
TASM November 2011