
2 SSM (1) SSM (2) SSM ('Jffi) SSM SSM SSM (3) SSM SSM 12 ...
Upload
laszlo-arvai-lion-1500Category
view
333download
0
Impact of SSM and SREP on Bank Steering in a large European Banking Group
GLC Credit Risk Management Forum
Vienna, May 8th, 2015 André Wilch
Disclaimer: All ideas contained in the subsequent presentation reflect the personal view of the author and are not necessarily representative of the view of the UniCredit organization.

Agenda
! Semantic integration accross hierachical levels in the group structure: Challenges to efficient bank steering, and the role of risk appetite statements and BCBS239
! Do internal models have a future? Interplay of internal and pillar 1 models in the context of the envisaged SREP regime
! Interplay of accounting rules and prodential regulation in a going conern steering perspective: The
effects of prudential filters
! How to interpret the gone concern perspective in light of the new bank resolution regime?
2

UniCredit Group as a Laboratory for European Regulation
3
! UniCredit is a leading European commercial bank operating in 17 countries with more than 147,000 employees, over 8,500 branches and with an international network spanning in about 50 markets.
! UniCredit benefits from a strong
European identity, extensive international presence and broad customer base.
! Our strategic position in Western
and Eastern Europe gives us one of the region’s highest market shares.
Source: www.unicreditgroup.eu

International Presence in 17 European Countries
4 Source: www.unicreditgroup.eu

Important player in many local markets
5 Source: www.unicreditgroup.eu

Matrix structure of legal entities and …
6 Source: www.unicreditgroup.eu
UniCredit
UCB AG UC BA PEKAO Pioneer UCL
LE 1
LE 2
...
LE 1
LE 2
...
LE 1
LE 2
...
LE 1
LE 2
...
LE 1
LE 2
...
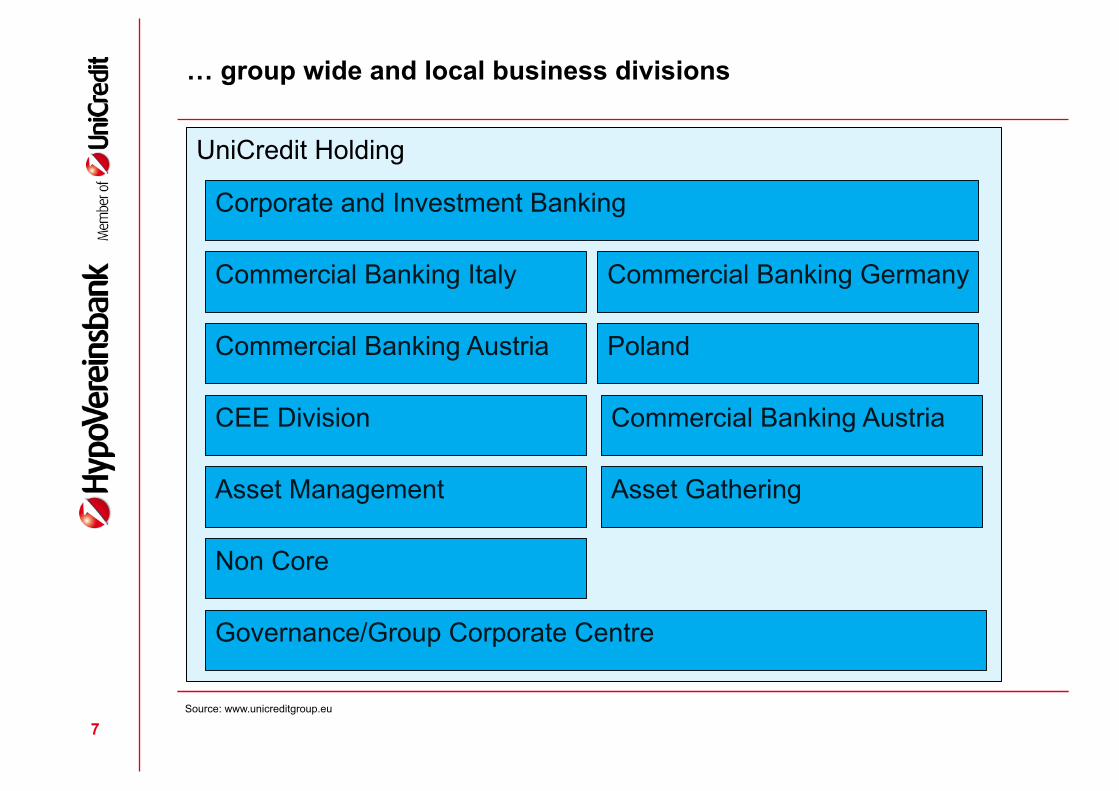
… group wide and local business divisions
7 Source: www.unicreditgroup.eu
Corporate and Investment Banking
Commercial Banking Germany Commercial Banking Italy
Commercial Banking Austria Poland
CEE Division Commercial Banking Austria
Asset Management Asset Gathering
Non Core
Governance/Group Corporate Centre
UniCredit Holding

Merger Pioneer Investments – Santander Asset Management
! Pioneer Investments and Santander Asset Management to join forces creating a leading global asset manager
! Preliminary agreement reached to combine Pioneer Investments and Santander Asset Management resulting in a global asset manager with €400 billion in assets under management
! The company will be called Pioneer Investments and will rank among the top 35 firms globally and top 10 in Europe by assets
! Pioneer Investments valued at €2.75 billion and Santander Asset Management at €2.60 billion
8 Source: www.unicreditgroup.eu

UniCredit Business Strategy
9 Source: www.unicreditgroup.eu
Our Business ModelAt UniCredit, we work relentlessly to offer outstanding banking services and to provide real support for economic growth in the communities where we operate. This requires developing new service models that enable connections between businesses in different places while making the bank more accessible and more transparent. It means being a sustainable bank.The restructuring process that began at the start of 2012 has resulted in major simplification of our operating processes. In order to bring us closer to our customers, for example, our national offices now possess greater decision-making power. The object of this change is to simplify our business by implementing a more streamlined chain of command, a more efficient commercial network, and an expanded ability to create personalized solutions. Additionally, it enables our national offices to be more effective at developing the markets they serve.
OUR MISSIONWe UniCredit people are committed to generating value for our customers. As a leading European bank, we are dedicated
to the development of the communities in which we live, and to being a great place to work. We aim for excellence and we consistently strive to be easy to deal with. These commitments will allow us to create sustainable value for our shareholders.
Concrete investment solutions that satisfy real investment needs,providing an innovative and consistent global offering that manages risk and delivers attractive returns to investors.
Traditional corporate and transaction banking services, alongwith full-fledged structured finance, capital markets and investment products. Strategic long-term partner that meets clients’ specific needs and delivers access to Western, Central and Eastern Europe.
INDIVIDUALS Flexible and easy access to banking services through traditional and digital channels.COMPANIESSupport for entrepreneurs – in their day-to-day business, or in executing new projects or strategies – through tailored, profit-driven solutions.PRIVATE BANKINGA 360-degree advisory model, customized investment strategies and access to international markets through specialist advisors.
COMMERCIAL BANKING
CORPORATE & INVESTMENT BANKING
ASSET MANAGEMENT
Our B
usin
ess
Key
Stre
ngth
s:Cu
stom
er p
roxi
mity
– R
isk c
ultu
re –
Glo
bal f
unct
ions
spec
ializ
atio
n
VALUE PROPOSITION
Innovative financial services that combine the efficiency of digitalchannels with advisory expertise.
ASSET GATHERING
HypoVereinsbank · 2014 Annual Report 277

UniCredit Strategic Plan
10 Source: www.unicreditgroup.eu
Our StrategyOn 11 March 2014, our Board of Directors approved the five-year Strategic Plan with the object of ensuring sustained profitability over the coming years. The plan is based on solid fundamentals, a strong culture of risk management and an improving macroeconomic climate. Our goals are to consolidate our leading position in corporate financial services across Europe, to institute an innovative mindset throughout our retail network, and to establish a cutting-edge digital footprint.UniCredit understands its role as part of a far-reaching system that leverages resources, or capital, to generate shared value. Indeed, the solidity of our business depends on the prosperity of our customers and of the communities in which we operate. To create greater value we, as a bank, develop innovative solutions that form attractive investment opportunities and also generate positive outcomes for our Group. We adopted our five-year strategic plan building on our solid fundamentals, with the purpose of ensuring sustained profitability, and making the best possible use of the resources at our disposal. This is how we continue to respond effectively to our stakeholders’ priorities.
* See 2014 Sustainability Report for details.
STRATEGIC PLAN 2013 – 2018 Strategic pillars and capitals aim at reinforcing capitals over time
STRA
TEGI
C PI
LLAR
SCA
PITA
LS*
A new approach to retail banking Serve growing non-lending needs of Corporate clients Enhance the Private Banking business model
1. TRANSFORM COMMERCIAL BANKING IN WESTERN MARKETS Rebalance Group capital
allocation towards CEE Focus on “expansion countries”Support capital-light businesses (Asset Gathering, Asset Management)
2. INVEST IN BUSINESSES GROWTH
Maintain CIB leadership in its core business and fully exploit synergies Enhance cost reduction and simplification initiatives Foster operating efficiency
3. LEVERAGE ON GLOBAL PLATFORMS
CONSERVATIVE RISK APPETITE FRAMEWORK
Strong equity Balanced funding mixLong-term financial stability
Engaged people Diversified workforce Competent & skilled professionals
High air quality Soil, water, flora and fauna preservation
Financial Human NaturalSocial &Relationship
Intellectual
Effective and safe ICT system Innovation capability
Efficient and effective processes
Long-term stakeholders relationshipSocio-economic development/well-being
278 2014 Annual Report · HypoVereinsbank

SREP: Similar to due diligence perfomed by rating agencies
11 Source: Source: EBA presentation for public hearing 9 September 2014
Overview of the common SREP framework Categorisation of institutions
Overall SREP assessment
Supervisory measures
Quantitative capital measures Quantitative liquidity measures Other supervisory measures
Early intervention measures
Monitoring of key indicators
Business Model AnalysisAssessment of internal
governance and institution-wide controls
Assessment of risks to capital Assessment of risks to liquidity and funding
Assessment of inherent risks and controls
Determination of ownfunds requirements &
stress testing
Capital adequacyassessment
Assessment of inherent risks and controls
Determination of liquidityrequirements & stress
testing
Liquidity adequacyassessment
4

SREP: SWOT analysis of the business model
12 Source: EBA presentation for public hearing 9 September 2014
Business model analysis
Assessment of the viability of the current
business model
Assessment of the sustainability of the
strategy
Help to identify key
vulnerabilities
BMA
Essential questions of the BMA: 1. How is the institution making profits today? 2. What are the key drivers of its profitability? 3. How does it plan to make profits tomorrow? 4. How will the key drivers of profitability
change? And what is driving this change?
Key elements:
• Identification of the focus (e.g. business lines)
• Assessment of business environment
• Quantitative and qualitative analyses of current model
• Analysis of forward-looking strategy and financial plans
• Forming supervisory view and scoring
8
! How is the institution making profit today?
! What are the key drivers of profitablity?
! How does it plan to make profits tomorrow?
! How will the key drivers of profitability change? And what is driving the change?

SREP: Introducing new bank specific Total SREP Capital Requirements (TSCR) and Overall Capital Requirements (OCR)
13 Source: EBA presentation for public hearing 9 September 2014
Assessment of capital adequacy
Supervisory view of
institutions’
viability from the capital perspective
Overall ass.
• Risks to capital assessment • ICAAP
• Stress tests results • Supervisory benchmarks
Concerns to be addressed?
• Risk underestimation
• Model deficiencies
• Governance and internal controls
What measure?
• Qualitative
• Quantitative
Quantification
• ICAAP* • Sup. quantitative benchmarks and stress test • Peer comparison and supervisory judgment • No overlaps with buffers and macro-prud. req.
Articulation
Overall ass.
Concerns to be
addressed?
• TSCR and OCR • Amount/composition of additional requirements • Nature of requirements
Score 1 to 4
Covering both Pillar 1 risks (minimum own funds requirements) and other material risks (Pillar 2)
• Process vs. Methodology
• Contingent vs. structural
• Capital adequacy is a key determinant of institutions’ viability and subject to joint decisions for cross-border groups
* ICAAP considered subject to satisfaction of soundness requirements
Econ
omic
cyc
le re
silie
nce
• Risk by risk • In excess of P1 req.
• Binding vs. non binding req.
• Quality of capital instruments
• Group vs. subsidiaries
12

SREP: Defining a common risk taxonomy
14 Source: EBA presentation for public hearing 9 September 2014
Assessment of individual risks to capital 1/2
• Based on risk nature • Sub-categories, if differ from the Guidelines should be agreed within
colleges
Material risks
Credit
• Concentration • Dilution • Securitisation • Residual • ……
Mkt
• Equity, IR, FX • CVA • Structural FX • Credit spread • …..
Op
• Conduct • IT • Model* • Reputational** • …..
Sub categories can be assessed individually when material
*Model risk for internal approaches should be assessed within each risk category. Risk arising from wider use of models should be considered under operational risk assessment ** Reputational risk is assessed under operational risk because of shared risk management practices and risk drivers
Common risk taxonomy
IRRBB
• Pre-payment • Behavioral • Optionalities • Other
Other
• Pension • …..
10

SREP: Building links between on-going supervision and recovery and resolution regimes
15 Source: EBA presentation for public hearing 9 September 2014
SREP outcomes – supervisory measures
• Different Supervisory measures are foreseen, depending on the areas of concern
and on the level of criticality
• Duration and severity of the measures proportionate to gravity of the deficiencies • Aimed at restoring compliance/enhancing institutions’ prudential soundness • Can be adopted anytime during SREP and following on-site inspections • Can enhance effectiveness of macro-prudential measures for specific institutions
Overall SREP
• Supervisory measure
• Future supervisory resourcing and planning
• Link with BRRD, incl. early intervention measures
• Other
Capital
• Add-ons
• Restrictions to dividend and interest payments
• Specific prudential treatment of identified assets
• Other
Liquidity
• Restrictions on maturity mismatches
• Increase of survival period
• Amount and composition of ctb capacity
• Other
Other SREP elements • Changes to financial and
business plans
• Changes to organisational structures, including management body
• Improvements of ICAAP/ILAAP
• Enhanced reporting
• Risk exposure reduction
• Other
+
Early Intervention Measures*
* Authorities could require the institution to implement any measures set out in the recovery plan, draw up an action programme and a timetable for its implementation, require the convening of a meeting of shareholders to adopt urgent decisions, and require the institution to draw up a plan for restructuring of debt with its creditors. In addition, supervisors will have the power to appoint a special manager for a limited period to restore the financial situation of the bank and the sound and prudent management of its business
Implementation plans to be approved and monitored by CAs
17

Core SSM Organisational Structure
16
ECB Annual Report on supervisory activities 2014, March 2015 21
The Mediation Panel met for the first time at the end of November 2014. During the
meeting, the Chair and members reached a common understanding on how to
implement, in practice, some of the procedural steps set out in Regulation
ECB/2014/26.
1.4 Organisation of the supervisory function at the ECB
Setting up the Single Supervisory Mechanism (SSM) required some changes to the
ECB’s existing organisational structure.
The new micro-prudential function has been organised into five new business areas
within the ECB: four directorates general (DGs) and a Secretariat to the Supervisory
Board.
Figure 3 Core SSM organisational structure
1.4.1 DGs Micro-Prudential Supervision I and II
DGs Micro-Prudential Supervision I and II (DGs MS I and II) deal with the direct supervision of significant banks. Both DGs are organised according to a risk-
Secretariat
This organisational chart shows the first two layers of the organisational structure of the new business areasDG (Directorate General)
Significant BankSupervision I
Significant BankSupervision III
Significant BankSupervision IV
Significant BankSupervision V
Significant BankSupervision VI
Significant BankSupervision VII
Significant BankSupervision VIII
Significant BankSupervision IX
Significant BankSupervision X
Significant BankSupervision XI
Significant BankSupervision XII
Significant BankSupervision XIII
Significant BankSupervision XIV
Significant BankSupervision XV
Supervisory Oversight &NCA Relations
Institutional & SectoralOversight
Analysis &Methodological Support
Authorisation
Centralisedon-siteInspections
Crisis Management
Enforcement &Sanctions
Methodology &Standards Development
Planning & Coordinationof Supervisory ExaminationProgramme
Supervisory Policies
Supervisory QualityAssurance
Internal Models
Risk Analysis
Decision-MakingProcess
Decision-MakingPolicy
Direct Supervision Indirect SupervisionHorizontal
Supervision & Specialised Expertise
Significant BankSupervision II
Micro-prudentialSupervision I
Micro-prudentialSupervision II
Micro-prudentialSupervision III
Micro-prudentialSupervision IV
Secretariat to the Supervisory Board
Source: ECB SSM first annual report

Functioning of the Joint Supervisory Teams
17 ECB Annual Report on supervisory activities 2014, March 2015 35
They are composed of staff members from the ECB and the NCAs and work under
the coordination of a designated ECB staff member (JST coordinator) and one or
more NCA sub-coordinators.
JSTs started operating formally on 4 November 2014. The preparatory work,
however, began prior to that, and involved the compilation and assessment of the
supervisory history and risk profile of each institution in specific dossiers sent by the
NCAs. It also involved kick-off and follow-up meetings with the NCAs and the
supervised groups, as well as the participation of ECB JSTs members as observers
in the meetings of supervisory colleges and crisis management groups. For each
supervised group, this work helped identify the supervisory priorities, charting the
main risks, assessing solvency and planning supervisory activities for 2015.
At the current stage, processes are being made more efficient and the teams are
converging and evolving to become more integrated and ensure closer interaction
among the members.
The intrusiveness of the supervisory approach takes the form, among other things, of
close interaction not only with the banks’ management but also their boards and the
committees established within these bodies (in particular risk and audit committees)
to provide JSTs with an overview of the entity’s strategy and risk profile and a better
understanding of the way strategic decisions are taken. This includes an assessment
of the risk appetite framework and risk culture, drilling down from the governing
structures into the business units.
Figure 4 Functioning of the Joint Supervisory Teams
JST coordinator
(Chair)
Core JST
Sub-coordinators
(support JST coordinator)
Team of experts
from NCAs and ECB
approval / validation of decisions
support JSTs
Horizontal divisions
ECB intermediate
structure (DGs)
Governing Council
Supervisory Board
Source: ECB SSM first annual report

Some SSM Priorities for 2015
! Promoting a more intrusive approach to banking supervision
! Viability of business models and profitability drivers
! Governance at the institutional level
! Quality of management information
! Review of the validation of banks’ internal models
! Eliminate national discretions to reduce the fragmentation within the SSM countries
! …
18 Source: ECB SSM first annual report

CET1 Ratio
19 Source: EBA Dashboard Q4 2014
8
Dec - 09 9.0% 7.1% 8.7% 10.7%
Mar - 10 9.0% 7.3% 8.7% 10.8%
Jun - 10 9.2% 7.3% 8.7% 10.6%
Sep - 10 9.3% 7.4% 9.3% 11.1%
Dec - 10 9.0% 7.8% 8.5% 10.4%
Mar - 11 9.3% 8.2% 9.0% 10.9%
Jun - 11 9.3% 7.9% 9.4% 10.4%
Sep - 11 9.4% 8.0% 9.4% 10.6%
Dec - 11 9.3% 8.1% 9.4% 10.6%
Mar - 12 9.8% 8.4% 10.0% 11.3%
Jun - 12 10.3% 9.3% 10.4% 11.2%
Sep - 12 10.5% 9.5% 10.5% 11.4%
Dec - 12 10.8% 9.6% 10.7% 11.7%
Mar - 13 10.8% 9.8% 10.7% 12.3%
Jun - 13 11.1% 10.0% 11.0% 12.6%
Sep - 13 11.4% 10.2% 11.1% 13.1%
Dec - 13 11.6% 10.4% 11.4% 13.5%
Mar - 14 11.4% 10.7% 12.0% 14.0%
Jun - 14 11.8% 11.1% 12.6% 14.6%
Sep - 14 12.1% 11.5% 13.1% 14.8%
Solvency
KRI: 3 - CET1 ratio (was T1 excluding hybrids until Q4 2013)
Dispersion Numerator and denominator: trends
5th and 95th pct, interquartile range and median.Total numerator and denominator.
December 2009=100.
Country dispersion (as of Sept 2014) KRI by size class
( * ) Not reported. Medians by country. The name of the country is disclosed if reporting institutions are more than 3.
Banks are classified in the size class according to the their average total assets between Dec. 2009 and Sep 2014
Period Weighted average 25th 50th 75th
80
90
100
110
120
130
140
150Numerator
Denominator
0%
3%
6%
9%
12%
15%
18%
21%
SE 3 GR 13 5 12 1 2 DE 4 7 IT ES 9 10 8 FR 6 GB 11
EU
0.0%
2.0%
4.0%
6.0%
8.0%
10.0%
12.0%
14.0%
16.0%
Top 15 Others All banks
-6%
-3%
0%
3%
6%
9%
12%
15%
18%
21%

Impaired Loans and past due (>90 d) loans to total loans
20 Source: EBA Dashboard Q4 2014
9
Dec - 09 5.1% 3.0% 4.7% 10.4%
Mar - 10 4.9% 2.9% 4.8% 10.1%
Jun - 10 5.1% 3.2% 4.9% 10.8%
Sep - 10 5.3% 2.8% 4.4% 10.9%
Dec - 10 5.3% 3.0% 5.2% 10.5%
Mar - 11 5.2% 2.9% 5.2% 11.3%
Jun - 11 5.3% 2.5% 5.6% 12.5%
Sep - 11 5.3% 2.5% 5.5% 13.3%
Dec - 11 5.8% 2.5% 6.1% 13.6%
Mar - 12 5.9% 2.5% 6.5% 14.3%
Jun - 12 6.0% 2.8% 6.2% 14.7%
Sep - 12 6.3% 2.8% 6.8% 15.3%
Dec - 12 6.4% 3.1% 6.9% 16.1%
Mar - 13 6.5% 3.0% 6.7% 17.6%
Jun - 13 6.7% 3.2% 6.7% 17.6%
Sep - 13 6.6% 2.9% 6.5% 15.7%
Dec - 13 6.8% 3.0% 6.5% 16.2%
Mar - 14 6.8% 3.0% 6.1% 16.4%
Jun - 14 6.6% 2.9% 6.2% 17.1%
Sep - 14 6.7% 2.8% 6.3% 17.2%
Credit Risk and Asset Quality
KRI: 13 - Impaired loans and Past due (>90 days) loans to total loans
Dispersion Numerator and denominator: trends
5th and 95th pct, interquartile range and median.Total numerator and denominator.
December 2009=100.
Country dispersion (as of Sept 2014) KRI by size class
( * ) Not reported. Medians by country. The name of the country is disclosed if reporting institutions are more than 3.
Banks are classified in the size class according to the their average total assets between Dec. 2009 and Sep 2014
Period Weighted average 25th 50th 75th
80
90
100
110
120
130
140
150Numerator
Denominator
-1%
1%
3%
5%
7%
9%
11%
13%
15%
13 GR 3 9 12 1 IT 11 ES 10 2 6 5 FR DE GB 7 8 4 SE
EU
0.0%
2.0%
4.0%
6.0%
8.0%
10.0%
12.0%
Top 15 Others All banks
0%
5%
10%
15%
20%
25%
30%
35%
40%
45%
50%
15%
20%
25%
30%
35%
40%
45%
50%
55%

Return on equity
21 Source: EBA Dashboard Q4 2014
14
Dec - 09 4.5% -1.0% 5.6% 9.2%
Mar - 10 7.4% 3.1% 6.7% 11.2%
Jun - 10 7.3% 3.2% 6.4% 10.8%
Sep - 10 6.7% 3.0% 5.9% 10.0%
Dec - 10 5.9% 1.7% 5.4% 9.5%
Mar - 11 8.3% 5.0% 8.2% 11.7%
Jun - 11 7.1% 2.8% 7.3% 11.8%
Sep - 11 4.9% -0.5% 5.5% 9.6%
Dec - 11 0.3% -15.3% 2.9% 8.0%
Mar - 12 5.6% 1.8% 6.5% 10.3%
Jun - 12 3.6% 0.0% 5.4% 8.9%
Sep - 12 2.7% -0.7% 3.9% 8.6%
Dec - 12 0.6% -5.9% 3.0% 7.4%
Mar - 13 9.3% 1.4% 6.6% 12.3%
Jun - 13 7.6% 2.2% 6.4% 10.4%Sep - 13 6.4% 1.5% 5.7% 10.4%Dec - 13 2.7% -2.9% 4.8% 9.1%Mar - 14 7.5% 2.9% 7.5% 10.3%Jun - 14 5.7% 2.5% 5.5% 9.5%Sep - 14 5.4% 1.3% 5.4% 8.9%
( * ) Not reported. Medians by country. The name of the country is disclosed if reporting institutions are more than 3.
Banks are classified in the size class according to the their average total assets between Dec. 2009 and Sep 2014
Period Weighted average 25th 50th 75th
5th and 95th pct, interquartile range and median.Total numerator and denominator.
December 2009=100.
Country dispersion (as of Sept 2014) KRI by size class
Profitability
KRI: 22 - Return on equity
Dispersion Numerator and denominator: trends
-40%
-30%
-20%
-10%
0%
10%
20%
30%
40%
0
50
100
150
200
250
300Numerator
Denominator
0%
1%
2%
3%
4%
5%
6%
7%
8%
9%
10%
Top 15 Others All banks
-425%
-350%
-275%
-200%
-125%
-50%
-12%
-9%
-6%
-3%
0%
3%
6%
9%
12%
15%
18%
10 8 SE 6 5 1 4 ES GB 2 FR 7 3 DE 13 IT 9 11 GR 12
EU
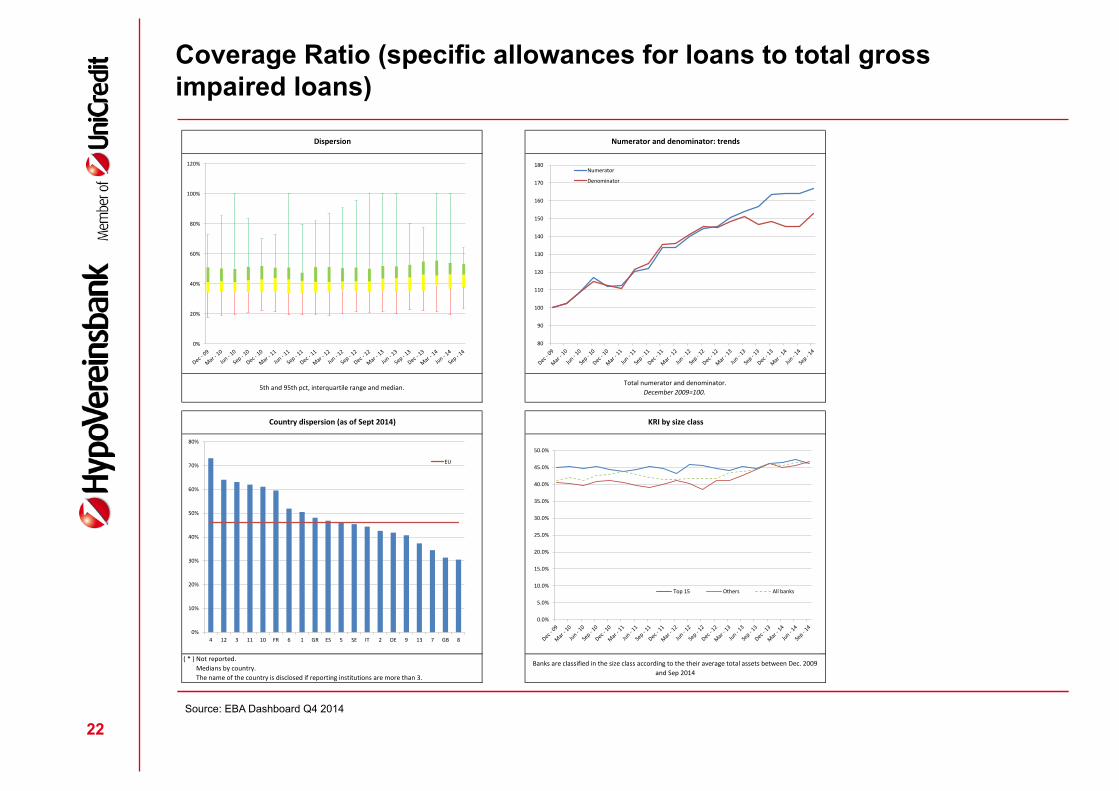
Coverage Ratio (specific allowances for loans to total gross impaired loans)
22 Source: EBA Dashboard Q4 2014
10
Dec - 09 41.6% 34.3% 41.3% 51.1%
Mar - 10 41.7% 34.7% 41.9% 50.3%
Jun - 10 41.6% 34.6% 41.2% 50.0%
Sep - 10 42.5% 34.6% 42.5% 51.5%
Dec - 10 41.4% 34.5% 43.0% 51.9%
Mar - 11 42.3% 34.6% 43.8% 50.9%
Jun - 11 41.2% 33.7% 42.9% 50.9%
Sep - 11 40.7% 33.7% 42.1% 47.6%
Dec - 11 41.0% 34.3% 41.3% 51.1%
Mar - 12 41.0% 34.8% 41.4% 51.4%
Jun - 12 41.3% 35.8% 41.7% 50.6%
Sep - 12 41.3% 35.1% 41.8% 50.9%
Dec - 12 41.8% 34.7% 41.7% 50.1%
Mar - 13 42.4% 35.6% 43.5% 52.0%
Jun - 13 42.4% 34.9% 43.8% 51.7%
Sep - 13 44.4% 35.6% 44.4% 52.8%
Dec - 13 46.0% 35.6% 46.1% 55.0%
Mar - 14 46.9% 39.2% 45.5% 55.6%
Jun - 14 46.9% 36.8% 46.4% 53.9%
Sep - 14 45.5% 37.3% 46.1% 53.3%
Credit Risk and Asset Quality
KRI: 14 - Coverage ratio (specific allowances for loans to total gross impaired loans)
Dispersion Numerator and denominator: trends
5th and 95th pct, interquartile range and median.Total numerator and denominator.
December 2009=100.
Country dispersion (as of Sept 2014) KRI by size class
( * ) Not reported. Medians by country. The name of the country is disclosed if reporting institutions are more than 3.
Banks are classified in the size class according to the their average total assets between Dec. 2009 and Sep 2014
Period Weighted average 25th 50th 75th
80
90
100
110
120
130
140
150
160
170
180Numerator
Denominator
0%
10%
20%
30%
40%
50%
60%
70%
80%
4 12 3 11 10 FR 6 1 GR ES 5 SE IT 2 DE 9 13 7 GB 8
EU
0.0%
5.0%
10.0%
15.0%
20.0%
25.0%
30.0%
35.0%
40.0%
45.0%
50.0%
Top 15 Others All banks
0%
20%
40%
60%
80%
100%
120%

Overview of the main risks and vulnerabilities in the EU banking sector
23 Source: EBA Dashboard Q4 2014
4
Level Expected Trend Level Forward
Trend
Asset quality
-1 -1
The AQR and stress test resulted in more clarity on problem loansand level of impairments/provisions. However, asset qualityremains a major challenge, also in light of increasingly uncertaineconomic developments with lower growth prospects in the EUand worldwide (including emerging markets). Credibility of banks’risk weighted assets is also a challenge over seemingly improvingcapital ratios. Banks remain vulnerable to exogenous shocks (e.g.FX and commodity price volatilities).
Volatility and risk of decreasing
market liquidity
0 0
Geopolitical tensions and political risks rise again, including risksfrom elections in several EU countries, Russia / Ukraine, etc.Market volatility continues to be affected by the divergingmonetary policy stances by global central banks, including risk ofdeflation. Financial markets are vulnerable to a reversal of marketsentiment, to asset price volatility and to decreasing marketliquidity.
IT risk, litigation risk
-1 -1
IT and internet related risks (e.g. cyber-risks) are growing further.Litigation costs have become increasingly onerous andunpredictable, and further costs from misconduct fines andsettlements are expected.
Interest rates
0 0
Low interest rates help maintain asset quality and improveaffordability of bank credit, but affect profitability by reducedinterest income. Low interest rates also provide incentives forincreased risk taking and for loan forbearance.
Index/FX investigations,
mis-selling-1 -1
Confidence in banks continues to be affected by legacy practices.Litigation costs have been substantial and continue to materialize,in some cases severely impacting profitability levels.
Margins, provisions,
business model changes
-1 -1
Non-performing loans still stand close to their peak and interestincome generation opportunities are still reduced. New lendingseems to be recovering, although net interest margins remain low.Additional pressure is on banks with low profitability to rethinkbusiness models. Legal and redress costs have and will continue tomaterialize, in some cases severely impacting banks' profitability.
Market funding and liquidity
0 0
Banks, including those from peripheral countries, benefited fromstrong investor demand for European banks’ debt in combinationwith the reduction of their issuance volume. However, issuancevolumes have been volatile. No real shortage of market fundinghas been observed, but access to market funding at reasonableprices remains susceptible to adverse news. However, there is anongoing high risk of contracting liquidity in the funding market.
Reliance on central bank
funding-1 0
Even though more and more banks have returned to fundingmarkets many institutions rely on central bank funding. The shareof market funding as well as through deposits from customersremained rather stable. Issuance volumes of CoCo bonds havebeen significant.
Regulatory initiatives
-1 0
Regulatory clarity has further improved, though execution risksremain ahead, e.g. on TLAC / MREL and new regulation in respectof the application of the internal rating based approach.
Continued lack of confidence,
sovereign/bank link
-1 -1
Despite certain improvements, geographical fragmentation inrespect of asset quality, bank restructuring and of fundingconditions continues in the EU, mainly between large cross-borderbanks and smaller banks, but also between countries. Rates forsimilar companies still diverge in different countries. There is anongoing low level of cross-border lending, and someretrenchment of banks to home markets can be observed. Itremains an expectation that the linkage between banks and theirsovereigns will decrease in future again.
Fiscal policy & effectiveness,
debt restructuring-1 -1
Non-negligible fiscal deficits persist throughout the EU. It is notyet clear if fiscal policy will coincide with monetary policy toreduce deflationary risks. There is again an increasing risk of debtrestructuring of some countries.
-1 0 1
High Medium Low
Increasing Stable Decreasing
Level The level of risk summarises, in a judgmental fashion, the probability of the materialisation of the risk factors and the likely impact on banks. The assessment takes into consideration the evolution of market and prudential indicators, NSAs and banks’ own assessments as well as analysts’ views.Trend
Liqu
idity
& F
undi
ng Access to funding and maturity distribution
Funding structure
Envi
ronm
ent
Regulatory environment
Fragmentation
Sovereign risk
Last quarter (memo) Current quarter
Overview of the main risks and vulnerabilities in the EU banking sector
Capi
tal
Pilla
r 1
Credit risk
Market risk
Operational risk
Pilla
r 2
Concentration risk, IRRBB and other
Reputational and legal
Profitability
Bank risk Risk drivers
Level of risk
Contributing factors/interactions

Overview of the main risks and vulnerabilities in the EU banking sector
24 Source: EBA Dashboard Q4 2014
4
Level Expected Trend Level Forward
Trend
Asset quality
-1 -1
The AQR and stress test resulted in more clarity on problem loansand level of impairments/provisions. However, asset qualityremains a major challenge, also in light of increasingly uncertaineconomic developments with lower growth prospects in the EUand worldwide (including emerging markets). Credibility of banks’risk weighted assets is also a challenge over seemingly improvingcapital ratios. Banks remain vulnerable to exogenous shocks (e.g.FX and commodity price volatilities).
Volatility and risk of decreasing
market liquidity
0 0
Geopolitical tensions and political risks rise again, including risksfrom elections in several EU countries, Russia / Ukraine, etc.Market volatility continues to be affected by the divergingmonetary policy stances by global central banks, including risk ofdeflation. Financial markets are vulnerable to a reversal of marketsentiment, to asset price volatility and to decreasing marketliquidity.
IT risk, litigation risk
-1 -1
IT and internet related risks (e.g. cyber-risks) are growing further.Litigation costs have become increasingly onerous andunpredictable, and further costs from misconduct fines andsettlements are expected.
Interest rates
0 0
Low interest rates help maintain asset quality and improveaffordability of bank credit, but affect profitability by reducedinterest income. Low interest rates also provide incentives forincreased risk taking and for loan forbearance.
Index/FX investigations,
mis-selling-1 -1
Confidence in banks continues to be affected by legacy practices.Litigation costs have been substantial and continue to materialize,in some cases severely impacting profitability levels.
Margins, provisions,
business model changes
-1 -1
Non-performing loans still stand close to their peak and interestincome generation opportunities are still reduced. New lendingseems to be recovering, although net interest margins remain low.Additional pressure is on banks with low profitability to rethinkbusiness models. Legal and redress costs have and will continue tomaterialize, in some cases severely impacting banks' profitability.
Market funding and liquidity
0 0
Banks, including those from peripheral countries, benefited fromstrong investor demand for European banks’ debt in combinationwith the reduction of their issuance volume. However, issuancevolumes have been volatile. No real shortage of market fundinghas been observed, but access to market funding at reasonableprices remains susceptible to adverse news. However, there is anongoing high risk of contracting liquidity in the funding market.
Reliance on central bank
funding-1 0
Even though more and more banks have returned to fundingmarkets many institutions rely on central bank funding. The shareof market funding as well as through deposits from customersremained rather stable. Issuance volumes of CoCo bonds havebeen significant.
Regulatory initiatives
-1 0
Regulatory clarity has further improved, though execution risksremain ahead, e.g. on TLAC / MREL and new regulation in respectof the application of the internal rating based approach.
Continued lack of confidence,
sovereign/bank link
-1 -1
Despite certain improvements, geographical fragmentation inrespect of asset quality, bank restructuring and of fundingconditions continues in the EU, mainly between large cross-borderbanks and smaller banks, but also between countries. Rates forsimilar companies still diverge in different countries. There is anongoing low level of cross-border lending, and someretrenchment of banks to home markets can be observed. Itremains an expectation that the linkage between banks and theirsovereigns will decrease in future again.
Fiscal policy & effectiveness,
debt restructuring-1 -1
Non-negligible fiscal deficits persist throughout the EU. It is notyet clear if fiscal policy will coincide with monetary policy toreduce deflationary risks. There is again an increasing risk of debtrestructuring of some countries.
-1 0 1
High Medium Low
Increasing Stable Decreasing
Level The level of risk summarises, in a judgmental fashion, the probability of the materialisation of the risk factors and the likely impact on banks. The assessment takes into consideration the evolution of market and prudential indicators, NSAs and banks’ own assessments as well as analysts’ views.Trend
Liqu
idity
& F
undi
ng Access to funding and maturity distribution
Funding structure
Envi
ronm
ent
Regulatory environment
Fragmentation
Sovereign risk
Last quarter (memo) Current quarter
Overview of the main risks and vulnerabilities in the EU banking sector
Capi
tal
Pilla
r 1
Credit risk
Market risk
Operational risk
Pilla
r 2
Concentration risk, IRRBB and other
Reputational and legal
Profitability
Bank risk Risk drivers
Level of risk
Contributing factors/interactions

Key challenges to the Banking Group
! Integrate new, bank-specific Total SREP Capital Requirements and Overall Capital Requirements into the Internal Capital Adequacy Assessment Process
! The new capital requirements will be derived based on a conservative “pillar 1 plus” approach, harmonizing the various pillar 2 interpretations currently in place in the different countries. The capital requirements have to be met over a multi year horizon also under adverse scenarios.
! The use of internal models will be restricted to portfolios that allow for a sufficient statistical basis. Internal rating models for low default portfolios at stake (banks, sovereigns, multinational corporates). Emphasis on standardized approach as floor. IMM approach for OpRisk at stake.
! Benchmarking is a key pillar of the new regulatory regime, based on extended reporting requirements: Asset quality review, Short Term Exercise, AnaCredit, Finrep 2.0. These reporting requirements cover risk and finance data, and go across the typical CRO / CFO silos. This creates the need for a fundamental overhaul of IT and processes, also in the context of the requirements stipulated in BCBS 239 on Risk Data Aggregation.
! National requirements partly coexist, e.g. German MaRisk issued by BaFin, together with local regulatory reporting requirements, e.g. FinaV. It remains to be seen how these national requirements interact with the SSM.
25

Key challenges to the Banking Group … continued …
! It also remains to be seen to what extent all this information generated in the new regulatory regime is going to be disclosed to the public. See e.g. ECB stresstest results, EBA dashboard etc.
! Definition of going-concern will drastically change, as market expectation will create pressure towards transparency, even where public disclosure is not mandatory.
! Restrictions to free flow of capital and liquidity within the group, imposed e.g. by the supervisor in the context of the resolution plan
26

Risk Appetite – Integrated Process across the group
27 Source: Internal source
6
RAF settingand approval
Group RAF embeddedthresholds cascaded toLEs
Consistency check betweenGroup RAF and GroupAmbitions
Local RAF approval
Nov - DecOct
Risk Appetite Framework:A process fully integrated within the budget and consistent across the Group
RAF LEs1
LEs RAF
LEs Budget
TOPDOWN
BOTTOMUP
Budget LEs1
Group RAFGroup Budget
Dec-Jan
UCISpA
UCBAG
UCBAAG PEKAO
LE 1
LE 2
LE 1
LE 2
LE 1
LE 2
LE 1
LE 2
UniCreditGroup
Capital Adequacy
Profitability & Risk Funding & Liquidity
External positioning andreputation
Specific Risk Profiles
Key dimensions covered
� Group Risk Appetite covers a broad set of risk and return profile, both Pillar I andPillar II, with the aim to steer the budget evolution, preventing undesired risks
� Group Risk appetite is cascaded at subgroup and LEs level, ensuring theconsistency across the Group
� Group RAF fully integrated in the budget processboth at Group and local level

Risk Appetite – Steering via target corridor
28 Source: Internal source
12
DIMENSION
Regulatoryrequirements
ProfitabilityandRisk
Controlonspecificrisks
CBBFG stock (€/bn)
Risk ownership andpositioning
Credit
Market
Operational
Liquidity
Interest Rate
Cash Horizon (days)
ELOR (%)
Max VaR limit TB (€/mn)
Max Sovereign Exposure (€/bn)
NII Sensitivity (%)
Max EL (%)
Min Coverage on Imp. (%)
NOP/RWA (Bps)
Operating costs/RWA (Bps)
Earning Volatility (€/mn)
Common Equity Tier1 Ratio (%)
Total Capital Ratio (%)
Risk Taking Capacity (%)
Leverage Ratio (x)
LCR (%)
Target Rating
Max RWA of Market Risk (%)
Cost of Risk (Bps)
Geo Diversification (%)
TARGET TRIGGER LIMIT
Risk Appetite Framework:RAF KPIs to be properly cascaded into day-to-day business activities
Group RAFKPIs to beproperlycascaded inorder properlysteer thebusiness
Focus on the next slides
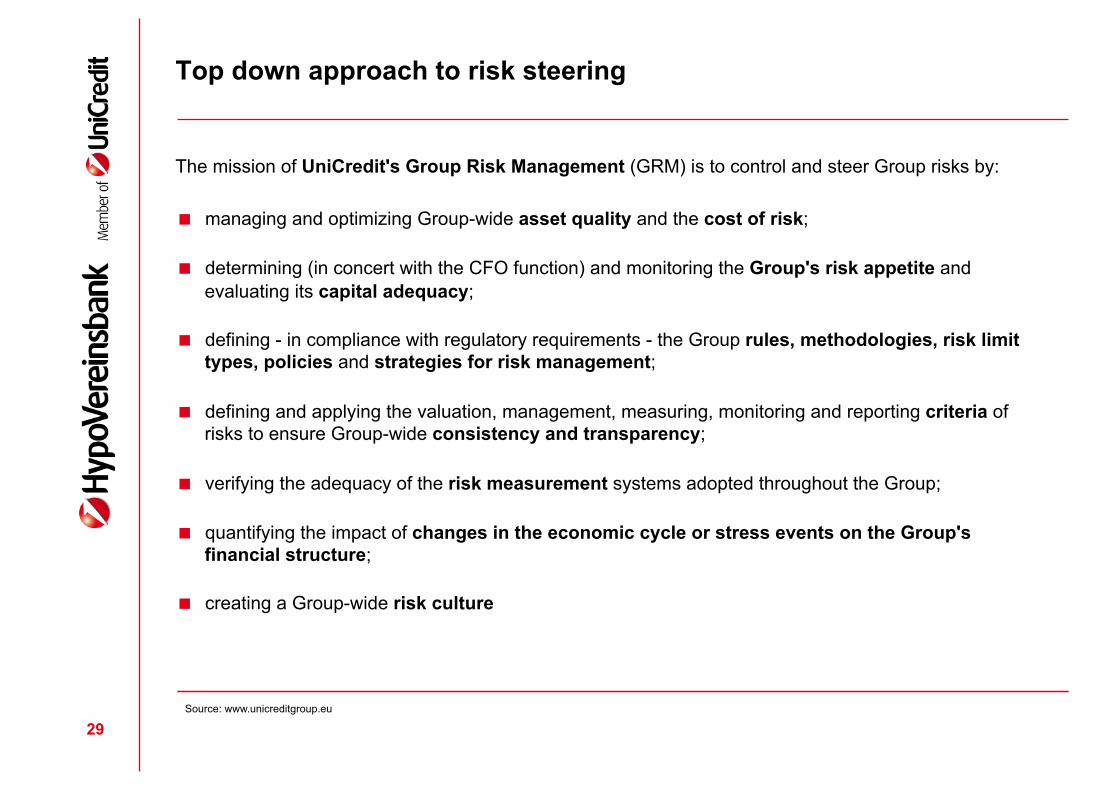
Top down approach to risk steering
The mission of UniCredit's Group Risk Management (GRM) is to control and steer Group risks by:
! managing and optimizing Group-wide asset quality and the cost of risk;
! determining (in concert with the CFO function) and monitoring the Group's risk appetite and evaluating its capital adequacy;
! defining - in compliance with regulatory requirements - the Group rules, methodologies, risk limit types, policies and strategies for risk management;
! defining and applying the valuation, management, measuring, monitoring and reporting criteria of risks to ensure Group-wide consistency and transparency;
! verifying the adequacy of the risk measurement systems adopted throughout the Group;
! quantifying the impact of changes in the economic cycle or stress events on the Group's financial structure;
! creating a Group-wide risk culture
29 Source: www.unicreditgroup.eu

Steering the credit portfolio: Managing concentrations
! Steering single name concentration on a group wide level entails challenges to map common clients across legal entities, obeying legal constraints imposed by data protection and bank secrecy.
! The risk appetite for the larger clients is defined consistently across the group in a two-staged
process: ! Top-down proposal of limits for each customer based on a model that makes reference to
the risk contributions of the single customers, and the available headroom in risk taking capacity
! Bottom-up plausibilization and adjustments of these proposals, based on concrete deal pipeline and perceived business opportunities.
! Steering portfolio concentrations with respect to industries, regions and further dimensions on a group wide level entails unique definitions and technical criteria across the group as a precondition to consistent aggregation
! Need for semantic integration across the legal entities, e.g. with respect to risk metrics, industry and product definitions.
! Risk models cannot be easily compared across the group hierarchy because of the different consolidation perimeters, and potentially also differences in methodology and parameterization.
30
Interplay of accounting and regulation
! The interplay of accounting and regulation and its impact on bank behavior continues to be a topic of continuous discussion and research, which has spurred the Basle Committee to initiate a review with the following questions:
! Has fair value accounting contributed to default contagion in the financial crisis and under which circumstances could this become an issue in the future?
! What are the implications of different provisioning regimes for bank management? How can specific approaches mitigate pro-cyclical effects?
! To what extent can disclosure rules enhance market discipline? How do disclosure rules affect bank behavior, in particular how is market discipline affected by recent regulatory developments in reaction to the financial crisis? Does the extent of market discipline differ between crisis and normal times? What lessons can be learned, for example, for public disclosure, either by banks or by regulators, eg the disclosure of regulatory stress test results?
31 Source: Basel Committee on Banking Supervision, Working Paper 28, January 2015
Prudential filters
! Prudential filters were stipulated in 2004 CEBS guideline and 2006 CRR in order to maintain quality of regulatory capital for institutions using IAS/IFRS for prudential reporting:
! Gains and losses on cash flow reserves, which do not arise from from cash flow hedges on AFS instruments, and
! gains and losses resulting from valuing liabilities at fair value due to changes in own credit standings are to be excluded from own funds for the calculation of regulatory capital.
! A study of the Accounting Task Force of the Basel Committee revealed that if the filters had been removed during 2016 and 2011, unrealised gains and losses on AFS instruments would have been the largest contributor of changes to banks’ Tier 1 capital.
! The EU Capital Requirements Regulation, which came into force in January 2014, disposes of nearly all prudential filters for calculation of own funds, and in particular the one referring to unrealized gains and losses which are recognized in the revaluation reserve. It retains, however, a prudential filter for unrealised gains and losses arising from cash flow hedges and for changes in the value of liabilities (debt instruments and derivatives) due to changes in own credit risk. This leads to a reduction of differences between regulatory and accounting capital.
32 Source: Basel Committee on Banking Supervision, Working Paper 28, January 2015

IFRS 9 influences regulatory norms in various ways
33
! Own funds: Decrease in retained earnings due to higher provisions. IRB-EL-LLP-comparison can potentially offset the reduction in retained earnings. Same for DTA. OCI changes according to FVtOCI.
! Capital requirements: Impact on basis depends on credit risk approach (standardized vs. IRBA). Impact on RWA.
! Regulatory ratios – All ratios with reference to own funds are affected: Large Exposure Regime, Leverage Ration. Potentially NSFR. No direct impact on LCR expected.
! Finrep: Interaction regarding reporting frequency and processes. Changes in the templates. Interaction with forebearance and NPL concepts.
! BCBS 239 (Risk Data Aggregation): Alignment of risk and finance data. Accelation of processes and data delivery.
! Further implications: Changes to disclosure requirements. Changes to KPIs used in the context of the remuneration system.

Accounting-based going-concern approach vs. economic value-based gone-concern approach
! Typical gone-concern approaches to pillar 2 are often based on highly theoretical assumptions that are difficult to integrate into the operative steering:
! Liquidation assumption, based on a one-year risk horizon at extreme confidence level (typically derived from survival probability associated to target rating)
! Making reference to economic value of the assets, irrespective of accounting treatment
! An accounting-based going-concern approach, that consistently analyses the balance sheet impact of the various risk types, has multiple advantages:
! “Provides a risk perspective that is closely linked to P&L and balance sheet values and reflects the reality of day-to-day bank management in a more comprehensible way than a pure liquidation scenario approach.”
! “Especially at board level, the most important control parameters are regulatory capital, RWA and P&L, next to economic value added.”
! “Lends itself in a natural way to define actionable early warning indicators for the activation of recovery measures in the context of the Recovery and Resolution regime.”
! The impact on regulatory capital, capital requirements and all relevant regulatory ratios can be consistently analyzed and steered.
! Typically, lower confidence levels can be used: Models don’t have to be stretched to extreme regimes that are often impossible to backtest / validate.
34 Source: Minh Banh, Peter Mach, Thomas Siwik: In jeder Hinsicht risikotragfähig – die konsistente Umsetzung des bilanzorientierten Going-Concern Ansatzes. Zeitschrift für das gesamte Bank- und Börsenwesen, April 2014, 62. Jahrgang

Accounting-based going-concern approach: Differentiated view on the impact on income statement and balance sheet
! The impact of the various risk types on the income statement and the balance sheet need to be modeled in a differentiated manner, taking into account the relevant filters. Accordingly, the type of impact can be classified as
! Income risk ! Valuation risk
! Example: Interest rate risk ! Clearly, interest income is directly affected ! Also, the value of assets measured at fair value is affected
! Example: Credit risk ! Credit losses due to defaults of customers are directly reflected in the balance sheet, no
filters apply. ! However the impact of credit migration risk has to be differentiated according to the
classification of the assets as measured at fair value or at amortized cost.
35 Source: Minh Banh, Peter Mach, Thomas Siwik: In jeder Hinsicht risikotragfähig – die konsistente Umsetzung des bilanzorientierten Going-Concern Ansatzes. Zeitschrift für das gesamte Bank- und Börsenwesen, April 2014, 62. Jahrgang
Some final thoughts
Have banks or bank-supervisors been able to adequately qualify the risks inherent in the respective business models? Have banks or bank-supervisors been able to adequately quantify the risks inherent in the business models? Have all regulatory loopholes been closed?
Ø Is a more detailed involvement of the supervisor in bank-individual approaches to risk measurement and management the right answer to the problems observed in the past?
Ø Would it be sufficient for the supervisor to concentrate on systemic stability and macro-prudential oversight, in an environment where no institution is too big to fail (i.e. with effective bank resolution regimes in place, relieving the tax-payer from having to assume entrepreneurial risk)?
36 Source: Argument adopted from Jan Körnert, Paradigmenwechsel in der deutschen Bankenregulierung, ZHR 176 (2012) 96 - 127