Impact of rice imports on rice production in Timor...
46
Impact of Rice Imports on Rice Production in Timor-Leste January 2013 By Philip Young, Consultant to the Seeds of Life program Commissioned Study To inform and guide national policies on food and seed security
Transcript of Impact of rice imports on rice production in Timor...
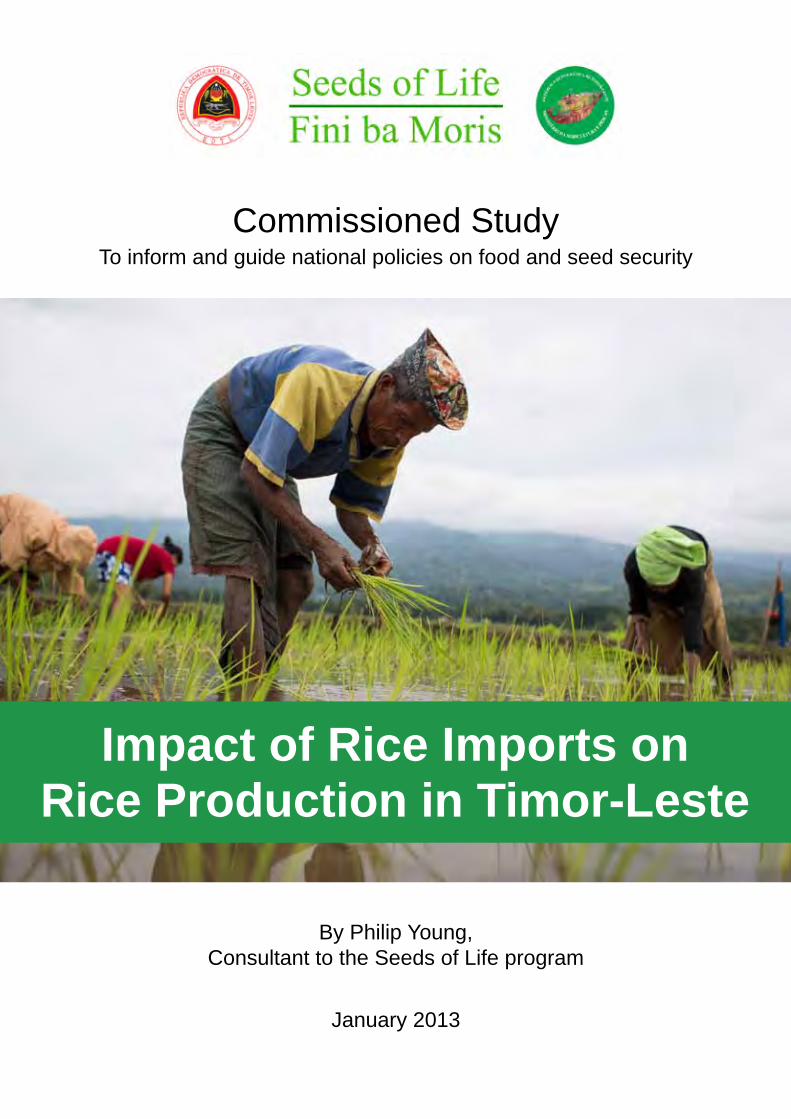
Impact of Rice Imports on Rice Production in Timor-Leste
January 2013
By Philip Young,Consultant to the Seeds of Life program
Commissioned StudyTo inform and guide national policies on food and seed security
C O M M I S S I O N E D S T U D Y
T O I N F O R M A N D G U I D E N A T I O N A L P O L I C I E S O N F O O D A N D S E E D S E C U R I T Y
Suggested citation:
Young, Philip. 2013. Impact of Rice Imports on Rice Production in Timor-Leste. Commissioned Study for the Seeds of Life program, Ministry of Agriculture and Fisheries, Dili, Timor-Leste
This study, or any part of it, should not be reproduced without the permission of Ministry of Agriculture and Fisheries, or the Seeds of Life Program. The findings, interpretations, and conclusions expressed in this report are entirely those of the author and should not be attributed in any manner to either the Ministry of Agriculture and Fisheries, or the Seeds of Life Program.
Impact of Rice Imports
on Rice Production
in Timor-Leste

Background
The Technical Advisory Group (TAG) which advises the Ministry of Agriculture and Fisheries’ (MAF’s) Seeds of Life III Program (MAF-SoL) recommended that MAF-SoL complete a series of studies which focus on issues which have the potential to influence and guide Timor-Leste’s national food security policy, and its underlying national seed production and distribution policy. This recommendation reflects the TAG’s (and other Development Partners’) concerns that some current policies (such as rice importation and price subsidization) are impacting negatively on sectoral development initiatives, such as MAF-SoL’s introduction of new staple food crop1 varieties and MAF’s plan to refurbish damaged irrigation schemes2.
Therefore MAF-SoL employed a Consultant3 to complete four studies4:
(i) An economic comparison of the impact of imported rice on the (irrigated5) rice production sector, and its cost-effectiveness, compared with investments in crop (production) inputs and distribution - to inform the food security policy;
(ii) An assessment of the effects on the agricultural sector of imported seed of untested varieties (which are) distributed free (to farmers) by MAF, compared with a research-based process of varietal identification (and associated) national seed production - to inform the policy on seed (production and distribution);
(iii) An assessment of the effects on the formal and informal seed sectors of targeting vs. non-targeting (for) the distribution of free seed by MAF - to inform the policy on seed; production and distribution; and
(iv) An assessment of the comparative impact of implementing the International Fund for Agriculture Development (IFAD) funded Timor-Leste Maize Storage Project (TLMSP) as currently planned (independent from MAF-SoL), compared with complementary collaboration with MAF-SoL in TLMPS’s target districts.
This report presented here is on the first study. This study was completed in early 2013. Since then some of the financial and economic models have been updated as part of additional analysis of irrigation economics in Timor-Leste for the Ministry of Finance and the World Bank. Whilst the overall conclusions and recommendations have not changed, some of the numbers have. Therefore readers will find that subsequent reports on irrigation economics contain slightly different models which are updates of those prepared for this study.
1 In this report staple food crops are defined as rice, maize, sweet potato and cassava (the latter considered to be roots and tubers). 2 This example has been included because the conclusions from a recent appraisal of 10 such irrigation schemes (completed by the author – reference footnote 7) are directly relevant to this study. 3 Mr. Philip Young. 4 Note: the fourth study was not listed in the Consultant’s Terms of Reference, but was completed as a matter of course because the information required was available from the first three studies, and from associated work completed by the Consultant on the International Fund for Agriculture Development’s (IFAD’s) Timor-Leste Maize Storage Project (TLMSP). 5 The words in parentheses have been added to the Terms of Reference.

Page i
Table of Contents Abbreviations and Acronyms ................................................................................................................................................................. iii
Executive Summary ..................................................................................................................................................................................... iv
Comment on the Study ................................................................................................................ iv
Overall Conclusion ........................................................................................................................ iv
Other Conclusions ......................................................................................................................... vi
Recommendations....................................................................................................................... vii
1. Introduction .............................................................................................................................................................................................. 1
1.1 Sources of Information and Data ................................................................................ 1
1.2 Terms of Reference .......................................................................................................... 2
2. Discussion of Issue and Background Information ............................................................................................................ 3
2.1 Interpretation of Terms of Reference ....................................................................... 3
2.2 Demand for Staple Food................................................................................................. 4
2.3 Rice Production and Rice Balance .............................................................................. 5
2.4 Rice Imports ....................................................................................................................... 6
2.5 Food and Nutrition Security Task Force Reports ................................................ 9
2.6 Imports of Other Food ................................................................................................. 10
2.7 Rice Distribution ............................................................................................................ 10
2.8 Attempted Reconciliation – A “National Rice Balance Sheet” ...................... 12
2.9 MAF-SoL Rice Purchase Survey ............................................................................... 14
3. Analyses ................................................................................................................................................................................................... 17
3.1 Introduction ..................................................................................................................... 17
3.2 Cost of Growing Rice: River Diversion Schemes Proposed by MAF ........... 17
3.3 Cost of Growing Rice: River Diversion Scheme, a Generic Model ............... 19
3.4 Cost of Growing Rice in Timor-Leste: Tube-Well Schemes ........................... 21
3.5 Other Options for Growing Rice in Timor-Leste................................................ 22
3.6 Economic Value of Rice ............................................................................................... 23
3.7 Impact of Consumer Rice Subsidies on Domestic Rice Production............ 24
3.8 Factors Other than Price Influencing Rice Production ................................... 24
3.9 Explaining Apparent Perverse Behaviour by Rural Communities ............. 27
4. The Fundamental Questions ....................................................................................................................................................... 28
4.1 Terms of Reference Revisited ................................................................................... 28
4.2 Impact of Imported Rice on Rice Production...................................................... 28
4.3 Impact of Subsidized Rice on Domestic Production ........................................ 30
4.4 Cost Effectiveness of Rice Importation Compared with Investment in Rice Production ......................................................................................................... 30

Impact of rice imports on rice production in Timor-Leste
Page ii
5. Conclusions ............................................................................................................................................................................................ 33
5.1 Overall Conclusion ........................................................................................................ 33
5.2 Other Conclusions ......................................................................................................... 33
5.3 Recommendations......................................................................................................... 34
List of Figures
Figure 1: Costs per Incremental Mt of Staple Food – four Models .................................. 19
Figure 2: Theoretical Rice Price Supply Response Graph ................................................ 28
List of Tables
Table 1: Economic Costs of Importing and Growing Rice in Timor-Leste ...................... v
Table 2: Revised Demand for Staple Food in Timor-Leste (2012 – 2030) ...................... 4
Table 3: Revised Staple Food Production and Balance – Timor-Leste (2012 – 2030) ... 5
Table 4: Food Imports Recorded and Reported by Customs (Mt) ................................... 7
Table 5: Reported National Rice and Maize Balances (Mt) .............................................. 8
Table 6: Reported MTCI and MCIE Rice Stocks (Mt) ......................................................... 9
Table 7: Rice Distribution by MTCI and MCIE in Timor-Leste (Mt)............................... 11
Table 8: Rice Stocks Reconcilliation – Based on FNSTF Data ......................................... 12
Table 9: Rice Stocks Reconcilliation – Adjusted Domestic Production and
Consumption Figures .......................................................................................... 13
Table 10: Number of Months in which Rural Households Purchase Rice ....................... 15
Table 11: Months in which Rice is Purchased, Amounts Purchased and
Calculation of Annual Demand for Rice ............................................................. 16
Table 12: Production, Financial and Economic Analyses: 1,000 ha Generic
Irrigation Scheme – River Diversion system ..................................................... 20
Table 13: Production, Financial and Economic Analyses: 1,000 ha Generic
Irrigation Scheme – Tube-Well System ............................................................. 21
Table 14: Rice Import Parity price – Delivered Rural Areas ............................................ 23
Table 15: Estimated Rice Imports to Balance Supply and Demand (Mt) ........................ 29
Table 16: Economic Costs of Importing and Growing Rice in Timor-Leste .................... 31
Page iii
Abbreviations and Acronyms
AusAID Australian Agency for International Development
cif Currency, Insurance and Freight
CSPG Community Seed Production Group
EIRR Economic Internal Rate of Return
FAO Food and Agriculture Organization
FNSTF Food and Nutrition Security Task Force – in MAF’s National Directorate for Policy and Planning
FSS Formal Seed Sector
IFAD International Fund for Agriculture Development
ISS Informal Seed Sector
MAF Ministry of Agriculture and Fisheries
MAF-SoL Ministry of Agriculture and Fisheries’ Seeds of Life III Program
MCIE Ministry of Commerce, Industry and Environment (previously MTCI)
MPS Major Projects Secretariat (in Ministry of Finance)
Mt Metric Tonne = 1,000 kg
MTCI (former) Ministry of Tourism, Commerce and Industry
NDE National Directorate of Statistics (in Ministry of Finance)
SDP Strategic Development Plan
SoL Seeds of Life
TAG Technical Advisory Group – to MAF-SoL
TLMSP IFAD’s Timor-Leste Maize Storage Project
TLSLS Timor-Leste Sustainable Livelihoods Survey
Page iv
Executive Summary
Comment on the Study
1. This study required considerable background information and sectoral understanding to inform readers sufficiently to follow the arguments and logic which under-pin the analyses completed to address the Terms of Reference. For example it is necessary to:
(i) know the demand for and current supply of rice – the latter in terms of imports and domestic production;
(ii) understand the current format, contents, accuracy and reliability of reports on food supply, demand and balance, prepared by the Food and Nutrition Security Task Force (FNSTF) within the Ministry of Agriculture and Fisheries (MAF);
(iii) know the current level of subsidized rice distribution and attempt a reconciliation of a “National Rice Balance Sheet” with the objective of confirming reported rice supply, demand and balance figures;
(iv) understand the importation of non-rice foods, the impact of rice importation on staple food consumption patterns, and rice purchasing practices by rural households;
(v) know the cost of growing rice in Timor-Leste using current (river diversion) and alternative (possibly tube-well and small pump) irrigation systems, and the economic value of imported and domestically-grown grown rice; and
(vi) understand the impact of consumer rice subsidies on domestic rice production, and have an awareness of factors other than rice price which influence domestic rice production.
Overall Conclusion
2. The key conclusion is that it is far more expensive for Timor-Leste to grow rather than to import rice, at least in the current agriculture environment in which sectoral investment is heavily skewed in favour of irrigation infrastructure (“hardware”). This is because “software support packages” (farmer extension and training services, provision of production inputs, and markets for surplus staple foods) are not available to complement “hardware packages” (irrigation construction), and are not likely to be available in the foreseeable future.
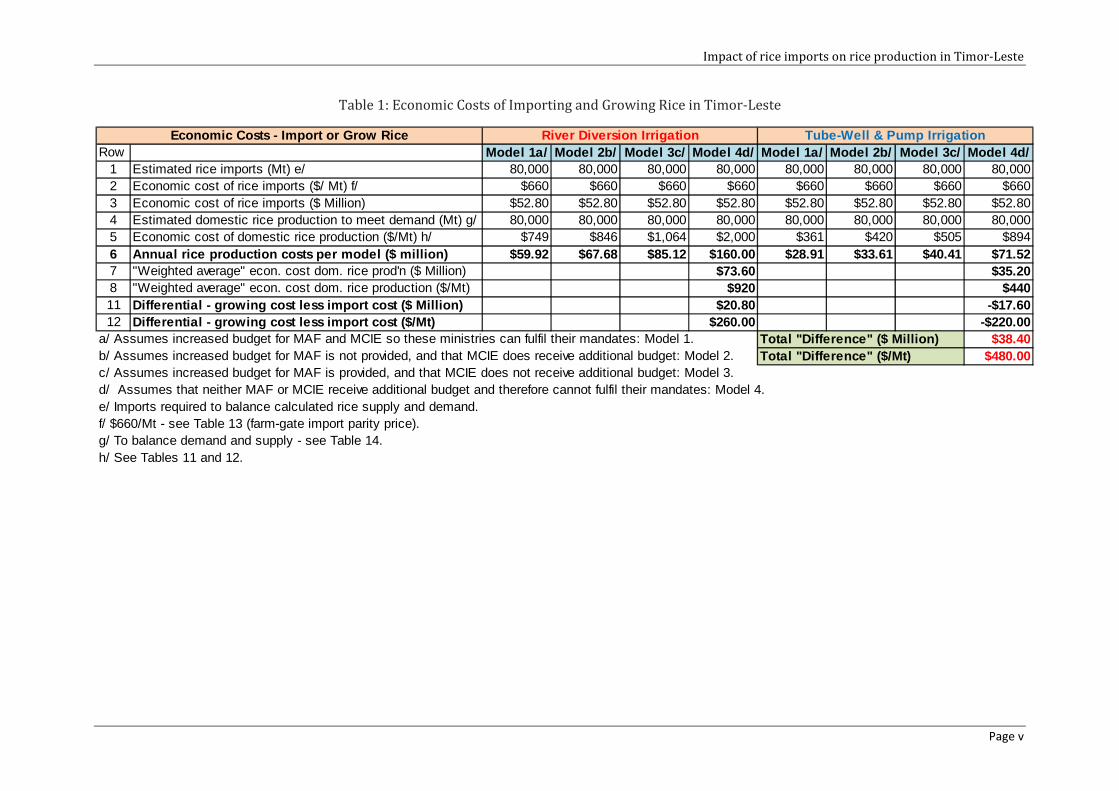
3. Table 1 summarizes the economic costs of importing and growing rice in Timor-Leste for two types of irrigation schemes (river diversion and tube-well) and four rice production models which are based on various assumptions related to the level of sectoral support provided by Government.
Impact of rice imports on rice production in Timor-Leste
Page v
Table 1: Economic Costs of Importing and Growing Rice in Timor-Leste
Row Model 1a/ Model 2b/ Model 3c/ Model 4d/ Model 1a/ Model 2b/ Model 3c/ Model 4d/1 80,000 80,000 80,000 80,000 80,000 80,000 80,000 80,0002 $660 $660 $660 $660 $660 $660 $660 $6603 $52.80 $52.80 $52.80 $52.80 $52.80 $52.80 $52.80 $52.804 Estimated domestic rice production to meet demand (Mt) g/ 80,000 80,000 80,000 80,000 80,000 80,000 80,000 80,0005 $749 $846 $1,064 $2,000 $361 $420 $505 $8946 $59.92 $67.68 $85.12 $160.00 $28.91 $33.61 $40.41 $71.527 $73.60 $35.208 "Weighted average" econ. cost dom. rice production ($/Mt) $920 $44011 $20.80 -$17.6012 $260.00 -$220.00
a/ Assumes increased budget for MAF and MCIE so these ministries can fulfil their mandates: Model 1. $38.40b/ Assumes increased budget for MAF is not provided, and that MCIE does receive additional budget: Model 2. $480.00c/ Assumes increased budget for MAF is provided, and that MCIE does not receive additional budget: Model 3.d/ Assumes that neither MAF or MCIE receive additional budget and therefore cannot fulfil their mandates: Model 4.e/ Imports required to balance calculated rice supply and demand.f/ $660/Mt - see Table 13 (farm-gate import parity price).g/ To balance demand and supply - see Table 14.h/ See Tables 11 and 12.
Tube-Well & Pump Irrigation
Estimated rice imports (Mt) e/
River Diversion Irrigation
Economic cost of rice imports ($/ Mt) f/
Differential - growing cost less import cost ($/Mt)Total "Difference" ($ Million)Total "Difference" ($/Mt)
Economic cost of domestic rice production ($/Mt) h/
Economic Costs - Import or Grow Rice
Differential - growing cost less import cost ($ Mil lion)
Economic cost of rice imports ($ Million)
"Weighted average" econ. cost dom. rice prod'n ($ Million)Annual rice production costs per model ($ million)
Impact of rice imports on rice production in Timor-Leste
Page vi
It shows that rice production in Timor-Leste using a river diversion irrigation system is very costly compared with importing rice (row 6, Model 4, Table 1). Rice imports currently cost about $53 million per year ($660/Mt for 80,000 Mt6) and it would cost $160 million per year ($2,000/Mt) to grow the equivalent tonnage under the current inefficient and unproductive rice production systems.
4. However if a more efficient and cheaper irrigation system was feasible (perhaps based on tube-wells and small pumps, and more intensive use of production inputs and improved market support) the economic cost of growing rice in Timor-Leste would be less than the cost of importing rice; about $440/Mt compared with $660/Mt. Using an intensive “rice-bowl” approach to irrigated rice production, rather than the current scattered “every district must have irrigation approach” would also reduce the cost of growing irrigated rice.
5. When the differential costs between the two irrigation strategies are compared (based on the average cost of the four rice production models (rows 7 and 8, Table 1) the very high cost of growing irrigated rice in Timor-Leste becomes even more apparent. The proposed use of river diversion irrigation schemes will cost about $38.40 million per year ($480Mt) more than an alternative approach based on tube-wells and the use of small pumps, plus more intensive use of production inputs and marketing services.
Other Conclusions
6. These are presented in note form.
(i) Timor-Leste will require 137,000 Mt of rice in 2013, increasing to 193,500 Mt in 2030. The country will never be self-sufficient in rice under the current production system and levels of Government support – an estimated deficit of 78,000 Mt in 2030. At present about 100,000 Mt of rice are imported annually by the private sector, with another 30,000 Mt imported by Government for subsidized distribution. Donations of rice in 2011 were about 18,000 Mt.
(ii) There a difference of 134,627 Mt between the reported and calculated closing rice stocks at the end of 2011 even though the quantities of rice imported and consumed are known with a reasonable degree of accuracy. One answer to this imbalance is that domestic rice production is not as high as officially reported. The only way to balance reported and calculated rice stocks is to assume that: (i) rice consumption per person is about 115 kg/year; and (ii) domestic rice (grain) production is only about 30,000 Mt/year. It is impossible to reconcile reported rice import and consumption figures using figures provided by Government.
6 The “average” volume of rice imports used for study modelling. Note that more than 100,000 Mt of rice were imported in 2011.

Impact of rice imports on rice production in Timor-Leste
Page vii
(iii) There is anecdotal evidence that 30,000 Mt of highly subsidized rice (sold for about $12.00/25 kg, or $0.48/kg) is impacting on the incentive for farmers to grow more than their families’ subsistence requirements. Farmers are reporting: “there is no point in growing more rice as there is
plenty of cheap rice in the market and even if we did grow more rice there
are no markets for our “surpluses”.
(iv) In the longer-term the direct impact of importing (say) 80,000 Mt of rice valued at $52.8 million every year is obvious – Timor-Leste’s rice farmers are not earning $52.8 million from the sale of domestically produced rice to local traders or MCIE, assuming that MCIE/Government is willing to absorb transaction and storage costs.
Recommendations
7. The analyses completed for this study indicate a number of confusing and inconsistent sets of figures on Timor-Leste’s rice sector, and strongly conflicting policies in terms of, on the one hand attempting to stimulate domestic rice production whilst on the other “flooding” the domestic market with cheap, subsidized rice. Furthermore rice production under the current river diversion river strategy is not competitive with imports, or with rice grown using cheaper tube-well, and more intensive production, irrigation systems.
8. The analyses completed have revealed a number of areas in Timor-Leste’s irrigated rice sector which require immediate attention and action. These are:
(i) Improved collection and reporting of data and information on rice production, demand and importation, to enable better decision-making in terms of: (a) how much rice to import; (b) rice price subsidization; (c) the impact of food consumption patterns on human nutrition; and (d) levels of investment in the sector and support in terms of annual operating funds. Action on this recommendation will require: (a) the allocation of additional support for FNSTF and its elevation to much higher and therefore influential position within the Government hierarchy; (b) much improved collection and reporting on a wide range of agriculture statistics; (c) improved analytical skills within MAF’s Policy and Planning Directorate, and (d) increased application of agriculture economics skills to decision-making related to investment in staple food production and the analysis of production strategy options.
(ii) Recognition (and action) by Government of the need to review how Timor-Leste grows irrigated rice, and the levels of investment and operational support required for the sub-sector to function efficiently. As a minimum this should include a detailed analysis of three options: (i) continued use of weir-based river diversion systems – with and without “software” support; (ii) testing and application of results for irrigated rice production based on tube-wells and small pumps – with and without “software” support; and (iii) more concentrated rice production (the “rice-bowl” approach) in favourable areas and locations which can be serviced efficiently in terms of inputs and

Impact of rice imports on rice production in Timor-Leste
Page viii
marketing, rather than the current scattered approach which is based on constructing irrigation systems in most districts.
(iii) Acceptance that the national objective of rice self-sufficiency (as expressed in the Strategic Development Plan) will be very costly to achieve ($2,000/Mt) unless there is major rationalization in terms of how irrigated rice is grown in Timor-Leste. Given the negative outcomes from this study it may be more realistic to plan on some continuation of rice importation and to only invest in incremental rice production where economic rates of return are attractive. This “debate needs to be reopened” in light of the findings from the analyses completed for this study, and should be based on a new National Food Policy and a supporting National Food Strategy.
Page 1
1. Introduction
1.1 Sources of Information and Data
9. The Consultant used information and data from many sources to undertake the various analyses required to complete the studies. These are referenced in the text, and as footnotes and notes to tables. The key sources of data and information which should be referenced at the beginning of this report are:
(i) Published information on the demand for and supply rice in Timor-Leste (in the Strategic Development Plan [SDP] – Table 8, page 120); and revised demand for and supply of rice based on assumptions which are less optimistic than those used in the SDP given the results from the 2010 national census and MAF’s inability to fulfil its SDP mandate, because of, amongst other reasons of severe budget limitations;
(ii) Published statistics on rice imports (from MAF’s FNSTF) - based on data from Customs and line ministries with an involvement in Timor-Leste’s food and nutrition sector); and published data and statistics on rice imports from the National Department of Statistics (NDE) in the Ministry of Finance;
(iii) MAF-SoL’s Annual Research Reports which contain reliable and statistically valid data on staple crop yields, plus other internal MAF-SoL reports on topics such as Annual Seed Production and Distribution;
(iv) MAF-SoL’s Baseline Survey for Phase III;
(v) Information and data collected from interviews with private rice traders – respecting the confidentially of their private business dealings;
(vi) World Bank unpublished reports on Timor-Leste’s stale food situation and various analytical policy papers prepared under the Global Food Response Program (GFRP) Technical Assistance, which ran from October 2011 to June 2012; and
(vii) The unpublished analyses which underpinned the Consultant’s recent work for the Major Projects Secretariat (MPS) within the Ministry of Finance (MoF) on Irrigation Economics7; and
(viii) The Detailed Design Report for IFAD’s TLMSP.
7 See “Final Appraisal Report: Appraisal of Seven Irrigation Schemes”, October 2012.
Impact of rice imports on rice production in Timor-Leste
Page 2
1.2 Terms of Reference
10. The terms of reference for this study are:
(i) An economic comparison of the impact of imported rice on the
(irrigated) rice production sector, and its cost-effectiveness; compared
with investments in crop (production) inputs and distribution - to
inform the food security policy.
(ii) Note that the Terms of Reference refer to an economic comparison, not a
financial comparison. The former relates to the cost to the nation of
importing rice and therefore rice has to be priced at the farm-gate
import parity price to calculate the overall cost to Timor-Leste of
importing rice. Financial analysis relates to the financial impact at the
farm level. This study focuses on economic comparisons.
Page 3
2. Discussion of Issue and Background Information
2.1 Interpretation of Terms of Reference
11. The Terms of Reference imply that public sector rice importation and subsidized distribution (plus private sector rice importation and sale) impact negatively on Timor-Leste’s domestic rice production sector in terms of reducing the incentive for farmers to produce more than their families’ subsistence requirements. The inherent argument is that it should be more cost-effective for Timor-Leste to grow rice rather to import it from Viet Nam and Thailand. In other words: “is it
more cost-effective for Government to provide crop production inputs (seed,
fertilizer, etc.), farmer extension services, and marketing support (purchase of local
rice “surpluses” for distribution into rice deficit areas); rather than the current rice
policy which is based on unlimited imports by the private sector, and Government
imports (and limited local purchases) followed by subsidized, humanitarian and
school meals distribution programs?”
12. In addition it should be recognized that other exogenous factors such as the impact of veteran and aged pensions8, work-for-cash programs; and the failure of the “you grow and we buy” program (designed to stimulate domestic rice [and other food] production)9, also impact on the responsiveness and production efficiency of Timor-Leste’s irrigated rice sector.
13. Multiple analyses were required to estimate the impact of imported rice on domestic rice production including: (i) calculating the domestic demand for and supply of rice; (ii) reconciling rice imports by the private and public sectors; (iii) reconciling rice distribution by the public sector; and (iv) preparing a rice supply and demand “balance sheet”. The latter aimed to “triangulate” rice import data reported by Customs and Statistics (in the Ministry of Finance), the private sector, and the FNSTF which also reports on MAF’s estimated rice production figures. These tasks were completed as part of this study but as reported below proved difficult because of inaccuracies, deficiencies and errors in documents published by these sources of information.
8 Approaching $160 million in 2012. Source: http://budgettransparency.gov.tl/publicTransparency. 9 In all of 2011 and the first six months of 2012, MTCI/MCIE purchased 5,760 Mt of rice equivalent from farmers; and imported 7,780 Mt of rice grain. This includes 6,000 Mt not recorded by Customs but reported by FNSTF (see Table 6).

Impact of rice imports on rice production in Timor-Leste
Page 4
2.2 Demand for Staple Food
14. The demand for staple food10 in Timor-Leste is growing quickly as the population continues to grow11, urban incomes increase, and young people grow into adults and therefore require more energy. In addition there seems to have been a major change in staple food consumption patterns (from a maize-based to a rice-based diet) as rice has become readily available due to private and public sector importation, and the distribution of increasing tonnages of heavily subsidized rice throughout the country.
15. The 2010 census reported a population of 1.066 million. Based on an annual consumption of 100kg/pp/year, this equates to an annual rice demand of about 107,000 Mt (before allowance for storage losses and seed retention). However a more recent analysis of staple food supply and demand in Timor-Leste12 indicates that staple food consumption patterns are changing rapidly and are not only influenced by the current rural-urban population drift but also increased rice consumption by younger people as they mature. Table 2 details these revised staple food demand figures and show a revised estimate of rice demand of 137,000 Mt in 2012, increasing to about 193,500 Mt by 2030.
Table 2: Revised Demand for Staple Food in Timor-Leste (2012 – 2030)
10 With a strong focus on rice as this food item comprised 88% of total food imports (by weight) in 2011
(see TABLE 4). 11 The 2010 National Census reported a population growth rate of 2.41% compound between 2004 and 2010. 12 Source: World Bank, unpublished paper on “Food Demand and Supply in Timor-Leste”, 2012, which is based on a re-working of “Timor-Leste; Raising Agricultural Productivity; Issues and Options, Technical Note no.50276-tp, Note 2: Assessment of Food Self-Sufficiency in Timor-Leste”, World Bank, February 2009.
Year-----> Demand for Staple Foods 2012 2015 2020 2025 20 30(kg/pp/yr) a/ Rural Population 790,818 799,781 847,511 884,541 905,039
Demand: Rice (Mt - grain) 76,868 73,500 73,394 71,913 68,692Demand: Maize (Mt) 59,628 56,944 56,783 55,549 53,216Demand: Roots/Tubers (Mt) 42,546 40,629 40,511 39,627 38,012
(kg/pp/yr) a/ Urban Population 338,922 430,651 565,007 723,716 905,039Demand: Rice (Mt - grain) 60,108 72,113 89,017 106,857 124,815Demand: Maize (Mt) 8,422 10,099 12,458 14,945 17,467Demand: Roots/Tubers (Mt) 7,931 9,517 11,752 14,112 16,472
136,976 145,613 162,411 178,770 193,50768,050 67,043 69,241 70,494 70,683
205,026 212,656 231,652 249,264 264,19050,477 50,146 52,263 53,739 54,484
Total Demand for Staple Food (Mt) 255,503 262,802 283,915 303,003 318,674
Food demand figures extracted from TLSLS 2008, Tables 31 - 36, adjusted for energy intake.Assumes demand for energy from staples declines from 90% to 70% of diet, and demand for energy from other foodsincreases from 10% to 30%.Minor errors due to rounding.
Total Demand: Maize (Mt)Demand: Total Grain (Mt)Demand: Roots/Tubers (Mt)
Source: derived from: Timor-Leste; Raising Agricultural Productivity; Issues and Options, Technical Note no.50276-tp, Note 2: Assessment of Food Self-Sufficiency in Timor-Leste, World Bank, February 2009. Model revised (2012) by World Bank.
Total Demand: Rice (Mt - grain)
Impact of rice imports on rice production in Timor-Leste
Page 5
2.3 Rice Production and Rice Balance
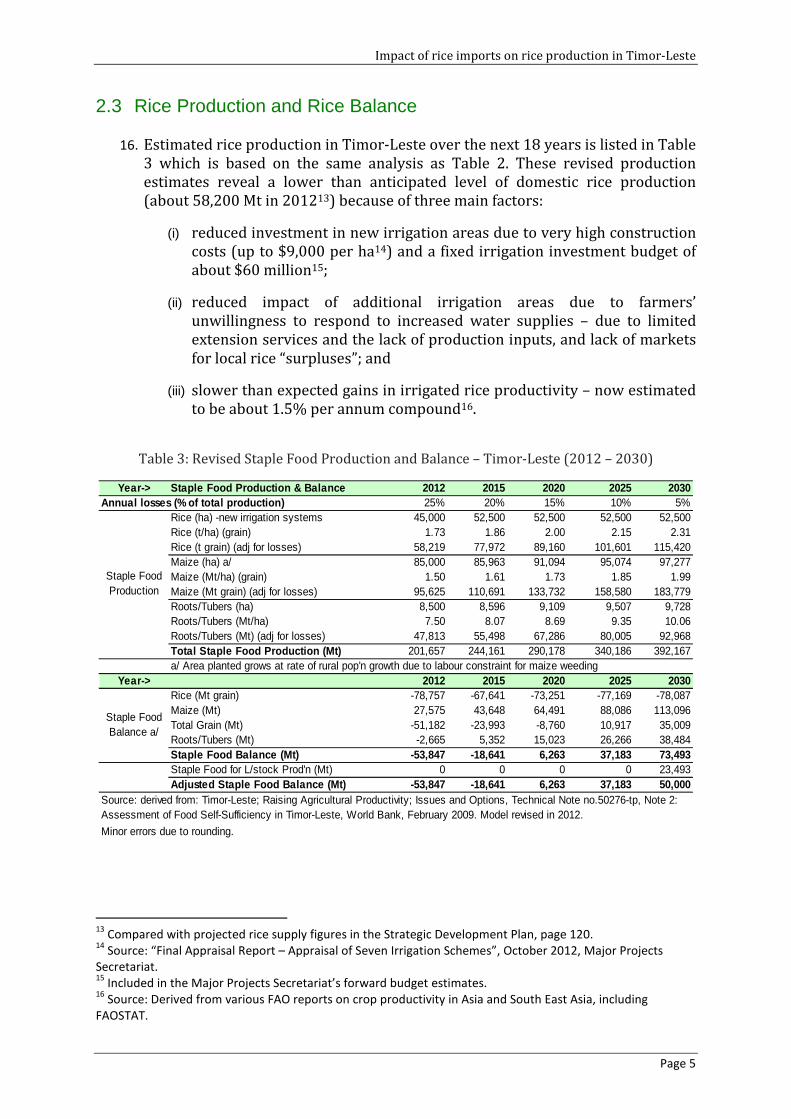
16. Estimated rice production in Timor-Leste over the next 18 years is listed in Table 3 which is based on the same analysis as Table 2. These revised production estimates reveal a lower than anticipated level of domestic rice production (about 58,200 Mt in 201213) because of three main factors:
(i) reduced investment in new irrigation areas due to very high construction costs (up to $9,000 per ha14) and a fixed irrigation investment budget of about $60 million15;
(ii) reduced impact of additional irrigation areas due to farmers’ unwillingness to respond to increased water supplies – due to limited extension services and the lack of production inputs, and lack of markets for local rice “surpluses”; and
(iii) slower than expected gains in irrigated rice productivity – now estimated to be about 1.5% per annum compound16.
Table 3: Revised Staple Food Production and Balance – Timor-Leste (2012 – 2030)
13
Compared with projected rice supply figures in the Strategic Development Plan, page 120. 14
Source: “Final Appraisal Report – Appraisal of Seven Irrigation Schemes”, October 2012, Major Projects
Secretariat. 15
Included in the Major Projects Secretariat’s forward budget estimates. 16
Source: Derived from various FAO reports on crop productivity in Asia and South East Asia, including
FAOSTAT.
Year-> Staple Food Production & Balance 2012 2015 2020 2 025 203025% 20% 15% 10% 5%
Rice (ha) -new irrigation systems 45,000 52,500 52,500 52,500 52,500Rice (t/ha) (grain) 1.73 1.86 2.00 2.15 2.31Rice (t grain) (adj for losses) 58,219 77,972 89,160 101,601 115,420Maize (ha) a/ 85,000 85,963 91,094 95,074 97,277Maize (Mt/ha) (grain) 1.50 1.61 1.73 1.85 1.99Maize (Mt grain) (adj for losses) 95,625 110,691 133,732 158,580 183,779Roots/Tubers (ha) 8,500 8,596 9,109 9,507 9,728Roots/Tubers (Mt/ha) 7.50 8.07 8.69 9.35 10.06Roots/Tubers (Mt) (adj for losses) 47,813 55,498 67,286 80,005 92,968Total Staple Food Production (Mt) 201,657 244,161 290,178 340,186 392,167a/ Area planted grows at rate of rural pop'n growth due to labour constraint for maize weeding
Year-> 2012 2015 2020 2025 2030Rice (Mt grain) -78,757 -67,641 -73,251 -77,169 -78,087Maize (Mt) 27,575 43,648 64,491 88,086 113,096Total Grain (Mt) -51,182 -23,993 -8,760 10,917 35,009Roots/Tubers (Mt) -2,665 5,352 15,023 26,266 38,484Staple Food Balance (Mt) -53,847 -18,641 6,263 37,183 73 ,493Staple Food for L/stock Prod'n (Mt) 0 0 0 0 23,493Adjusted Staple Food Balance (Mt) -53,847 -18,641 6,26 3 37,183 50,000
Minor errors due to rounding.
Annual losses (% of total production)
Staple Food Production
Staple Food Balance a/
Source: derived from: Timor-Leste; Raising Agricultural Productivity; Issues and Options, Technical Note no.50276-tp, Note 2: Assessment of Food Self-Sufficiency in Timor-Leste, World Bank, February 2009. Model revised in 2012.
Impact of rice imports on rice production in Timor-Leste
Page 6
17. Table 3 indicates that Timor-Leste will not be self-sufficient in staple foods
(balance of supplies of rice, maize and roots and tubers) until about 2020 and that
on current projections and levels of support for the sector, will never be self-
sufficient in rice - an estimated deficit of 78,100 Mt in 2030. A discussion on the
reasons for this scenario is beyond the scope of this study but the conclusion
supports the recommendation (which is supported by this study) that Timor-Leste
needs to prepare a National Food Policy which considers all factors which
determine the demand for and supply of staple and nutritious foods.
2.4 Rice Imports
18. Timor-Leste is struggling to grow sufficient staple food for its growing population and therefore continues to rely heavily on the importation of (mainly) rice from Viet Nam and Thailand, plus donations17 and rice which is monetized to pay for project costs18. In 2011 Customs reported the importation of 97,177 Mt of rice by local traders and 520 Mt by MTCI, see Table 4 which details all food imports. Rice imports for the first two quarters of 2012 were reported by Customs to be 9,171 Mt, but this figure seems very low compared with a local trader’s estimate of total rice import requirements in 2012 of about 70,000 Mt19.
19. The accuracy of these rice import figures is further-questioned by statistics from NDE20 which reported the importation of rice valued at only $0.873 million in 2011. This is equivalent to about 1,480 Mt based on $590/Mt (cif). For the same year the Ministry of Finance’s eProcurement Portal records the award of four MTCI contracts for 13,593 Mt of rice valued at $8.02 million. Further evidence that Timor-Leste does not have accurate records on rice importation by either the private or public sectors comes from the following inconsistencies which were identified in reports prepared by Customs, NDE and the FNSTF:
(i) Customs reported the importation of 4,332 Mt of rice in Quarter 2, 2012 but this figure was not included in FNSTF’s reports (Table 4 and Table 5);
(ii) Customs did not report the importation of 1,260 Mt of rice by MTCI in Quarter 3 in 2011 but this figure was included in FNSTF’s reports (Table 4 and Table 5);
(iii) The importation of 6,000 Mt of rice in Quarter 2, 2012 was not reported by Customs but was reported by FNSTF (Table 4 and Table 6); and
17 Japan donated 10,000 Mt in Quarter 3, 2011, which was not reported in FNSTF Quarterly Reports, see Table 5 and Table 6. 18 America donated 10,400 Mt in 2012 which was sold to local traders for $420/Mt (pers. com.). Note: FNSTF reported a donation from America of 7,000 Mt (Quarter 4, 2011 report) a difference of 3,400 Mt – a large discrepancy when this figure should have been recorded and reported accurately. 19 Personal communication, November 2012. 20 National Directorate of Statistics within the Ministry of Finance.

Impact of rice imports on rice production in Timor-Leste
Page 7
(iv) Customs reported rice imports of 97,177 Mt in 2011 (Table 4) and FNSTF reported imports of 105,955 Mt (Table 5) – a difference of 8,778 Mt which should have been reported more accurately21.
Table 4: Food Imports Recorded and Reported by Customs (Mt)
21 All of FNSTF’s reported figures are compiled from official Government sources such as Customs and NDE.
Item Qtr 1 & 2 Qtr 3 Qtr 4 Total Qtr 1 Qtr 2 f/Rice - private sector 25,892 19,353 51,932 97,177 4,839 4,332Rice - MTCI 520 520Maize a/ 240 1,269 317 1,826 120Peanuts b/ 122 122 64Soya bean 722 195 210 1,127 42 235Mixed vegetables c/ 299 148 154 601 89 164Uncooked noodles 2,494 48 26 2,568 2 11Rice flour 28 35 63 115 49Maize flour 174 1 175 30 1,127Fresh fruit 420 72 92 584 51 42Chicken d/ 1,825 1,000 112 2,937 6,295 9,296Beef e/ 2,667 95 2 2,764 50Beans 2 2 40Fish/seafood 4 4 4Eggs 30 30 106 2,939Milk 138 138 82 232
Total 35,403 22,389 52,846 110,638 11,875 18,481Rice: % total imports 75% 86% 98% 88% 41% 23%
Source: Extracted exactly from Table 2 in five sequential FNSTF Quarterly Reports.Note: Blue figures are suspect; e.g. 15,591 Mt chicken is 14 kg/pp/6 months - very high.a/ Excluding seed. b/ Shelled and or ground. c/ Fresh and or chilled.d/ Frozen whole. e/ Fresh and or chilled.f/ Includes 4,322 Mt reported by Customs but not recorded by FNSTF.f/ Excludes 6,000 Mt imported Qtr 2, 2012 - not reported by Customs; reported by FNSTF.See Table 7.
Food Imports Recorded and Reported by Customs (Mt)2011 2012

Impact of rice imports on rice production in Timor-Leste
Page 8
Table 5: Reported National Rice and Maize Balances (Mt)
Reported National Rice and Maize Balance a/ b/
Rice Maize Rice Maize Rice Maize Rice Maize Rice g/ h/ MaizeGovt. stocks - all Ministries. 19,960 769 15,468 n.r. n.r. n.r. 14,301 42 17,222 n.r.Entered market - Private Sector e/ 25,892 174 45,764 174 105,955 174 4,839 120 n.r. n.r.Entered market - Govt. (MTCI) 520 n.r. 1,260 n.r. n.r. n.r. n.r. n.r. n.r. n.r.Contracted for arrival 17,000 n.r. n.r. n.r. n.r. n.r. n.r. n.r. n.r. n.r.Forecast production (grain) f/ 67,000 37,138 58,978 30,666 58,978 30,666 30,659 48,886 92,161 156,099Total annual supplies 130,372 38,081 121,470 30,840 164, 933 30,840 49,799 49,048 109,383 156,099Demand for food g/ 95,940 111,911 95,940 111,912 113,817 72,157 28,265 17,865 113,039 71,449Post harvest losses n.r. n.r. n.r. n.r. n.r. n.r. n.r. n.r. 21,877 31,220Livestock feed n.r. n.r. n.r. n.r. n.r. n.r. n.r. n.r. n.r. 16,000Retained seed n.r. n.r. n.r. n.r. n.r. n.r. n.r. n.r. 808 3,821Balance 34,432 -73,830 25,530 -81,072 51,116 -41,317 21,534 31,183 -26,341 33,609Reported stocks - end Qtr i/ 33,290 24,243 15,071 17,222 13,023Difference (Blce - Stock) 1,142 1,287 36,045 4,312 -39,364a/ Source: Extracted exactly from reports published by FNSTF - see Table 1 in Quarterly Reports.b/ Measure is metric tonne (Mt) = 1,000 kg. Excludes donations (total 24,000 Mt) and 6,000 and 4,332 Mt errors in reporting (see text).c/ Based on annual consumption estimates. d/ Demand figures reported for end Quarter 1, 2012 are quarterly, not annual.e/ Cumulative figures for 2011, quarterly figures for 2012.f/ Figures from Ministry of Agriculture and Fisheries - 67,000 Mt for first crop and 59,000 for second crop (2011), and 92,200 for first crop 2012.g/ 90 kg rice /pp/yr and 105 maize kg/pp/yr (Q1, Q2 & Q3, 2011); and 106 kg rice/pp/yr and 67 kg maize/pp/yr for maize (Q4, 2011 and Q1, Q2, 2012).g/ No allowance for 2.41% compound increase in population from 2010 to 2012, or for effect of aging population.h/ Error in FNSTF's calculations: forecast was paddy production of 92,161 Mt but figure reported was 92,161 Mt rice (grain).i/ See Table 3 in FNSTF's Quarterly Reports.n.r. Not reported by FNSTF.
Quarters 1 & 2 c/ Quarter 3 c/ Quarter 4 c/ Quarter 1 d/ Quarter 2 c/2011 2012

Impact of rice imports on rice production in Timor-Leste
Page 9
Table 6: Reported MTCI and MCIE Rice Stocks (Mt)
2.5 Food and Nutrition Security Task Force Reports
20. FNSTF is responsible for reporting quarterly on the availability of rice and maize. Table 5 is a summary of these reports and reveals a considerable difference between the reported stocks of rice available and the estimated quarterly balance between the demand for and supply of rice. For example at the end of 2011 the calculated balance was 51,116 Mt compared with reported rice stock of 15,071 Mt, a difference of 36,045 Mt. Mid-way through 2012 the reported stocks were 13,023 Mt compared with a calculated balance of -26,341 Mt, a difference of 39,364 Mt. Such large discrepancies need to be explained by FNSTF.
21. FNSTF also prepares quarterly reports on the estimated level of rice stocks. Table 6 is a reconciliation of these figures and shows that at the end of 2011 rice stocks were only 15,100 Mt. By the end of Quarter 2, 2012 this situation had declined and rice stocks had fallen to 13,000 Mt, a figure (which if correct) is very low in terms of maintaining a buffer against a poor national rice crop and the prevention of civil disturbances. Note however that calculated rice stocks at the end of Quarter 2 in 2012 were about 191,500 Mt (Table 8). FNSTF does not report on the reasons for such a large discrepancy (about 178,500 Mt).
Item Qtr 1 & 2 Qtr 3 a/ Qtr 4 Qtr 1 b/MTCI rice stock d/ 19,960 18,668 15,071 17,222 Opening stock 17,222MSS rice stock d/ 9,000 5,500 Govt. MTCI Import 6,000MoE rice stock d/ 4,330 75 Pvt Sector Import (4,332)
Closing Stock d/ 33,290 24,243 15,071 17,222 23,222Expected rice shipments Sold - subsidized 7,168
MTCI 17,000 17,000 10,200 6,000 Support programs 9Donation (Japan) f/ 10,000 Transfer to MoE 2,843
Losses 179Sub-Total pending 17,000 27,000 10,200 6,000 Closing stock d/ 13,023
Source: Extracted exactly from Table 3 in five sequential FNSTF Quarterly Reports.a/ Error: in sub-total pending - should be 27,000 Mt and not 17,000 Mt.b/ Error: opening stock in Qtr 1, 2012 unlikley to be the same as opening stock in Qtr 2, 2012.c/ Reporting format changed in Quarter 2 2012.d/ Stock at end of quarter.e/ See Table 3, FNSTF Q2 Report, 2012, reports 6,000 Mt of Government rice imported.f/ Donation by USAid of 10,400 Mt not recorded.
Qtr 2 b/ c/ e/2011 2012
Reported MTCI and MCIE Rice Stocks (Mt)
Impact of rice imports on rice production in Timor-Leste
Page 10
2.6 Imports of Other Food
22. Table 4 also lists the non-rice food imports into Timor-Leste during the past six quarters (to end Quarter 2, 2012) and shows that apart from rice (88% of total imports in 2011; and an average of about 40% year-to-date for 2012, if the 6,000 Mt unrecorded by Customs is included), uncooked noodles, chicken22, and eggs are major food imports. The reported figures on beef imports are very skewed with 2,667 Mt imported in Quarters 1 and 2 in 2011, and then only 147 Mt imported in the other four quarters covered in Table 4. These inconsistencies also add to the argument in Section 2.4 that Timor-Leste’s statistics on food importation are questionable and could lead to incorrect or inappropriate policy decisions related to national food supplies.
2.7 Rice Distribution
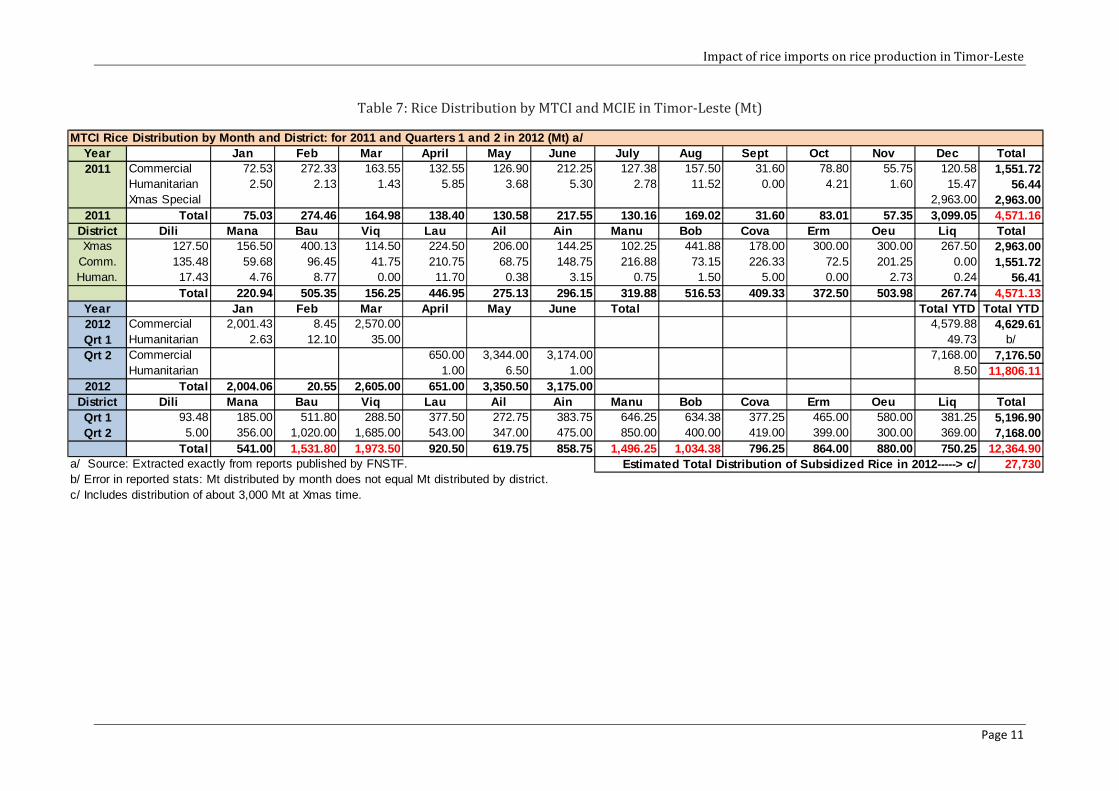
23. Table 7 lists the distribution of subsidized and free rice by MTCI/ MCIE on a monthly basis and by target district. In 2011 4,570 Mt of rice were distributed under: (i) commercial arrangements (sold to traders for $8-$9/35 kg bag, who in turn sold the rice in local markets for $12/35 kg bag23); (ii) humanitarian programs24; and (iii) a special Xmas program. It is estimated that similar programs in 2012 (see Table 7) will result in the distribution of about 27,730 Mt of subsidized rice if the distribution patterns in the first two quarters continued in Quarters 3 and 425.
24. Distribution of subsidized rice on this level and scale (equivalent to about 22% of total demand [30,000 Mt/137,000 Mt]) must be impacting on the incentive for Timor-Leste’s rice farmers to fill the import gap. In addition 40% of all rice distributed was allocated to three of the main rice-producing districts: Baucau, Viqueque and Manatuto. This distribution policy seems illogical.
22 There seems to be an error in Table 4: it records the importation of 15,591 Mt of chicken in the first two quarters of 2012 – or 14kg/pp in a six month period. It is very doubtful if all Timorese are consuming chicken at this rate when about 70% of the population in rural areas do not have access to this product. 23 This is equivalent to a Government subsidy of about $250/Mt of rice 24 This rice does not include rice allocated to school feeding programs. 25 Rice distribution figures for Quarters 3 and 4 in 2012 were not available when this study was written in December 2012. This is another example of inadequate reporting by FNSTF – figures for Quarter 2 should have been published no later than the end of October, 2012.
Impact of rice imports on rice production in Timor-Leste
Page 11
Table 7: Rice Distribution by MTCI and MCIE in Timor-Leste (Mt)
Year Jan Feb Mar April May June July Aug Sept Oct Nov Dec Total2011 Commercial 72.53 272.33 163.55 132.55 126.90 212.25 127.38 157.50 31.60 78.80 55.75 120.58 1,551.72
Humanitarian 2.50 2.13 1.43 5.85 3.68 5.30 2.78 11.52 0.00 4.21 1.60 15.47 56.44Xmas Special 2,963.00 2,963.00
2011 Total 75.03 274.46 164.98 138.40 130.58 217.55 130.16 1 69.02 31.60 83.01 57.35 3,099.05 4,571.16District Dili Mana Bau Viq Lau Ail Ain Manu Bob Cova Erm Oeu Liq TotalXmas 127.50 156.50 400.13 114.50 224.50 206.00 144.25 102.25 441.88 178.00 300.00 300.00 267.50 2,963.00
Comm. 135.48 59.68 96.45 41.75 210.75 68.75 148.75 216.88 73.15 226.33 72.5 201.25 0.00 1,551.72Human. 17.43 4.76 8.77 0.00 11.70 0.38 3.15 0.75 1.50 5.00 0.00 2.73 0.24 56.41
Total 220.94 505.35 156.25 446.95 275.13 296.15 319.88 516. 53 409.33 372.50 503.98 267.74 4,571.13Year Jan Feb Mar April May June Total Total YTD Total YTD2012 Commercial 2,001.43 8.45 2,570.00 4,579.88 4,629.61Qrt 1 Humanitarian 2.63 12.10 35.00 49.73 b/Qrt 2 Commercial 650.00 3,344.00 3,174.00 7,168.00 7,176.50
Humanitarian 1.00 6.50 1.00 8.50 11,806.112012 Total 2,004.06 20.55 2,605.00 651.00 3,350.50 3,175.0 0
District Dili Mana Bau Viq Lau Ail Ain Manu Bob Cova Erm Oeu Liq TotalQrt 1 93.48 185.00 511.80 288.50 377.50 272.75 383.75 646.25 634.38 377.25 465.00 580.00 381.25 5,196.90Qrt 2 5.00 356.00 1,020.00 1,685.00 543.00 347.00 475.00 850.00 400.00 419.00 399.00 300.00 369.00 7,168.00
Total 541.00 1,531.80 1,973.50 920.50 619.75 858.75 1,496.25 1,034.38 796.25 864.00 880.00 750.25 12,364.90a/ Source: Extracted exactly from reports published by FNSTF. 27,730b/ Error in reported stats: Mt distributed by month does not equal Mt distributed by district.c/ Includes distribution of about 3,000 Mt at Xmas time.
MTCI Rice Distribution by Month and District: for 2 011 and Quarters 1 and 2 in 2012 (Mt) a/
Estimated Total Distribution of Subsidized Rice in 2012-----> c/
Impact of rice imports on rice production in Timor-Leste
Page 12
2.8 Attempted Reconciliation – A “National Rice Balance Sheet”
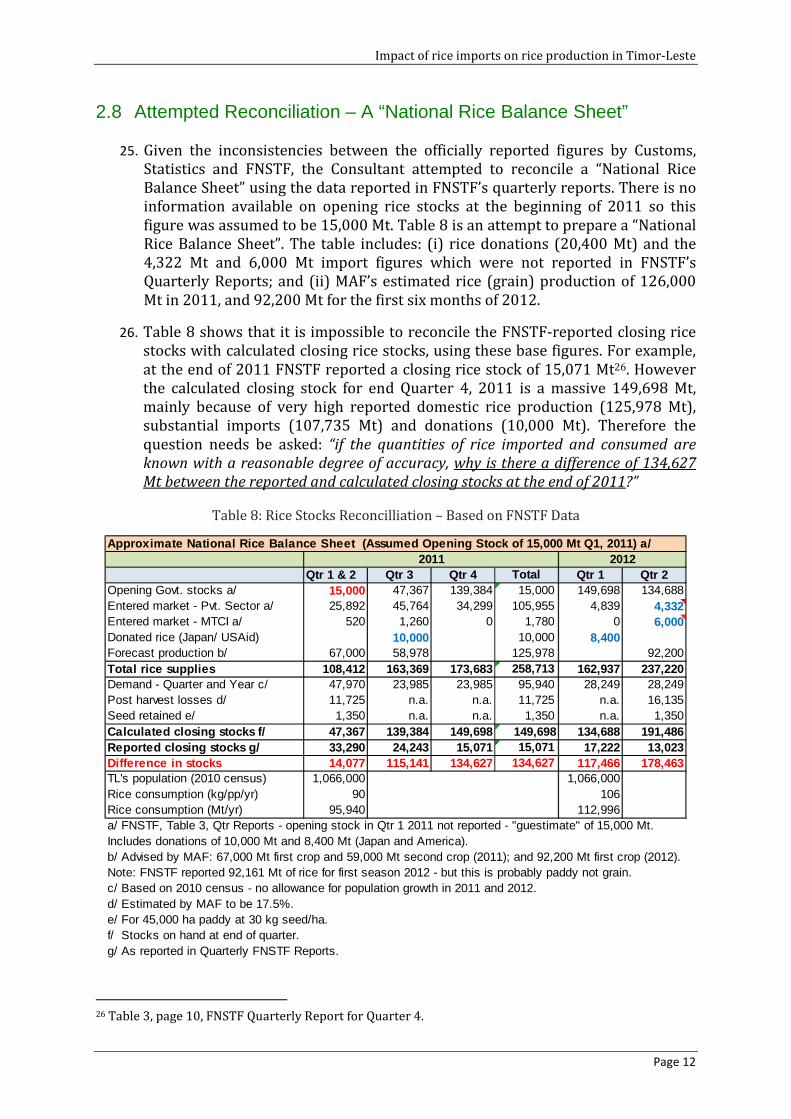
25. Given the inconsistencies between the officially reported figures by Customs, Statistics and FNSTF, the Consultant attempted to reconcile a “National Rice Balance Sheet” using the data reported in FNSTF’s quarterly reports. There is no information available on opening rice stocks at the beginning of 2011 so this figure was assumed to be 15,000 Mt. Table 8 is an attempt to prepare a “National Rice Balance Sheet”. The table includes: (i) rice donations (20,400 Mt) and the 4,322 Mt and 6,000 Mt import figures which were not reported in FNSTF’s Quarterly Reports; and (ii) MAF’s estimated rice (grain) production of 126,000 Mt in 2011, and 92,200 Mt for the first six months of 2012.
26. Table 8 shows that it is impossible to reconcile the FNSTF-reported closing rice stocks with calculated closing rice stocks, using these base figures. For example, at the end of 2011 FNSTF reported a closing rice stock of 15,071 Mt26. However the calculated closing stock for end Quarter 4, 2011 is a massive 149,698 Mt, mainly because of very high reported domestic rice production (125,978 Mt), substantial imports (107,735 Mt) and donations (10,000 Mt). Therefore the question needs be asked: “if the quantities of rice imported and consumed are
known with a reasonable degree of accuracy, why is there a difference of 134,627
Mt between the reported and calculated closing stocks at the end of 2011?”
Table 8: Rice Stocks Reconcilliation – Based on FNSTF Data
26 Table 3, page 10, FNSTF Quarterly Report for Quarter 4.
Qtr 1 & 2 Qtr 3 Qtr 4 Total Qtr 1 Qtr 2Opening Govt. stocks a/ 15,000 47,367 139,384 15,000 149,698 134,688Entered market - Pvt. Sector a/ 25,892 45,764 34,299 105,955 4,839 4,332Entered market - MTCI a/ 520 1,260 0 1,780 0 6,000Donated rice (Japan/ USAid) 10,000 10,000 8,400Forecast production b/ 67,000 58,978 125,978 92,200Total rice supplies 108,412 163,369 173,683 258,713 162,937 237,220Demand - Quarter and Year c/ 47,970 23,985 23,985 95,940 28,249 28,249Post harvest losses d/ 11,725 n.a. n.a. 11,725 n.a. 16,135Seed retained e/ 1,350 n.a. n.a. 1,350 n.a. 1,350Calculated closing stocks f/ 47,367 139,384 149,698 149 ,698 134,688 191,486Reported closing stocks g/ 33,290 24,243 15,071 15,071 17,222 13,023Difference in stocks 14,077 115,141 134,627 134,627 117,466 178,463TL's population (2010 census) 1,066,000 1,066,000Rice consumption (kg/pp/yr) 90 106Rice consumption (Mt/yr) 95,940 112,996a/ FNSTF, Table 3, Qtr Reports - opening stock in Qtr 1 2011 not reported - "guestimate" of 15,000 Mt.Includes donations of 10,000 Mt and 8,400 Mt (Japan and America).b/ Advised by MAF: 67,000 Mt first crop and 59,000 Mt second crop (2011); and 92,200 Mt first crop (2012).Note: FNSTF reported 92,161 Mt of rice for first season 2012 - but this is probably paddy not grain.c/ Based on 2010 census - no allowance for population growth in 2011 and 2012.d/ Estimated by MAF to be 17.5%.e/ For 45,000 ha paddy at 30 kg seed/ha.f/ Stocks on hand at end of quarter.g/ As reported in Quarterly FNSTF Reports.
Approximate National Rice Balance Sheet (Assumed O pening Stock of 15,000 Mt Q1, 2011) a/2011 2012

Impact of rice imports on rice production in Timor-Leste
Page 13
27. One obvious answer to this question is: “domestic rice production is not as high as officially reported, and Timorese are consuming much more than 90kg rice/pp/year”. Table 9 summarizes a sensitivity analysis which attempts to reconcile reported and calculated quarter- and year-end rice stocks. The conclusion is that the only way to “balance” reported and calculated rice stocks is to assume that: (i) rice consumption per person is about 115 kg/year; and (ii) domestic rice (grain) production is only about 30,000 Mt/year.
Table 9: Rice Stocks Reconcilliation – Adjusted Domestic Production and Consumption Figures
28. The increased rice consumption figure is reasonable when considered against consumption levels in similar countries (Indonesians consume about 130 kg/pp/year27) but it is impossible to reconcile calculated rice production of only 30,000 Mt/year, compared with reported (MAF) production of 126,000 Mt in 2011 and 55,300 Mt for the first season in 2012, assuming that NFSTF’s figure for Quarter 2, 2012 of 92,161 Mt is actually paddy and not grain. This inability to reconcile the differences brings into question Timor-Leste’s records and statistics on rice supplies and distribution. Therefore the Consultant attempted to reconcile rice demand figures by using rural rice purchasing information collected by MAF-SoL, see Section 2.9.
27 Rice consumption (kg/pp/yr) in Viet Nam, Cambodia and the Philippines is about 170, 150 and 130, respectively. Source: Various IRRI publications.
Qtr 1 & 2 Qtr 3 Qtr 4 Total Qtr 1 Qtr 2Opening Govt. stocks a/ 15,000 2,040 27,678 15,000 30,591 11,122Entered market - Pvt. Sector a/ 25,892 45,764 34,299 105,955 4,839 4,332Entered market - MTCI a/ 520 1,260 1,780 6,000Donated rice (Japan/ USAid) 10,000 10,000 8,400Rice prod'n (to balance stocks) b/ 30,000 30,000 30,000Total rice supplies 71,412 59,064 61,977 162,735 43,830 51,454Demand - Quarter and Year c/ 62,772 31,386 31,386 125,544 32,707 32,707Post harvest losses d/ 5,250 n.a. n.a. 5,250 n.a. 5,250Seed retained e/ 1,350 n.a. n.a. 1,350 n.a. 1,350Calculated closing stocks f/ 2,040 27,678 30,591 30,591 11,122 12,147Reported closing stocks g/ 33,290 24,243 15,071 15,071 17,222 13,023Difference in stocks -31,250 3,435 15,520 15,520 -6,100 -876TL's population (2010 census) 1,091,691 1,137,651Rice consumption (kg/pp/yr) h/ 115 115Rice consumption (Mt/yr) 125,544 130,830a/ FNSTF, Table 3, Qtr Reports - opening stock in Qtr 1 2011 not reported - "guestimate" of 15,000 Mt.Includes donations of 10,000 Mt and 8,400 Mt (Japan and America).b/ Production considerably less than advised by MAF; adjusted to reconcile stocks.c/ Based on 2010 census - with allowance for population growth in 2011 and 2012.d/ Estimated by MAF to be 17.5%.e/ For 45,000 ha paddy at 30 kg seed/haf/ Stocks on hand at end of quarter.g/ As reported in Quarterly FNSTF Reports (see Table 6).h/ Increased rice consumption per person.
Sensitivity Analysis: Balancing Calculated and Repo rted Quarterly Rice Stocks2011 2012

Impact of rice imports on rice production in Timor-Leste
Page 14
2.9 MAF-SoL Rice Purchase Survey
29. As part of the Baseline Survey for SoL Phase III, 1,799 rural households across all 13 districts were questioned about their rice purchasing practices and patterns. The results are summarized in Table 10 and Table 11. Statistics of interest include:
(i) Sixty two percent of surveyed households purchased about 40 kg of rice every month of the year;
(ii) Almost 100% (99.6%) of households purchased some rice during the year;
(iii) More than 80% of rural households in six districts (Baucau, Dili, Liquica, Lautem, Manatuto and Manufahi) purchased rice every month; and
(iv) These figures equate to total annual rural rice purchases of 64,400 Mt or about 70% of total rural rice requirements, and lead to the question: “why
are rural households buying so much rice when they can grow it for
virtually zero cash inputs?”
30. Table 11 is a calculation of the annual demand for rice in Timor-Leste and concludes that the figure is about 130,900 Mt. which compares favourably with the demand figures in Table 2 (137,000 Mt) and Table 9 (132,100 Mt). This finding adds weight to the argument presented in Section 2.8 that domestic rice production is not as high as officially reported, or there are “leaks in the system” with rice being re-exported into higher-priced markets in West Timor. This is because: (i) demand (consumption, seed and losses) has been cross-checked and appears to be about right; and (ii) import supply is recorded with a reasonable degree of accuracy. Therefore the only element in the demand/ supply equation which remains questionable is, logically, the level of domestic production.
31. It is beyond the scope of this study to attempt to reconcile these rice import, production and demand figures, but it appears that at least some of the data on which Government is basing critical rice importation and distribution decisions are suspect and possibly inaccurate.

Impact of rice imports on rice production in Timor-Leste
Page 15
Table 10: Number of Months in which Rural Households Purchase Rice
District 1 2 3 4 5 6 7 8 9 10 11 12Ainaro 4 11 9 3 4 76 107 71.0%Aileu 1 6 5 13 7 58 90 64.4%Baucau 1 5 6 8 14 4 7 3 185 233 79.4%Bobonaro 1 5 10 21 29 18 18 22 14 18 5 18 179 10.1%Covalima 4 4 6 3 4 10 1 94 126 74.6%Dili 1 1 4 5 1 2 3 72 89 80.9%Ermera 2 16 1 41 3 1 2 2 166 234 70.9%Liquica 1 1 3 3 4 1 1 1 111 126 88.1%Lautem 2 2 1 4 1 1 114 125 91.2%Manufahi b/ 90 90 100.0%Manatuto b/ 72 72 100.0%Oecussi 1 1 6 5 15 21 35 21 8 1 47 161 29.2%Viqueque 1 13 41 29 26 19 14 1 1 1 14 160 8.8%Total 2 21 59 93 84 142 95 73 56 42 8 1,117 1,792 62.3%% of HHs 0.1% 1.2% 3.3% 5.2% 4.7% 7.9% 5.3% 4.1% 3.1% 2.3% 0.4 % 62.3% 1,799 99.6%Source: Derived from Tables 63 and 64, page 68, SoL 3 Baseline Survey, Main Report. Note: only rural households included in the survey.b/ Incomplete survey.c/ Total survey size of 1,799 HHs.
Total HHs Buying Rice c/
No. of Months in which Households Bought Rice % HHs Buying Rice Every Month

Impact of rice imports on rice production in Timor-Leste
Page 16
Table 11: Months in which Rice is Purchased, Amounts Purchased and
Calculation of Annual Demand for Rice
Oct '10 Nov '10 Dec '10 Jan '12 Feb '12 Mar '12 Apr '12 Ma y '12 Jun '12 Jul '12 Aug '12 Sep '1291% 75% 84% 82% 86% 77% 83% 75% 81% 77% 78% 89%
1,637 1,346 1,506 1,471 1,535 1,384 1,482 1,344 1,443 1,387 1,401 1,594
66,562 52,642 58,319 57,512 60,160 53,132 57,416 52,187 55,828 53,577 52,915 64,065Kg Rice/ HH 40.7 39.1 38.7 39.1 39.2 38.4 38.7 38.8 38.7 38.6 37.8 40.2
1,46139
468137,37864,35391,63155,168
341,482115
39,270130,901
Source: Derived from Table 62, page 67, SoL 3 Baseline Survey, Main Report. Note: only rural households surveyed.b/ From 2010 Census; inflated at 2.41% compound to 2012.c/ Based on 115 kg rice/pp/year.d/ Losses of 17.5% and 1,350 Mt for seed.
Months in which Households Bought Rice a/
% & No. of HHs Buying RiceTotal Rice Purchased (kg)
Average No. rural HHs buying rice per monthAverage Kg rice purchased per rural HH/monthAverage Kg rice purchased per rural HH/year
Total annual demand for rice (Mt)
Total annual rural rice consumption (Mt) c/
Rural HHs in Timor-Leste b/Total annual rural rice purchases (Mt)
Urban HHs in Timor-Leste b/Urban population in Timor-Leste b/Rice consumption: Kg per person per year (urban) c/Total annual urban rice consumption (Mt)

Page 17
3. Analyses
3.1 Introduction
32. The foregoing attempts to set the scene for a confusing and difficult-to-reconcile rice demand, supply and distribution scenario. It concludes that it is impossible to reconcile reported rice import and consumption figures. However what is immediately apparent is that considerable tonnages of rice are imported by the private sector on an annual basis (105,955 Mt in 2011, Table 5) and that Government is also importing and distributing large tonnages of subsidized rice (about 30,000 Mt in 2012, Table 7).
33. Therefore the questions are: (i) “What is the impact of this level of rice importation
on Timor-Leste’s domestic rice production industry; and (ii) would it be more
efficient (and cheaper) to produce the estimated annual rice deficit of 78,800 Mt
(Table 3) in country?” These questions cannot be answered without a comparison between the cost of importing rice compared with the cost of growing more irrigated rice.
34. The following analyses, which were completed to answer these questions, are based on two rice irrigation models: (i) weir-based river diversion schemes, the traditional irrigation strategy in Timor-Leste; and (ii) optional tube-well and small pump schemes28. The outcomes from these analyses (calculation of the economic cost per incremental Mt of rice for both production systems) were then compared with the economic cost of importing rice29.
35. This section (3) also includes the following topics which are relevant to the general argument that rice production in Timor-Leste is more costly than importing rice: (i) calculation of the economic value of rice; (ii) the impact of consumer rice subsidies on domestic rice production; (iii) an explanation of apparent perverse behaviour by rural communities in terms of their failure to grow more rice when more, free, irrigation water is available; and (iv) factors other than price which influence rice production.
3.2 Cost of Growing Rice: River Diversion Schemes Proposed by MAF
36. In 2012 the Consultant completed the pre-construction appraisal of seven irrigation schemes proposed for rehabilitation by MAF with funding through the Infrastructure Fund (IF). In addition the Consultant reviewed the impact of investment in the rehabilitation of four irrigation schemes during the past four years30. These schemes are weir-based river diversion schemes which divert peak river flows into canals which deliver water to down-stream flood irrigation areas. On average the seven proposed schemes will cost about $9,000 per ha to
28 See Section 0 and footnote 35 for more information on this type of irrigation scheme. 29 Note: the comparison was based on economic costs (costs to the nation) and not financial costs (farm-level costs). 30 Source: “Final Appraisal Report – Appraisal of Seven Irrigation Schemes”, October 2012: prepared for the Major Projects Secretariat.

Impact of rice imports on rice production in Timor-Leste
Page 18
rehabilitate, and MAF’s incremental annual operating and maintenance costs would be about $860 per ha if funds are available.
37. Four rice production/ marketing models, which reflect various assumptions related to the current and possibly future operating budget scenarios for MAF and MCIE, were considered for the two types of irrigation scheme31. These were:
1. Model 1: MAF and MCIE have sufficient funds to fulfil their mandates: (i) MAF in terms of farmer extension and training services, and the provision of rice production inputs (seed, fertilizer, etc.) (MAF’s basic responsibilities); and (ii) MCIE in terms of being able to purchase, store and redistribute “surplus” rice into staple food deficit areas (MCIE’s domestic food marketing responsibilities).
2. Model 2: MAF does not have the operational budget it requires, but MCIE does. Therefore rice production does not increase but MCIE is able to partly fulfil its rice marketing roles.
3. Model 3: MAF has the operational budget it requires, but MCIE does not. Therefore rice production increases but MCIE is unable to fulfil its rice marketing roles.
4. Model 4: Neither MAF nor MCIE have the operational budgets they require to fulfil their rice production and marketing roles. This is the current
situation in Timor-Leste.
38. The main conclusions from this appraisal exercise are included in a stand-alone report for MPS, and are:
(i) The seven proposed irrigation schemes would cost about $86.36 million to build, based on 2009 prices inflated to 2013 prices and with cost adjustments to allow for higher unit costs associated with more isolated construction sites. The seven schemes would cost about $9,000 per ha over 9,920 ha to rehabilitate, and about $860 per ha per year to operate and support32. These figures are very high by international standards.
(ii) The construction cost per incremental Mt of staple food would range from $1,975 to $15,545, depending on the combination of crop yields, crop prices and cropping intensity assumptions. These cost are exceptionally high when considered against the “rule of thumb” that irrigation construction costs per ha should not exceed five times the economic cost of rice ($/Mt).
(iii) Investment in the rehabilitation of damaged irrigation schemes in Timor-Leste will not generate acceptable Economic Internal Rates of Return (EIRRs). This is because “software” support packages (farmer services, the provision of production inputs, and markets for “surplus” staple foods) are not available to complement the proposed “hardware” construction (irrigation repairs) and
31 Note: the modelling completed for this appraisal exercise was based on predominantly irrigated rice production with some areas of supplementary-irrigated maize and legumes, hence the use of the term “incremental Mt of staple food”. 32 Including the cost of MAF’s extension and farmer training services, and the provision of crop production inputs.
Impact of rice imports on rice production in Timor-Leste
Page 19
are not likely to be available in the foreseeable future. The EIRRs under this scenario for the seven proposed irrigation schemes appraised for MPS vary from very low (2% to 5%) to negative, depending on assumptions related to crop yields and cropping intensity.
(iv) In contrast, farmers’ financial returns from investing in irrigated crop production could be very attractive as all inputs other than labour are subsidised. For example increased returns per ha from improved rice and maize production systems could be as high as $930 and $380, respectively.
3.3 Cost of Growing Rice: River Diversion Scheme, a Generic Model
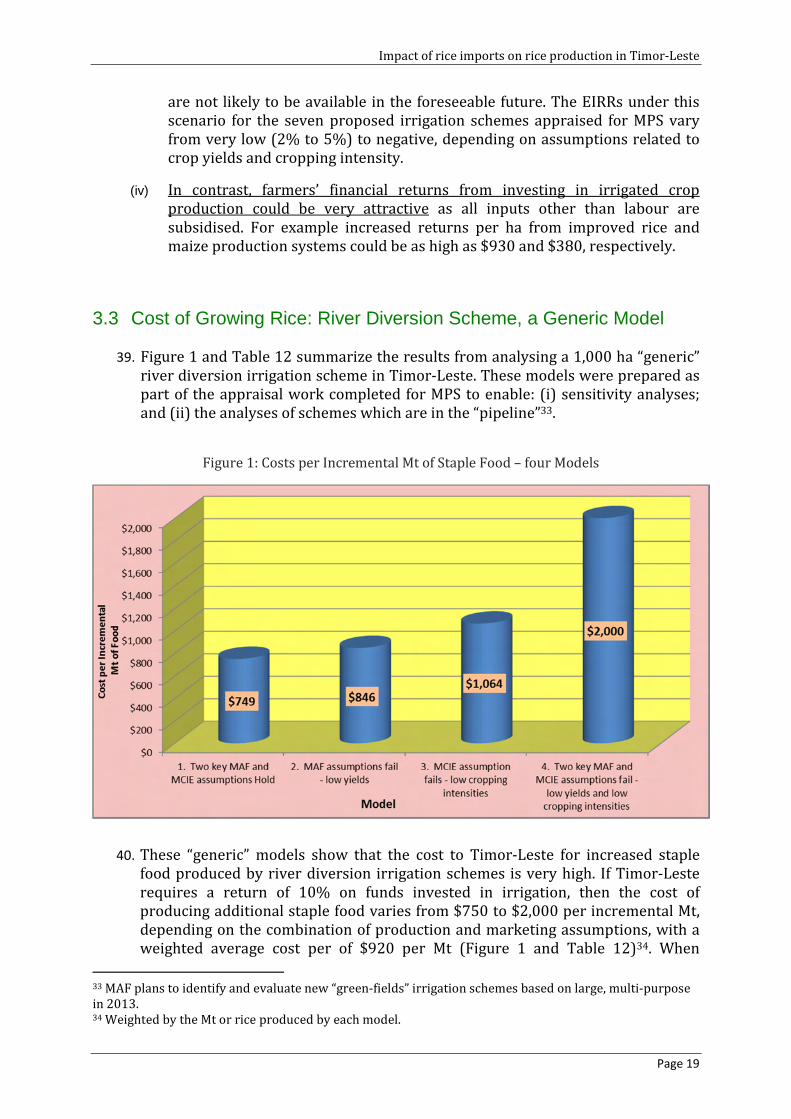
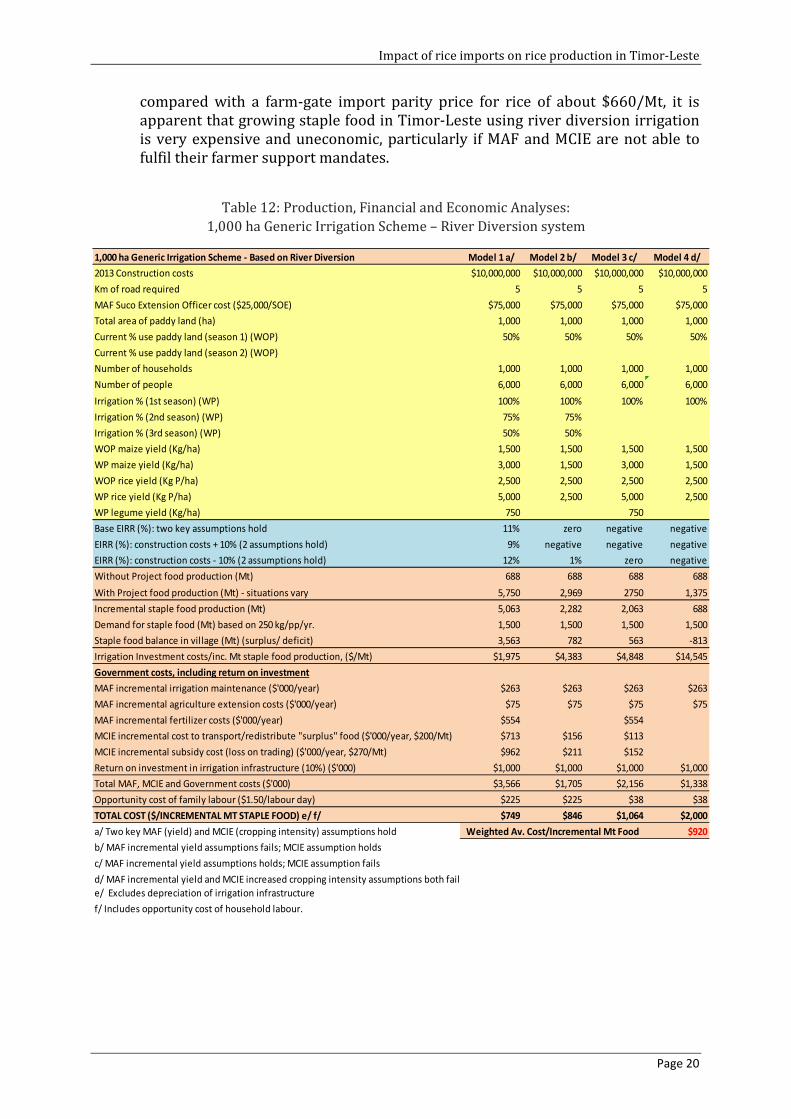
39. Figure 1 and Table 12 summarize the results from analysing a 1,000 ha “generic” river diversion irrigation scheme in Timor-Leste. These models were prepared as part of the appraisal work completed for MPS to enable: (i) sensitivity analyses; and (ii) the analyses of schemes which are in the “pipeline”33.
Figure 1: Costs per Incremental Mt of Staple Food – four Models
40. These “generic” models show that the cost to Timor-Leste for increased staple food produced by river diversion irrigation schemes is very high. If Timor-Leste requires a return of 10% on funds invested in irrigation, then the cost of producing additional staple food varies from $750 to $2,000 per incremental Mt, depending on the combination of production and marketing assumptions, with a weighted average cost per of $920 per Mt (Figure 1 and Table 12)34. When
33 MAF plans to identify and evaluate new “green-fields” irrigation schemes based on large, multi-purpose in 2013. 34 Weighted by the Mt or rice produced by each model.
Impact of rice imports on rice production in Timor-Leste
Page 20
compared with a farm-gate import parity price for rice of about $660/Mt, it is apparent that growing staple food in Timor-Leste using river diversion irrigation is very expensive and uneconomic, particularly if MAF and MCIE are not able to fulfil their farmer support mandates.
Table 12: Production, Financial and Economic Analyses:
1,000 ha Generic Irrigation Scheme – River Diversion system
1,000 ha Generic Irrigation Scheme - Based on River Diversion Model 1 a/ Model 2 b/ Model 3 c/ Model 4 d/
2013 Construction costs $10,000,000 $10,000,000 $10,000,000 $10,000,000
Km of road required 5 5 5 5
MAF Suco Extension Officer cost ($25,000/SOE) $75,000 $75,000 $75,000 $75,000
Total area of paddy land (ha) 1,000 1,000 1,000 1,000
Current % use paddy land (season 1) (WOP) 50% 50% 50% 50%
Current % use paddy land (season 2) (WOP)
Number of households 1,000 1,000 1,000 1,000
Number of people 6,000 6,000 6,000 6,000
Irrigation % (1st season) (WP) 100% 100% 100% 100%
Irrigation % (2nd season) (WP) 75% 75%
Irrigation % (3rd season) (WP) 50% 50%
WOP maize yield (Kg/ha) 1,500 1,500 1,500 1,500
WP maize yield (Kg/ha) 3,000 1,500 3,000 1,500
WOP rice yield (Kg P/ha) 2,500 2,500 2,500 2,500
WP rice yield (Kg P/ha) 5,000 2,500 5,000 2,500
WP legume yield (Kg/ha) 750 750
Base EIRR (%): two key assumptions hold 11% zero negative negative
EIRR (%): construction costs + 10% (2 assumptions hold) 9% negative negative negative
EIRR (%): construction costs - 10% (2 assumptions hold) 12% 1% zero negative
Without Project food production (Mt) 688 688 688 688
With Project food production (Mt) - situations vary 5,750 2,969 2750 1,375
Incremental staple food production (Mt) 5,063 2,282 2,063 688
Demand for staple food (Mt) based on 250 kg/pp/yr. 1,500 1,500 1,500 1,500
Staple food balance in village (Mt) (surplus/ deficit) 3,563 782 563 -813
Irrigation Investment costs/inc. Mt staple food production, ($/Mt) $1,975 $4,383 $4,848 $14,545
Government costs, including return on investment
MAF incremental irrigation maintenance ($'000/year) $263 $263 $263 $263
MAF incremental agriculture extension costs ($'000/year) $75 $75 $75 $75
MAF incremental fertilizer costs ($'000/year) $554 $554
MCIE incremental cost to transport/redistribute "surplus" food ($'000/year, $200/Mt) $713 $156 $113
MCIE incremental subsidy cost (loss on trading) ($'000/year, $270/Mt) $962 $211 $152
Return on investment in irrigation infrastructure (10%) ($'000) $1,000 $1,000 $1,000 $1,000
Total MAF, MCIE and Government costs ($'000) $3,566 $1,705 $2,156 $1,338
Opportunity cost of family labour ($1.50/labour day) $225 $225 $38 $38
TOTAL COST ($/INCREMENTAL MT STAPLE FOOD) e/ f/ $749 $846 $1,064 $2,000
a/ Two key MAF (yield) and MCIE (cropping intensity) assumptions hold $920
b/ MAF incremental yield assumptions fails; MCIE assumption holds
c/ MAF incremental yield assumptions holds; MCIE assumption fails
d/ MAF incremental yield and MCIE increased cropping intensity assumptions both fail
e/ Excludes depreciation of irrigation infrastructure
f/ Includes opportunity cost of household labour.
Weighted Av. Cost/Incremental Mt Food

Impact of rice imports on rice production in Timor-Leste
Page 21
3.4 Cost of Growing Rice in Timor-Leste: Tube-Well Schemes
41. There is an alternative to the use of river diversion irrigation for the production of irrigated rice in Timor-Leste. This is the use of tube-wells and small solar, electric or fuel-driven pumps based on aquifer water which generally underlies irrigated areas35. Experience in Cambodia36 indicates that tube-well based irrigation systems can be constructed for about $1,000 per ha and are often more productive because a few families are able to jointly manage water distribution. In Africa such schemes cost about $2,000 per ha37.
42. In Timor-Leste the investment cost of growing staple food using tube-well based irrigation would also be about $2,000 per ha, compared with about $10,000 per ha for river diversion irrigation. This means that, depending on the underlying crop production, extension services and input supplies, and market support assumptions, the cost per Mt of producing staple food in Timor-Leste could be reduced to about $440 per Mt (weighted average for four models, see Table 13), a reduction of about $480 per Mt of staple food.
Table 13: Production, Financial and Economic Analyses:
1,000 ha Generic Irrigation Scheme – Tube-Well System
35 See: Wallace, L, Sundaram, B. Brodie, R. S., Dawson, S. and Furness, L., 2011. Hydrogeology of Timor-Leste. Geoscience Australia, Record 2011, for details on Timor-Leste’s water resources including aquifers. 36 Dr. Harry Nesbitt – pers. com. 37 www.fao.org/docrep/W7314E/w7314e0v.htm
1,000 ha Generic Irrigation Scheme - Based on Tube-Wells and Pumps Model 1 a/ Model 2 b/ Model 3 c/ Model 4 d/
2013 Construction costs $2,000,000 $2,000,000 $2,000,000 $2,000,000
Without Project food production (Mt) 688 688 688 688
With Project food production (Mt) - situations vary 5,750 2,969 2750 1,375
Incremental staple food production (Mt) 5,063 2,282 2,063 688
Demand for staple food (Mt) based on 250 kg/pp/yr. 1,500 1,500 1,500 1,500
Staple food balance in village (Mt) (surplus/ deficit) 3,563 782 563 -813
Irrigation Investment costs/inc. Mt staple food production, ($/Mt) $395 $877 $970 $2,909
Government costs, including return on investment
MAF incremental irrigation maintenance ($'000/year) $63 $63 $63 $63
MAF incremental agriculture extension costs ($'000/year) e/ $75 $38 $75 $38
MAF incremental fertilizer costs ($'000/year) f/ $554 $277 $554 $277
MCIE incremental cost to transport/redistribute "surplus" food ($'000/year, $200/Mt) $713 $156 $113
Return on investment in irrigation infrastructure (10%) ($'000) $200 $200 $200 $200
Total MAF, MCIE and Government costs ($'000) $1,604 $733 $1,004 $577
Opportunity cost of family labour ($1.50/labour day) $225 $225 $38 $38
TOTAL COST ($/INCREMENTAL MT STAPLE FOOD) g/ h/ $361 $420 $505 $894
a/ Two key MAF (yield) and MCIE (cropping intensity) assumptions hold $440
b/ MAF incremental yield assumptions fails; MCIE assumption holds
c/ MAF incremental yield assumptions holds; MCIE assumption fails
d/ MAF incremental yield and MCIE increased cropping intensity assumptions both fail
e/ Assumes 50% of MAF's SOE cost for Models 2 and 4.
f/ Assumes that 50% of recommended fertilizer is used for Models 2 and 4.
g/ Excludes depreciation of irrigation infrastructure
h/ Includes opportunity cost of household labour.
Weighted Av. Cost/Incremental Mt Food

Impact of rice imports on rice production in Timor-Leste
Page 22
43. In summary, it should be possible for Timor-Leste to become self-sufficient in staple food at a competitive cost provided MAF and MCIE are allocated operational budgets which are sufficient for these ministries to provide the farmer support required to stimulate and enable increased food crop production, and the sale of local “surpluses”. This is a major assumption as at present (2012) neither ministry has anywhere near the budget required to fulfil their mandates. MTCI’s track record in terms of purchasing and redistributing rice, maize and other food stuffs is not good (in 2011 MTCI only managed to purchase 5,763 Mt of rice) and MAF’s total operating budget for 2012 was only $15.9 million for 13 national directorates and 13 districts38.
3.5 Other Options for Growing Rice in Timor-Leste
44. At present the irrigated rice strategy in Timor-Leste is based on expensive-to-build and -operate river diversion schemes. MAF plans to construct/ rehabilitate nine such schemes in 2013 - 2016 using funds from the Infrastructure fund at a cost of about $89 million39. These schemes are scattered across the country and therefore it is not possible to generate efficiencies in terms of concentrating the supplies of production inputs and providing marketing services.
45. However if there was some sectoral prioritization and the establishment of “rice-bowls” in locations with good resources (large areas of relatively flat land, fertile soils and reliable supplies of irrigation water) and relatively good access, rice production efficiency could be improved. For example it seems logical to focus irrigated rice production along the south coast where river flows and alluvial fans are larger. Similarly a focus on the Maliana valley which is serviced by two irrigation systems (both of which have been recently rehabilitated) would also seem logical.
46. The combination of tube-wells and small pumps, and a “rice-bowl” approach, should result in considerably reduced production costs, perhaps even lower than those discussed in Section 0. This would make rice production in Timor-Leste more economic and reduce reliance on imports. Furthermore, another alternative approach to irrigated rice production in Timor-Leste could be based on maximising production on those schemes which have already been rehabilitated (maximize returns on sunk costs), rather than continuing to rehabilitate schemes which are only capable of producing low yields from one rice crop per year. Some combination of using “cheaper water” from tube-wells and maximizing returns from sunk costs seems the most logical irrigation strategy for Timor-Leste, at least in the medium term.
38 MAF’s 2013 operational budget is $24.2 million. 39 In 2013 prices. Note that the current IF budget for irrigation schemes is based on 2009 prices.
Impact of rice imports on rice production in Timor-Leste
Page 23
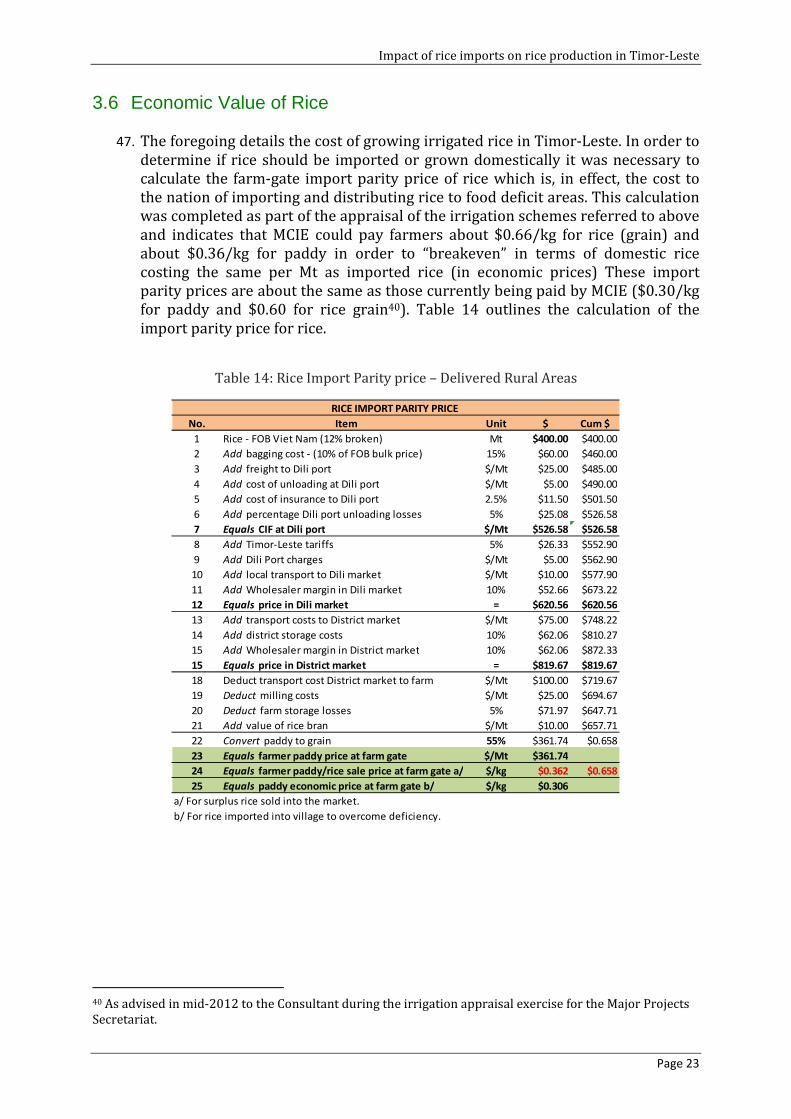
3.6 Economic Value of Rice
47. The foregoing details the cost of growing irrigated rice in Timor-Leste. In order to determine if rice should be imported or grown domestically it was necessary to calculate the farm-gate import parity price of rice which is, in effect, the cost to the nation of importing and distributing rice to food deficit areas. This calculation was completed as part of the appraisal of the irrigation schemes referred to above and indicates that MCIE could pay farmers about $0.66/kg for rice (grain) and about $0.36/kg for paddy in order to “breakeven” in terms of domestic rice costing the same per Mt as imported rice (in economic prices) These import parity prices are about the same as those currently being paid by MCIE ($0.30/kg for paddy and $0.60 for rice grain40). Table 14 outlines the calculation of the import parity price for rice.
Table 14: Rice Import Parity price – Delivered Rural Areas
40 As advised in mid-2012 to the Consultant during the irrigation appraisal exercise for the Major Projects Secretariat.
No. Item Unit $ Cum $
1 Rice - FOB Viet Nam (12% broken) Mt $400.00 $400.00
2 Add bagging cost - (10% of FOB bulk price) 15% $60.00 $460.00
3 Add freight to Dili port $/Mt $25.00 $485.00
4 Add cost of unloading at Dili port $/Mt $5.00 $490.00
5 Add cost of insurance to Dili port 2.5% $11.50 $501.50
6 Add percentage Dili port unloading losses 5% $25.08 $526.58
7 Equals CIF at Dili port $/Mt $526.58 $526.58
8 Add Timor-Leste tariffs 5% $26.33 $552.90
9 Add Dili Port charges $/Mt $5.00 $562.90
10 Add local transport to Dili market $/Mt $10.00 $577.90
11 Add Wholesaler margin in Dili market 10% $52.66 $673.22
12 Equals price in Dili market = $620.56 $620.56
13 Add transport costs to District market $/Mt $75.00 $748.22
14 Add district storage costs 10% $62.06 $810.27
15 Add Wholesaler margin in District market 10% $62.06 $872.33
15 Equals price in District market = $819.67 $819.67
18 Deduct transport cost District market to farm $/Mt $100.00 $719.67
19 Deduct milling costs $/Mt $25.00 $694.67
20 Deduct farm storage losses 5% $71.97 $647.71
21 Add value of rice bran $/Mt $10.00 $657.71
22 Convert paddy to grain 55% $361.74 $0.658
23 Equals farmer paddy price at farm gate $/Mt $361.74
24 Equals farmer paddy/rice sale price at farm gate a/ $/kg $0.362 $0.658
25 Equals paddy economic price at farm gate b/ $/kg $0.306
a/ For surplus rice sold into the market.
b/ For rice imported into village to overcome deficiency.
RICE IMPORT PARITY PRICE
Impact of rice imports on rice production in Timor-Leste
Page 24
3.7 Impact of Consumer Rice Subsidies on Domestic Rice Production
48. There is considerable anecdotal evidence that 30,000 Mt (estimate for 2012) of highly subsidized rice (sold under controlled market conditions for $12.00/25 kg, or $0.48/kg) is impacting on the incentive for farmers to grow more than their families’ subsistence requirements for rice. The Consultant met with 11 groups of rice farmers across Timor-Leste during 2012 when completing the appraisal of proposed irrigation schemes for MPS. Invariably these groups of farmers advised the Consultant that: “there is no point in growing more rice as there is plenty of
cheap rice in the market and even if we did grow more rice there are no markets for
our “surpluses”. In addition many of the rice farmers interviewed have relations who are receiving pensions or are employed on cash-for-work programs. This means that these rural households have sufficient cash to be able to purchase either subsidized rice, or relatively cheap (and poor quality [up to 25% broken] rice in district markets.
49. A possible solution to this dilemma is to de-couple rice prices for consumers and producers and to use other ways to provide food-support, perhaps using food vouchers41. This important topic needs to be further-explored and options analyzed with the objective of restoring price incentives for Timor-Leste’s farmers to produce more rice.
3.8 Factors Other than Price Influencing Rice Production
50. Many factors determine why about 45,700 rural households42 grow irrigated rice in Timor-Leste, and how these families respond to various types of incentives and price signals. Markets are not working anywhere near perfectly in rural Timor-Leste and farmers’ production decisions are influenced by factors such as: (i) the availability of subsidized rice in local markets; (ii) availability of cash (from Government transfer payments) to buy cheap imported rice; (iii) the near-by presence (or absence) of local market support programs (such as MTCI’s/ MCIE’s “you grow and we buy” program); (iv) availability of production inputs such as seed, fertilizer and labour43; and (v) rural households’ utility of leisure.
51. Failure to understand the combined impact of these factors on farmers’ production decisions has often resulted in two recurrent complaints (from rural households and governments) in countries with large rural populations, and in which the economy depends on the rural sector for foreign exchange earnings (or in the case of Timor-Leste, import substitution [rice]) and for the supply of labour and food. The first is that rural households invariably complain that every year is bad (labour constraints if the season is favourable, and food scarcity if it is poor).
41 This important topic needs to be further-explored and options analyzed with the objective of restoring price incentives for farmers to produce more rice. 42 Figure from 2010 census. 43 Rural labour in some areas of Timor-Leste is becoming scarce and expensive as people move to district capitals and Dili, and seek employment on cash-for-work programs. For example rice growers in the Maliana irrigation area reported (pers. com.) in 2012 that they would not be planting rice in the main growing season because of a lack of labour and expensive inputs (seed and fertilizer).

Impact of rice imports on rice production in Timor-Leste
Page 25
The second is that governments complain that rural households are not sufficiently responsive to price incentives and to opportunities to adopt new technology44.
52. This scenario applies to the current agriculture environment in Timor-Leste. Whilst irrigation schemes have been rehabilitated, farmers generally are still only growing one main-season rice crop45, extension services are under-resourced and staff are inexperienced, production inputs other than seed46 are scarce, MTCI’s/MCIE’s “you grow and we buy” program only purchased 5,762 Mt of rice during all of 2011 and the first half of 201247 (this period covers two main and one second season crops), and most rural families have members who are receiving pensions and/ or income from cash-for-work programs.
53. This study does not intend to criticize the admirable social and economic development support programs for Timor-Leste’s rural communities. However given the extent to which they impact negatively on other Government development programs (such as expensive irrigation refurbishment) it is important to highlight the dis-connect between well-intentioned and certainly deserving programs on the one-hand, and the objectives which underlie Government’s irrigation development strategy to grow additional rice, on the other, with the objective of replacing rice imports with domestically grown product.
54. Timor-Leste’s farmers are understandably very averse to risks associated with staple food production. This is why most grow a wide range of food crops and if possible also raise livestock. Very few are specialist growers of food crops and most farmers with access to irrigated land also grow rainfed upland crops as a form of “insurance”. For example: (i) farmers who grow irrigated crops in the Maliana valley also grow upland, rainfed crops (maize, cassava, sweet potato, etc.) in the hills adjacent to the irrigation area; and (ii) Caraulun’s farmers are also maize growers on land which is watered by shallow aquifers and some are also fishermen on the south coast.
55. This scenario has implications for Timor-Leste’s plans to identify and promote specialist agriculture production zones (see the SDP). It is equally importantly for the planned rehabilitation of irrigation schemes. Farmers’ broad risk profiles (and memories of bad seasons and periods of hunger) mean that promoters of more intensive land use following the refurbishment of irrigation schemes should recognize that there are numerous and very logical reasons why farmers may not (in the eyes of some) behave rationally in terms of maximizing crop production and farm profits. This is why close community consultations are essential pre-cursors to the finalization of plans for irrigation rehabilitation, recognizing that traditional decision-making systems and cultural values are important
44 Concept extracted from: “Peasant Household Behaviour with Missing Markets: Some Paradoxes Explained”, The Economic Journal 101 (November 1991), 1400-1417: Alain de Janvry, Marcel Fafchamps and Elisabeth Sadoulet. 45 See footnote 30 for source of this information. 46 Particularly inorganic fertilizer and food storage containers. 47 As reported in FNSTF Quarterly Reports for 2011 and 2012.
Impact of rice imports on rice production in Timor-Leste
Page 26
determinants of how farmers’ react to increased supplies of free irrigation water48.
56. Family labour constraints and the high unskilled daily wage rate in Timor-Leste49 are also important determinants of how subsistence farmers (who also hire labour in the form of shared labour) respond to price and other incentives, such as increased supplies of free irrigation water. The availability of labour for weed control in paddy is often the key determinant of the area cropped by a family, and if weeds dominate crops yields are reduced considerably. Therefore even if there is an abundant supply of irrigation water resulting from refurbished infrastructure, there is no “guarantee” that crop areas and yields will increase50.
57. Another labour-related constraint also impacts on the areas of irrigated land planted to second season crops in Timor-Leste - the fact that many households with irrigated land also crop upland swidden areas with maize and mixed roots and tubers. This means that at the time in the cropping calendar when a second crop of paddy is ready for harvest, most upland farming households are busy preparing their upland swiddens for planting on the first rains in about November. This again is a labour constraint issue which impacts indirectly on irrigation cropping intensity.
58. Land in Timor-Leste has no commercial value and cannot be bought and sold, although it is re-distributed amongst related households at the aldeia level. This “land value” constraint has resulted in farmers with custodial rights to land concluding that the second-best way to create value from this resource (other than to crop it during the main season) is to graze ruminant livestock on crop residues and weeds. Once farmers have sufficient rice for their family’s requirements (and in the absence of markets for “surpluses”) it makes sense for farmers to graze ruminants on their irrigated land with the objective of converting “value-less” organic matter into assets (increased numbers of livestock) which can be retained or converted into cash when required. Therefore although the issue of land value is not an exogenous factor as such, irrigation farmers’ livestock grazing practices also determine the intensity of land use, and their response to lack of markets for increased production of staple food.
59. One of the main findings from the irrigation appraisal work completed by the Consultant was the, at first, unexplained reasons why rice farmers are not responding to increased supplies of free irrigation water after scheme rehabilitation, by increasing their cropping intensity. The Laclo scheme in Manatuto is a good example of this situation. In September 2012, river and canal flows were in excess of 3m3 per second and much of the irrigated area remained green from subterranean flows. However not one ha of second season rice was grown. The Japanese advisors working with MAF’s district-level irrigation staff
48 For example, the cropping season in the Laclo irrigation scheme in Manatuto does not commence until approval is given by respected elders and appropriate ceremonies have been performed, even if there is ample water to commence the puddling process. 49 US$4.80 per day compared with US$1.00 per day in Viet Nam and West Timor. 50 A good example of this situation is the Bebui irrigation scheme in Viqueque which was rehabilitated by Government and opened in time for the 2012 cropping season. The Chefe de Suco informed the MPS Irrigation Appraisal Team (late 2012) that there was no increase in the area cropped or yields in 2012, even though $10 million had been invested in repairs and upgrading.

Impact of rice imports on rice production in Timor-Leste
Page 27
informed the Irrigation Appraisal Team that despite good maintenance of the irrigation infrastructure and the establishment of demonstrations on how to grow second (and even third) season crops, farmers had not responded. Farmers seemed content to let their livestock (mainly buffalo, with a few sheep and goats) graze weeds growing on the irrigation area, and explained this practice as being essential as all other sources of feed for ruminant livestock had been exhausted – the nearby hills were severely over-grazed and denuded in late 2012.
3.9 Explaining Apparent Perverse Behaviour by Rural Communities
60. This scenario seems to be common across much of Timor-Leste. The Irrigation Appraisal Team encountered similar situations at the Maliana II scheme in Bobonaro, and the Bebui scheme in Viqueque – ample supplies of irrigation water but virtually no second or third crops. The foregoing discusses the main reasons why farmers are acting rationally even though initially it is some-what difficult to explain their non-responsive behaviour. The next section therefore attempts to explain this behaviour in more financial terms with the objective of trying to define the farm-gate rice price which MCIE might have to pay in order to entice farmers to grow more rice; or in more precise terms: “why, if Timor-Leste’s rural
households are so constrained by labour and/or food shortages, and consequently
lead lives of instability in terms of work and food consumption, do they appear
sluggish and unresponsive to incentives and modernization opportunities”?
61. Alain de Janvry et.al.51 offer a “structuralist” explanation of this scenario in which market failures for labour and/or food severely constrain rural communities’ ability to respond to price incentives, and other external factors. This forces rural households to shift the burden of adjustment onto the non-traded product (food) and factor (labour) which households control. In certain circumstances the necessary internal adjustments can result in only minimal external response to (for example, an increase in the farm-gate price of rice) and apparent perverse behaviour in eyes of government officials.
62. Readers of this study are advised to consult the reference mentioned in footnote 44 if further explanation of why farmers do not always respond to price signals is required. Simplistically, this classical explanation of agricultural household supply responses indicates that rice prices in Timor-Leste (those paid by MCIE with the objective of stimulating production) might have to double, as shown in Figure 2 which is a theoretical rice price supply response graph.
51 Source: footnote 44.
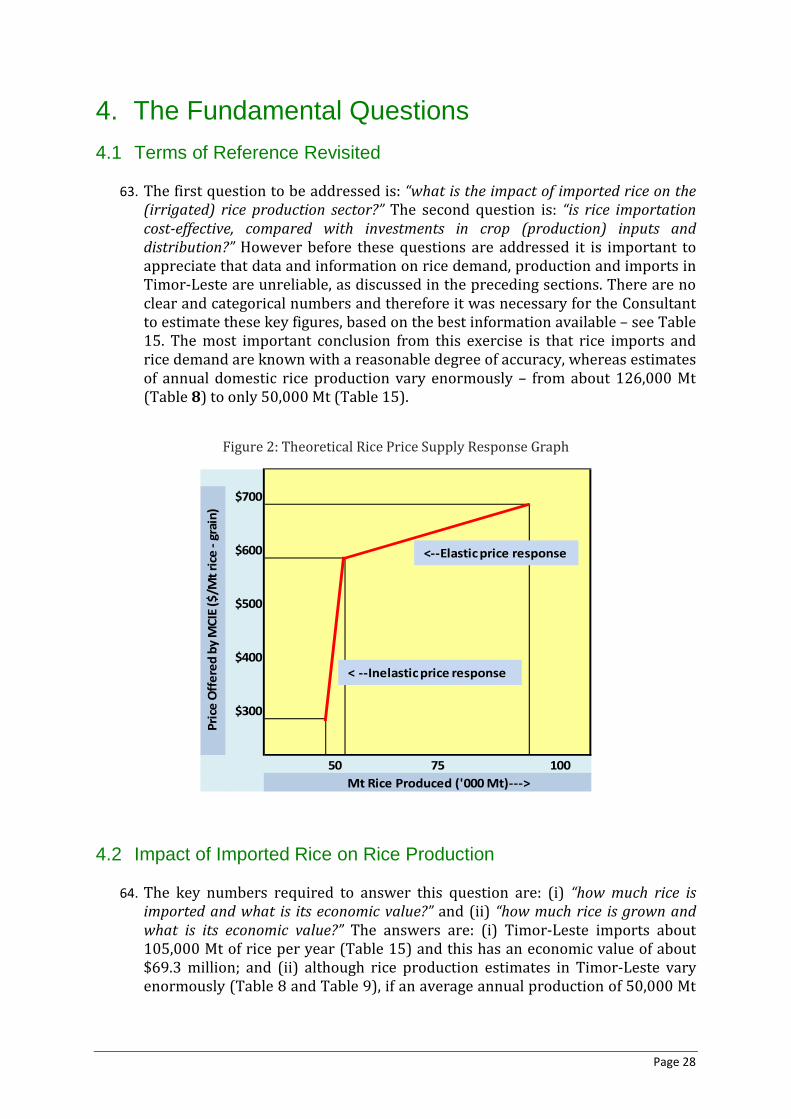
Page 28
4. The Fundamental Questions
4.1 Terms of Reference Revisited
63. The first question to be addressed is: “what is the impact of imported rice on the
(irrigated) rice production sector?” The second question is: “is rice importation
cost-effective, compared with investments in crop (production) inputs and
distribution?” However before these questions are addressed it is important to appreciate that data and information on rice demand, production and imports in Timor-Leste are unreliable, as discussed in the preceding sections. There are no clear and categorical numbers and therefore it was necessary for the Consultant to estimate these key figures, based on the best information available – see Table 15. The most important conclusion from this exercise is that rice imports and rice demand are known with a reasonable degree of accuracy, whereas estimates of annual domestic rice production vary enormously – from about 126,000 Mt (Table 8) to only 50,000 Mt (Table 15).
Figure 2: Theoretical Rice Price Supply Response Graph
4.2 Impact of Imported Rice on Rice Production
64. The key numbers required to answer this question are: (i) “how much rice is
imported and what is its economic value?” and (ii) “how much rice is grown and
what is its economic value?” The answers are: (i) Timor-Leste imports about 105,000 Mt of rice per year (Table 15) and this has an economic value of about $69.3 million; and (ii) although rice production estimates in Timor-Leste vary enormously (Table 8 and Table 9), if an average annual production of 50,000 Mt
$700
$600
$500
$400
$300
50 75 100
Mt Rice Produced ('000 Mt)--->
Pri
ce O
ffe
red
by M
CIE
($
/Mt
rice
- g
rain
)
< --Inelastic price response
<--Elastic price response

Impact of rice imports on rice production in Timor-Leste
Page 29
is used as the basis for calculation this production has an economic value of $33.00 million.
Table 15: Estimated Rice Imports to Balance Supply and Demand (Mt)
65. In the longer-term the direct impact of importing (say) 80,000 Mt of rice valued
at $52.8 million every year is obvious – Timor-Leste’s rice farmers are not earning 80,000 Mt x $660/Mt = $52.8 million from the sale of domestically produced rice to either local traders or MCIE. However this logic is not quite as simple in practice, as at present MCIE does not have the budget or storage facilities to handling an annual purchase of this size (see Section 3.8 – in the six quarters to mid-2012 MTCI only purchased 5,762 Mt of rice from local growers). In addition there is no “guarantee” that Timor-Leste’s rice farmers would be prepared to increase production by more than about 160% (80,000/50,000 = 160%) if MCIE or local traders offered them $660/Mt for rice (grain) or about $365/Mt for paddy (assuming a 55% yield).
66. There are no publications on the price elasticity of rice supply in Timor-Leste but there is considerable anecdotal evidence that it is very inelastic, at least over lower price bands (Figure 2). Farm-gate rice prices would have to increase considerably (perhaps by as much as 100%) before farmers would be tempted to increase production. This is because there are many non-price factors which are currently influencing rice production in Timor-Leste and until these factors are addressed through policy changes (for example de-coupling producer and consumer rice prices and using non-subsidy strategies to assist Timorese who cannot afford to buy staple food) it is unlikely that rice production will increase to compete with imports.
15,00080,0002,0005,000
48,000150,000
125,0008,6501,350
15,000150,000
0a/ As reported by FNSTFb/ Figure used to balance demand and supply.
d/ Assumes opening stocks equals closing stocks.
Donated rice Rice entering market - MCIE
Rice Imports to Balance Supply and Demand (Mt)
Adjusted 2011 figures a/
c/ 50,000 Mt less MCIE purchases
Rice Demand
Domestic rice production - estimated c/
Annual Rice Supplies
Demand for 1 year Post harvest losses
Opening Government rice stocksRice entering market - Private Sector b/
Total rice supplies
Seed retained Closing stocks d/
BalanceTotal rice demand

Impact of rice imports on rice production in Timor-Leste
Page 30
4.3 Impact of Subsidized Rice on Domestic Production
67. The impact of about 30,000 Mt of subsidized rice on the incentive for farmers to grow more rice is even more dramatic – why should farmers grow more rice when they can either buy heavily subsidized rice in local markets, or poor quality (up to 25% broken) rice which is imported by local traders and distributed throughout the country? There are even reports of Timorese farmers selling their locally produced rice to traders (especially if they grow a preferred local variety) and then using the sale proceeds to purchase cheap imported and/or subsidized rice.
68. When the impact of the exogenous factors outlined in Section 3.8 is overlaid on the huge impact of at least 80,000 Mt52 of imports (of which about 30,000 Mt is subsidized) it becomes apparent that Timor-Leste’s rice importing and rice production policies are diametrically opposed, with the former negating the latter. To make matters worse, the current rice production environment in Timor-Lese is such that huge investments are proposed for new irrigation schemes when it is apparent that without the complementary “software packages” of support for MAF and MCIE, the cost per incremental Mt is about $2,000 (see Table 12). This could be reduced to $750/Mt if Government provided the budget required for MAF and MCIE to fulfil their mandates.
69. It is increasingly apparent that irrigation schemes based on weirs and river diversion are too expensive to construct, operate and maintain in Timor-Leste, but this is another debate which should be part of a National Food Policy.
4.4 Cost Effectiveness of Rice Importation Compared with Investment in Rice Production
70. Table 16 details the calculations completed to enable the calculation of the economic cost of producing rice in Timor-Leste, compared with the economic cost of importing rice. The four rice production and two irrigation models outlined in Section 3.2 were used to generate these rice production costs. The main conclusions are:
(i) If Timor-Leste continues to use weir-based river diversion irrigation schemes for rice production, annual rice production costs will vary from about $60 million to $160 million, depending on the level of budget support allocated by Government to the irrigation sector (the four production models). These costs are (on average across all four models) about $20.80 million more than importing equivalent tonnages of rice.
52 See footnote 53.
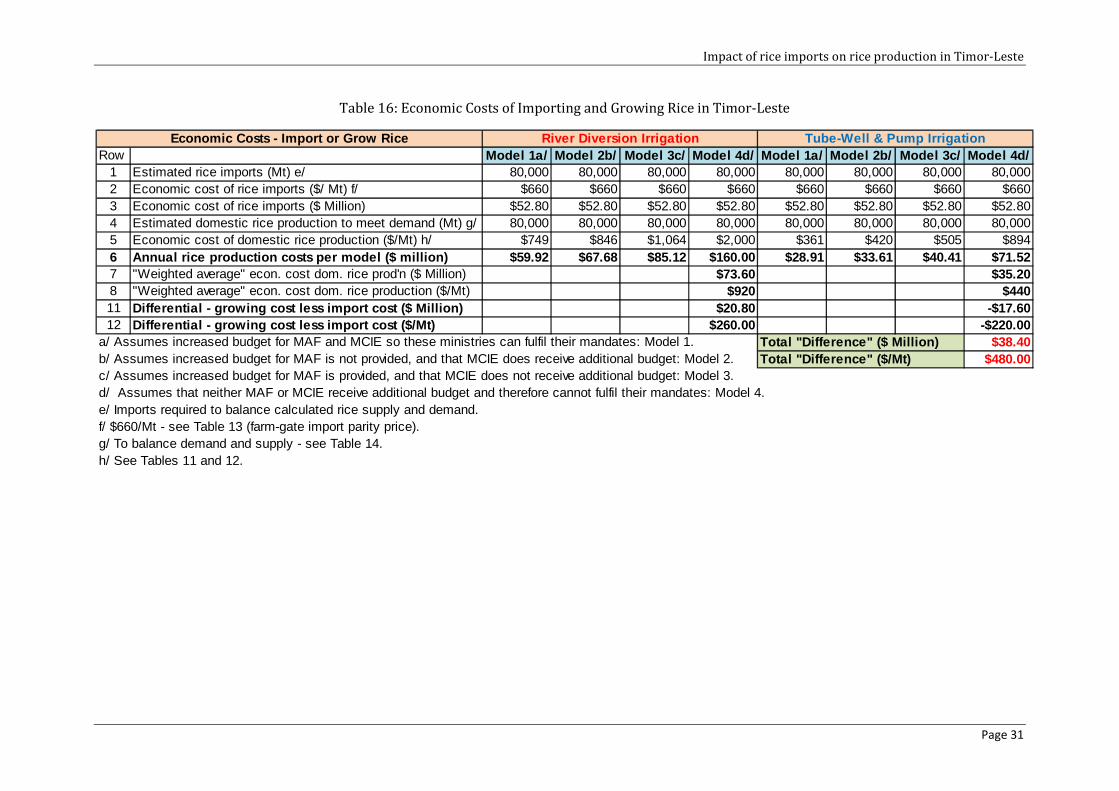
Impact of rice imports on rice production in Timor-Leste
Page 31
Table 16: Economic Costs of Importing and Growing Rice in Timor-Leste
Row Model 1a/ Model 2b/ Model 3c/ Model 4d/ Model 1a/ Model 2b/ Model 3c/ Model 4d/1 80,000 80,000 80,000 80,000 80,000 80,000 80,000 80,0002 $660 $660 $660 $660 $660 $660 $660 $6603 $52.80 $52.80 $52.80 $52.80 $52.80 $52.80 $52.80 $52.804 Estimated domestic rice production to meet demand (Mt) g/ 80,000 80,000 80,000 80,000 80,000 80,000 80,000 80,0005 $749 $846 $1,064 $2,000 $361 $420 $505 $8946 $59.92 $67.68 $85.12 $160.00 $28.91 $33.61 $40.41 $71.527 $73.60 $35.208 "Weighted average" econ. cost dom. rice production ($/Mt) $920 $44011 $20.80 -$17.6012 $260.00 -$220.00
a/ Assumes increased budget for MAF and MCIE so these ministries can fulfil their mandates: Model 1. $38.40b/ Assumes increased budget for MAF is not provided, and that MCIE does receive additional budget: Model 2. $480.00c/ Assumes increased budget for MAF is provided, and that MCIE does not receive additional budget: Model 3.d/ Assumes that neither MAF or MCIE receive additional budget and therefore cannot fulfil their mandates: Model 4.e/ Imports required to balance calculated rice supply and demand.f/ $660/Mt - see Table 13 (farm-gate import parity price).g/ To balance demand and supply - see Table 14.h/ See Tables 11 and 12.
Differential - growing cost less import cost ($/Mt)Total "Difference" ($ Million)Total "Difference" ($/Mt)
Economic cost of domestic rice production ($/Mt) h/
Economic Costs - Import or Grow Rice
Differential - growing cost less import cost ($ Mil lion)
Economic cost of rice imports ($ Million)
"Weighted average" econ. cost dom. rice prod'n ($ Million)Annual rice production costs per model ($ million)
Economic cost of rice imports ($/ Mt) f/
Tube-Well & Pump Irrigation
Estimated rice imports (Mt) e/
River Diversion Irrigation
Impact of rice imports on rice production in Timor-Leste
Page 32
(ii) Under the current budget scenarios (in which MAF and MCIE are severely under-funded) the cost of growing rice is $107.00 million per year ($160.00 million less $53.00 million) more than importing rice. This is a huge differential which should cause Government to reconsider its current strategy of expensive irrigation scheme development which is not complemented by complementary MAF and MCIE support programs.
(iii) If Timor-Leste changed its irrigation development strategy to one which is possibly based on tube-wells and small pumps, it would be more cost-effective to grow rather than to import rice - an “average annual saving” of about $17.60 million for the four tube-well production models.
(iv) With river diversion rice production estimated to currently “cost” $20.80 million per year more than importing rice, and tube-well rice production estimated to “save” $17.60 million per year, there is a differential of about $38.40 million per year, a huge figure when it is considered that MAF’s 2013 budget is less than $25 million.

Page 33
5. Conclusions
5.1 Overall Conclusion
71. The key conclusion is that it is far more expensive for Timor-Leste to grow rather than to import rice, at least in the current agriculture environment in which sectoral investment is heavily skewed in favour of irrigation infrastructure (“hardware”). This is because “software support packages” (farmer extension and training services, provision of production inputs, and markets for surplus staple foods) are not available to complement “hardware packages” (irrigation construction), and are not likely to be available in the foreseeable future.
72. Table 16 summarizes the economic costs of importing and growing rice in Timor-Leste for two types of irrigation schemes (river diversion and tube-well) and four rice production models which are based on various assumptions related to the level of sectoral support provided by Government. It shows that rice production in Timor-Leste using a river diversion irrigation system is very costly compared with importing rice (row 6, Model 4, Table 16 ). Rice imports currently cost about $53 million per year ($660/Mt for 80,000 Mt53) and it would cost $160 million per year ($2,000/Mt) to grow the equivalent tonnage under the current inefficient and unproductive rice production systems.
73. However if a more efficient and cheaper irrigation system was feasible (perhaps based on tube-wells and small pumps, and more intensive use of production inputs and improved market support) the economic cost of growing rice in Timor-Leste would be less than the cost of importing rice; about $440/Mt compared with $660/Mt. Using an intensive “rice-bowl” approach to irrigated rice production, rather than the current scattered “every district must have irrigation approach” would also reduce the cost of growing irrigated rice.
74. When the differential costs between the two irrigation strategies are compared (based on the average cost of the four rice production models (rows 7 and 8, Table 16) the very high cost of growing irrigated rice in Timor-Leste becomes even more apparent. The proposed use of river diversion irrigation schemes will cost about $38.40 million per year ($480Mt) more than an alternative approach based on tube-wells and the use of small pumps, plus more intensive use of production inputs and marketing services.
5.2 Other Conclusions
75. These are presented in note form.
(i) Timor-Leste will require 137,000 Mt of rice in 2013, increasing to 193,500 Mt in 2030. The country will never be self-sufficient in rice under the current production system and levels of Government support – an
53 The “average” volume of rice imports used for study modelling. Note that more than 100,000 Mt of rice were imported in 2011.

Impact of rice imports on rice production in Timor-Leste
Page 34
estimated deficit of 78,000 Mt in 2030. At present about 100,000 Mt of rice are imported annually by the private sector, with another 30,000 Mt imported by Government for subsidized distribution. Donations of rice in 2011 were about 18,000 Mt.
(ii) There a difference of 134,627 Mt between the reported and calculated closing rice stocks at the end of 2011 even though the quantities of rice imported and consumed are known with a reasonable degree of accuracy. One answer to this imbalance is that domestic rice production is not as high as officially reported. The only way to balance reported and calculated rice stocks is to assume that: (i) rice consumption per person is about 115 kg/year; and (ii) domestic rice (grain) production is only about 30,000 Mt/year. It is impossible to reconcile reported rice import and consumption figures using figures provided by Government.
(iii) There is anecdotal evidence that 30,000 Mt of highly subsidized rice (sold for about $12.00/25 kg, or $0.48/kg) is impacting on the incentive for farmers to grow more than their families’ subsistence requirements. Farmers are reporting: “there is no point in growing more rice as there is plenty of cheap rice in the market and even if we did grow more rice there are no markets for our “surpluses”.
(iv) In the longer-term the direct impact of importing (say) 80,000 Mt of rice valued at $52.8 million every year is obvious – Timor-Leste’s rice farmers are not earning $52.8 million from the sale of domestically produced rice to local traders or MCIE, assuming that MCIE/Government is willing to absorb transaction and storage costs.
5.3 Recommendations
76. The analyses completed for this study indicate a number of confusing and inconsistent sets of figures on Timor-Leste’s rice sector, and strongly conflicting policies in terms of, on the one hand attempting to stimulate domestic rice production whilst on the other “flooding” the domestic market with cheap, subsidized rice. Furthermore rice production under the current river diversion river strategy is not competitive with imports, or with rice grown using cheaper tube-well, and more intensive production, irrigation systems.
77. The analyses completed have revealed a number of areas in Timor-Leste’s irrigated rice sector which require immediate attention and action. These are:
(i) Improved collection and reporting of data and information on rice production, demand and importation, to enable better decision-making in terms of: (a) how much rice to import; (b) rice price subsidization; (c) the impact of food consumption patterns on human nutrition; and (d) levels of investment in the sector and support in terms of annual operating funds. Action on this recommendation will require: (a) the allocation of additional support for FNSTF and its elevation to much higher and therefore influential position within the Government

Impact of rice imports on rice production in Timor-Leste
Page 35
hierarchy; (b) much improved collection and reporting on a wide range of agriculture statistics; (c) improved analytical skills within MAF’s Policy and Planning Directorate, and (d) increased application of agriculture economics skills to decision-making related to investment in staple food production and the analysis of production strategy options.
(ii) Recognition (and action) by Government of the need to review how Timor-Leste grows irrigated rice, and the levels of investment and operational support required for the sub-sector to function efficiently. As a minimum this should include a detailed analysis of three options: (i) continued use of weir-based river diversion systems – with and without “software” support; (ii) testing and application of results for irrigated rice production based on tube-wells and small pumps – with and without “software” support; and (iii) more concentrated rice production (the rice-bowl approach) in favourable areas and locations which can be serviced efficiently in terms of inputs and marketing, rather than the current scattered approach which is based on constructing irrigation systems in most districts.
(iii) Acceptance that the national objective of rice self-sufficiency (as expressed in the Strategic Development Plan) will be very costly to achieve ($2,000/Mt) unless there is major rationalization in terms of how irrigated rice is grown in Timor-Leste. Given the negative outcomes from this study it may be more realistic to plan on some continuation of rice importation and to only invest in incremental rice production where economic rates of return are attractive. This “debate needs to be reopened” in light of the findings from the analyses completed for this study, and should be based on a new National Food Policy and a supporting National Food Strategy.