
Impact of particle density on the classification ...
10
DOI: 10.5277/ppmp18160 Physicochem. Probl. Miner. Process., 55(2), 2019, 494-503 Physicochemical Problems of Mineral Processing http://www.journalssystem.com/ppmp ISSN 1643-1049 © Wroclaw University of Science and Technology Received April 17, 2018; reviewed; accepted August 10, 2018 Impact of particle density on the classification efficiency of the static air classifier in Vertical Spindle Mill Hong Li 1,3 , Yaqun He 2 , Jinshan Yang 3 , Xiangnan Zhu 4 , Zhen Peng 3 , Weining Xie 2 1 School of Environment & Resource, Southwest University of Science & Technology, Mianyang, Sichuan 621010, China 2 Advanced Analysis & Computation Center, China University of Mining & Technology, Xuzhou, Jiangsu 221116, China 3 School of Chemical Engineering and Technology, China University of Mining & Technology, Xuzhou, Jiangsu 221116, China 4 Chemical & Environmental Engineering College, Shandong University of Science & Technology, Qingdao, Shandong, 266590, China Corresponding author: [email protected] (Yaqun He) Abstract: In order to investigate the impact of density on the classification behavior of particles in the static classifier of Vertical Spindle Mill, the sensitivity of overflow yield to the increase of air amount for narrowly sized pyrite, carborundum, quartz and coal samples were compared in a lab-scale classifier, respectively. Response surface methodology is used to analyze the combined effect of size and density on the classification. Wide size classification was also conducted and results show that both the yield and R90 of overflow increase with the decreasing of density, and the growth of air amount would also lead them to rise. The Whiten’s model was applied to illustrate the influence of density on the sharpness of classification, corrected cut size and fishhook effect. Results show that material with a lower density would have a higher fishhook effect parameter, classification sharpness and corrected cut size. The increase of air amount would result in a more evident fishhook effect for the high density material. Based on the Whiten’s model, a new classification efficiency model with the addition of particle density in various forms was established. This new model could describe the classification efficiency of materials with different density in the identical experiment conditions. Keywords: static air classifier, classification efficiency, material density 1. Introduction In the pulverizing process of coal power plant, air classifier controls the fineness of Pulverized Fuel (PF). To ensure the qualified PF could react effectively with oxygen in the furnace, typically the coal particles need to be at least 80% finer than 90 μm, with 99.5% of particles in the size of -300 μm. As classifier is usually directly installed upon the mill table, its performance definitely would affect the grinding efficiency of mill (Xie, 2016). For the classifier system in the mill, several models for classification were developed to evaluate the performance of air classifier. Kis et al. (2005, 2006) has established discrete mathematical models for the simulation and optimizing design on the basis of distributed parameter models of continuous grinding processes. Sato et al. (1996) investigated classifier parameters empirically, and obtained functions for classification efficiency and cut size dependent on the classifier geometry. Based on data of on-line sampling, a mathematical modeling was constructed by Shi and Kojovic for the classifier, incorporating coal-specific and machine-dependent variables in the Sproull’s gas cyclone model (Shi et al., 2015; Kojovic et al., 2015). Also, Wei et al. established the parameters optimization model about classification efficiency of an industrial mill (Wei et al., 2014). On the other hand, with the help of numerical simulation, classification behavior of different size coal particle within air classifier was revealed by comparing trajectories (Bhasker, 2002; Vuthalurn et al., 2005), and the optimization of classifier was
Transcript of Impact of particle density on the classification ...

DOI: 10.5277/ppmp18160
Physicochem. Probl. Miner. Process., 55(2), 2019, 494-503 Physicochemical Problems of Mineral Processing
http://www.journalssystem.com/ppmp ISSN 1643-1049
© Wroclaw University of Science and Technology
Received April 17, 2018; reviewed; accepted August 10, 2018
Impact of particle density on the classification efficiency of the static air classifier in Vertical Spindle Mill
Hong Li 1,3, Yaqun He 2, Jinshan Yang 3, Xiangnan Zhu 4, Zhen Peng 3, Weining Xie 2
1 School of Environment & Resource, Southwest University of Science & Technology, Mianyang, Sichuan 621010, China
2 Advanced Analysis & Computation Center, China University of Mining & Technology, Xuzhou, Jiangsu 221116, China
3 School of Chemical Engineering and Technology, China University of Mining & Technology, Xuzhou, Jiangsu 221116,
China
4 Chemical & Environmental Engineering College, Shandong University of Science & Technology, Qingdao, Shandong,
266590, China
Corresponding author: [email protected] (Yaqun He)
Abstract: In order to investigate the impact of density on the classification behavior of particles in the
static classifier of Vertical Spindle Mill, the sensitivity of overflow yield to the increase of air amount for
narrowly sized pyrite, carborundum, quartz and coal samples were compared in a lab-scale classifier,
respectively. Response surface methodology is used to analyze the combined effect of size and density
on the classification. Wide size classification was also conducted and results show that both the yield
and R90 of overflow increase with the decreasing of density, and the growth of air amount would also
lead them to rise. The Whiten’s model was applied to illustrate the influence of density on the sharpness
of classification, corrected cut size and fishhook effect. Results show that material with a lower density
would have a higher fishhook effect parameter, classification sharpness and corrected cut size. The
increase of air amount would result in a more evident fishhook effect for the high density material.
Based on the Whiten’s model, a new classification efficiency model with the addition of particle density
in various forms was established. This new model could describe the classification efficiency of
materials with different density in the identical experiment conditions.
Keywords: static air classifier, classification efficiency, material density
1. Introduction
In the pulverizing process of coal power plant, air classifier controls the fineness of Pulverized Fuel (PF).
To ensure the qualified PF could react effectively with oxygen in the furnace, typically the coal particles
need to be at least 80% finer than 90 μm, with 99.5% of particles in the size of -300 μm. As classifier is
usually directly installed upon the mill table, its performance definitely would affect the grinding
efficiency of mill (Xie, 2016).
For the classifier system in the mill, several models for classification were developed to evaluate the
performance of air classifier. Kis et al. (2005, 2006) has established discrete mathematical models for the
simulation and optimizing design on the basis of distributed parameter models of continuous grinding
processes. Sato et al. (1996) investigated classifier parameters empirically, and obtained functions for
classification efficiency and cut size dependent on the classifier geometry. Based on data of on-line
sampling, a mathematical modeling was constructed by Shi and Kojovic for the classifier, incorporating
coal-specific and machine-dependent variables in the Sproull’s gas cyclone model (Shi et al., 2015;
Kojovic et al., 2015). Also, Wei et al. established the parameters optimization model about classification
efficiency of an industrial mill (Wei et al., 2014). On the other hand, with the help of numerical
simulation, classification behavior of different size coal particle within air classifier was revealed by
comparing trajectories (Bhasker, 2002; Vuthalurn et al., 2005), and the optimization of classifier was

Physicochem. Probl. Miner. Process., 55(2), 2019, 494-503 495
conducted by adjusting vane settings (Parham et al., 2003; Shah et al., 2009) and designing plate
positions (Ataş et al., 2014).
No matter mathematical modeling or numerical simulation, researches on the classification of air
classifier in the mill mentioned above all treated coal as a pure material with a certain density, so the
size-by-size efficiencies could be calculated to evaluate the performance of classifier. In fact, the quality
of coal for power generation is relatively poor considering the economic level. Coal usually associates
with other minerals, most of which have been liberated from coal after being ground to minor than 90
μm (Shi et al., 2011; Wang, 2013). As a result, classifier feed consists of particles with density ranging
from -1.3 to +1.8 g/cm3, which has been proved by research of Li et al. (2016). Thus, their calculation is
likely inaccuracy. Özer firstly noticed the necessity of considering material density while evaluating
classifier efficiency. So he conducted aerodynamic classification function which illustrated the
relationship of efficiency with settling velocities of particles when he investigated the classification
operation in a coal pulverizer (Özer et al., 2010; Özer, 2011). Altun et al. also illustrated the importance
of material density in a dynamic classifier though correlating density to the parameters, such as
corrected cut size and bypass fraction, of Whiten’s equation according to classification results of coal,
clinker, copper ore and magnetite (Altun et al., 2016).
In this paper, in order to reveal the influence of particles density on the classification behavior,
sensitivities of narrowly sized minerals with different density to the growing of air amount were
compared and response surface methodology was applied to demonstrate the combination effect of size
and density in a lab-scale static classifier. Classification results of materials in wide size were fitted by
Whiten’s model, respectively. And a new model, containing both material size and density, was
established to illustrate the difference in classification effect of multi-component particles within
classifier.
2. Materials and methods
2.1. Experimental system
Experimental tests were conducted with a laboratory classification system which is shown in Fig. 1. This
system includes devices of air supply, classification and collection. Feed rate was controlled by a screw
feeder, and the air amount could be adjusted by air valve and monitored by a flow meter. Within this
study, 300 g material was added in and the classification time was set as 5 min in each classification
experiment.
Fig. 1. Schematic diagram of the experimental system of classifier
(1. Blower; 2. Air tank; 3. Valve; 4. Flow meter; 5. Screw feeder; 6. Classifier; 7. Cyclone separator; 8. Bag dust
collector; 9. Aggregate tank)
Physicochem. Probl. Miner. Process., 55(2), 2019, 494-503 496
2.2. Experimental materials
Coal, quartz, carborundum and pyrite were selected as experimental material, with density of 1.25, 2.60,
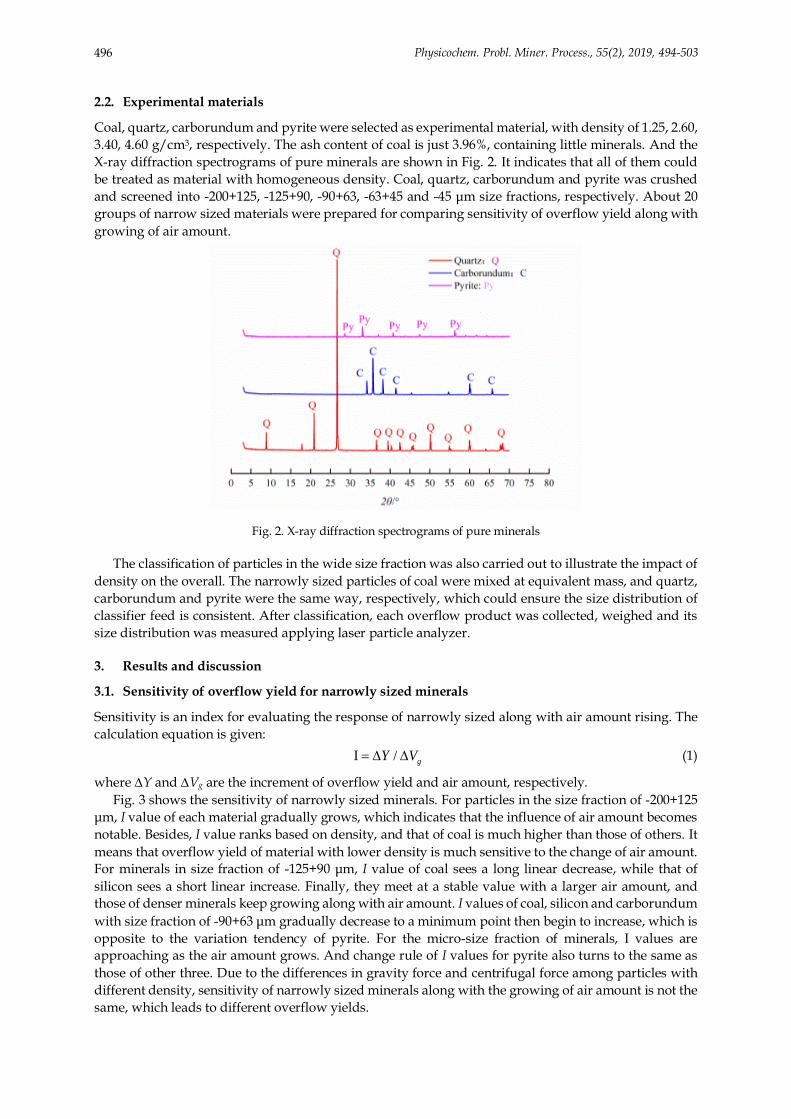
3.40, 4.60 g/cm3, respectively. The ash content of coal is just 3.96%, containing little minerals. And the
X-ray diffraction spectrograms of pure minerals are shown in Fig. 2. It indicates that all of them could
be treated as material with homogeneous density. Coal, quartz, carborundum and pyrite was crushed
and screened into -200+125, -125+90, -90+63, -63+45 and -45 μm size fractions, respectively. About 20
groups of narrow sized materials were prepared for comparing sensitivity of overflow yield along with
growing of air amount.
Fig. 2. X-ray diffraction spectrograms of pure minerals
The classification of particles in the wide size fraction was also carried out to illustrate the impact of
density on the overall. The narrowly sized particles of coal were mixed at equivalent mass, and quartz,
carborundum and pyrite were the same way, respectively, which could ensure the size distribution of
classifier feed is consistent. After classification, each overflow product was collected, weighed and its
size distribution was measured applying laser particle analyzer.
3. Results and discussion
3.1. Sensitivity of overflow yield for narrowly sized minerals
Sensitivity is an index for evaluating the response of narrowly sized along with air amount rising. The
calculation equation is given:
I / gY V
(1)
where ∆Y and ∆Vg are the increment of overflow yield and air amount, respectively.
Fig. 3 shows the sensitivity of narrowly sized minerals. For particles in the size fraction of -200+125
μm, I value of each material gradually grows, which indicates that the influence of air amount becomes
notable. Besides, I value ranks based on density, and that of coal is much higher than those of others. It
means that overflow yield of material with lower density is much sensitive to the change of air amount.
For minerals in size fraction of -125+90 μm, I value of coal sees a long linear decrease, while that of
silicon sees a short linear increase. Finally, they meet at a stable value with a larger air amount, and
those of denser minerals keep growing along with air amount. I values of coal, silicon and carborundum
with size fraction of -90+63 μm gradually decrease to a minimum point then begin to increase, which is
opposite to the variation tendency of pyrite. For the micro-size fraction of minerals, I values are
approaching as the air amount grows. And change rule of I values for pyrite also turns to the same as
those of other three. Due to the differences in gravity force and centrifugal force among particles with
different density, sensitivity of narrowly sized minerals along with the growing of air amount is not the
same, which leads to different overflow yields.

Physicochem. Probl. Miner. Process., 55(2), 2019, 494-503 497
Fig. 3. Sensitivity of overflow yield with air amount for different size minerals
Based on classification test results of narrowed size minerals, response surface methodology is
applied to emphasize analyze the combination effect of particle size and density on the overflow yield,
which is illustrated in Fig. 4.
Surface response clearly shows that the overflow yields of the coarser and denser particles are much
lower than the smaller and lighter ones at a certain air amount. That is to say, combination effect of
particle size and density has significant impact on overflow yield. Particle density definitely cannot be
ignored if the classification effect being evaluated. A quadratic model is established to simply describe
the relationship among air amount, particle size and density and overflow yield. And the variance
analysis of this quadratic model is listed in Table 1.
The F value of 78.82 indicates that the model is significant. Values of Prob>F less than 0.0500 represent
that a model term is significant. Based on this criterion, particle size, density and air amount are all
significant model terms. The quality of the obtained model is evaluated by assessing the significance of
the regression coefficients using Student’s t-test. The R2 value for the model is found to be 0.99,
representing an acceptable agreement between the experimental results and the calculated values from
the suggested model.

Physicochem. Probl. Miner. Process., 55(2), 2019, 494-503 498
(a) 90 m3/h (b) 125 m3/h
(c) 155 m3/h (d) 180 m3/h
Fig. 4. Combination effect of size and density on overflow yield
Table 1. Variance analysis of the quadratic model
Source Sum of squares Degree of
freedom Mean squares F-value Prob > F
Model 13649.35 9 1516.59 78.82 < 0.0001 significant
A-size 974.38 1 974.38 50.64 0.0002
B-density 1371.49 1 1371.49 71.28 < 0.0001
C-air amount 2802.72 1 2802.72 145.67 < 0.0001
AB 73.34 1 73.34 3.81 0.0919
AC 1195.63 1 1195.63 62.14 0.0001
BC 716.04 1 716.04 37.22 0.0005
A2 186.34 1 186.34 9.68 0.0170
B2 434.28 1 434.28 22.57 0.0021
C2 351.87 1 351.87 18.29 0.0037
Residual 134.68 7 19.24
Lack of Fit 134.68 4 33.67
Pure Error 0.00 3 0
Cor Total 13784.03 16
3.2. Comparison of overflow product for wide size classification
The yield and fineness of overflow for classification with wide size fraction is compared in Fig. 5. When
air amount is at 125 m3/h, coal (low density) achieves the highest overflow yield, reaching to 42%, which

Physicochem. Probl. Miner. Process., 55(2), 2019, 494-503 499
is about 25% higher than that of pyrite (high density). However, the fineness of the overflow product
obtained from the high density material is significantly smaller than that of the low density. More
specifically, the R90 of pyrite is less than 10%, while R90 of silicon, quartz and coal are 20.81%, 25.66%
and 28.36%, respectively. The large differences in yield and fineness among the overflow products fully
prove that density of classified material has an evident impact on the overall classification effect.
As air amount increases to 155 m3/h, both the yield and fineness of coal, quartz, carborundum and
pyrite all present an increasing trend, the highest variation occurs to coal. The overflow yield of coal
grows by almost 20%, and its R90 increases by almost 8%. As a result,for the same material, with the
air amount rising, the overflow yield increases, but the fineness becomes coarser.
Fig. 5 Comparison of overflow yield and fineness for classification
3.3. Classification efficiency
The classification efficiency of each material is calculated by the following equation:
( )100
( )
o i ooai
f i f
W d ME
W d M
(2)
where Eoai is the actual classification efficiency to overflow, Wo(di) and Wf(di) are the mass fraction of the
material with particle size di in the overflow and feed, respectively. Mo and Mf are the mass of overflow
and feed, respectively. The classification efficiency curves for the four pure materials with wide size
fraction are shown in the Fig. 6.
Fig. 6. Actual classification efficiency curves
As shown in Fig. 6, size-by-size classification efficiency has significant differences as densities are
different, decreases gradually from the lightest to the heaviest material. The shape of all the
classification efficiency curves is similar. As the particle size grows, the classification efficiency increases
firstly and then decreases. The maximum classification efficiency of coal reaches to 54.74% which is
about 10% higher than that of quartz, and those of carborundum and pyrite are 40.50% and 29.84%,
respectively. The classification efficiencies of high density materials, such as carborundum and pyrite,
Physicochem. Probl. Miner. Process., 55(2), 2019, 494-503 500
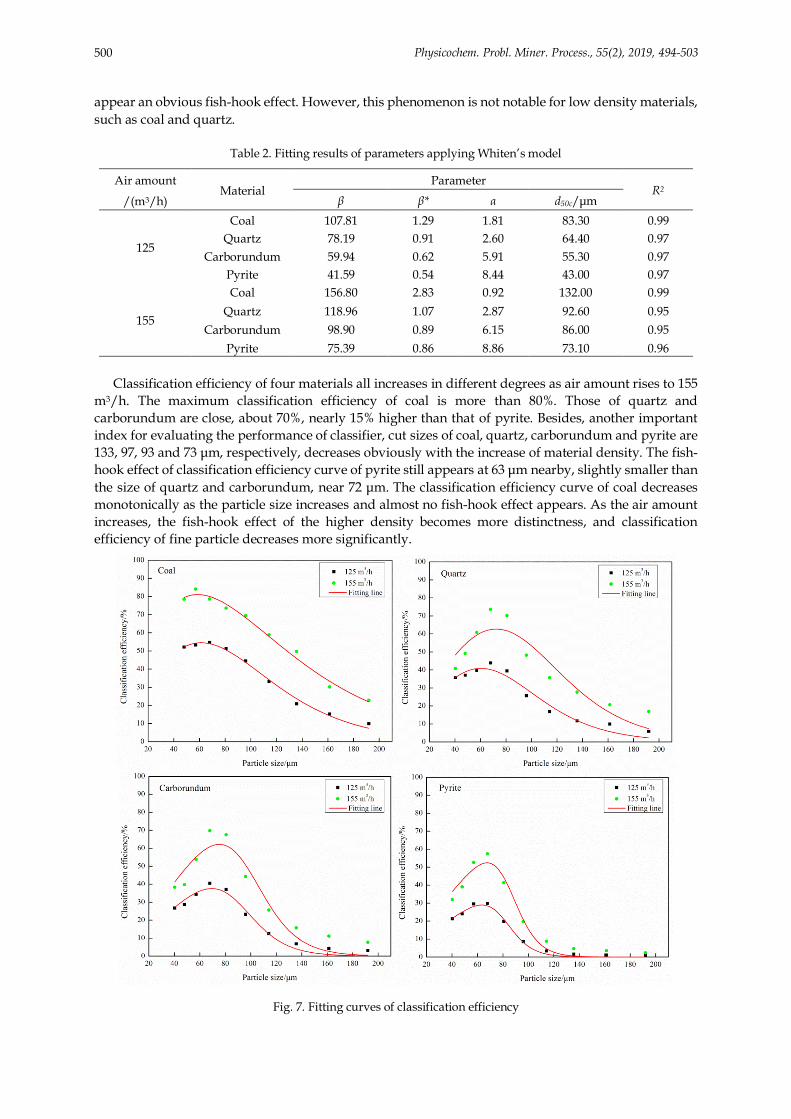
appear an obvious fish-hook effect. However, this phenomenon is not notable for low density materials,
such as coal and quartz.
Table 2. Fitting results of parameters applying Whiten’s model
Air amount Material
Parameter R2
/(m3/h) β β* α d50c/μm
125
Coal 107.81 1.29 1.81 83.30 0.99
Quartz 78.19 0.91 2.60 64.40 0.97
Carborundum 59.94 0.62 5.91 55.30 0.97
Pyrite 41.59 0.54 8.44 43.00 0.97
155
Coal 156.80 2.83 0.92 132.00 0.99
Quartz 118.96 1.07 2.87 92.60 0.95
Carborundum 98.90 0.89 6.15 86.00 0.95
Pyrite 75.39 0.86 8.86 73.10 0.96
Classification efficiency of four materials all increases in different degrees as air amount rises to 155
m3/h. The maximum classification efficiency of coal is more than 80%. Those of quartz and
carborundum are close, about 70%, nearly 15% higher than that of pyrite. Besides, another important
index for evaluating the performance of classifier, cut sizes of coal, quartz, carborundum and pyrite are
133, 97, 93 and 73 μm, respectively, decreases obviously with the increase of material density. The fish-
hook effect of classification efficiency curve of pyrite still appears at 63 μm nearby, slightly smaller than
the size of quartz and carborundum, near 72 μm. The classification efficiency curve of coal decreases
monotonically as the particle size increases and almost no fish-hook effect appears. As the air amount
increases, the fish-hook effect of the higher density becomes more distinctness, and classification
efficiency of fine particle decreases more significantly.
Fig. 7. Fitting curves of classification efficiency

Physicochem. Probl. Miner. Process., 55(2), 2019, 494-503 501
The Whiten’s model is applied to fit the classification efficiency curves of each material and results
are shown in Table 2.
50 50
* *
21 3
[(1 )(exp( ) 1)] / [exp( ) exp( ) 2]/ /i ic coaiE d d d d (3)
where α is the sharpness of separation, d50c is the corrected cut size, β is the parameter that controls the
initial decrease of the curve in fine sizes (fish-hook effect), β* is the parameter that preserves the
definition of d50c, When d=d50c, E=1/2C.
3.4. Modification of classification efficiency model
The classical Whiten’s model can describe the classification efficiency of particles with homogeneous
density. And the above results show that the classification efficiency of particles is the result of both
particle size and density. In order to improve the prediction reliability of the classification efficiency
model, the density parameter should be introduced in the model.
In the Whiten’s model, the first term controls the stage of fishhook effect, where size has positive
correlation with the classification efficiency. The second term is only related to the sharpness of
separation. And the third term is mainly related to the whole stage except fishhook effect, where size
has negative correlation with the classification efficiency. While for particles with all fractions,
classification efficiency decreases as density increases. Thus, density parameter with various forms is
introduced in the Whiten’s model, and presented as followed:
1 2(1+ / )[exp( ' ) -1] / [exp( ) exp( ' ) - 2]oai i iE d d (4)
where ρ is the density of material to be separated, λ1 and λ2 are parameters, λ1=ββ*/d50c, λ2=αβ*/d50c, and
α’ is sharpness of separation.
The improved classification efficiency model is used to describe the test results. The fitting results
are shown in Table 3.
Thus, classification efficiency models at 125 m3/h and 155 m3/h air amounts are:
125 m3/h air amount:
(1+1.92 / )[exp(2.14 ) -1]/[exp(0.025 ) exp(2.14 ) -2]oai i iE d d (5)
155 m3/h air amount:
(1+2.76 / )[exp(2.01 )-1]/[exp(0.021 ) exp(2.01 )-2]oai i iE d d (6)
The correlation coefficients of fitting results are 0.96 and 0.89, respectively, which indicates that the
improved classification efficiency model with introducing the material density parameter, can explain
the combined influence of particle size and density on the classification efficiency. The new Whiten’s
model improves the adaptability of the primary one and could obviously reveal the difference in
classification efficiency of multi-component particles within classifier.
For further verification the accuracy of model, the density of coal, quartz, carborundum and pyrite
are put into formula and the classification efficiency curves of each pure mineral can be calculated and
compared with the experimental data. The fitting results are listed in Table 4 and illustrated in Fig.8.
Table 3. Fitting results of parameters applying improved model
Air amount parameters R2
/(m3/h) α’ λ1 λ2
125 2.14 1.92 0.025 0.96
155 2.01 2.76 0.021 0.89
As can be seen from Table 5 and Fig. 8, the fitted curve matches well with the corresponding
classification test data, and the classification efficiency of different density minerals can be described
more accurately. But the applicability of this new model still needs to be discussed in more detail and
further verified.

Physicochem. Probl. Miner. Process., 55(2), 2019, 494-503 502
Table 4. The goodness of fit between calculation and experimental result of classification efficiency
Air amount Materials
Density Parameters R2
/(m3/h) /(g/cm3) α’ λ1 λ2
125
Coal 1.25
2.14 1.92 0.025
0.95
Quartz 2.60 0.96
Carborundum 3.20 0.99
Pyrite 4.60 0.97
155
Coal 1.25
2.01 2.76 0.021
0.88
Quartz 2.60 0.86
Carborundum 3.20 0.90
Pyrite 4.60 0.92
Fig. 8. Fitting curves of classification efficiency applying improved model
4. Conclusions
The study mainly focuses to compare the classification efficiency of particles with different density
within a lab-scale static classifier. From the analysis of surface response methodology to the narrowed
size experiments, it can be concluded that particle density is another significant influence factor of
overflow yield, besides particle size and air amount. Wide size classifications of coal, quartz,
carborundum and pyrite indicate that change of material density would change the cut size, sharpness
of classification and fishhook parameter, which results in various classification curves. An improved
classification efficiency model with introducing the material density parameter into the Whiten’s model
is established:
1 2(1+ / )[exp( ' ) -1] / [exp( ) exp( ' ) - 2]oai i iE d d (7)
Besides, verifications are conducted on the classification results at 125 and 155 m3/h air amounts,
respectively, which proved that improved model can explain the combined effect of particle size and
density on the classification efficiency.
Acknowledgments
The work is supported by the National Natural Science Foundation of China (No.51274196, 51574234).
References
ALTUN, O., TOPRAK, A., BENZER, H., Darilmaz, O., 2016. Multi component modeling of an air classifier. Miner. Eng.
93, 50-56.
ATAŞ, S., TEKIR, U., PAKSOY, M.A., ÇELIK, A., ÇAM, M., SEVGEL, T., 2014. Numerical and experimental analysis of
pulverized coal mill classifier performance in the Soma B Power Plant. Fuel Process. Technol. 126, 441-452.
BHASKER C., 2002. Numerical simulation of turbulent flow in complex geometries used in power plants. Adv. in Eng.
Software. 33, 71-83.

Physicochem. Probl. Miner. Process., 55(2), 2019, 494-503 503
KIS, P.B., MIHÁLYKÓ, C., LAKATOS, B.G., 2005. Optimising design of continuous grinding mill-classifier systems, Che.
Eng. Process. 44, 273-277.
KIS, P.B., MIHÁLYKÓ, C., LAKATOS, B.G., 2006. Discrete model for analysis and design of grinding mill-classifier
systems. Che. Eng. Process. 45, 340-349.
KOJOVIC, T., SHI, F.N., BRENNAN, M., 2015. Modelling of vertical spindle mills. Part 2: Integrated models for E-mill,
MPS and CKP mills. Fuel. 143, 602-611.
LI, H., HE, Y.Q., SHI, F.N., ZUO, W.R., ZHOU, N.X., WEI, H., WANG, S., XIE, W.N., 2016. Performance of the static
air classifier in a vertical spindle mill. Fuel. 177, 8-14.
ÖZER, C.E., WHITEN, W.J., SHI, F., DIXON, T., 2010. Investigation of the classification operation in a coal pulverising
vertical spindle pulveriser. Brisbane: XXV International Mineral Processing Congress. 1065–1076.
ÖZER, C.E., 2011. A New Multi-Component Model for the Vertical Spindle Mill. PhD Thesis. University of Queensland
(JKMRC), Australia.
PARHAM, J.J., EASSON, W.J., 2003. Flow visualisation and velocity measurements in a vertical spindle coal mill static
classifier. Fuel. 82, 2115-2123.
SATO, K., MEGURI, N., SHOJI, K., KANEMOTO, H., HASEGAWA, T., MARUYAMA, T., 1996. Breakage of coals in
ring-roller mills Part I. The breakage properties of various coals and simulation model to predict steady-state mill
performance. Powder Technol. 86, 275-283.
SHAH, K.V., VUTHALURU, R., VUTHALURU, H.B., 2009. CFD based investigations into optimization of coal pulveriser
performance: Effect of classifier vane settings. Fuel Process. Technol. 90(9): 1135-1141.
SHI, F.N., HE, Y.Q., 2011, April. Efficiency improvements in coal fired utilities, Asia-Pacific Partnership on Clean
Development and Climate.
SHI, F.N., KOJOVIC, T., BRENNAN, M., 2015. Modelling of vertical spindle mills. Part 1: Sub-models for comminution
and classification. Fuel. 143, 595-601.
VUTHALURU, H.B., PAREEK, V.K., VUTHALURU, R., 2005. Multiphase flow simulation of a simplified coal pulveriser.
Fuel Process. Technol. 86(11), 1195-1205.
WANG, S., 2013. Particle separation behavior of recirculating load of power station pulverizer in the dilute phase vibrated
gas-solid fluidized bed. PhD Thesis. Xuzhou: China University of Mining and Technology.
WEI, H., HE, Y.Q., SHI, F.N., ZHOU, N.X., WANG, S., GE, L.H., 2014. Breakage and separation mechanism of ZGM coal
mill based on parameters optimization model. Inter. J. Min. Sci. Technol. 24(2), 285-289.
XIE, W.N., 2016. Fundamental research on grinding kinetics of vertical spindle pulverizer in coal power plants based on
energy characterized parameters. PhD Thesis. Xuzhou: China University of Mining and Technology.