Sonolytic Removal of Sugar Colour in the Presence of ...data.conferenceworld.in/bit.gkp/37.pdfsize...
15
266 | Page Sonolytic Removal of Sugar Colour in the Presence of Activated Charcoal Sudhir Kumar Verma 1 *, Devendra Kumar Verma 2 and Sachin Saxena 3 1,3 Department of Chemistry, Dayalbagh Educational Institute, Agra-282005, (India) 2 Department of Chemistry, Sri Venkateswara College, University of Delhi, Delhi, (India) ABSTRACT Adsorption of sugar colour from the aqueous solution has been carried out on the surface of activated charcoal in the presence and absence of ultrasound. The characterisation has been done through X-ray diffraction (XRD), scanning electron microscopy (SEM) and FTIR spectroscopy. The percentage removal of sugar colour in the adsorbent load of 0.5 to 3.0 gm was 42.7 to 92.8 % in the absence of ultrasound (US) and 50.4 to 97.8 % in the presence of US. The effects of initial concentration of sugar, adsorbent dose and contact time on the decolourization of sugar colour have been examined under different experimental conditions. Mechanism of adsorption has been explained with the help of cavitation phenomena occurring in the process. Applied sonochemical method was found to be more effective in comparison to the conventional methods for sugar refining processes. Keywords – Activated Charcoal, Adsorption, Decolourization, IU, Ultrasound. 1. INTRODUCTION The most important parameter for evaluation of sugar quality is the colour of sugar. The adsorption phenomenon has acquired many applications in technological and biological fields since its discovery. The physical chemistry of removal of colorants or even colloids involves an adsorption mechanism. Adsorption techniques employing solid sorbents are widely used to remove certain classes of colours found in sugar. However, amongst all the sorbent materials proposed, activated charcoal (AC) is the most popular for the removal of colour from aqueous sugar solution. The adsorption capacity of AC is mainly due to their structural characteristics and their porous texture which gives them a large surface area, and their chemical nature which can be easily modified by chemical treatment in order to increase their properties [1]. The efficiency of any adsorbent material to adsorb the desired compounds (colour, ash, colloids) depends on several factors, such as porosity, surface area, pore size distribution, bulk density, surface chemistry, hardness, pH, particle density, particle size, amount of water soluble minerals and its total ash content [2-7]. In the case of sugar decolourization; the decolourizing material should possess a pore size distribution favourable for adsorption of a mixture of poly dispersed constituents from highly concentrated sugar solutions. The activated charcoal has wide industrial applications. Among these are:
Transcript of Sonolytic Removal of Sugar Colour in the Presence of ...data.conferenceworld.in/bit.gkp/37.pdfsize...

266 | P a g e
Sonolytic Removal of Sugar Colour in the Presence of
Activated Charcoal
Sudhir Kumar Verma1*, Devendra Kumar Verma
2 and Sachin Saxena
3
1,3Department of Chemistry, Dayalbagh Educational Institute, Agra-282005, (India)
2Department of Chemistry, Sri Venkateswara College, University of Delhi, Delhi, (India)
ABSTRACT
Adsorption of sugar colour from the aqueous solution has been carried out on the surface of activated charcoal
in the presence and absence of ultrasound. The characterisation has been done through X-ray diffraction
(XRD), scanning electron microscopy (SEM) and FTIR spectroscopy. The percentage removal of sugar colour
in the adsorbent load of 0.5 to 3.0 gm was 42.7 to 92.8 % in the absence of ultrasound (US) and 50.4 to 97.8 %
in the presence of US. The effects of initial concentration of sugar, adsorbent dose and contact time on the
decolourization of sugar colour have been examined under different experimental conditions. Mechanism of
adsorption has been explained with the help of cavitation phenomena occurring in the process. Applied
sonochemical method was found to be more effective in comparison to the conventional methods for sugar
refining processes.
Keywords – Activated Charcoal, Adsorption, Decolourization, IU, Ultrasound.
1. INTRODUCTION
The most important parameter for evaluation of sugar quality is the colour of sugar. The adsorption phenomenon
has acquired many applications in technological and biological fields since its discovery. The physical chemistry
of removal of colorants or even colloids involves an adsorption mechanism. Adsorption techniques employing
solid sorbents are widely used to remove certain classes of colours found in sugar. However, amongst all the
sorbent materials proposed, activated charcoal (AC) is the most popular for the removal of colour from aqueous
sugar solution. The adsorption capacity of AC is mainly due to their structural characteristics and their porous
texture which gives them a large surface area, and their chemical nature which can be easily modified by
chemical treatment in order to increase their properties [1]. The efficiency of any adsorbent material to adsorb
the desired compounds (colour, ash, colloids) depends on several factors, such as porosity, surface area, pore
size distribution, bulk density, surface chemistry, hardness, pH, particle density, particle size, amount of water
soluble minerals and its total ash content [2-7]. In the case of sugar decolourization; the decolourizing material
should possess a pore size distribution favourable for adsorption of a mixture of poly dispersed constituents
from highly concentrated sugar solutions. The activated charcoal has wide industrial applications. Among these
are:

267 | P a g e
1. To remove of small concentration of products, this may have no colour, taste, or odour, but which cause poor
crystal yield or poor crystal habit.
2. To remove of trace quantities of impurities having no original colour, but subject to oxidation or other
changes this may develop colour at a later stage of processing.
3. To remove of impurities causing haze or turbidity, including those which do not precipitate out until after the
product is sold.
4. To remove of trace quantities of water from water-immiscible organic solvents, or vice versa.
5. To remove the impurities from a liquid by extracting them with a trace quantity of immiscible solvent, and
then adsorbing the resulting solution of solvent and impurities on carbon. This is useful where direct adsorption
is unsuccessful [8-9]
6. To remove of trace quantities of ionic metals, by complexing with an adsorbable organic reagent and
adsorbing the complex [10]
Ultrasonic is an effective purification and separation technique used in industry especially in wastewater
treatment. Ultrasonic generates high-energy which causes the cavitation phenomenon which is the rapid and
repeated formation and resulting implosion of micro bubbles in a liquid resulting in the propagation of
microscopic shock waves. Microscopic vapor bubbles are created at site of rarefaction as the liquid fractures or
tears because of the negative pressure of the sound wave in the liquid. Finally the compression part, which
follows the rarefied part, collapses the bubble. The cavitational collapse of bubble generates localized hot spots
of temperature as high as 5000K and pressure of as high as 1000 atmospheres for a life time of a few
microseconds thus creating high energy movements of the solvent that results in localized high energy shear
forces as shown in following Fig. 1 [11-12]. The number of cavitation bubbles collapsing per second may well
be in the millions hence their cumulative effect can be significant. Shock waves from cavitation in liquid-solid
slurries produce high velocity inter particle collisions, the impact of which is sufficient to convert the solid
molecule into semi solid molecule. Thus the ultrasonic energy may be effective to remove the sorbed
contaminants, like heavy metals, from fine grained soils.
Figure 1: Cavitation and implosion phenomena in ultrasonic [12].
Cavitation bubble growth
in negative pressure Maximum
bubble size
Bubbles collapse
in compression
Cycle repeats
New bubble growth
268 | P a g e
According to Fuchs 2002, in elastic media such as air and most solids, there is a continuous transition as a sound
wave is transmitted [13]. In non-elastic media such as water and most liquids, there is continuous transition as
long as the amplitude or "loudness" of the sound is relatively low. As amplitude is increased, however, the
magnitude of the negative pressure in the areas of rarefaction eventually becomes sufficient to cause the
liquid to fracture because of the negative pressure, causing a phenomenon known as cavitation. As the wave
fronts pass, the cavitation bubbles oscillate under the influence of positive pressure, eventually growing to
an unstable size. Finally, the violent collapse of the cavitation bubbles results in implosions, which cause
shock waves to be radiated from the sites of the collapse. The collapse and implosion of myriad cavitation
"bubbles" throughout an ultrasonically activated liquid result in the effect commonly associated with ultrasonic.
1.1 Advantages of using sonochemical method over other methods
There are immense advantages of using sonochemical method over other methods, as under:
1. Sonochemical method is a faster method, therefore more productive in terms of time and energy consumption
[14-15].
2. Products synthesized by the sonochemical methods have thicker walls than the conventional methods, hence
greater stability [16-17].
3. The control of particle size is easier in sonochemical process, which is otherwise not possible by any other
technique [18-19].
4. Preparation of amorphous products is possible, therefore, enhanced characteristics such as adsorption,
catalytic activity etc. may be expected [20-21].
According to Farid Chemat 2011 [22] the US technology has a significant effect on the rate of various processes
in the food industry. Using ultrasound, full reproducible food processes can now be completed in seconds or
minutes with high reproducibility, reducing the processing cost, simplifying manipulation and work-up, giving
higher purity of the final product, eliminating post-treatment of waste water and consuming only a fraction of
the time and energy normally needed for conventional processes. Several processes such as freezing, cutting,
drying, tempering, bleaching, sterilization, and extraction have been applied efficiently in the food industry. The
advantages of using ultrasound for food processing, includes: more effective mixing and micro-mixing, faster
energy and mass transfer, reduced thermal and concentration gradients, reduced temperature, selective
extraction, reduced equipment size, faster response to process extraction control, faster start-up, increased
production, and elimination of process steps. Food processes performed under the action of ultrasound are
believed to be affected in part by cavitation phenomena and mass transfer enhancement [23-25]. TABLE 1
shows the applications of ultrasound in food processing:-
Table 1. Applications of Ultrasound in Food Processing
Applications Conventional
methods
Ultrasound principle Advantages Products
Cooking Stove Uniform heat transfer Less time, Improving Meat

269 | P a g e
Fryer
Water bath
heat transfer and
organoleptic quality
Vegetables
Freezing/
crystallization
Freezer
Freezing by
immersion, by
Contact.
Uniform heat transfer
Less time, Small
crystals, Improving
diffusion and
Rapid temperature
decreasing
Meat
Vegetables
Fruits
Milk and
products
Drying
Atomisation,
Hot gas stream,
Freezing and
Pulverisation
Uniform heat transfer Less time, Improving
organoleptic quality
and Improving heat
transfer
Dehydrated
products
(fruits,
vegetables)
According to Suslick (1999) [26] the application of ultrasound in the synthesis of nanostructured materials,
including both direct sonochemical reaction and ultrasonic spray pyrolysis method have great advantage.
Ultrasonic irradiation provides unique energy is released to heat the contents of the bubble. These transient,
localized hot spots with extremely high temperatures and pressures are primarily responsible for chemical
effects of ultrasound. The usefulness of sonochemical synthesis as a synthetic tool resides in its versatility. With
a simple modification in reaction conditions, various forms of nanostructured materials can be synthesized,
including metals, alloys, oxides, sulfides, carbides, and nanos- tructured supported catalysts [27-29]. The
sonochemical method has been even further extended to the polyymers, and biomaterials. Sonochemical
decomposition of volatile organic precursors combined with significantly enhanced mass transport of materials
via shock waves has been utilized in the synthesis of nanocomposites.
Aijun Hu (2006) reported [30] application of ultrasound on scale control in the Chinese sugar industry.
According to him ultrasonic technique and equipment, the HTC and evaporation intensity of evaporators can be
improved greatly, and the viscosity of the sugar solution decreases with ultrasound. The investigation results of
evaporators indicated the HTC and evapo- ration intensity were improved by 42.4% and 15.2% respectively.
The efficiency of removing scale ranged from 65% to 98%, and the average was 76.4% under ultrasonic
treatment. With the treatment of ultrasound, the time of cleaning an evaporator was reduced to 38–75% of that
without ultrasound. Singh (2013) described [31] the following important of the power ultrasound (PUS) in sugar
industries:-
(a) Viscosity of massecuite and final molasses was reduced by 40-50 %.
(b) The physical characteristic of the scale was found to chance and favours the formation of vaterite which is
thermodynamically least stable polymorphs of scale (calcium carbonate).
(c) Sodium hydroxide usages and disposal costs were reduced 65%.
(d) Hydrochloric acid usages and disposal were reduced 60%.

270 | P a g e
(e) Time to clean up the evaporators and labour cost is reduced significantly.
(f) Powder consumption was reduced.
II. MATERIALS AND METHODS
The Activated Charcoal (reference carbon) was purchased from Sigma Chemicals. The brown colour sugar was
collected from local sugar mill.
2.1 Fourier transforms infrared (FT-IR) spectroscopy
The AC (2 mg) was mixed with 200 mg of KBr and then pelleted. FT-IR spectra of the pellets were recorded
using a Cary 630 FT-IR spectrophotometer.
2.2 Scanning electron microscopy (SEM)
The particle morphologies of the AC were studied using scanning electron microscope [SNE 3200 M (S.
Korea)]. Samples were mounted on aluminum stab with the help of double-sided tape. Mounted stabs were
coated with gold palladium prior to analysis using a Polaron sputter coater.
2.3 XRD (X- Ray Diffraction): XRD was done using Bruker AXS D8 advance (Germany).
2.4 Physical and chemical characteristics of activated charcoal (AC)
The physico-chemical properties such as apparent density, hardness, pH and mineral content of the Activated
Charcoal were examined.
2.5 Methodology used for sugar solution colour measurement
The industry standard sugar solution colour measurement is the International Commission for Uniform Methods
of Sugar Analysis (ICUMSA) colour method [32]. The absorbance of the test solutions were recorded using UV
double beam spectrophotometer. The colours of the samples were determined using the ICUMSA protocol.
ICUMSA colour is an indication of the overall colour of the sugar solution.
The colour is calculated as follows:
III. RESULTS AND DISCUSSION
3.1. Characterization of the materials
3.1.1. FT-IR Spectroscopy
Interaction of the adsorbent material with decolourization is explained through FTIR spectrum so obtained. Fig.
2 shows the FTIR spectra of blank AC, after sugar decolourization process in the absence of ultrasound and in
the presence of ultrasound (US). Peaks around 1630 cm-1
correspond to C=O group. After sugar decolourization
adsorption, it is observed that there is an increase in the transmittance and also more peaks are introduced into
the spectrum. The bands in the range of 3650 - 4000 cm-1
have also been attributed to the hydrogen-bonded -OH
group of alcohols and phenols (sugar colourant) [33-34]

271 | P a g e
1000 1500 2000 2500 3000 3500 4000 4500
20
30
40
50
60
70
80
90%
Tra
nsm
ittan
ce
Wavenumber(cm-1)
Charcoal
Charcoal + Brown Sugar
Charcoal + Brown Sugar + UV
Figure 2: FTIR spectra of blank AC, after sugar decolourization in the absence of ultrasound and in the presence
of ultrasound.
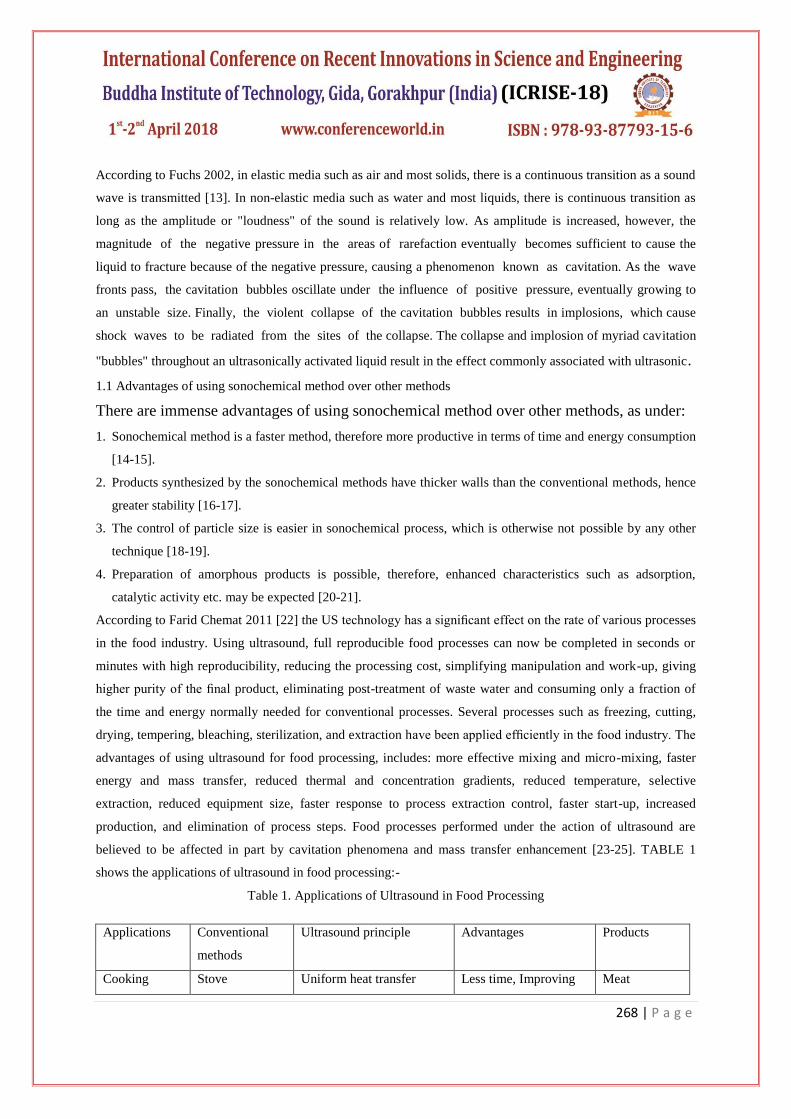
3.1.2 SEM Characterization
SEM images of AC before and after decolourization process in the absence of ultrasound and in the presence of
ultrasound is shown in Fig. 3-5. The results show that there is uneven surface morphology with significant pores
and fibrous structure. After adsorption, the pores get filled up as can be seen from the figure below.
Figure 3: SEM pictures of AC before adsorption at different magnification.
Figure 4: SEM pictures of AC after adsorption at different magnification without US.
272 | P a g e
Figure 5: SEM pictures of AC after adsorption at different magnification with US.
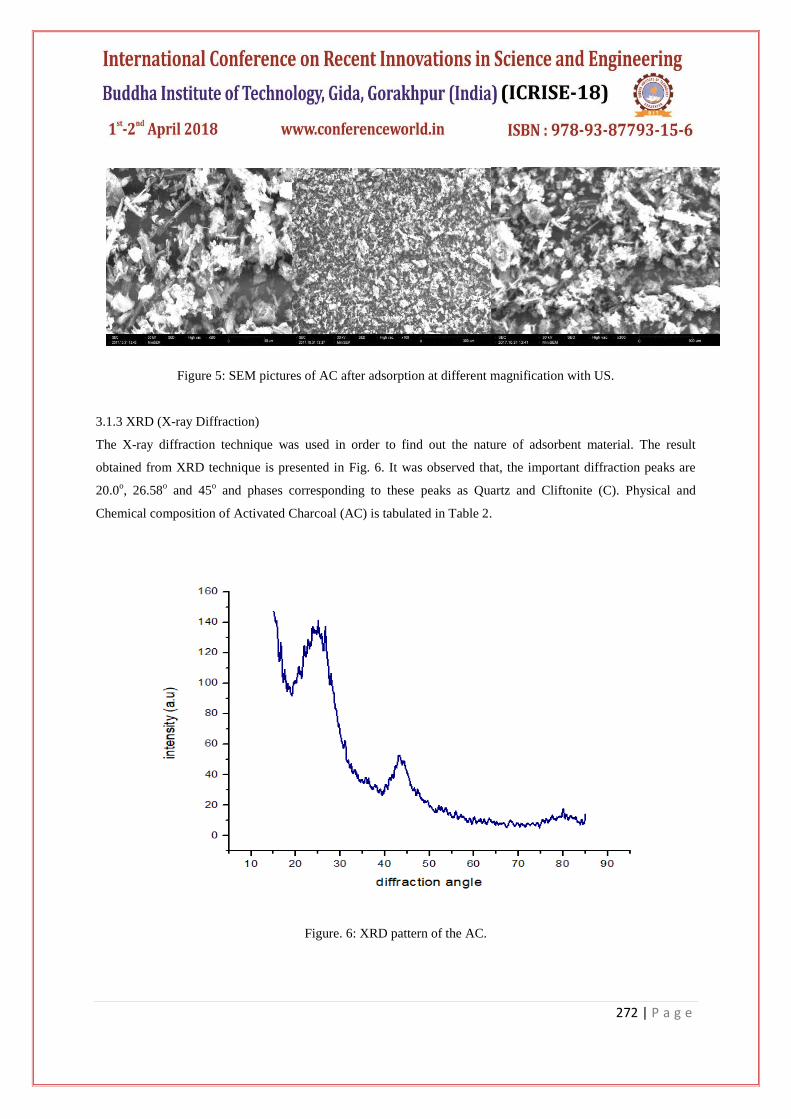
3.1.3 XRD (X-ray Diffraction)
The X-ray diffraction technique was used in order to find out the nature of adsorbent material. The result
obtained from XRD technique is presented in Fig. 6. It was observed that, the important diffraction peaks are
20.0o, 26.58
o and 45
o and phases corresponding to these peaks as Quartz and Cliftonite (C). Physical and
Chemical composition of Activated Charcoal (AC) is tabulated in Table 2.
Figure. 6: XRD pattern of the AC.

273 | P a g e
Table 2. Physical and Chemical Properties of Activated Charcoal (AC) [35]
Parameter Technique Used Measured Value
Carban Content Carbon Analyzer 93.60%
pH pH Meter 7.2 ± 0.04
Conductivity Conductivity Meter 26 ± 2.5
Bulk Density Powder Density Meter 0.25 g/ml
Specific Surface Area N2 Gas Adsorption 1043 m2/g
Porosity Hg Intrusion 61.20%
Average Particle Size Sub-Sieve Sizer 4µ
Percent Iodine Removed (PIR) Titration Method (Hassler, 1963) 97 ± 2.0/0.5g
Percent Molasses Colour Removed
(PMCR)
Titration Method (Hassler, 1963) 95 ± 2.0/0.5g
Ash Content (% dry weight) Residue Weight 4.25 ± 0.1
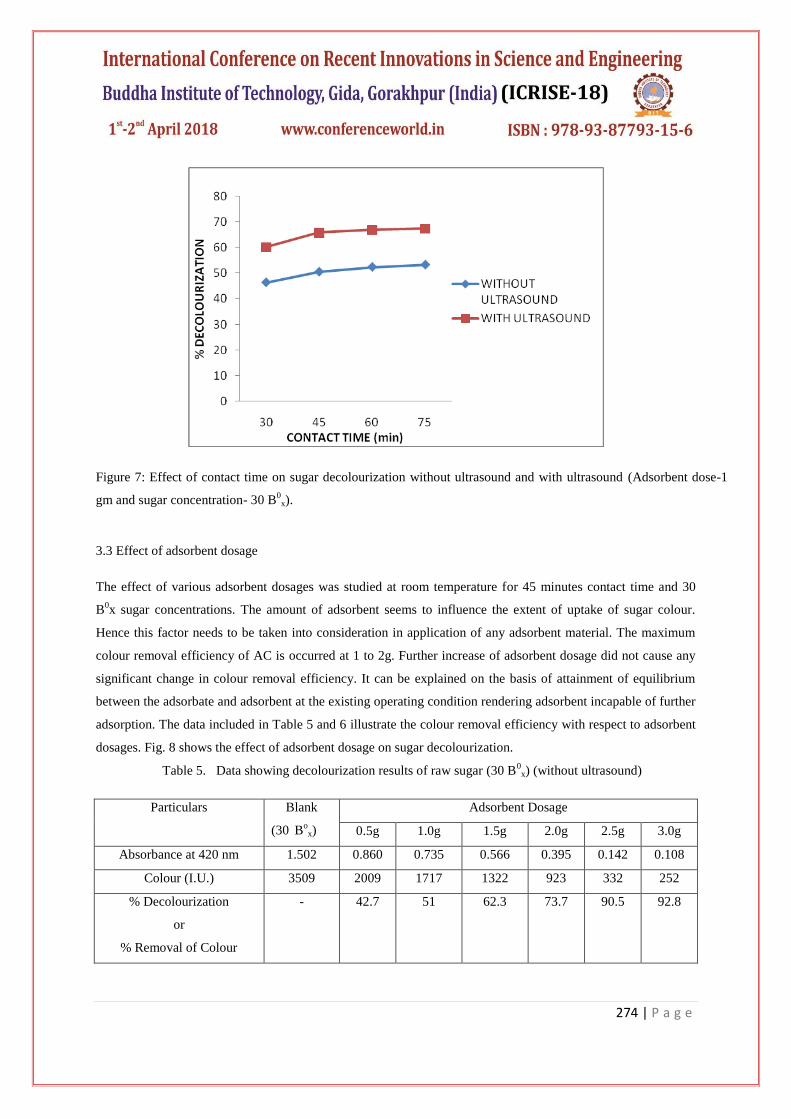
3.2 Effect of contact time
The decolourization results using aqueous sugar solution of varying contact time 30, 45, 60 and 75 minutes are
described in Table 3 (without ultrasound) and in Table 4 (with ultrasound) respectively. Fig. 7 shows the effect
of contact time on sugar decolourization without ultrasound and with ultrasound. Maximum efficiency of the
colour removal is found at 45 minutes.
Table 3. Data showing decolourization results of raw sugar (30 B0x) (without US)
Particulars Blank
(30 B
ox)
Contact Time
30 Min. 45 Min. 60 Min. 75 Min.
Absorbance at 420 nm 1.512 0.810 0.747 0.718 0.705
Colour (I.U.) 3532 1892 1745 1677 1647
% Decolourization
or
% Removal of Colour
- 46.4 50.6 52.5 53.4
Table 4. Data showing decolourization results of raw sugar (30 B0x) (with US)
Particulars Blank
(30 B
ox)
Contact Time
30 Min. 45 Min. 60 Min. 75 Min.
Absorbance at 420 nm 1.512 0.602 0.517 0.499 0.493
Colour (I.U.) 3532 1406 1208 1166 1152
% Decolourization
or
% Removal of Colour
- 60.2 65.8 67 67.4
274 | P a g e
Figure 7: Effect of contact time on sugar decolourization without ultrasound and with ultrasound (Adsorbent dose-1
gm and sugar concentration- 30 B0
x).
3.3 Effect of adsorbent dosage
The effect of various adsorbent dosages was studied at room temperature for 45 minutes contact time and 30
B0x sugar concentrations. The amount of adsorbent seems to influence the extent of uptake of sugar colour.
Hence this factor needs to be taken into consideration in application of any adsorbent material. The maximum
colour removal efficiency of AC is occurred at 1 to 2g. Further increase of adsorbent dosage did not cause any
significant change in colour removal efficiency. It can be explained on the basis of attainment of equilibrium
between the adsorbate and adsorbent at the existing operating condition rendering adsorbent incapable of further
adsorption. The data included in Table 5 and 6 illustrate the colour removal efficiency with respect to adsorbent
dosages. Fig. 8 shows the effect of adsorbent dosage on sugar decolourization.
Table 5. Data showing decolourization results of raw sugar (30 B0x) (without ultrasound)
Particulars Blank
(30 B
ox)
Adsorbent Dosage
0.5g 1.0g 1.5g 2.0g 2.5g 3.0g
Absorbance at 420 nm 1.502 0.860 0.735 0.566 0.395 0.142 0.108
Colour (I.U.) 3509 2009 1717 1322 923 332 252
% Decolourization
or
% Removal of Colour
- 42.7 51 62.3 73.7 90.5 92.8

275 | P a g e
Table 6. Data showing decolourization results of raw sugar (300Bx) (with ultrasound)
Figure 8: Effect of adsorbent dosage on sugar decolourization without ultrasound and with ultrasound.
3.4 Effect of sugar concentration
The effect of various sugar concentrations was studied at room temperature for 45 minutes contact time and one
gram adsorbent dose. The maximum colour removal efficiency of AC is occurred at 25 Box. Further increase of
sugar concentration at constant adsorbent dose did not cause more significant change in colour removal
efficiency. The data included in Table 7 and 8 illustrate the colour removal efficiency with respect to sugar
concentration in the absence and in presence of ultrasound. Fig. 9 shows the effect of sugar concentration on
sugar decolourization.
Table 7. Data Showing Effect of Sugar Concentration on Decolourization of Raw Sugar (without ultrasound)
Particulars Sugar Concentration (30 B
ox)
25 30 35
Absorbance of Blank at 420 1.250 1.510 1.758
Particulars Blank
(30 B
ox)
Adsorbent Dosage
0.5g 1.0g 1.5g 2.0g 2.5g 3.0g
Absorbance at 420 nm 1.502 0.744 0.521 0.390 0.214 0.108 0.033
Colour (I.U.) 3509 1738 1217 911 500 252 77
% Decolourization
or
% Removal of Colour
- 50.4 65.3 74 85.7 92.8 97.8

276 | P a g e
nm
Colour of Blank (I.U.) 3753 3528 3267
Absorbance after adsorption at
420 nm
0.492 0.743 0.864
Colour after adsorption (I.U.) 1477 1736 1606
% Decolourization
or
% Removal of Colour
60.6 50.7 50.8
Table 8: Data Showing Effect of Sugar Concentration on Decolourization of Raw Sugar (with ultrasound)
Particulars Sugar Concentration (30 Bo
x)
25 30 35
Absorbance of Blank at 420
nm
1.250 1.510 1.758
Colour of Blank (I.U.) 3753 3528 3267
Absorbance after adsorption at
420 nm
0.394 0.689 0.796
Colour after adsorption (I.U.) 1183 1609 1480
% Decolourization
or
% Removal of Colour
68.4 54.3 54.6
Figure 9: Effect of sugar concentration on sugar decolourization without ultrasound and with
ultrasound.

277 | P a g e
3.5 Adsorption mechanism of sugar molecule on adsorbent
The separation technique based on the adsorption phenomena is based on the three distinct mechanisms: steric,
equilibrium, and kinetic mechanisms. In the steric separation mechanisms, the porous solid has pores having
dimension such that it allows small molecules to enter while excluding large molecules from entry. The equilibrium
mechanism is based on the solid having different an ability to accommodate different species, that is the stronger
adsorbing species is preferentially removed by the solid. The kinetic mechanism is based on the different rates of
diffusion of different species into the pore; thus by controlling the time of exposure the faster diffusing species is
preferentially removed by the solid [36].
According to Kamali (2010) the porous solid of a given adsorption process is a critical variable. The success
or failure of the process depends on how the solid performs in both equilibrium and kinetics. A solid with good
capacity but slow kinetics is not a good choice as it takes adsorbate molecules too long a time to reach the particle
interior. This means long gas residence time in a column, hence low throughput. On the other hand, a solid with fast
kinetics but low capacity is not good either as a large amount of solid is required for a given throughput. Thus, a good
solid is the one that provides good adsorptive capacity as well as good kinetics.
To satisfy these two requirements, the following aspects must be satisfied:
a) The solid must have reasonably high surface area of micropore volume
b) The solid must have relatively large pore network for the transport of molecules to the interior
To satisfy the first requirement or statement, the porous solid must have small pore size with a reasonable porosity.
This suggests that a good solid must have a combination of two pore ranges: the micropore range and the macropore
range. The classification of pore size as recommended by IUPAC is often used to delineate the range pore
size:
Micropores d < 2 nm
Mesopores 2 < d< 50 nm
Macropores d > 50 nm
The adsorption efficiency [37] of the sorbents are influenced by operating temperature, the chlorine or sulphur content
in the feed waste, kinds of sorbents, sorbent size, amount of sorbent additive, and air flow rate. Among these factors,
operating temperature, chlorine content, and sorbent size are most important. When heavy metals are heated, some
volatilized metals exist in the gas phase, some form particles, and some are captured by sorbents through
heterogeneous condensation and chemical adsorption. The third mechanism is particle capture. Most metal particle
can be captured by sorbents through coagulation, coalescence, and scavenging. This is evident when the surface of
sorbents is stickier, such as a glassy surface or sorbents coated with a layer of sticky material.

278 | P a g e
There are three general types of adsorption: physical, chemical, and exchange adsorption. Physical adsorption is
relatively nonspecific and is due to the operation of weak forces of attraction or van der Waals forces between the
molecules. The adsorbed molecule is not affixed to a particular site on the solid surface, but is free to move about
over the surface. In addition, the adsorbed material may condense and form several superimposed layers on the
surface of the adsorbent. Chemical adsorption, on the other hand, is the result of much stronger forces, comparable
with those leading to the formation of chemical compounds.
IV.CONCLUSION
After 45 minutes of ultrasonic treatment, the percentage removal of sugar colour in the adsorbent load of 0.5 to 3.0gm
is 42.7 to 92.8 percent in the absence of US and 50.4 to 97.8 percent in the presence of US. The removal of sugar
colour was significantly enhanced in the presence of ultrasound with adsorbents and the decolourization improved
with increase in amount of adsorbents, under experimental conditions due to increased sorbent surface area and
availability of more sorption sites resulting from the increased dose of the adsorbents from 0.5 gm to 3.0 gm.
Ultrasound also improve the quality of sugar due to increase the colour removal capacity. The ultrasonic equipment is
easy to operate, needs little maintenance and has a good automised performance. Ultrasonic technique or
Sonochemical method is faster method, therefore more productive in terms of time and energy consumption in sugar
refining processes.
V.ACKNOWLEDGEMENT
We are grateful to Prof. Pankaj Srivastava for Scientific discussion. Authors are also thankful to Department of
Chemistry, Faculty of Science, DEI, Agra for providing lab facilities.
REFERENCES
[1.] M. Ahmedna, S. J. Clarke, R. M. Rao, W. E. Marshall and M. M. Johns, Use of filtration and buffers in raw
sugar color measurements, Journal of Science Food and Agriculture, 75, 1997, 109-116.
[2.] K. Singh, R. Bharose, S. K. Verma and V. K. Singh, Potential of powdered activated mustard cake (PAMC)
for use in raw sugar decolorization, Journal of Science Food and Agriculture, 93, 2013, 157-165.
[3.] K. Singh, S. K. Verma and R. Bharose, Powdered activated mustard cake (PAMC): synthesis,
characterization and its use for aqueous phase adsorption of phenolics, Journal of Indian Chemical
Society, 91, 2014, 483-496.
[4.] J.W. Hassler, Activated carbon (Chemical publishing Co, New York, 1963).
[5.] M. Smisek and S. Cerney, Active carbon: manufacture, properties and applications (Elsevier, Netherlands,
1970).
[6.] G. Nakhla, N. Abuzaids and S. Farooq, Activated carbon adsorption of phenolics in toxic-systems: effect of
pH and temperature variations, Water Environment Research. 66, 1994, 842-850.
[7.] A. Dabrowski, Adsorption-from theory to practice, Advances in Colloid and Interface Science, 93, 2001,

279 | P a g e
135-224.
[8.] A. Islam and A. K. Guha, Removal of pH, TDS and color from textile effluent by using coagulants and
aquatic/non aquatic plants as adsorbents, Resources and Environment, 3(5), 2013, 101-114.
[9.] R. Razmovski and M. Sciban, Biosorption of Cr (VI) and Cu (II) by waste tea fungal biomass. Ecological
Engineering, 34, 2008, 179-186.
[10.] V. S. Batra, Vidya, S. Urbonaite and G. Svensson, Characterization of unburned carbon in bagasse fly
ash. Fuel, 87, 2008, 2972-2976.
[11.] A. K. Hindu and J. Takemura, Effects of ultrasonic excitation on heavy metal sorption, C. D. Proc.
Symposium on Infrastructure Development and the Environment, Quezon City, Philippines, 2006, 001-
004.
[12.] M. A. B. Kamali, Removal of heavy metal from industrial wastewater using ultrasonic assisted by tea
waste as adsorbent, Degree of Bachelor of Chemical Engineering , Universiti Malaysia Pahang, 2010.
[13.] H. V. Fuchs, Innovative sound adsorption products-new tools and materials for noise control and acoustic
confort, In: Pandalalai (ed), Resent research developments- sound and vibration, 1, 2002, 203-239.
[14.] S. Rochebrochard, E. Naffrechoux, P. Drogui, G. Mercier and J. F. Blais, Low frequency ultrasound
assisted leaching of sewage sludge for toxic metal removal, dewatering and fertilizing properties
preservation, Ultrasonic Sonochemistry, 20, 2013, 109-117.
[15.] T. G. Kazi, M. K. Jamali, A. Siddiqui, G. H. Kazi, M. B. and Arain H. I. Afridi, An ultrasonic assisted
extraction method to release heavy metals from untreated sewage sludge samples, Chemosphere, 63,
2006, 411- 420.
[16.] B. Neppolian, A. Doronila and M. Ashokkumar, Sonochemical oxidation of arsenic (III) to arsenic (V)
using potassium peroxydisulfate as an oxidizing agent, Water Research, 44, 2010, 3687-3695.
[17.] A. Fontana, C. Braekman-Danheux and C. G. Jung, Ultrasonic removal of heavy metals from waste oils,
Fuel Process Technology, 48, 1996, 107-117.
[18.] B. Neppolian, A. Doronila, F. Grieser and M. Ashokkumar, Simple and efficient sonochemical
method for the oxidation of arsenic (III)to arsenic(V), Environmental Science and Technology, 43,
2009, 6793-6798.
[19.] S. Anandan and M. Ashokkumar, Sonochemical synthesis of Au-TiO2 nanoparticles for the
sonophotocatalytic degradation of organic pollutants in aqueous environment . Ultrasonics
Sonochemistry, 16, 2009, 316-320.
[20.] P. Zhang, Y. Ma and Xie F. C, Impacts of ultrasound on selective leaching recovery of heavy metals from
metal containing waste sludge. Jounal of Material Cycles Waste, 15, 2013, 530-540.
[21.] K. S. Suslick, Sonochemistry, Science, 23, 247 (4949), 1990, 1439-1445.
[22.] F. Chemat, Z. E. Huma and H. K. Khan, Application of ultrasound in food technology: processing,
preservation and extraction, Ultrasonic Sonochemistry, 18, 2011, 813-835.
[23.] T. Kimura, T. Sakamoto, J. Leveque, H. Sohmiya, M. Fujita, S. Ikeda and T. Ando, Standardization of

280 | P a g e
ultrasonic power for sonochemical reaction. Ultrasonics Sonochemistry, 3, 1996, S157–S161.
[24.] Q. Hamdaoui, M. Chiha and N. E. Emmanuel, Ultrasound-assisted removal of malachite green from
aqueous solution by dead pine needles. Ultrasonics Sonochemistry, 15, 2008, 799-807.
[25.] J. B. Francisco, O. Parniakov, S. A. Pereira, A. Wiktor, N. Grimi, N. Boussetta, A. J. Saraiva, J. Raso, O.
Martin-Belloso, D. Witrowa-Rajchert, N. Lebovka and E. Vorobiev, Current applications and new
opportunities for the use of pulsed electric fields in food science and industry, Food Research
International, 77, 2015, 773-798.
[26.] K. S. Suslick and G. J. Price, Applications of ultrasound to materials chemistry, Annual Review of
Material Science, 29, 1999, 295-326.
[27.] H. Xu, B. W. Zeiger and K. S. Suslick, Sonochemical synthesis of nanomaterials, Chemical Society
Reviews, 42, 2013, 2555-2567.
[28.] J. H. Bang and K. S. Suslick, Applications of ultrasound to the synthesis of nanostructured materials,
Advanced Materials, 22, 2010, 1039-1059.
[29.] R. S. Alfarra, N. E. Ali and M. M. Yosoff, Removal of heavy metals by natural adsorbent: review,
International Journal of Biosciences, 4 (7), 2014, 130-139.
[30.] A. Z. Hu and J. Qiu, Industrial experiments for the application of ultrasound on scale control in the
chinese sugar industry, Ultrasonics Sonochemistry, 13, 2006, 329-333.
[31.] V. K. Singh, S. K. Verma, B. Chandra, S. P. Gupta and K. Singh, Application and potential of power
ultrasound (pus) in sugar manufacturing: a non-chemical green technology, Journal of Pure and Applied
Ultrasonic, 35, 2013, 137-140.
[32.] Bartens, ICUMSA Methods Book, Method GS2/3-18, p 1, (Berlin, Germany, 2009).
[33.] K. Singh, R. Bharose, V. K. Singh and S. K. Verma, Sugar decolorization through selective adsorption
onto functionalized accurel micro- porous hydrophobic polymeric support, Industrial & Engineering
Chemistry Research, 50, 2011, 10074-10082.
[34.] K.. Singh, S. K. Verma, R. Bharose and V. K. Singh, Brassica Cake Carbon (BCC) as the potential
substitute for commercial carbons used in sugar decolorization, Proc. of 10th Joint Conv. of STAI and
DSTA, 2011, 3-17.
[35.] S. K. Verma, A. P. Srivastava, B. K. Pandey, and A. K. Pandey, Removal of phenolics acids from their
aqueous solutions by adsorption onto activated Wheat Husk (AWH), Proc. of Materials Science and
Technology, 2014, 1-15.
[36.] Duong D. D, (ed.), Adsorption analysis: Equilibria and Kinetics, Imperial College Press, (1998).
[37.] S. Chen, J. Zhang, C. Zhang, Q. Yue, Y. Li and C. Li, Equilibrium and kinetic studies of methyl orange
and methyl violet adsorption on activated carbon derived from Phragmites australis, Desalination, 252,
2010, 149-156.