Impact of motivation as HR bundle on performance of ...
12
Vol. 8(3), pp. 101-112, 14 February, 2014 DOI: 10.5897/AJBM2013.7203 ISSN 1993-8233 © 2014 Academic Journals Copyright © 2014 Author(s) retain the copyright of this article http://www.academicjournals.org/AJBM African Journal of Business Management Full Length Research Paper Impact of motivation as HR bundle on performance of teachers of public schools in Bungoma County Wanyonyi Kadian Wanyama 1 *, Dankit Nassiuma 2 and C. Zakayo 1 1 School of Business, Kabarak University, Kenya. 2 School of Mathematics, Kabarak University, Kenya. Accepted 1 February, 2014 The challenge for managers today is to keep the staff motivated and performing well in the workplace. By understanding employees' needs, managers can understand what rewards to use to motivate them. The goal of most companies is to benefit from positive employee behavior in the workplace by promoting a win–win situation for both the company and workers. This research sought to determine the impact of motivation as a HR bundle on teacher performance of public schools in Bungoma County. The study had the following hypothesis: there is no significant impact of motivation on teacher performance of public schools in Bungoma County. The study adopted descriptive and correlational survey designs. Validity of the research instruments was based on the three overarching forms of validity: content, face and construct validity. Reliability coefficient yielded a Cronbach’s alpha of 0.90. The data was analyzed using descriptive statistics and inferential statistics, namely, regression analysis and ANOVA. The main finding of this study was that motivation and as HR bundles had a marginally weak positive and significant association with teacher performance of public schools in Bungoma County. Key words: Motivation, Academic Performance, Public Schools, Bungoma County. INTRODUCTION Examination results from Bungoma County have shown poor Kenya Certificate of Primary Education (KCPE) and Kenya Certificate of Secondary Education (KCSE) perfor- mance in the period of 2002-2012. There is however, need to establish how motivation as a HR bundle affects teacher performance of public schools in Bungoma County (see Appendices 1a and 1b). Ibukun (2003) and Brock–Utne (2006) opines that investment in basic education and training is an ingredient to human capacity building. Such capacity, they note is the foundation needed to realize increased productivity, most importantly technological innovation. The educational system is vital in producing personnel that is required to function in various facets of national life and development process (Analoui, 2007). With a growing focus on the importance of ‘knowledge societies' for equipping countries with a suitable workforce, issues around human resources within the education sector have come under greater scrutiny (Analoui). One of the strongest and most often used arguments for investment in education is the econo- mic argument based upon the Human Capital Theory (Analoui and Karami, 2003). The basic premise of Human * Corresponding author: Email: [email protected]; Cellphone-0721-340-373. Author(s) agree that this article remain permanently open access under the terms of the Creative Commons Attribution License 4.0 International License
Transcript of Impact of motivation as HR bundle on performance of ...

Vol. 8(3), pp. 101-112, 14 February, 2014 DOI: 10.5897/AJBM2013.7203 ISSN 1993-8233 © 2014 Academic Journals Copyright © 2014 Author(s) retain the copyright of this article http://www.academicjournals.org/AJBM
African Journal of Business Management
Full Length Research Paper
Impact of motivation as HR bundle on performance of teachers of public schools in Bungoma County
Wanyonyi Kadian Wanyama1*, Dankit Nassiuma2 and C. Zakayo1
1School of Business, Kabarak University, Kenya.
2School of Mathematics, Kabarak University, Kenya.
Accepted 1 February, 2014
The challenge for managers today is to keep the staff motivated and performing well in the workplace. By understanding employees' needs, managers can understand what rewards to use to motivate them. The goal of most companies is to benefit from positive employee behavior in the workplace by promoting a win–win situation for both the company and workers. This research sought to determine the impact of motivation as a HR bundle on teacher performance of public schools in Bungoma County. The study had the following hypothesis: there is no significant impact of motivation on teacher performance of public schools in Bungoma County. The study adopted descriptive and correlational survey designs. Validity of the research instruments was based on the three overarching forms of validity: content, face and construct validity. Reliability coefficient yielded a Cronbach’s alpha of 0.90. The data was analyzed using descriptive statistics and inferential statistics, namely, regression analysis and ANOVA. The main finding of this study was that motivation and as HR bundles had a marginally weak positive and significant association with teacher performance of public schools in Bungoma County. Key words: Motivation, Academic Performance, Public Schools, Bungoma County.
INTRODUCTION Examination results from Bungoma County have shown poor Kenya Certificate of Primary Education (KCPE) and Kenya Certificate of Secondary Education (KCSE) perfor-mance in the period of 2002-2012. There is however, need to establish how motivation as a HR bundle affects teacher performance of public schools in Bungoma County (see Appendices 1a and 1b). Ibukun (2003) and Brock–Utne (2006) opines that investment in basic education and training is an ingredient to human capacity building. Such capacity, they note is the foundation needed to realize increased productivity, most importantly
technological innovation. The educational system is vital in producing personnel that is required to function in various facets of national life and development process (Analoui, 2007). With a growing focus on the importance of ‘knowledge societies' for equipping countries with a suitable workforce, issues around human resources within the education sector have come under greater scrutiny (Analoui). One of the strongest and most often used arguments for investment in education is the econo-mic argument based upon the Human Capital Theory (Analoui and Karami, 2003). The basic premise of Human
*Corresponding author: Email: [email protected]; Cellphone-0721-340-373. Author(s) agree that this article remain permanently open access under the terms of the Creative Commons Attribution License 4.0 International License

102 Afr. J. Bus. Manage. Capital Theory is that investment in human resources results in improved productivity in an organisation (Armstrong, 2001).
Motivation is a set of courses concerned with a kind of strength that boosts performance and directs towards accomplishing some definite targets (Khan et al., 2010). According to Rizwan et al. (2010), it is an accrual of diverse routes which manipulate and express our activi-ties to attain some particular ambitions. The motivation of an individual envelops all the drives for which he selects to operate in a definite approach. In fact motivation is “inside another person’s head and heart” (Fard et al., 2002).
The following theories informed the study: Taylor (productivity theory), Alders (ERG Theory), Maslow (Need Theory), Vrooms (Expectancy Theory), Adams (Social Equity Theory), Herzberg (Two Factor Theory), McGregor (Theory X and Y), Geogopalaus (Path Goal Theory) and Skinner (Reward Theory) (Ajang, 2007). These motivational theories were summed in the Need theory that guided the study. Need Theory posits that needs represent an internal energy force that directs behaviour toward actions that permit the satisfaction and release of the need itself (that is, satiation), suggested by Murray’s (1938) system of needs. This need is what drives us to do whatever we do. In this study, training, development, compensation, incentives, reward, recog-nition and promotion were the institutional needs that the study used to address the performance of teachers in public schools in Bungoma County.
In their study on the motivational factors among industrial employees, Hersey and Blanchard as reported by Ajang (2007) ranked the following five factors as the top influential ones (1) full appreciation of work done, (2) feeling of being, (3) sympathetic help regarding personal problems, (4) job security, and (5) good wages/salaries. Kovach in Ajang (2007) carried out a similar study of industrial employees in 1981 and again in 1986 and concluded that by 1981 what workers wanted had changed. The findings showed that interesting work was in the first position and sympathetic help concerning personal problems had dropped to the ninth position. Kovach further reported that by 1986 the ranking had changed even further and the top five ranked motivational factors were: (1) interesting work, (2) full appreciation of work done, (3) feeling of being (recognition), (4) job security and (5) good wages/salary. A survey by Ajang (2007) ranked top five factors that motivate workers as future employees as follows: job satisfaction, promotions/ expectations, recognition, good salary, and organizational/management styles.
A lot of empirical studies on employees’ motivation have been undertaken in manufacturing industries in developed countries yielding varied results (Raigama, 2010) but little has been underscored in educational institutions. In this study, motivation has been conside-redas a HR bundle constituting human resource practices
like training, development, compensation, incentives, reward, recognition and promotion. The research of Pascoe et al. (2002) identifies that employee job satis-faction diminishes due to deficiency in recognition and rewarding. In order to gain employees job satisfaction, it is necessary that management of organizations should offer rewards and recognition on good work.
An empirical study was conducted in Pakistan to measure the impact of reward and recognition on job satisfaction and motivation where 220 questionnaires were distributed and filled by employees of different sectors. The results showed that there exists a significant (r=0.73, p<0.05) relationship between recognition and employee work motivation (Rizwan et al., 2010). An empirical study was conducted by Reena et al. (2009) to examine the impact of reward and recognition programs on employee motivation and satisfaction. A questionnaire was distributed to 80 employees of Unilever and data was analyzed through SPSS version 16. The results showed that there is a statistically significant (r=0.92, p<0.01) direct and positive relation between recognition and employee work motivation (Rizwan et al., 2010).
Tessema and Soeters (2006) found a significant and positive correlation between promotion practices and perceived employee performance. However, HR out-comes were used as mediating variables. Soharab and Khurram (2011) did a study on the impact of compen-sation, promotion and performance evaluation practices on the performance of university teachers of Azad Jammu and Kashmir. It was concluded that compensation has strong and positive impact on performance of university teachers. Furthermore; Baloch et al. (2010) did a study about the HRM practices in order to examine their relationship with the perceived performance of employees in private and public sector banks of North-west Frontier Province (NWFP). Compensation, promo-tion and performance evaluation practices were signifi-cantly found to be correlated with employee performance. Banks were encouraged to pay proper attention to these three practices. It should be noted that most of these studies were focused on the association between HR practices and performance in the manufacturing firms but not in the education sector which is a service industry.
A study conducted by Mshila (2013) on theeffects of in-service training on the performance of secondary school teachers in Kiambu West District revealed thatin-service training has several positive effects on the performance of secondary teachers in Kiambu District and by exten-sion other parts of Kenya. These include: self-development of the teachers, gaining of new skills that enables them perform their tasks better and adequate and timely completion of syllabuses.
Moreover, examination results from Bungoma County have shown poor teacher performance in both Kenya Certificate of Primary Education (KCPE) and Kenya Certificate of Secondary Education (KCSE) performance in the period of 2002-2012 (see Appendix 1a). This was
the gap the study sought to fill in by focusing on the impact of motivation as HR bundle on the teacher performance of public schools in Bungoma County, Kenya. Therefore, this study sought to test the hypothesis: H01: there is no significant impact of motivation on teacher performance of public schools in Bungoma County. METHODOLOGY This study was conducted in Bungoma County which is one of the four Counties that constitute the former Western province of Kenya (see Appendices 3a and 3b) and adopted descriptive and correlational survey designs. The target population consisted of 1,031 public schools and 9,884 teachers and 762 support staff. The sample size of schools in each stratum and the number of respondents were obtained using coefficient of variation (see Appendix 1d) (Nassiuma, 2000). Simple and proportionate random sampling were used to select 100 schools and 100 head teachers, 130 teachers and 75 support staff, a District Education Officer (DEO) and a District Quality Assurance and Standards Officer (DQASO). Primary data was obtained from the two questionnaires, key informant interview schedules and observation checklists. Secondary data on the number of public schools, teachers, support staff and teacher performance in both KCPE and KCSE was obtained through study of available literature and records from the relevant government agencies and other stakeholders like teachers’ trade unions. The researcher used research assistants who issued, and picked questionnaires from the respondents. The researcher personally filled the interview schedules and observation checklists (Appendices 2a and 2b).
Research instruments were retested on a sample of 10 respon-dents who were not used in the final analysis. The questionnaire and interview schedules were used to collect the data. The questionnaire contained information on the background information of the respondents and questions on training, development, compensation, incentives, reward, recognition and promotion. The questions on these variables were based on the five point Likert scale and scored as indicated: Strongly agreed (SA = 5), agree (A = 4), undecided (UD = 3), disagree (D = 2), strongly disagree (SD = 1).
Validity of the research instruments was based on the three overarching forms of validity: content, face and construct validity. Validity was achieved by presenting the instruments to the supervisor and experts in the school of business to evaluate the applicability and appropriateness of the content, clarity and adequacy of construction of the instrument and suggestions made and modified appropriately. To establish the reliability of the study, Cronbach’s Alpha Coefficient was computed on training, develop-ment, compensation, incentives, reward, recognition and promotion and yielded an alpha of 0.90 (see Appendix 1c). The results of the pilot study revealed that the research instruments were adequate in content, reliable and valid to measure the opinions of the respondents. Data analysis was done at two levels using descriptive statistics and inferential statistics. In descriptive statistics measures of central tendency, frequency tables and percentages were used. Inferential statistics involved the use of analysis of variance (ANOVA), simple and multiple regression analyses.
When granted the research permit from the National Commission for Science, Technology and Innovation (NACOSTI), the researcher liaised with the District Education Officers and human resource departments in Bungoma County in order to collect data. This required clearance from school administration as well as District Education Officers for the researcher to administer data collection instruments and collect the data. Confidentiality was observed throughout the study for respondents who gave personal opinions.
Wanyama et al. 103
Table 1. Preparation of Learners in National Examination and Academic Performance
Reasons Frequency Percentage
Excellent 33 14.7 Average 20 8.9 Below 107 47.5 Poor 65 28.9
Total 225 100.0
F-value p-value Df 8.0953 0.022 1,8
Data collection is a sensitive issue as it borders on invading people’s private lives, ethical consideration are therefore, of paramount importance in research (Mugenda and Mugenda (2003). The researcher ensured that the respondents were made aware of the intended use of the data and that the information obtained was confidential and was not to be disclosed or discussed with any unauthorized persons. Effort was made to ensure that the respon-dents were protected from any psychological harm during data collection. Punctuality was observed to avoid any incon-veniences to the respondents. RESULTS Background Information on Performance of Teachers in Public Schools One Way ANOVA conducted between the levels of teacher’s preparation of learners in national examination and teacher performance revealed a significant difference (p<0.05), (F (1, 8) = 8.0953, p-value = 0.022). This was inferred to mean that the level of teacher’s preparation of students in national examinations affected teacher perfor-mance in the national examinations. For example, 47.5% of respondents were of the opinion that the preparation of learners in national examinations was below average, 28.9% of respondents indicated preparation was poor, 14.7% excellent, and 8.9% average (see Table 1). This could be attributed to teachers’ diverse needs and this meant that teachers spend more time fulfilling their needs than preparing adequately the learners for the national examinations. As echoed by the Need Theory, needs represent an internal energy force that directs behaviour toward actions that permit the satisfaction (Murray, 1938). This need is what drives us to do whatever we do.
Multiple post hoc tests based on the Least Significant Differences (LSD) as given in Table 2 indicate a signifi-cant difference (p<0.05) in the mean score indices among the counties except, the teacher performance between Kakamega and Vihiga Counties (for detailed results, see Appendix 1b). The poor teacher performance in Bungoma County could be attributed to very deep cultural heritage with extensive rites of passage like circumcisions, re-membrance of the dead which have preoccupied the minds of the people demeaning the importance of

104 Afr. J. Bus. Manage.
Table 2. Multiple-Post Hoc LSD test for County Academic Results in the Four Counties
County Mean score
Busia Kakamega Vihiga Bungoma
5.29a 5.00b 4.98b 4.79c
Means followed by the same letter are not significantly different from each other at 5% level.
education. The animosity between the Bukusu and the Sabaot of Mount Elgon has played a negative role in lowering the academic standards of Bungoma County by hindering freely sharing of information on education. This could also explain the poor academic standards in Mount Elgon District. Training and Development and Teacher Performance The results illustrate that 29.3% of respondents strongly agreed that teachers are taken for refresher courses offered by Strengthening of Mathematics and Sciences in Education (SMASSE) and Kenya Education Management Institute (KEMI) to increase teachers' skills, 16% agreed, 28% of respondents disagreed while 26.7% strongly disagreed. The mean on this variable was rather low (M = 2.93, on scale from 1 = strongly disagree to 5 = strongly agree), an indication that most teachers do not attend refresher courses offered by SMASSE and KESI (see results in Table 3). This could be true because SMASSE In-Service Training usually targets Mathematics and Science teachers only (JICA, 2004).
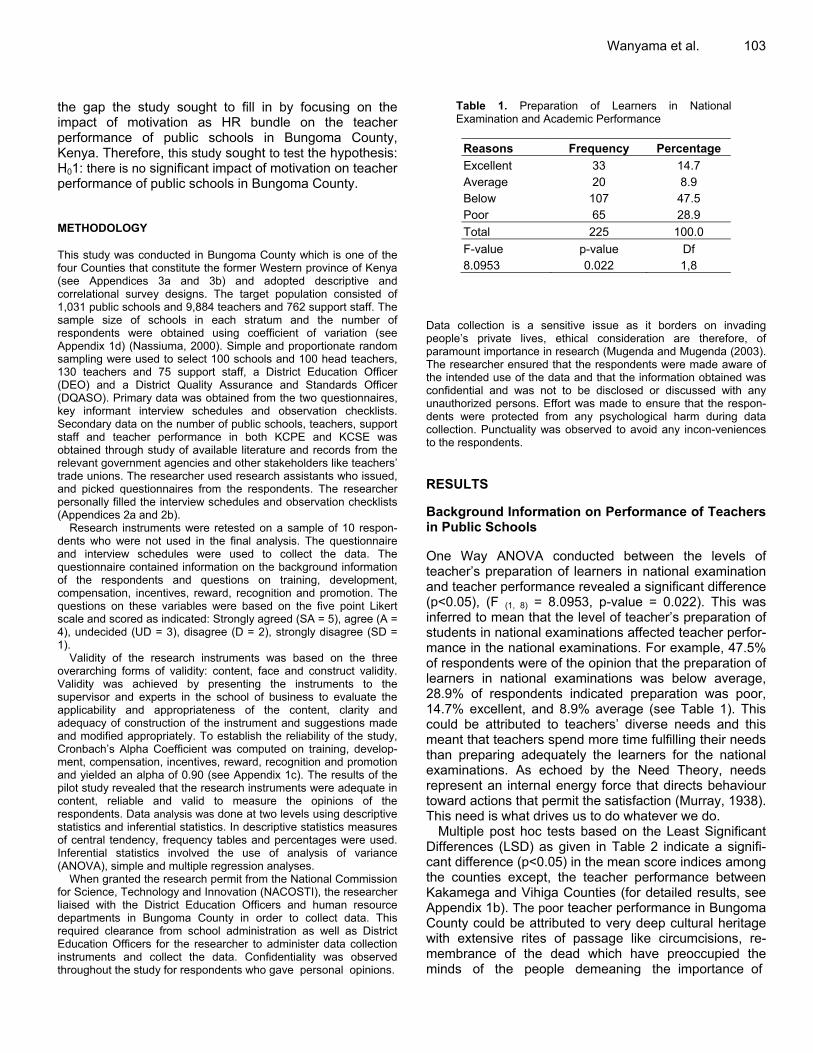
The results show that training and development as a HR practice was evident in public schools in Bungoma County and was practised to some extent. Interview guides demonstrate that in-service training of teachers in Kenya and particularly in Bungoma County has been inadequate with attention focused mainly on heads of schools. Compensation/Performance Appraisal and Teacher Performance A Chi Squared goodness of fit test conducted on compensation/incentives and rewards in Table 4, showed a highly significant (p<0.000) association an indication that the responses to the variables of compensation/ incentives and rewards were uniform. The results further illustrated that teachers’ payment is not pegged on their job performance: (31.6% disagreed, 29.3% strongly
disagreed, 23.6% agreed, 10.7% strongly agreed and 4.9% of respondents were undecided).Diverse views were given concerning whether teachers were appraised at least once a year (37.8% of respondents agreed, 26.7% disagreed, 19.1% strongly disagreed, 9.3% of respondents were undecided while 7.1% of respondents strongly agreed). This had a low mean of 2.87 based on the on scale from 1 = strongly disagree to 5 = strongly agree. The results on whether teachers are provided feedback after performance appraisal showed that 40.9% of the respondents strongly agreed, 19.6% agreed, 19.6% disagreed, 13.8% of respondents strongly disa-greed and 6.2% of respondents were undecided.
Similarly, diversified views were given by the respon-dents on whether head teachers carry out performance appraisal in schools: The findings revealed that (38.7% of respondents were in agreement whereas 22.7% were in disagreement. Seventeen point eight percent (17.8%) of the respondents strongly agreed, 16.4% strongly disa-greed and 4.4% were undecided. This had a mean of 3.19. This signified that some teachers were not aware of staff appraisal, how it is done and often the feedback is not given to the appraisees (teachers) to know how they are faring on well and whether the set objectives were achieved. This could translate to lack of proper appraisal guidelines for the teachers. The results also point to the fact that teachers are passive participants in the performance appraisal process. Impact of Motivation and Teacher Performance The study sought to determine the impact of motivation on teacher performance of public schools in Bungoma County. This objective was achieved through the analysis of variance and regression analysis as illustrated in Table 5. Results indicate that training and development had a fairly moderate positive and significant impact on the teacher performance of public secondary schools (R2 = 0.195, b = 0.348, t-value = 4.426, p-value = 0.000). R2 indicates the degree of association between motivation and academic performance. This implies that for every unit increase in motivation, there is a corresponding increase in teacher performance by 19.5%. Also, 19.5% increase in teacher performance is attributed to motiva-tion. The variance of teacher performance significantly explained by motivation as independent variables was 19.5%. Therefore, this meant that R2 = 19.5% motivation did not strongly impact on teacher performance in Bungoma County, an indication that its level of influence on teacher performance was low. Compensation and rewards had a weak positive association on teacher performance of public schools in Bungoma County (R2 = 0.055, b = 0.216, t-value = 3.932, p-value = 0.000). On the other hand, promotion had a positive insignificant (>0.005) association on teacher performance of public schools in Bungoma County (R2 = 0.112, b = 0.058, t-value = 0.967, p>0.05).

Wanyama et al. 105 Table 3. Training and Development of Teachers in Bungoma County
Training
SA
A
U
D
SD Mean
Χ Goodness of Fit Test
Teachers are taken for refresher courses offered by SMASSE and KESI to increase teachers' skills
66(29.3%)
36(16%)
63(28%)
60(26.7%)
2.93
χ2 = 10.040, df = 3, p-value = 0.000
Teachers attended workshops/seminars in their subject areas
38(16.9%)
143(63.6%)
36(16%)
8(3.6%)
3.74
χ2 = 188.387, df = 3, p-value = 0.000
The ministry of education has made provisions for teachers' training and development through provision of scholarships and study leaves
64(28.4%)
87(38.7%)
7(3.1%)
47(20.9%)
20(8.9%)
3.57
χ2 = 204.533, df = 4, p-value = 0.000
Head teachers/principal allow teachers to further their studies to increase their educational levels
77(34.2%)
114(50.7%)
12(5.3%)
14(6.2%)
8(3.6%)
4.06
χ2 = 93.289, df = 4, p-value = 0.000
N = 225, SA= strongly agree, A= agree, U= undecided, D= disagree and SD = strongly disagree.
Overall, motivation as a bundle of HR had a marginally positive and significant association with teacher performance of public secondary schools (R2 = 0.120, F = 6.67, b = 0.169, t-value = 2.46, p-value = 0.001). There-fore, the hypothesis which states that there is no significant impact of motivation on performance of public schools in Bungoma County was rejected. The results on the motivation versus teacher performance indicated a marginal positive and significant association with teacher performance of public schools (R2 = 0.120, b = 0.169, t-value = 2.46, p-value = 0.001). DISCUSSIONS These study findings were consistent with the findings of ILO (2012) that appropriate and relevant employment terms and career development opportunities for teachers are important for attracting and retaining the most qualified, experienced and motivated teachers. As the ILO tripartite constituents have concluded: ―universally attainable and quality lifelong learning depends in large part on highly qualified and dedicated teaching, admini-strative and support staff (ILO, 2000a).
Similarly, Soharab and Khurram (2011) study on moti-vation of university teachers of Azad Jammu and Kashmir (AJK) observed that compensation and reward have strong and positive impact on performance of university teachers. This study also established that promotion,
compensation and reward were the major elements that influenced the teachers’ performance at school. However, promotion practices were found to have insignificant (p>0.05) relationship with the performance of the tea-chers. The reason for this was that most promotion procedures were vague and not properly followed during promotion of teachers in public secondary schools. The findings from interview guides also confirmed that promotions of teachers from primary schools from job group G to K usually takes 12 years and that one was not guaranteed promotion unless he/she passes Teachers’ Proficiency Courses (TPC). For example, the study established that very few teachers in Bungoma County if any are in job group P, yet many have attained masters’ degrees. The three schemes of service, that is, non-graduate, graduate and secretariat are a hindrance to teachers’ promotion from one job group to another. Moreover, majority of the P1 and P2 teachers are obliged to attain undergraduate degrees before promotion to job group K. Therefore, this meant that for teachers to be promoted they had to enrol for undergraduate programmes that run when schools close (school-based programmes). These programmes are usually very intensive and therefore, the teachers cannot prepare adequately the candidates for the national examinations, resulting to poor performance.Moreover, effective apprai-sal should be a dynamic interaction process which should result in negotiated goals that are linked to professional development. If the process does not result in the desired
106 Afr. J. Bus. Manage.
Table 4. Staff Appraisal, Compensation, Rewards and Promotion
SA A
U
D
SD
Mean
Chi Squared Goodness of Fit Test
Compensation/Incentives and Rewards
Teachers are paid based on job performance
24(10.7%) 53(23.6%) 11(4.9%) 71(31.6%) 66(29.3%) 2.72 χ2 = 61.733, df = 4, p-value = 0.000
Teachers are given incentives after good performance in national examinations
38(16.9%) 143(63.6%) 36(16%) 8(3.6%) 2.35 χ2 = 116.222, df = 4, p-value = 0.000
Provision of an effective motivating incentive system is wanting to boost performance of teaching force
49(21.8%) 81(36%) 7(6.2%) 32(14.2%) 49(21.8%) 3.22 χ2 = 54.622, df = 4, p-value = 0.000
Reward can influence positively teacher performance
49(21.8%) 82(36%) 3(1.3%) 24(10.7%) 4.29 χ2 = 142.679, df = 3, p-value = 0.000
Promotion Teachers' merit is the basis for promotion rather than seniority
45(20%) 68(30.2%) 13(5.8%) 36(16%) 63(28%) 2.98 χ2 = 43.511, df = 4, p-value = 0.000
Teacher's promotion is based on performance
54(24%) 59(26.2%) 20(8.9%) 47(20.9%) 45(20%) 3.13 χ2 = 20.133, df = 4, p-value = 0.000
Promotion of teachers is based on working experience
12(12%) 64(28.4%) 15(6.7%) 55(24.4%) 56(24.9%) 2.80 χ2 = 41.318, df = 4, p-value = 0.000
Staff Appraisal Teachers are appraised at least once a year
16(7.1%) 85(37.8%) 21(9.3%) 60(26.7%) 43(19.1%) 2.87 χ2 = 72.133, df = 4, p-value = 0.000
Teachers are provided feedback after performance appraisal
44(19.6%) 92(40.9%) 14(6.2%) 44(19.6%) 31(13.8%) 3.33 χ2 = 74.844, df = 4, p-value = 0.000
Head teachers carry out performance appraisal of their staff
40(17.8%) 87(38.7%) 10(4.4%) 51(22.7%) 37(16.4%) 3.19 χ2 = 69.20, df = 4, p-value = 0.000
N = 225, SA= strongly agree, A= agree, U= undecided, D= disagree and SD = strongly disagree.
Table 5. Simple Regression Analysis on Impact of Motivation on Teacher performance of Public Schools
Model 1 Adjusted R2 Regression coefficient, b t-value p-value/Sig.
Training & development and performance (school mean scores)
0.195 0.348 4.426 0.000 (s)
Compensation & rewards and performance (school mean scores)
0.055 0.216 3.932 0.000 (s)
Promotion and (school mean scores) 0.112 0.058 0.967 ≥0.05 (ns) Overall 0.120 0.169 2.46 0.001 (s)
N = 225; s-significant with p-value ≤0.05 and ns-not significant with p-value ≥0.05.
purpose it becomes a high stakes activity which is by being threatening and stressful.
Chandrasekar (2011) confirms the findings of this study by observing that employee performance fundamentally depends on many factors like performance appraisals, employee motivation, employee satisfaction, compensa-tion, training and development, job security, organizational structure and others. Employee motivation is one of the policies of managers to increase effectual job manage-ment amongst employees in organizations. A motivated employee is responsive of the definite goals and objectives he/she must achieve, thus he/she directs the efforts in that direction. Furthermore, Khan et al. (2010) said that, getting employees to do their best work even in strenuous circumstances, is one of the employees most stable and greasy challenges which can be made possible through motivating them. This therefore, in the education sector particularly in Bungoma County can be achieved through provision of physical facilities and instructional materials and housing facilities. CONCLUSIONS Motivation as a HR bundle had a marginal positive and significant association with teacher performance of public secondary schools in Bungoma County. Results indicate that training and development of teachers had a fairly moderate positive and significant impact on the teacher performance of public secondary schools. This meant that training and development did not strongly impact teacher performance in Bungoma County; its level of influence on teacher performance was low. Teachers’ compensation and rewards had a weak positive association on teacher performance while promotion had a positive insignificant association on teacher performance of public schools in Bungoma County. Overall, motivation as a bundle of HR had a marginally positive and significant association with teacher performance of public secondary schools. Conflict of Interests The author(s) have not declared any conflict of interests. RECOMMENDATIONS The school management and the Ministry of Education should ensure that HR practices like training and development, staff appraisal, compensation, rewards and promotion of are fully implemented in schools since they lead to positive academic performance. The study proposes that the Government of Kenya and the Ministry of Education should ensure that teachers’ salaries and benefits compare favourably with salaries paid in other occupations requiring similar or equivalent qualifications,
Wanyama et al. 107 skills and responsibilities. Furthermore, there is need for a reasonable living standard for teachers and their families, provision of teachers with the means to enhance their professional qualifications by investing in further education and the pursuit of cultural activities and take account of the higher level qualifications and experience required by certain posts within teaching/education. REFERENCES Adegbemile O (2011). Human Resource Availability and Students’
Teacher performance in Secondary Schools in North West Geo – Political Zone of Nigeria. J. Educ. Pract. 2(6).
Analoui F, Karami A (2003). Strategic management in small and medium enterprises. London: Thomson Learning.
Analoui F (2007). Strategic Human Resource Management, Thomson Learning, UK.
Baloch QB, Nazim Ali N, Kiani TS, Ahsan A, Mufty A (2010). Relationship between HR Practices and Perceived Employees' Performance of Bankers in NWFP, Pakistan (An Empirical Evidence). Eur. J. Soc. Sci. 18(2).
Ajang PE (2007). ‘Assessing the Role of Work Motivation on Employee Performance’, Student thesis, Umea University, Sweden 2007, [Online] available at http://umu.diva-portal.
Brock-Utne B (2006). Whose Education for All?The Recoloniztion of African Mind. Daejon.Homi Publishing Co.
Chandrasekar DK (2011). Workplace Environment and its impact on organisational performance in public sector organisations. Int. J. Enterprise Comput. Bus. Syst. Vol. 1.
Fard HD, Ghatari AR, Hasiri A (2002). Employees Morale in Public Sector: Is Organizational Trust an Important Factor? Eur. J. Sci. Res. 46(3):378-390.
Ibukun WO (2009). Building the future: Invest in Teachers Now. A paper presented at the Ondo state World Teachers Celebration, Monday 5th.
Ibukun WO (2003). Toward Performance of Teachers in Ondo State: Vision, Mission and Philosophy of Government on Education In: Taiwo EA & Fadipe J (Eds). Skills Improvement Programme for Effective Performance of Teachers in Nigerian Schools. (pp.1-13) Ondo: National Institute of Educational Planning and Administration Printing Press.
ILO (2000a). Conclusions on lifelong learning in the twenty-first century: The changing roles of educational personnel, Note on the proceedings, Joint Meeting on Lifelong Learning in the Twenty-First Century: The Changing Roles of Educational Personnel, Geneva.
JICA (2004). Teacher In-service Training Programme.CEMASTEA, Nairobi, Africa.
Khan KU, Farooq SU, Ullah MI (2010). The Relationship between Rewards and Employee Motivation in Commercial Banks of Pakistan. Res. J. Int. Stud. 14:37-52.
Mshila RM (2013). Effects of in-service training on the performance of secondary school teachers in Kiambu West District. Kenyatta University Library project, Kenya.
Mugenda MO, Mugenda AG (2003). Research Methods in Education: Quantitative and Qualitative Approach, Nairobi. Acts press.
Murray HA (1938). Explorations in personality.New York: Oxford University Press.
Nassiuma DK (2000). Survey and sampling: Theory methods, University of Nairobi press: Nairobi.
Pascoe C, Ali IM, Warne L (2002). “Yet another role for job satisfaction and work motivation – enabler of knowledge creation and knowledge sharing”, Informing Science InSITE– “Where Parallels Intersect” pp.1239-48.
Raigama RNTR (2010). Do HRM practices impact employee satisfaction, commitment or retention?(Empirical studies of Sri Lankan public sector banks). University of Agder, 2010, Faculty of Economics and Social Sciences, Department of Business Administration.

108 Afr. J. Bus. Manage. Reena FE, Jalilvand MR, Sharif M, Salimi GA, Khanzadeh SA (2009). A
Study of Influential Factors on Employees’ Motivation for Participating in the In-Service Training Courses Based on Modified Expectancy Theory. Int. Bus. Manage. 2(1):157-169.
Rizwan KU, Farooq SU, Ullah MI (2010). The Relationship between Rewards and Employee Motivation in Commercial Banks of Pakistan. Res. J. Int. Stud. 14:37-52.
Tessema M, Soeters J (2006). ‘Challenges and Prospects of HRM in
Developing Countries: Testing the HRM-performance link in Eritrean civil service’, Int. J. Hum. Resour. Manage. 17(1):86-105.
Soharab A, Khurram S (2011). HRM and employee performance: A case of university teachers of Azad Jammu and Kashmir (AJK) in Pakistan. Afr. J. Bus. Manage. 5(13):5249-52553 4th July 2011.

Wanyama et al. 109 APPENDICES
APPENDIX 1a. COMPARISON OF TEACHER PERFORMANCE OF BUNGOMA COUNTY WITH OTHER COUNTIES IN THE FORMER WESTERNPROVINCE (2002 – 2012)
YEAR BUNGOMA COUNTY MEAN SCORES
KAKAMEGA COUNTY MEAN SCORES
VIHIGA COUNTY MEAN SCORES
BUSIA COUNTY MEAN SCORES
2002 4.221 4.504 4.458 5.167 2003 4.628 4.838 4.612 5.228 2004 4.796 4.948 4.829 5.663 2005 5.210 5.329 5.303 5.802 2006 4.588 4.812 4.876 5.172 2007 4.772 5.213 5.261 5.604 2008 4.457 4.765 4.675 4.715 2009 4.622 4.863 4.768 4.648 2010 5.318 5.389 5.511 5.332 2011 5.316 5.383 5.534 5.525 2012 3.816 3.969 4.097 4.016 Mean Average 4.793 5.004 4.983 5.286
Source: Mean Scores Derived from KNEC-2002-2012 Maximum mean score/standard mean score: 12.000
APPENDIX 1b. ONE-WAY ANOVA MULTIPLE-POST HOC COUNTY ACADEMIC COMPARISON RESULTS IN THE FOUR COUNTIES IN THE FORMER WESTERN PROVINCE
County Mean Honestly Significant Difference (HSD)
Tukey LSD Bonferroni Sidak
M1 4.793 M1, M2 = -1.290 >HSD value (s) p = 0.058 (s) p = 0.038 (s) p = 0.095 (s) M2 5.004 M1, M3 = -1.162 >HSD value (s) p = 0.025 (s) p = 0.025 (s) p = 0.064 (s) M3 4.983 M1, M4 = -3.014 >HSD value (s) p = 0.034 (s) p = 0.017 (s) p = 0.042 (s) M4 5.286 M2, M3 = 0.128 >HSD value (ns) p = 0.560 (ns) p = 0.570 (ns) p = 0.574 (ns) M2, M4 = -1.724 >HSD value (s) p = 0.048 (s) p = 0.0160 (s) p = 0.01 (s) M3, M4 = -1.853 >HSD value (s) p = 0.024 (s) p = 0.0230 (s) p = 0.017 (s)
M1= Bungoma, M2 = Kakamega, M3 =Vihiga and M4 = Busia s= significant (p<0.05), two groups differ; ns = not significant (p>0.05), two groups do not differ For Turkey, if the difference is larger than the HSD value (0.01284), then the difference is significant

110 Afr. J. Bus. Manage.
APPENDIX 1c. Reliability Coefficients of the Research Variables
Variables Number of Items Reliability, α
School performance in KCSE and KCPE 2 0.91 Motivation 15 0.90 Governance 5 0.88 Working environment 7 0.92
Average, α 29 0.9025
Source: Researchers’ Computation, 2013 APPENDIX 1d: Nassiuma’s Coefficient of Variation
APPENDIX 2a: INTERVIEW SCHEDULE FOR THE DEOs and DQASOs Introduction: Good morning or afternoon sir/madam. Thank you for allowing me to interview you in regard to HR practices and their Impact on the Performance of Public Schools in Bungoma County, Kenya. I would like to assure you that I will stick to all ethical codes of conduct with regard to conducting research as stated in my introduction letter will be adhered to. The Interview Questions: What are some of the factors affecting teacher performance in the County? With reference to the factors in question 1, how have these factors affected morale, motivation, satisfaction and teacher performance in the County? In your opinion which factors affect the teaching force most in the performance of their duties? Kindly arrange them in order of merit from the worst to the least. Which strategic options will help in improving the performance of public schools in Bungoma County? Conclusion: Thank you for your time, your responses to the questions will indeed contribute a lot to my research work. APPENDIX 2b: INTERVIEW SCHEDULE FOR THE SUPPORT STAFF Introduction: Good morning or afternoon sir/madam. Thank you for allowing me to interview you in regard to HR practices and their Impact on the Performance of Public Schools in Bungoma County, Kenya. I would like to assure you that I will stick to all ethical codes of conduct with regard to conducting research as stated in my introduction letter. The Interview Questions: What are some of the factors affecting the performance of your duties in their school? Which factors affect you most in the performance of your duties in school? What do you think should be the solutions to these challenges so as to improve the teacher performance of the school? Conclusion: Thank you for your time, your responses to the questions will indeed contribute a lot to my research work.
22
2
)1()(
)(
eNCv
CvNS

Wanyama et al. 111
APPENDIX 3a: A Map of Bungoma County Showing Nine Administration Districts

112 Afr. J. Bus. Manage.
APPENDIX 3b: A MAP OF THE FORMER WESTERN PROVINCE SHOWING ITS FOUR COUNTIES


![Chapter 1: Hello macOS€¦ · Graphic Bundle [ 12 ] Chapter 6: Cocoa Frameworks - Graphic Bundle [ 13 ] Graphic Bundle [ 14 ]](https://static.fdocuments.in/doc/165x107/5f80297cd02a7d71680be459/chapter-1-hello-macos-graphic-bundle-12-chapter-6-cocoa-frameworks-graphic.jpg)