Impact of Menu Labeling Healthy Eating on Consumer...
23
Abstract More and more chain restaurants and cafeterias are labeling menus to provide consumers with calorie and other information about standard menu items. is trend is driven by the adoption of menu labeling regulations and other policies by states, localities, and institutions as they seek to prevent and reduce obesity. e Patient Protection and Affordable Care Act requires chain restaurants with 20 or more outlets to list calories and other nutrition information on menus and menu boards. Evidence about the impact of menu labeling on customers’ purchase intentions as well as on actual purchases and their corresponding calories is growing. is research review summarizes new information published since the last Healthy Eating Research (HER) review of this topic in 2009. Key findings from this review show that there is a high degree of public support for providing nutrition information at the point of purchase, and menu labeling in cafeterias and restaurants increases consumers’ awareness of nutritional information. While the review finds that the evidence about the impact of menu labeling on calories purchased or menu items selected is mixed, it also finds that menu labeling may impact some customers and types of menu items more than others, and menu labeling may have a positive influence on the nutritional content of menu items and restaurant environments (e.g., reduction in promotion of less healthy foods). Introduction Menu labeling, the practice of providing information about calories, fat, sodium, or other selected nutrients in menu items at points of purchase, is one strategy in a broad spectrum of efforts to reduce rates of obesity and diet-related chronic diseases in the United States. Since many Americans consume foods away from home, access to nutrition information at points of food and beverage purchases may help consumers make healthier choices. Menu labeling regulations for chain restaurants, usually in the form of calorie information at the point of purchase, have been adopted by more than 20 states and localities and implemented in 11 states or local jurisdictions. e Food and Drug Administration is expected to finalize national menu labeling regulations in 2013. e Patient Protection and Affordable Care Act requires restaurant Impact of Menu Labeling on Consumer Behavior: A 2008–2012 Update Healthy Eating Research Building evidence to prevent childhood obesity Research Review, June 2013 chains (and similar retail food providers) with 20 or more outlets to clearly and conspicuously post on all menus and menu boards the number of calories contained in each menu item. e law also requires vending machine operators with at least 20 machines to post calorie information next to each item. 1 Many institutions (e.g., hospitals, government cafeterias) have already implemented their own menu labeling policies. Menu labels can appear on menu boards, food tags (cards with nutritional information placed next to food items in display cases or cafeteria lines), or printed menus. e specific information and display requirements vary and are largely dependent upon the policy in the jurisdiction Healthy Eating Research A National Program of the Robert Wood Johnson Foundation
Transcript of Impact of Menu Labeling Healthy Eating on Consumer...

Abstract
More and more chain restaurants and cafeterias are labeling menus to provide consumers with calorie and other information about standard menu items. This trend is driven by the adoption of menu labeling regulations and other policies by states, localities, and institutions as they seek to prevent and reduce obesity. The Patient Protection and Affordable Care Act requires chain restaurants with 20 or more outlets to list calories and other nutrition information on menus and menu boards. Evidence about the impact of menu labeling on customers’ purchase intentions as well as on actual purchases and their corresponding calories is growing. This research review summarizes new information published since the last Healthy Eating Research (HER) review of this topic in 2009. Key findings from this review show that there is a high degree of public support for providing nutrition information at the point of purchase, and menu labeling in cafeterias and restaurants increases consumers’ awareness of nutritional information. While the review finds that the evidence about the impact of menu labeling on calories purchased or menu items selected is mixed, it also finds that menu labeling may impact some customers and types of menu items more than others, and menu labeling may have a positive influence on the nutritional content of menu items and restaurant environments (e.g., reduction in promotion of less healthy foods).
Introduction
Menu labeling, the practice of providing information about calories, fat, sodium, or other selected nutrients in menu items at points of purchase, is one strategy in a broad spectrum of efforts to reduce rates of obesity and diet-related chronic diseases in the United States. Since many Americans consume foods away from home, access to nutrition information at points of food and beverage purchases may help consumers make healthier choices. Menu labeling regulations for chain restaurants, usually in the form of calorie information at the point of purchase, have been adopted by more than 20 states and localities and implemented in 11 states or local jurisdictions. The Food and Drug Administration is expected to finalize national menu labeling regulations in 2013. The Patient Protection and Affordable Care Act requires restaurant
Impact of Menu Labeling on Consumer Behavior: A 2008–2012 Update
Healthy EatingResearchBuilding evidence to prevent childhood obesity
Research Review, June 2013
chains (and similar retail food providers) with 20 or more outlets to clearly and conspicuously post on all menus and menu boards the number of calories contained in each menu item. The law also requires vending machine operators with at least 20 machines to post calorie information next to each item.1 Many institutions (e.g., hospitals, government cafeterias) have already implemented their own menu labeling policies.
Menu labels can appear on menu boards, food tags (cards with nutritional information placed next to food items in display cases or cafeteria lines), or printed menus. The specific information and display requirements vary and are largely dependent upon the policy in the jurisdiction
Healthy Eating Research A National Program of the Robert Wood Johnson Foundation

2 Impact of Menu Labeling on Consumer Behavior | Research Review | June 2013
or institution in which the food service site is located. Nearly all menu labels include calorie information, some add other nutrient information (e.g., for sodium, fats, or carbohydrates), and a few have used “healthy item” symbols.
In 2009, the HER research synthesis on menu labeling found the following:
�� most restaurants do not provide nutrition information at point of purchase despite consumer interest in having such information available;
�� consumers underestimate calories and fat in away-from-home foods;
�� menu labeling reduces intentions to order high- calorie items;
�� how and which consumers use menu labeling information is unclear; and
�� the impact of menu labeling on food and beverage choices and their related nutritional quality are uncertain (particularly in real-world restaurant settings).
This research review provides an update to the 2009 synthesis. Examining the impact of restaurant and cafeteria menu labeling on consumer behavior, researchers reviewed survey-based, laboratory simulation, and field studies published from January 2008 to August 2012.
Methodology
We used a structured approach to locate and review studies assessing the effects of menu labeling in food service settings (restaurants and cafeterias) and laboratory settings on awareness of nutrition information, intent to use this information, actual use of this information, energy content (calories) of items purchased, and types of items purchased. We searched for studies (Tables 1 & 2) published during the years 2008 to 2012 with PubMed using keywords (menu labeling, nutrition labeling, calorie labeling, restaurant, cafeteria, hospital, school, fast food, and energy intake) and also using Medical Subject Headings (MeSH) for food labeling and restaurants. Both authors reviewed the retrieved abstracts to identify relevant publications. We then used the PubMed “find related data” feature to search for additional studies for each of the relevant studies and scanned the references contained in these publications. We completed the searches in
August 2012. We also searched Google using similar keywords to identify unpublished studies, including theses, dissertations, news stories, and reports. For each combination of search terms, we reviewed the first 250 Google search results based on keyword relevance.
We abstracted pertinent information from each included study (e.g., setting and sample, dates of study, study design, sample size, description of intervention for intervention studies, outcomes measured, and summary of results), and compiled notes on additional salient findings. Table 1 includes survey and simulation studies, and Table 2 includes those occurring in real-world settings. Studies on purchase intentions and consumption within investigational settings ranged from cross-sectional surveys to laboratory-based manipulation of presentation of calorie and other nutritional information. Studies of menu labels in real-world settings have occurred in cafeterias at higher-education institutions and worksites and, more recently, in chain restaurants in jurisdictions that have implemented menu labeling regulations. These real-world studies employed varying designs, including pre-post single group and intervention/comparison groups, time-series analysis with and without a comparison group, randomized controlled experimental studies, and single time point descriptive surveys. We assumed that simulation studies using interventions most comparable to the experience of menu labeling in the real world and evaluating actual purchased calories, rather than just hypothetical or future intentions, more accurately capture the actual impact of menu labeling. In developing our key research findings and conclusions, we qualitatively gave greater weight to studies that occurred in real-world settings and those that included pre-post data and/or a comparison group.
Key Research Results
�� Most customers and the majority of the general public want restaurants and cafeterias to have menu labeling.
�� Customers rarely seek out nutrition information from sources not available at the point of purchase (e.g., websites, brochures), but they do see menu labels at the point of purchase and those labels increase their awareness of nutritional information.
�� Evidence from surveys and simulation studies suggests menu labeling reduces calories purchased or consumed, but evidence from real-world cafeteria and restaurant studies regarding calories purchased or menu items selected is mixed.

3 Impact of Menu Labeling on Consumer Behavior | Research Review | June 2013
��The impact of menu labeling is not uniform. It may have a greater effect on women than men, on higher-calorie items, and among certain types of restaurant chains.
��The optimal format for providing nutritional information on menus is not known, but providing calories, use of “healthy choice” symbols, displaying total caloric intake needs, and presenting items in order of caloric content might have some effects on reducing calories purchased.
�� Emerging evidence suggests that menu labeling does not impact revenue, and could have positive effects on the reformulation of menu items and other aspects of the restaurant environment (e.g., promotion and signage).
�� Menu labeling may result in lower total daily caloric intake by influencing customers’ food choices apart from those made in the restaurant or cafeteria with labeling, but more definitive evaluation of this is warranted.
Studies Supporting Key Research Results
Most customers and the majority of the general public want restaurants and cafeterias to have menu labeling.
�� U.S. consumers continue to express a strong interest in having nutrition information, particularly calorie information, on restaurant menus or otherwise near the point of purchase. Among a representative sample of U.S. adults, 76 percent indicated such information would be at least somewhat useful in making lower-calorie choices.2 In New York City, 84 percent of residents perceived it as helpful after a menu labeling regulation was implemented,3 and 93 percent of a public health clinic sample saw menu labeling as important.4 This latter sample also reported high interest in regulations that require restaurants to post calorie information (86%), instead of voluntary posting. Additional surveys also show high levels of support for menu labeling regulations, ranging from 64 percent to 90 percent.5-7
�� Although little studied, there appears to be growing international interest in menu labeling. A U.K. study found moderate interest (42% to 65% dependent upon setting and type of nutrition information) in menu labeling in away-from-home food establishments.8 An Italian university cafeteria study found “a lot” of interest among 56 percent of customers in nutrition
information and more than 95 percent of this sample reported that nutrition information about cafeteria menu items was at least somewhat useful.9 Health professionals outside the United States are encouraging their governments to adopt menu labeling at restaurant and other food venues, despite industry opposition.10
��Without regulations or other requirements to post information, the likelihood of voluntary posting of information is low, although some establishments have begun posting in anticipation of regulations. Prior to implementation of a menu labeling regulation in King County, Washington, only 3 of 50 chain restaurants had implemented menu labeling.11 A 2009 study examining children’s menus in London found that two-thirds of restaurants did not provide onsite nutrition information and less than half provided nutrition information online.12
��There are segments of the population that report greater interest in menu labeling. The interest in and belief that menu labeling information would change personal food choices is higher among women than men.4,8,13 Women also perceive menu labeling in chain restaurants as more useful than men and report being more likely to pay attention to menu labeling.2,4
�� Information on, interest in, or use of menu labeling across other demographic groups is quite limited. Bleich and Pollack2 found that Black and Hispanic respondents reported being more likely to choose to eat at restaurants with menu labeling than Whites. Mackison and colleagues8 reported that among a U.K. sample, those more interested in eating healthfully, the more affluent, and younger respondents were more interested in having menu labeling available.
Customers rarely seek out nutrition information from sources not available at the point of purchase (e.g., websites, brochures), but they do see menu labels at the point of purchase and those labels increase their awareness of nutritional information.
�� Customers are much more likely to see nutrition information if it is posted on menu boards at points of purchase compared with other locations (e.g., pamphlets, websites). In an observational study conducted in eight chain restaurants that had nutrition information on site (e.g., in pamphlets, on-site computer) prior to any requirements to post information at point of purchase (e.g., on menus or menu boards), less than one percent of patrons in each establishment actually looked at the nutrition information.7

4 Impact of Menu Labeling on Consumer Behavior | Research Review | June 2013
�� Prior to menu labeling in New York City, Subway restaurant patrons were much more likely to report seeing calorie information posted voluntarily, compared with patrons at other chains that were not providing such information at point of purchase or anywhere on site (32% vs. 4%).14
�� After posting menu labels at the point of purchase, studies have found that between half and two-thirds of customers report seeing calorie information.11,15-18
�� Individuals provided calorie information on menus more accurately estimate the calories they consume from their menu selection than customers lacking such information.6,19,20
Evidence from surveys and simulation studies suggests menu labeling reduces calories purchased or consumed, but evidence from real-world cafeteria and restaurant studies regarding calories purchased or menu items selected is mixed.
�� Across the cross-sectional surveys presented in Table 1, more than 60 percent of each sample indicated that they would use menu labels if they were available to make healthier choices. Surveys also show that among those seeing calorie information at restaurants, about one-third report that it influenced their choice of items purchased,11,15-17 and some studies have reported higher rates of influence.18,21 The majority of survey-based studies employing hypothetical menu choices in Table 1 found that menu labeling was associated with lower (cross-sectional studies) or decreased (pre-post studies) purchase intentions or calories purchased. However, in some instances this effect was only present for certain subgroups, such as among those motivated to seek nutrition information22 or in situations when actual calories on the menu label exceeded expected calories.23 Only one of the survey-based studies in Table 1 failed to find an effect of exposure to calorie information.24
��The five simulation studies in Table 1 generally found fewer calories ordered or consumed in the laboratory among participants who were provided calorie information compared with those who were not. However, in three of these studies, lower calories were only observed for subsets of the samples, such as lean women.25 A simulated study taking place in a single sandwich restaurant in which subjects were recruited to order from an experimental menu found that providing calorie information alone reduced calories purchased and an additive effect was seen when subjects also were informed about the daily recommended caloric intake.26
Simulation studies such as these show larger impacts of menu labeling relative to those taking place in real-world settings.
�� Table 2 includes evaluations in real-world settings (i.e., actual cafeterias and restaurants rather than laboratory settings) where labels were added to menus in either experimental studies or as required by regulations.
�� A number of studies in cafeterias and restaurants have examined the effects of voluntary provision of menu labeling. Studies in cafeterias show small decreases of 10 to 20 calories per meal.27 Additional controlled cafeteria studies show an increase in sales of healthier items compared with less healthy ones.17,28 A recent uncontrolled study of voluntary labeling in locally owned restaurants showed a decrease in calories of entrees purchased, and a larger decrease of 75 calories among the 20 percent of patrons who used the labels.18 A short-term uncontrolled study at a club restaurant did not detect an effect of labeling.29 Small controlled studies in restaurants (with labeling introduced as part of a field experiment) have shown reductions in calories purchased.26,30
�� Studies that measure calories purchased before and after implementation of chain restaurant menu labeling regulations have shown mixed results. Four out of five controlled studies that compare restaurant patron choices in jurisdictions with and without menu labeling regulations before and shortly after menu labeling implementation have not found a relative reduction in calories purchased.16,21,31,32 One controlled study did find a small effect on calories purchased among food items in a coffee chain.33
��The controlled studies to date have examined effects within the first six months of menu labeling regulation enforcement. Uncontrolled studies in jurisdictions that have implemented menu labeling regulations for chain restaurants in which data were collected more than six months after implementation show small decreases in mean calories purchased, compared with mean calories purchased from before menu labeling (14 to 38 calories).11,34 A cross-sectional study comparing calories purchased in burger chain restaurants in New York State counties that had implemented labeling for varying periods of time compared with other counties that did not implement found that customers in counties with labeling purchased 60 fewer calories per meal.35

5 Impact of Menu Labeling on Consumer Behavior | Research Review | June 2013
��The evidence on using symbols to indicate nutritional quality, instead of numeric calorie information, is unclear. One recent study found an increase in healthy choices and a decrease in unhealthy choices with symbols labeling in a cafeteria setting,28 while others did not.36,37
��The current evidence on menu labeling impacts on calories purchased is mixed. On balance, it suggests that in the long-term, labeling may yield small decreases in calories purchased, but more evidence from controlled trials is needed to determine whether greater time or other factors are critical to labeling having an impact on consumer choices.
The impact of menu labeling is not uniform. It may have a greater effect on women than men, on higher-calorie items, and among certain types of restaurant chains.
�� Gender is associated with the effectiveness of menu labeling. In most studies, more women than men report seeing and using menu labels, and the calories women purchase decrease more when calorie information is posted.2,11,13,38,39 Women also are less likely to purchase higher-calorie menu items than men when calorie information is made available.38,40 However, in one evaluation of menu labeling in New York City, there were no gender differences in seeing versus not seeing menu labeling information, but among those seeing it, men reported using menu labels more often than women.15 In two additional New York City studies there were no differences in calories purchased by gender.16,34 A King County, Wash., study found that women did not purchase fewer calories four to six months after a restaurant menu labeling regulation was implemented, but eventually purchased fewer calories 1.5 years later.11
��There are limited, experimental data on the differential impact of menu labeling by age. In a hypothetical menu study in which parents selected menu items for their children ages 3 to 6, a menu with labels resulted in lower calories ordered than a menu without labels.41 However, in a second real-world study, the caloric content of actual purchases for children’s foods and beverages did not decrease for older children (ages 6 to 11) from before to after menu labeling.21 Older children are the predominant decision-makers for their meals in out-of-home settings21 and may be less able or willing to use menu labels to make healthful choices.
�� Other studies suggest that an individual’s level of dietary restraint may be more influential than gender on purchase intentions and actual caloric consumption.42 More motivated and health-conscious diners show greater reductions in intentions to purchase higher-calorie items.22,23 In a simulation study, Temple and colleagues25 found that only lean women responded to menu labeling by reducing caloric consumption, with no changes among obese women, or obese or lean men.
�� Menu labeling may have a differential effect on the purchase of specific menu items. For example, it may produce the largest decreases in purchases of higher-calorie items, as well as items for which posted calories exceed customer expectations of caloric content (see Table 1). For example, if deli sandwiches are perceived as generally lower in calories than burger items, but are actually similar calorically, the evidence suggests that sandwich purchases would decrease more relative to burger purchases after menu labeling that shows their similar caloric content.
��The impact of menu labeling in restaurants may vary by chain type. For example, in New York City, significant decreases in calories purchased (44 to 80 calories) occurred after regulation implementation in three chains (Au Bon Pain, KFC, and McDonald’s), increased in one (Subway) and did not change in seven chains.34 In King County, Wash., calories purchased decreased in coffee and taco chains, but not burger and sandwich chains.11 Some of this variation may be attributable to promotional activities. For example, Subway introduced its foot-long special promotion as labeling was rolling out in New York City, driving customers to choose larger sandwiches.
The optimal format for providing nutritional information on menus is not known, but providing calories, use of “healthy choice” symbols, displaying total caloric intake needs, and presenting items in order of caloric content might have some effects on reducing calories purchased.
�� Respondents in survey studies identify calories as the information on menu labels that would have the greatest influence on item selection.43,44 In terms of how calories are displayed, in a U.S. adult sample, Bleich and Pollack2 found an almost equal split in the preference for labeling format among 1) number of calories, 2) physical activity equivalent for the number of calories in the item (e.g., to burn off the calories in a burger it would take 8 miles of walking), or 3) percentage of recommended total daily energy intake. In another

6 Impact of Menu Labeling on Consumer Behavior | Research Review | June 2013
study, when asked to compare a menu that provided calorie information for each menu item with a menu that provided the number of minutes of running that would be required to burn the calories contained in each menu item, 71 percent of participants preferred the calorie information over the physical activity information.45
�� Hwang and Lorenzen5 found that respondents perceived menu labeling that provided multiple types of nutrition information (e.g., calories, sodium, and fat) to be more effective and credible than those providing only one type of nutrition information. However, they tested greater amounts of nutrition information for only one menu item, rather than trying to provide all this detailed nutrition information for all items.
�� Combination meals and items for which the caloric content can vary substantially depending on flavors, varieties, sides, and other customizations present special challenges. For example, a review of menus boards in twelve New York City restaurants found that the majority of items displayed a calorie range rather than a single value (e.g., range for drinks from diet to regular versions), making it impractical for a customer to determine the caloric content of a specific item.46
�� Using symbols to identify healthy items is an alternative to providing numerical calorie information. In a laboratory simulation study, Temple and colleagues25 found that “traffic light” labeling of foods reduced the overall “red” food calories purchased and increased calories from “green” foods. Ellison,47 in a small single restaurant study, found that adding a healthy choice symbol to numeric calorie information yielded greater decreases in calories purchased, but did not describe the statistical significance of the results. Colby and colleagues40 found that having a “better for you” symbol for lower-calorie and more healthful menu items was related to the intention to purchase foods with the lowest calories compared with purchase intentions when seeing other types of calorie/nutrient labeling. Interestingly, these investigators found that 78.1 percent of their college student sample reported noticing nutrition information when only calories were on the menu, but only 22.5 percent of participants reported noticing nutrition information when the “better for you” symbols were present. Two small European studies found no effects of a symbol on mean calories of meals sold36 or types of items sold.37
�� Some studies have explored whether adding a statement about daily recommended calories to menus alters the
impact of labeling individual menu items. Girz and colleagues42 found no differences in calories consumed whether or not menu labels were accompanied by a recommended daily calorie message. Similarly, Roberto and colleagues19 found no difference in calories ordered or consumed in a laboratory simulation study meal between subjects exposed to menu labels versus menu labels plus a daily calorie recommendation. However, they did observe that those exposed to the daily calorie recommendation consumed fewer overall calories when summed across the study meal and food consumed later in the day. If a recommendation about caloric intake is provided, it is uncertain how best to provide this information. In one study, investigators compared two approaches to providing caloric reference information on the menu (average daily calorie needs per day vs. per meal), and 61.3 percent of subjects preferred the calorie needs-per-meal format.45
�� Another aspect of menus that could be manipulated to influence food item choice is the presentation order of items. Listing healthy sandwich choices on the front page of a menu was significantly associated with purchase of lower-calorie sandwiches, whereas putting caloric information for the sandwiches on the menu was not.30 A follow-up study found that while provision of caloric information did decrease total calories purchased (via decreasing calories of beverages and side dishes), position in menu also independently reduced calories.26 A survey-based study by Liu and colleagues6 found that calorie posting alone was not related to selecting fewer calories among hypothetical menu choices, but having calorie-labeled menu items ranked in lowest to highest caloric order and additionally indicating the healthfulness of menu items with colored symbols (green for lower calorie, red for higher-calorie) was related to selecting fewer calories relative to not menu labeling. Thunstrum36 also found that position on menu affected choice.
Emerging evidence suggests that menu labeling does not impact revenue, and could have positive effects on the reformulation of menu items and other aspects of the restaurant environment (e.g., promotion and signage).
�� Limited data suggest that caloric content of menu items in some restaurant chains may be decreasing in recent years, although it is not clear whether this trend is directly attributable to menu labeling. Many chains have reported introducing lower-calorie items and options (including Cosi’s, Starbucks, Applebee’s, Burger King, Kentucky Fried Chicken, McDonald’s, Taco Bell, Subway, and Long John Silvers). Bruemmer,48 in

7 Impact of Menu Labeling on Consumer Behavior | Research Review | June 2013
an uncontrolled study, reported decreases in calories, saturated fats, and sodium for chain restaurant entrée items between 6 and 18 months following implementation of a menu labeling regulation in King County, Wash.
�� Saelens and colleagues49 found some improvements in other aspects of restaurant environments in King County, Wash., chain restaurants, particularly food-oriented rather than coffee-oriented establishments, after implementation of a menu labeling regulation. Relative to similar restaurants over a similar amount of time in unregulated Multnomah County, Ore., promotion of unhealthy eating decreased (e.g., signage/promotion to overeat) in King County restaurants with required menu labeling, although this was not accompanied by the introduction or promotion of the more healthful options.
�� Although the evidence is limited, existing studies suggest no or minimal overall reductions in revenue33,47 or decreases in overall transactions27,50 as a result of menu labeling.
Menu labeling may result in lower total daily caloric intake by influencing customers’ food choices apart from those made in the restaurant or cafeteria with labeling, but more definitive evaluation of this is warranted.
�� Even if menu labels induce customers to reduce caloric consumption in restaurants, there is little evidence regarding the effect of menu labels on total daily calorie intake. In an experimental study of 50 subjects, there was lower caloric consumption for the rest of the day after leaving the experimental setting among participants provided calorie and other nutrition information about the lunch they consumed, although this lunch was selected to be generally higher in calories than expected.22 In the same study, consumption of snack food during a taste test following lunch also was lower among participants who received nutrition information about the lunch. In a laboratory meal study, Roberto and colleagues19 found that menu labeling (when accompanied by information about recommended daily caloric intake) was related to lower subsequent calorie intake based on participant report of calories eaten that day after leaving the laboratory.
�� Bollinger and colleagues33 observed an increase in the proportion of customers rating health and nutrition as an important factor in food choice after menu labeling was implemented, suggesting that exposure to
nutritional information in restaurants may influence food choices in other venues.
Conclusions
Menu labeling, especially in restaurants, is a relatively new intervention for reducing consumption of calories and potentially other less healthy nutrients such as fats and sodium. Whether or not menu labeling has an immediate impact on caloric intake, consumers want to have easy and clear access to information on calorie and nutrient content of foods and beverages. It is also important to note that menu labeling does not exist in isolation. Decades of exposure to television advertising and pricing specials have influenced and continue to influence consumer choices to create brand and product loyalties. Those marketing efforts often do not include calorie or nutrient information. The effect of a few months and even a few years of menu labeling at the point of purchase has to be measured in the context of the powerful and pervasive forces shaping consumers’ decisions present long before entering a food establishment.
Current evidence suggests that menu labeling produces modest 10 to 20 calorie-per-meal reductions in purchases when assessed among all customers. Customers who report using labels order substantially fewer calories (100+ calories-per-meal reductions among the 15% to 20% of customers who report using the information), perhaps because those who use labels are more inclined to seek healthier choices, and the label information enables them to do so. Given the tens of millions of Americans who regularly eat at chain restaurants, the number of people who could benefit from menu labeling is large. While this update of the evidence regarding the effectiveness of menu labeling demonstrates a significant increase in empirical knowledge of this topic, much remains unknown. Our conclusions are based on the best available studies and are subject to revision as more robust data become available.
�� Menu labeling is likely to cause small, but meaningful, reductions in calories purchased at chain restaurants and cafeterias overall and particularly for the 15 percent to 20 percent of patrons who see and use the labels (potentially millions of people once labeling is required nationwide). Thus menu labeling is a strategy with the potential for broad reach. However, factors other than nutritional and health concerns, including taste, price, and convenience, may shape choices to a greater extent than nutrition information provided at point of purchase for many customers, thus limiting the impact of menu labeling.

8 Impact of Menu Labeling on Consumer Behavior | Research Review | June 2013
��The full impact of menu labeling will not be apparent until chains throughout the country comply with the anticipated federal menu labeling regulations. In response to more widely implemented menu labeling, customer awareness and use of labels may increase and restaurants may reformulate menu items and reduce portion sizes at a more rapid pace, thus making additional lower-calorie options available.
�� Some subsets of diners may be more likely to use menu labels (e.g., women, those who are motivated and health conscious, or overweight individuals), and the impact of menu labels may be greater for certain menu items (e.g., those with caloric content exceeding consumer expectations), and perhaps in certain types of restaurants.
�� Menu labeling is only one of many interventions to reduce energy intake and should be viewed in the context of a broader set of strategies.51 Some of these strategies focus on what happens in restaurants (i.e., reducing portion sizes, changing the default side items in combination meals, proportional and relative pricing of healthy versus unhealthy options, or increased promotion of healthier menu items). Other strategies address the wide range of food sources and nutrition behaviors outside the restaurant setting.
Policy Implications
��The Food and Drug Administration (FDA) should promptly finalize comprehensive menu labeling regulations for chain restaurants.
��The FDA should extend menu labeling to other sites serving standard food and beverage items, including movie theaters and supermarkets selling take-out food.
�� Other establishments not included in the federal regulations, such as non-chain restaurants, schools, hospitals, and other institutions with cafeterias, should implement menu labeling on a voluntary basis.
��The FDA should sponsor research on the most effective format for menu labeling and update regulations accordingly.
�� National menu labeling should be accompanied by a public awareness and education campaign on the presence and use of menu labeling, being sure to include
tailored messages for non-English speakers and other subgroups.
Future Research Needs
Further research in the following areas would increase our knowledge about the impact of menu labeling and how to increase its effectiveness.
�� Studies with stronger designs would provide more definitive information about the impact of labeling. Incorporating comparison groups in the study design, accounting for clustering of data from individual customers when the sampling unit is the food service establishment, assessing food and calories consumed (rather than just purchased), assessing total 24-hour and perhaps even longer caloric intake (food from restaurant as well as other sources), and evaluating effects for longer time periods before and after implementation of menu labeling would generate more robust findings.
�� More research in real-world settings is needed to identify the optimal format and content of menu labels, presentation of recommended daily or per-meal caloric intake, and overall menu format in order to maximize effectiveness of menu labeling. For example, exploring the impact of different options for providing calorie information for combination meals would be useful.
�� More information is needed about the type of consumer education and optimal method of providing it to increase motivation to use menu labeling. It appears that this motivation needs to go beyond simple nutrition knowledge or ability to understand menu labels. The effect of tailoring this information to customers is unknown. Of particular interest would be studies of how schools could incorporate reading, interpretation, and use of menu labels (and nutritional information in general) into health and math curricula.
�� It is unknown if menu labeling will lead to consistent and sustained supply-side changes at restaurants, including types of items on menu, item mix, portion size, pricing, and promotions.
��The impact of menu labeling on middle and high school cafeteria purchases is unknown. Published studies to date have included only higher education institutions.
�� Better understanding of the differential effects of menu labeling among specific subgroups of the population, including children and adults with nutrition-related

9 Impact of Menu Labeling on Consumer Behavior | Research Review | June 2013
chronic diseases such as diabetes, obesity, and hypertension would be useful. Whether menu labeling is equally effective for racial/ethnic minorities most affected by obesity compared with Whites is unknown. Whether menu labeling is more effective for specific types of foods and beverages or restaurant types also remains to be determined.
��There is minimal information available regarding the effect of posting non-calorie information on menu labels, in part because most studies and regulations to date have targeted calorie posting. One survey study found that purchase intentions for higher-sodium foods were lower after disclosing sodium information, although this shift occurred only among hypertensive individuals.52
��Whether it is possible and cost-effective to overcome the barriers of expanding menu labeling to local, non-chain restaurants and to other settings, such as theaters and grocery stores, merits study.53 Should such an expansion focus on items with readily defined nutritional content (e.g., beverages) or extend to all items?
Prepared by James Krieger, MD, MPH, Public Health - Seattle and King County, and Brian E. Saelens, PhD, Seattle Children’s Hospital and Research Institute and the University of Washington.
Peer review was provided by Brian Elbel, PhD, MPH, New York University School of Medicine and Wagner School of Public Service; Tracy Fox, MPH, RD, Food, Nutrition, and Policy Consultants LLC; and Lynn Silver Chalfin, MD, MPH, Sonoma County.
Suggested Citation
Krieger J and Saelens BE. Impact of Menu Labeling on Consumer Behavior: A 2008-2012 Update. Minneapolis, MN: Healthy Eating Research: 2013. Available at: http://healthyeatingresearch.org/.

10 Impact of Menu Labeling on Consumer Behavior | Research Review | June 2013
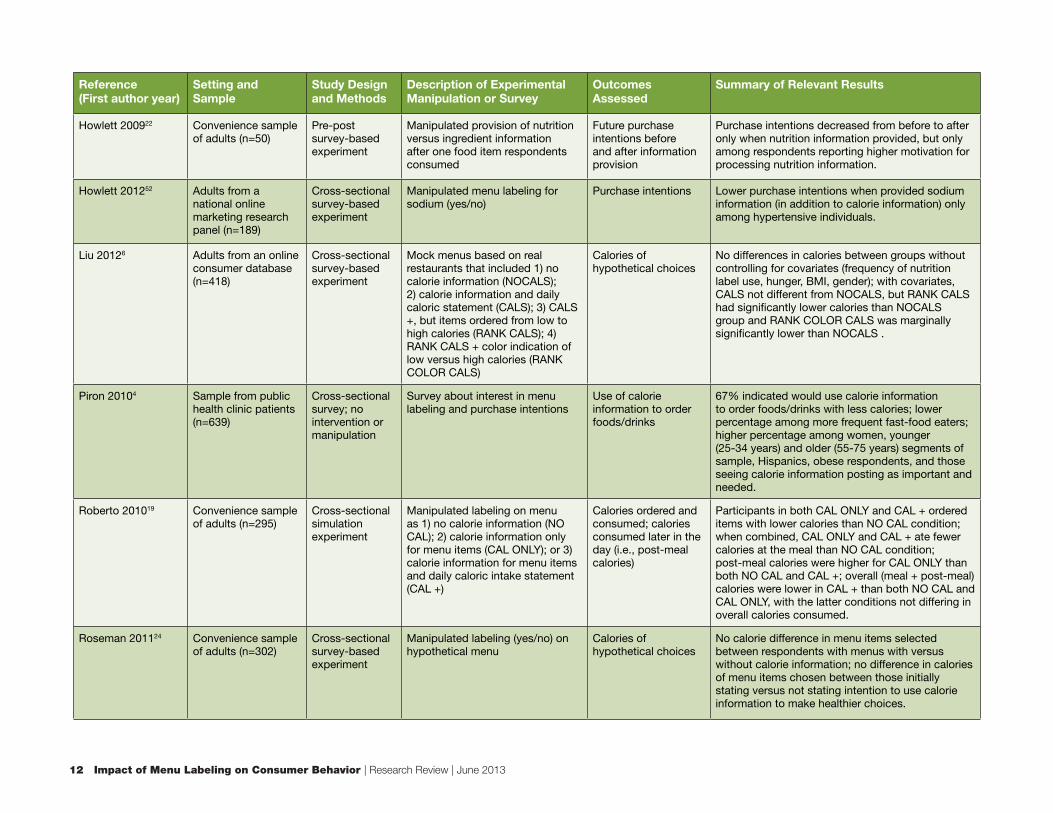
Table 1. Survey (purchase intentions of hypothetical choices) and simulation (actual food purchased or consumed) menu labeling studies (published 2009–2012)
Reference (First author year)
Setting and Sample
Study Design and Methods
Description of Experimental Manipulation or Survey
Outcomes Assessed
Summary of Relevant Results
Avcibasioglu 201113 Convenience sample (n=69) of business students
Cross-sectional survey; no intervention or manipulation
Survey about awareness of, support of, and possible impact of pending California menu labeling law
Intentions to change purchase if provided calorie information and respondents’ own typical meal was higher in calories than expected
62% indicated would change meal, with a high level of intention to order lower-calorie alternatives or eliminate some items.
Bates 200938 Convenience samples of college students (n=68) and adults (n=162)
Cross-sectional survey-based experiment
Menu options differed in 1) nutrition/calorie labeling or not, 2) healthfulness of menu items; gender examined as other factor
Purchase intentions Purchase intentions became lower when respondents received calorie information, particularly for less healthy menu options that were initially considered more healthy (e.g., salad with dressing, cheese, meat).
Bates 201154 More than 500 total quick-service dining experiences from 155 respondents from aSouthern university
Pre-post survey Collected food diaries for all fast-food meals from week before; Intervention was viewing restaurant website to see calorie/sodium/fat content of meals purchased in prior week
Intent to re-purchase meal previously purchased before and after exposure to nutrition information
Exposure to nutrition associated with lower intention to repurchase meal. Repurchase intent also associated significantly with perceived healthfulness of meal (higher intentions if more healthful) and the strength of this association increased after exposure to info; the relationship between perceived taste and purchase intentions was not affected by exposure to info.
Bleich 20102 Random-digit-dialing sample of adults from across the U.S. (n=663)
Cross-sectional survey; no intervention or manipulation
Survey about usefulness of calorie information, impact on intentions to purchase, and preferred type of posting
Purchase intentions 60% reported that calorie information would encourage their purchase of a lower-calorie meal, with bigger impact on women, Blacks, Hispanics, older, and more educated adults relative to their respective counterparts.
Burton 200923 Diary data collection from a convenience sample of college students (n=155), with follow-up survey
Pre-post survey Diary used to establish current fast-food choices; intervention included having respondents visit restaurant websites to obtain nutrition information for their choices; then queried about meal repurchase intentions
Meal repurchase intentions
Decrease in meal purchase intentions from before to after seeing nutrition information, with greater decline for higher calorie meals.
Burton 200923 Survey among adult consumers who are part of a consumer panel (n=363)
Cross-sectional survey-based experiment
Mock menus provided with or without calorie information
Purchase intentions Decrease in purchase intentions among respondents provided calorie information, but only among items for which actual calories exceed expected calories; increase in purchase intentions for items whose expected calories are lower than expectations.

11 Impact of Menu Labeling on Consumer Behavior | Research Review | June 2013
Reference (First author year)
Setting and Sample
Study Design and Methods
Description of Experimental Manipulation or Survey
Outcomes Assessed
Summary of Relevant Results
Burton 200923 Laboratory experiment among convenience sample of college students (n=92)
Pre-post survey-based experiment
Manipulated caloric content expectations for hypothetical restaurant
Purchase intentions Observed a decrease in purchase intentions only when the actual calories were higher than expected calories for the hypothetical restaurant.
Colby 200940 Convenience sample of college students (n=464)
Cross-sectional survey-based experiment
Mock menus provided with 1) no calorie information (control); 2) only calorie information; 3) absolute and percentage calorie and other nutrition information; 4) a healthy symbol for healthy items; 5) global health index value for each item; or 6) calories, other dietary information, and a “traffic light designation”
Purchase intentions When combined across all types, labeling associated with purchase intentions that were significantly lower in calories than the control condition.
Fawkes 201055 Convenience sample of female college students (n=281)
Cross-sectional survey
Nutrition labels (tags) for 2 weeks for the 3 hot entrees available; labels included calories and other dietary factors
Awareness and reported use of menu labeling information
Among those who saw labels, 51% indicated it “influenced” their purchases; label use was greater among those counting calories and those more concerned about weight.
Giesen 201156 Convenience sample of college students (n=178)
Cross-sectional survey-based experiment
Manipulated price of items (and budget) and whether calorie information was available on hypothetical menu
Calories of hypothetical purchases
Lower calories purchased when calorie information provided; higher price/tax only decreased calories purchased among high-restraint eaters when calorie information was not provided.
Girz 201242 Convenience sample of female college students (n=149)
Cross-sectional simulation experiment
Manipulated provision of calorie information (yes/no) and for those provided calorie information whether the salad or pasta dish was high (1200 cals) or low (600 cals) in calories
Choice of salad or pasta dish; actual caloric consumption
Only respondents with higher dietary restraint chose the salad when calorie information was provided and the salad was lower calorie; lowest amount of calorie intake among restrained eaters who chose salad and were not provided calorie information.
Girz 201242 Convenience sample (n=254) of female and male college students
Cross-sectional simulation experiment
Manipulated provision of calorie information (yes/no) and for those provided calorie information whether the salad or pasta dish was high (1200 cals) or low (400 cals) calorie or both were high calorie, as well as whether daily recommended caloric intake statement was provided (yes/no)
Choice of salad or pasta dish; actual caloric consumption
Women choose lower-calorie salad when having calorie information relative to all other respondents, but only if they had higher dietary restraint; no significant differences in calories consumed by calorie labeling with or without recommended daily calorie message.
12 Impact of Menu Labeling on Consumer Behavior | Research Review | June 2013
Reference (First author year)
Setting and Sample
Study Design and Methods
Description of Experimental Manipulation or Survey
Outcomes Assessed
Summary of Relevant Results
Howlett 200922 Convenience sample of adults (n=50)
Pre-post survey-based experiment
Manipulated provision of nutrition versus ingredient information after one food item respondents consumed
Future purchase intentions before and after information provision
Purchase intentions decreased from before to after only when nutrition information provided, but only among respondents reporting higher motivation for processing nutrition information.
Howlett 201252 Adults from a national online marketing research panel (n=189)
Cross-sectional survey-based experiment
Manipulated menu labeling for sodium (yes/no)
Purchase intentions Lower purchase intentions when provided sodium information (in addition to calorie information) only among hypertensive individuals.
Liu 20126 Adults from an online consumer database (n=418)
Cross-sectional survey-based experiment
Mock menus based on real restaurants that included 1) no calorie information (NOCALS); 2) calorie information and daily caloric statement (CALS); 3) CALS +, but items ordered from low to high calories (RANK CALS); 4) RANK CALS + color indication of low versus high calories (RANK COLOR CALS)
Calories of hypothetical choices
No differences in calories between groups without controlling for covariates (frequency of nutrition label use, hunger, BMI, gender); with covariates, CALS not different from NOCALS, but RANK CALS had significantly lower calories than NOCALS group and RANK COLOR CALS was marginally significantly lower than NOCALS .
Piron 20104 Sample from public health clinic patients (n=639)
Cross-sectional survey; no intervention or manipulation
Survey about interest in menu labeling and purchase intentions
Use of calorie information to order foods/drinks
67% indicated would use calorie information to order foods/drinks with less calories; lower percentage among more frequent fast-food eaters; higher percentage among women, younger (25-34 years) and older (55-75 years) segments of sample, Hispanics, obese respondents, and those seeing calorie information posting as important and needed.
Roberto 201019 Convenience sample of adults (n=295)
Cross-sectional simulation experiment
Manipulated labeling on menu as 1) no calorie information (NO CAL); 2) calorie information only for menu items (CAL ONLY); or 3) calorie information for menu items and daily caloric intake statement (CAL +)
Calories ordered and consumed; calories consumed later in the day (i.e., post-meal calories)
Participants in both CAL ONLY and CAL + ordered items with lower calories than NO CAL condition; when combined, CAL ONLY and CAL + ate fewer calories at the meal than NO CAL condition; post-meal calories were higher for CAL ONLY than both NO CAL and CAL +; overall (meal + post-meal) calories were lower in CAL + than both NO CAL and CAL ONLY, with the latter conditions not differing in overall calories consumed.
Roseman 201124 Convenience sample of adults (n=302)
Cross-sectional survey-based experiment
Manipulated labeling (yes/no) on hypothetical menu
Calories of hypothetical choices
No calorie difference in menu items selected between respondents with menus with versus without calorie information; no difference in calories of menu items chosen between those initially stating versus not stating intention to use calorie information to make healthier choices.

13 Impact of Menu Labeling on Consumer Behavior | Research Review | June 2013
Reference (First author year)
Setting and Sample
Study Design and Methods
Description of Experimental Manipulation or Survey
Outcomes Assessed
Summary of Relevant Results
Tandon 201041 Convenience sample of parents of children ages 3 to 6 in a pediatric health clinic (n=99)
Cross-sectional survey-based experiment
Manipulated labeling (yes/no) on McDonald’s picture menu
Calories of hypothetical menu choices for child and parent, based on parent selection
Parents who were provided calorie information on menus selected menu items for their children that were 102 fewer calories than options for children selected by parents provided menus without calorie information; no difference in calories for parents’ food/drink selections between those provided menus with versus without calorie information.
Temple 201057 Convenience sample at a university (n=47)
Cross-sectional simulation experiment
Manipulated labeling (yes/no) on buffet lunch menu and whether participants saw or did not see video on reading nutrition labels prior to eating lunch
Calories consumed Lower calories among those participants provided menu labeling, with no effect of nutrition labeling video exposure.
Temple 201125 Convenience sample at a university (n=51)
Cross-sectional simulation experiment
Manipulated labeling of foods/drinks during buffet lunch with 1) no information; 2) standard nutrition information; or 3) “traffic light diet” labels (all participants got all conditions in counterbalanced order across three different sessions)
Calories consumed Lower calories with standard or traffic light diet labeling, but only for lean women.
Turconi 20129 Patrons of a university cafeteria (n=374)
Cross-sectional survey
Survey about whether food choices changed after seeing categorized nutritional information about cafeteria meals
Perceived change in food choices
71.4% indicated they had changed food choices since nutrition information was posted.
Wisdom 201026 Single sandwich restaurant, 638 diners (292 in study 1, 346 in study 2)
Cross-sectional simulation experiment
Manipulated 1) daily calorie recommendation provided (yes/no); 2) calorie information for each sandwich, sides, and drinks (yes/no); and 3) asymmetric paternalistic intervention around convenience based on sandwich items menu placement
Calories of selected items
61 fewer calories selected when provided item calorie information; 38 fewer calories selected when provided daily calorie recommendation; additive, not interactive, effects of item calorie and daily calorie recommendation information; lower calories selected worked via decrease in non-sandwich choices; no difference between overweight vs. non-overweight respondents for item calorie labeling in particular.
Yoon 201244 Convenience sample of college students (n=27)
Cross-sectional survey-based experiment
Manipulated labeling as 1) no information; 2) calories only; 3) calories + 6 nutrients; manipulated also the healthfulness of the target item and other items on the menu
Purchase intentions Lower purchase intentions when provided calorie and calorie + nutrient information; lower purchase intentions for both healthy and unhealthy items when provided calorie and calorie + nutrient information if alternatives to the items are healthy.

14 Impact of Menu Labeling on Consumer Behavior | Research Review | June 2013
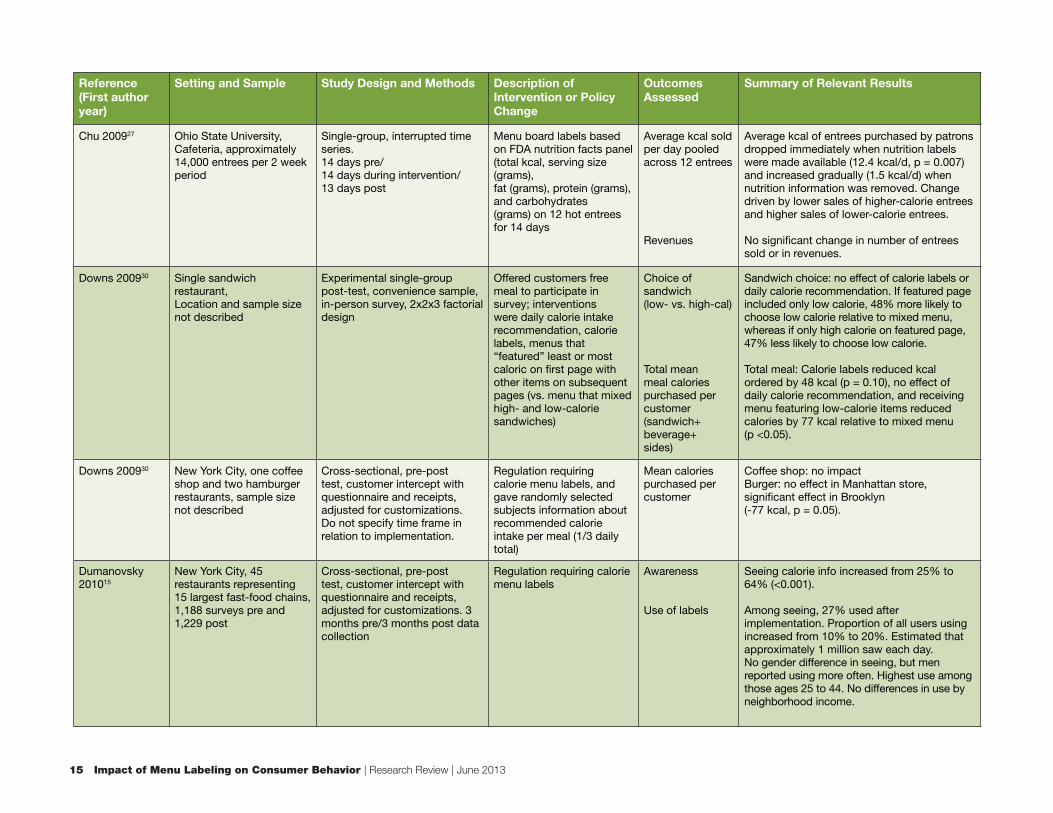
Table 2. Restaurant and cafeteria-based menu labeling studies (published 2008–2012)
Reference (First author year)
Setting and Sample Study Design and Methods Description of Intervention or Policy Change
Outcomes Assessed
Summary of Relevant Results
Bassett 200814 New York City, 11 fast-food chains (275 randomly selected restaurants), 7,318 customers (excluded coffee chains)
Observational, single time-point (pre-regulation) customer intercept with questionnaire and receipts, adjusted for customizations
Baseline before regulation requiring calorie menu labels
Awareness Use of labels Mean calories purchased per customer
32% reported seeing calorie information at Subway vs. 4% at other chains. Of those seeing, 37% reported using. Those seeing and using purchased 99 kcal less than those seeing and not using (p<0.001). Subway patrons seeing calorie info purchased 52 kcal less than those not seeing (p<0.01) and fewer meals >1000 kcal (17% vs. 23%, p <0.01).
Bollinger 201133 New York City,222 Starbucks locations in NYC and 94 Starbucks locations in Boston and Philadelphia (comparison sites) (more than 100 million transactions) AND individual-level data (1.5 million transactions) of anonymous customers using Starbucks cards
Quasi-experimental time series using both aggregate (all) transactions and transactions only from card-holders in secondary analysis (not adjusted for customizations like milk).3 months pre/ 11 months post
Regulation requiring calorie menu labels
Mean calories purchased per transaction Revenues
Average calories per transaction fell by 5.8% (14.4 kcal, p < 0.01) - average order was 247 kcal. Effect was almost entirely related to changes in food choices (13.7% decrease in calories)—there was almost no change in purchases of beverage calories (0.3% decrease). Females were more responsive than males. Larger impact among cardholders (who on average make high-calorie purchases). No impact on Starbucks’ revenues.
Brissette 201335 New York State, 31 restaurants (burger only), 1,049 customers
Observational, single time-point comparison of restaurant customers in counties with and without ML regulations. Customer intercept with questionnaire and receipt, with adjustment for customizations. Duration of ML implementation not described.
Regulations requiring calorie menu labels
Mean calories purchased per customer
Fewer kcal purchased in counties with labels (888.1 vs. 947.7, p = 0.05, 59.6 kcal difference). Those reporting using cal info ordered 84.4 fewer kcal (P <0.01, regression model) controlling for restaurant characteristics, demographics, calorie knowledge, and calorie consciousness (do you consider calories when deciding what to buy?).
15 Impact of Menu Labeling on Consumer Behavior | Research Review | June 2013
Reference (First author year)
Setting and Sample Study Design and Methods Description of Intervention or Policy Change
Outcomes Assessed
Summary of Relevant Results
Chu 200927 Ohio State University, Cafeteria, approximately 14,000 entrees per 2 week period
Single-group, interrupted time series.14 days pre/14 days during intervention/13 days post
Menu board labels based on FDA nutrition facts panel (total kcal, serving size (grams), fat (grams), protein (grams), and carbohydrates (grams) on 12 hot entrees for 14 days
Average kcal sold per day pooled across 12 entrees Revenues
Average kcal of entrees purchased by patrons dropped immediately when nutrition labels were made available (12.4 kcal/d, p = 0.007) and increased gradually (1.5 kcal/d) when nutrition information was removed. Change driven by lower sales of higher-calorie entrees and higher sales of lower-calorie entrees.
No significant change in number of entrees sold or in revenues.
Downs 200930 Single sandwich restaurant, Location and sample size not described
Experimental single-group post-test, convenience sample, in-person survey, 2x2x3 factorial design
Offered customers free meal to participate in survey; interventions were daily calorie intake recommendation, calorie labels, menus that “featured” least or most caloric on first page with other items on subsequent pages (vs. menu that mixed high- and low-calorie sandwiches)
Choice of sandwich (low- vs. high-cal)
Total mean meal calories purchased per customer(sandwich+ beverage+sides)
Sandwich choice: no effect of calorie labels or daily calorie recommendation. If featured page included only low calorie, 48% more likely to choose low calorie relative to mixed menu, whereas if only high calorie on featured page, 47% less likely to choose low calorie.
Total meal: Calorie labels reduced kcal ordered by 48 kcal (p = 0.10), no effect of daily calorie recommendation, and receiving menu featuring low-calorie items reduced calories by 77 kcal relative to mixed menu (p <0.05).
Downs 200930 New York City, one coffee shop and two hamburger restaurants, sample size not described
Cross-sectional, pre-post test, customer intercept with questionnaire and receipts, adjusted for customizations. Do not specify time frame in relation to implementation.
Regulation requiring calorie menu labels, and gave randomly selected subjects information about recommended calorie intake per meal (1/3 daily total)
Mean calories purchased per customer
Coffee shop: no impact Burger: no effect in Manhattan store, significant effect in Brooklyn (-77 kcal, p = 0.05).
Dumanovsky 201015
New York City, 45 restaurants representing 15 largest fast-food chains, 1,188 surveys pre and 1,229 post
Cross-sectional, pre-post test, customer intercept with questionnaire and receipts, adjusted for customizations. 3 months pre/3 months post data collection
Regulation requiring calorie menu labels
Awareness
Use of labels
Seeing calorie info increased from 25% to 64% (<0.001).
Among seeing, 27% used after implementation. Proportion of all users using increased from 10% to 20%. Estimated that approximately 1 million saw each day. No gender difference in seeing, but men reported using more often. Highest use among those ages 25 to 44. No differences in use by neighborhood income.

16 Impact of Menu Labeling on Consumer Behavior | Research Review | June 2013
Reference (First author year)
Setting and Sample Study Design and Methods Description of Intervention or Policy Change
Outcomes Assessed
Summary of Relevant Results
Dumanovksy 201134
New York City, 168 randomly selected locations of the top 11 fast-food chains (3 burger, 2 sandwich, 3 pizza, 2 chicken, and 1 taco). 7,309 adult customers interviewed in pre and 8,489 post
Cross-sectional, pre-post test, customer intercept with questionnaire and receipts, adjusted for customizations. 12 months pre/9 months post data collection
Regulation requiring calorie menu labels
Mean calories purchased per customer
Use of labels
For the full sample, no change from before to after regulation (828 vs. 846 kcal, p=0.22), although a modest decrease was shown in a regression model adjusted for restaurant chain, poverty level for the store location, sex of customers, type of purchase, and inflation adjusted cost (847 vs. 827 kcal, p=0.01). No difference in kcal by gender or by store neighborhood poverty level. Significant decreases in kcal (ranging from 44-80 kcal) in 3 chains that accounted for 42% of sample. 15% of total population used. Users purchased 106 kcal less than those not aware (96 kcal in regression adjusted results).
Elbel 200916 New York City, 14 restaurants from 4 largest chains (McDonald’s, Burger King, Wendy’s, KFC). Newark, New Jersey, 5 restaurants (comparison site). 1,156 adults at fast-food restaurants (total in both waves in both sites).
Cross-sectional, pre-post test, customer intercept with questionnaire and receipts, adjusted for customizations, 4 weeks pre/4 weeks post data collection
Regulation requiring calorie menu labels
Awareness Use of labels
Mean calories purchased per customer
Awareness increased in NYC from 17% to 54%, no change in Newark.
27% of those seeing in NYC used labels, so net increase in those using because awareness increased. No change in calories purchased in NYC or Newark. No differences by gender, race, age.
Elbel 201131 Same as above. 349 children aged 1–17 years who visited the restaurants with their parents (69%, ages 1 to 17) or alone (31%, ages 13 to 17)
Same as above Same as above Awareness
Use of labels Mean calories purchased per customer
57% of adolescents (age 13 to 17) aware in NYC (0% pre). 9% adolescents use (16% of those seeing). No change in kcal purchased in either site.

17 Impact of Menu Labeling on Consumer Behavior | Research Review | June 2013
Reference (First author year)
Setting and Sample Study Design and Methods Description of Intervention or Policy Change
Outcomes Assessed
Summary of Relevant Results
Ellison 201147 Oklahoma,Single restaurant, 1,500 lunch receipts
Experimental post-test study with random assignment of diners to control or one of two intervention groups, receipt data. Timing of data collection not specified. No statistical testing.
Calorie label or calorie label plus traffic light symbol for 12 weeks, then decreased prices of lower calorie items or increased on higher calorie items for 7 weeks
Mean calories purchased per customer
Revenues
Label vs.control: -27.4 kcal Label + symbol vs. control: -55.6 kcal Price reduction low cal: -11.5 kcal Price increase high cal: -22 kcal Revenue per entrée decreased by 2% with label only and 4% with label plus symbol.
Finkelstein 201150
King County, WA, 7 restaurants and 7 controls in adjacent counties from single taco chain, approximately 3 million transactions in each group
Quasi-experimental, pre-post-post test, transaction data, 12 months pre/13 months post
Regulation requiring calorie menu labels
Mean calories purchased per transaction
Transactions per month
No difference in changes in kcal purchased. Decreased transactions in both groups and no difference across groups.
Holmes 201229 Location not described.Full-servicerestaurant of a private club, (only children’s meals), Number of customers/meals not described.
Experimental single site cross-sectional pre-post test, transaction data comparing three sequential, exclusive interventions with no washout period
Calorie and fat labels, then healthy meal symbols, then “nutrition value price” (price/nutritional quality)
Mean calories purchased per customer
Non-significant decrease in calories (4-10 kcal). Significant decrease in calories from combination meals and increase from à la carte meals.
Jensen 200917
California.Kaiser Permanente Hospital cafeterias (5) for 4 weeks at lunchtime, 554 patrons
Quasi-experimental pre-post test cross-sectional customer intercept with questionnaire. Transaction data at 2 sites where available and observation at all 5 sites (staff record what patrons purchase). Pre data weeks 1-4, week 5 implement, post data weeks 9-12
Calorie on menu board plus centrally-located poster with nutrient analysis vs. poster only vs. no intervention. Menu Board = 8.5x11 sign at countertop of each food station with name, calories, price. For beverages, sign on cold cases with average calories per type of drink. Posters “similar to those in fast-food chain restaurants” with nutrient content (calories, fat, sodium, etc.).
Awareness
Use of labels
Proportion of items meeting “healthy” targets for kcal (< 400 kcal for entrée, < 250 kcal for side, < 150 kcal for beverage or snack)
Greater awareness in label+poster sites (69%) vs. poster only (58%), (p<0.05).
Use: 32% of aware (same in both intervention groups). Transaction data showed a significant improvement in purchases of healthier side dishes (increased 4.8% label+poster vs. decreased 4.8% no intervention, p<0.001) and healthier snacks (increased 1.3% vs. decreased 8.1%, p=0.006). No change in entrée selections at either cafeteria. Observation of purchases: no changes at any sites in proportion of healthier items purchased (but insufficient power).

18 Impact of Menu Labeling on Consumer Behavior | Research Review | June 2013
Reference (First author year)
Setting and Sample Study Design and Methods Description of Intervention or Policy Change
Outcomes Assessed
Summary of Relevant Results
Krieger 201311 King County, WA,10 fast-food chains (53 randomly selected restaurants), 7,325 customers
Cross-sectional, pre-post test, customer intercept with questionnaire and receipts, adjusted for customizations. 3 months pre and 18 months post
Regulation requiring calorie menu labels
Awareness
Use of labels Mean calories purchased per customer
Increased from 18.8% to 61.7% in food chains and from 4.4% to 30.0% in coffee chains (both p< 0.001). 1/3 of those aware use labels, with no change over time Decreased from 908 kcal to 870 kcal at 18 months post-implementation (38 kcal, p = 0.06) in food chains and from 154 kcal to 132 kcal (22 kcal, p = 0.002) in coffee chains.
Lowe 201058
Philadelphia,2 hospital cafeterias, 96 employees who ate lunch at least 2x/wk. Excluded if chronic condition or taking medication affecting weight or appetite. 43% lost to follow-up at 12 months
Longitudinal RCT pre-post test with interview, physiologic and transaction data.3 month baseline data collection and 3 month intervention period with data collected during, 6 and 12 months post intervention period
Environmental change (adding some low-calorie items and labels for all items (4 color code and calorie, fat, cholesterol, protein, and energy density (kcal/g))) or environmental change plus education on energy density and labels (4 x 60 min groups) and discounts on low-energy-density foods.
Mean calories purchased per meal
Total calories consumed in 24 hours Physiologic measures (BMI, waist circumference, body composition, lipids, blood pressure)
No diff across groups or over time within groups in kcal per meal (other than decrease within both groups during 3 month baseline period). % of intake from fat decreased in both groups equally during intervention period. No differences across or changes within groups over time in kcal per 24 hour period.
No effects on physiologic measures except environment + education group had increase in HDL and LDL cholesterol relative to environment change only group.
Pulos 201018 Pierce County, WA.Convenience sample of 6 full service, locally-owned restaurants, 16,000 transactions
Cross-sectional, pre-post test customer self-completed survey and transaction data, 30 days pre, 30 days post data collection
Voluntary menu labeling on menus for all food items except daily specials (calories, fat, cholesterol, sodium) in format chosen by each restaurant, usually calories/fat/sodium/cholesterol numbers
Awareness
Use of labels
Mean calories, fat, sodium per entree
Awareness: 71% see info. Younger saw more often, no differences by gender. Use: 20% of all customers reported ordering entrée lower in cal (59% of those who saw labels and understood them). Average entrée sold was 15 kcal lower, 1.5 g fat lower, 45 mg sodium lower, no difference in cholesterol. Since only 20% used, authors suggest 15 kcal x 5 = 75 fewer kcal among users. Decrease in kcal was significant (p < 0.05) in 4/6 restaurants.

19 Impact of Menu Labeling on Consumer Behavior | Research Review | June 2013
Reference (First author year)
Setting and Sample Study Design and Methods Description of Intervention or Policy Change
Outcomes Assessed
Summary of Relevant Results
Tandon 201121 King County, WA (intervention) and San Diego County, CA (control), Children ages 6 to 11 and their parents, with 75 in King County (KC) and 58 in San Diego (SD) eating in fast-food chain restaurants
Quasi-experimental, pre-post, longitudinal study, 1-3 months pre/3-6 months post. Asked cohort members to purchase typical meal using $10 gift card and mail back receipt
Regulation requiring calorie menu labels
Awareness
Use of labels Mean calories purchased per meal
Significant increase in awareness in KC (44% to 87%) but not in SD (40% to 34%). 13% of those who saw in KC used for child meal choice and 45% used for parent meal choice, and % using increased significantly within KC pre vs. post but difference in differences across counties not significant. No change in either site for children, significant 100 kcal decrease in both counties for parents (significant decrease only among overweight/obese but not other parents). No differences across counties.
Thorndike 201228 Boston, MA. Hospital main cafeteria (intervention) and two smaller cafeterias in same hospital (comparison), Approximately 960-990,000 items sold per 3 month period
Single-site cross-sectional pre-post-post. Pre 3 months/post 6 months AND Quasi-experimental cross-sectional pre-post Both used transaction data.
Phase 1: 3 month red/yellow/green healthfulness labels (based on fruit or vegetable, whole grain, lean protein, low-fat dairy, saturated fat, and calorie content) Phase 2: added 3 month choice architecture intervention to increase visibility/convenience of green items (cold beverages, pre-made sandwiches, chips)
Sales from transaction data of bottled water, pre-made sandwiches, chips (other items not available from cash registers electronically)
Pre-post-post study showed increased sales of healthy items and decreased sales of unhealthy items. The choice architecture intervention further improved the effectiveness of labeling. Baseline - Phase 1 - red -9.2% all items, -16.5% bev - yellow +1.2%, -0.2% bev - green +4.5%, +9.6% bev Phase 1 - Phase2 - red -4.9% all items, -11.4% bev - yellow +3.9%, +1.1% bev - green -0.5%, +4.0% bev (all p < 0.001) Quasi-experimental study of beverages, chips, sandwiches:Baseline-Phase 1 - significantly greater decrease in red sandwiches and red chips, and greater increase in green sandwiches in intervention sites, but greater increase in bottled water in comparison sites. Phase 1 – Phase 2-All measures improved significantly more in intervention site.

20 Impact of Menu Labeling on Consumer Behavior | Research Review | June 2013
Reference (First author year)
Setting and Sample Study Design and Methods Description of Intervention or Policy Change
Outcomes Assessed
Summary of Relevant Results
Thunstrom 201136
Southern Sweden,Company restaurant,347 meals sold per day on average.
Single-site cross-sectional pre-post,6 weeks pre/6 weeks post, transaction data.
Point-of-purchase symbol indicating healthy meal choice. 17% of meals sold had symbol. 3 meal choices each day, same price, order on menu was varied over study period.
Number of healthy meals sold
Calories, sodium, cholesterol, fat content of meals sold
Symbol had no effect on sales of meals (i.e. presence of symbol did not affect number of healthy meals sold). Meal being last on menu (of three items) significantly (p < 0.001) decreased sales (118 meals less per day relative to top of menu). No significant change in average calories of meals sold (decreased from 520 to 511 kcal), nor in fat, Na, CHO.
Vadiveloo 201159 New York City, 14 restaurants from 4 largest chains (McDonald’s, Burger King, Wendy’s, KFC). Newark, New Jersey (comparison site, 5 restaurants), 1,170 adults (total in both waves in both sites).
Cross-sectional, pre-post, customer intercept with questionnaire and receipts, adjusted for customizations,4 weeks pre/4 weeks post
Regulation requiring calorie menu labels
Types of foods and beverages purchased
Frequency of fast food consumption per week
Awareness Use of labels
Difference in differences across sites: increase in purchases of caloric beverages (p < 0.05) and full-fat salad dressing (p < 0.01) in NYC vs. Newark. Pre-post within NYC: - increase in caloric beverages (p <0.05), regular salad dressing (p < 0.01), - decrease in ordering salad (p < 0.05), dessert (p < 0.10), mean number fast-food dinners/wk (p < 0.10) Post: 65.5% aware, 41% aware but not used, 14.5% aware and used. Among those aware who used labels, more likely to order salad and have fewer fast-food meals per week than those not using. Among those aware who did not use, less likely to eat at fast food and less likely to order caloric beverage than those not aware.
Vyeth 201137 Netherlands,Work site cafeterias (13 intervention, 12 control),Number of transactions not described
Cluster RCT, 3 weeks pre/3 weeks during/3 weeks post,Transaction data.
Label (logo) indicating healthier choices, based on criteria for sodium, added sugar, saturated fat, trans fat, fiber, and calories. Offered one healthier and one regular soup and sandwich every day.
Type of items purchased (choice vs. regular, fried snack foods, fruit, and salads)
No effects in sandwiches, soups. Significant but small (1 cup per 50 employees per week) increase in fruit sales (p < 0.001).
Tables 1 & 2 come from searches for studies published during the years 2008 to 2012 with PubMed using keywords (menu labeling, nutrition labeling, calorie labeling, restau-rant, cafeteria, hospital, school, fast food, and energy intake) and using Medical Subject Headings (MeSH) headings ((*food labeling[MeSH Major Topic]) AND restaurants [MeSH Major Topic]) AND (“2008”[Date - Publication] : “2012”[Date - Publication])).

21 Impact of Menu Labeling on Consumer Behavior | Research Review | June 2013
References1. U.S. Federal Drug Administration. New Menu and Vending Machines Labeling
Requirements 2013. Accessed on 1/27/13 at http://www.fda.gov/Food/IngredientsPackagingLabeling/LabelingNutrition/ucm217762.htm.
2. Bleich SN, Pollack KM. The publics’ understanding of daily caloric recommendations and their perceptions of calorie posting in chain restaurants. BMC Public Health. 2010;10:121.
3. Quinnipiac University Polling Institute. New Yorkers big on sugar drink tax, calorie counts. 2011; http://www.quinnipiac.edu/institutes-centers/polling-institute/new-york-city/release-detail/?ReleaseID=1425.
4. Piron J, Smith LV, Simon P, Cummings PL, Kuo T. Knowledge, attitudes and potential response to menu labelling in an urban public health clinic population. Public Health Nutr. Apr 2010;13(4):550–555.
5. Hwang J, Lorenzen CL. Effective nutrition labeling of restaurant menu and pricing of healthy menu. Journal of Foodservice. 2008;19:270–276.
6. Liu PJ, Roberto CA, Liu LJ, Brownell KD. A test of different menu labeling presentations. Appetite. Epub Aug 20 2012.
7. Roberto CA, Schwartz MB, Brownell KD. Rationale and evidence for menu-labeling legislation. Am J Prev Med. Dec 2009;37(6):546-551.
8. Mackison D, Wrieden WL, Anderson AS. Making an informed choice in the catering environment: What do consumers want to know? J Hum Nutr Diet. Dec 2009;22(6):567–573.
9. Turconi G, Bazzano R, Roggi C, Cena H. Helping consumers make a more conscious nutritional choice: Acceptability of nutrition information at a cafeteria. Public Health Nutr. May 2012;15(5):792–801.
10. MacLeod M. Restaurant industry opposes calorie content disclosure. Can Med Assoc J. Feb 22 2011;183(3):348–349.
11. Krieger J, Chan NL, Saelens BE, Ta M, Solet D, Fleming D. Menu labeling regulation and calories purchased at chain restaurants.. Am J Prev Med. 2013;44(6):595-604.
12. Reeves S, Wake Y, Zick A. Nutrition labeling and portion size information on children’s menus in fast-food and table-service chain restaurants in London, UK. J Nutr Educ Behav. Nov-Dec 2011;43(6):543–547.
13. Avcibasioglu P, Cardinale J, Dommeyer CJ, Lebioda-Skoczen V, Liu Schettig J. An exploratory investigation of college student’s attitudes toward California’s new menu-labeling law. The Journal of Applied Business Research. 2011;27(1):7–13.
14. Bassett MT, Dumanovsky T, Huang C, et al. Purchasing behavior and calorie information at fast-food chains in New York City, 2007. Am J Public Health. Aug 2008;98(8):1457–1459.
15. Dumanovsky T, Huang CY, Bassett MT, Silver LD. Consumer awareness of fast-food calorie information in New York City after implementation of a menu labeling regulation. Am J Public Health. Dec 2010;100(12):2520–2525.
16. Elbel B, Kersh R, Brescoll VL, Dixon LB. Calorie labeling and food choices: A first look at the effects on low-income people in New York City. Health Aff (Millwood). Nov–Dec 2009;28(6):w1110–1121.
17. Jensen C, Webb K, Mandel S, Hudes M, Crawford P. Evaluation of the pilot menu labeling initiative in Kaiser Permanente cafeterias 2009. http://www.foodpolitics.com/wp-content/uploads/kp_final_report_july-2009.pdf.
18. Pulos E, Leng K. Evaluation of a voluntary menu-labeling program in full-service restaurants. Am J Public Health. Jun 2010;100(6):1035-1039.
19. Roberto CA, Larsen PD, Agnew H, Baik J, Brownell KD. Evaluating the impact of menu labeling on food choices and intake. Am J Public Health. Feb 2010;100(2):312–318.
20. Elbel B. Consumer estimation of recommended and actual calories at fast food restaurants. Obesity (Silver Spring). Oct 2011;19(10):1971–1978.
21. Tandon PS, Zhou C, Chan NL, et al. The impact of menu labeling on fast-food purchases for children and parents. Am J Prev Med. Oct 2011;41(4):434–438.
22. Howlett EA, Burton S, Bates K, Huggins K. Coming to a restaurant near you? Potential consumer responses to nutrition information disclosure on menus. J Consum Res. 2009;36(3):494–503.
23. Burton S, Howlett E, Heintz Tangari A. Food for thought: How will the nutrition labeling of quick service restaurant menu items influence consumers’ product evaluations, purchase intentions, and choices? Journal of Retailing. 2009;85(3):258–273.
24. Roseman MG, Higgins JA. The impact of restaurant nutrition labeling providing calorie information on consumer behaviors. Frontiers in Southeast CHRIE Hospitality and Tourism Research. 2011;15(2):40–45.
25. Temple JL, Johnson KM, Archer K, Lacarte A, Yi C, Epstein LH. Influence of simplified nutrition labeling and taxation on laboratory energy intake in adults. Appetite. Aug 2011;57(1):184–192.
26. Wisdom J, Downs JS, Loewenstein G. Promoting healthy choices: Information versus convenience. Am Econ J Appl Econ. 2010;2:164–178.
27. Chu YH, Frongillo EA, Jones SJ, Kaye GL. Improving patrons’ meal selections through the use of point-of-selection nutrition labels. Am J Public Health. Nov 2009;99(11):2001–2005.
28. Thorndike AN, Sonnenberg L, Riis J, Barraclough S, Levy DE. A 2-phase labeling and choice architecture intervention to improve healthy food and beverage choices. Am J Public Health. Mar 2012;102(3):527–533.
29. Holmes AS, Serrano EL, Machin JE, Duetsch T, Davis GC. Effect of different children’s menu labeling designs on family purchases. Appetite. Epub Jun 1 2012.
30. Downs JS, Loewenstein G, Wisdom J. Strategies for promoting healthier food choices. Am Econ Rev: Papers & Proceedings. 2009;99(2):159-164.
31. Elbel B, Gyamfi J, Kersh R. Child and adolescent fast-food choice and the influence of calorie labeling: A natural experiment. Int J Obes (Lond). Apr 2011;35(4):493-500.
32. Finkelstein EA, Strombotne KL, Chan NL, Krieger J. Mandatory menu labeling in one fast-food chain in King County, Washington. Am J Prev Med. Feb 2011;40(2):122-127.
33. Bollinger B, Leslie P, Sorensen A. Calorie posting in chain restaurants. Am Econ J Econ Policy. 2011;3:91-128.
34. Dumanovsky T, Huang CY, Nonas CA, Matte TD, Bassett MT, Silver LD. Changes in energy content of lunchtime purchases from fast food restaurants after introduction of calorie labelling: Cross sectional customer surveys. BMJ. 2011;343:d4464.
35. Brissette I, Lowenfels A, Noble C, Spicer D. Predictors of total calories purchased at fast-food restaurants: Restaurant characteristics, calorie awareness and use of calorie information. J Nutr Educ Behav. Epub Apr 13 2013.
36. Thunström L, Nordström J. Does easily accessible nutritional labelling increase consumption of healthy meals away from home? A field experiment measuring the impact of a point-of-purchase healthy symbol on lunch sales. http://bit.ly/ZL8yqz.
37. Vyth EL, Steenhuis IH, Heymans MW, Roodenburg AJ, Brug J, Seidell JC. Influence of placement of a nutrition logo on cafeteria menu items on lunchtime food choices at Dutch work sites. J Am Diet Assoc. Jan 2011;111(1):131-136.
38. Bates K, Burton S, Howlett E, Huggins K. The roles of gender and motivation as moderators of the effects of calorie and nutrient information provision on away-from-home foods. J Consum Aff. 2009;43(2):249-273.
39. Driskell JA, Schake MC, Detter HA. Using nutrition labeling as a potential tool for changing eating habits of university dining hall patrons. J Am Diet Assoc. Dec 2008;108(12):2071-2076.
40. Colby SE, Heidal K, Johnson C, Stallings T, Gross K. Influence of differing types and formats of menu labeling. Paper presented at: FASEB 2009.
41. Tandon PS, Wright J, Zhou C, Rogers CB, Christakis DA. Nutrition menu labeling may lead to lower-calorie restaurant meal choices for children. Pediatrics. Feb 2010;125(2):244-248.
42. Girz L, Polivy J, Herman CP, Lee H. The effects of calorie information on food selection and intake. Int J Obes (Lond). 2012; 36(10):1340-1345.
43. Lowe DM. The effect of menu nutrition labels on consumers’ dietary decision making. Amherst, MA: Hospitality & Tourism Management, University of Massachusetts Amherst; 2012.
44. Yoon HJ, George T. Nutritional information disclosure on the menu: Focusing on the roles of menu context, nutritional knowledge and motivation. International Journal of Hospitality Management. in press.
45. Fitch RC, Harnack LJ, Neumark-Sztainer DR, et al. Providing calorie information on fast-food restaurant menu boards: Consumer views. Am J Health Promot. Nov-Dec 2009;24(2):129-132.
46. Cohn EG, Larson EL, Araujo C, Sawyer V, Williams O. Calorie postings in chain restaurants in a low-income urban neighborhood: Measuring practical utility and policy compliance. J Urban Health. Aug 2012;89(4): 587-597.
47. Ellison B, Davis D, Lusk J. “Order This, Not That”: Does Nutrition Information on Restaurant Menus Influence Food Choice? Agricultural & Applied Economics Association’s 2011 AAEA & NAREA Joint Annual Meeting. Pittsburgh, PA; 2011.
48. Bruemmer B, Krieger J, Saelens BE, Chan N. Energy, saturated fat, and sodium were lower in entrees at chain restaurants at 18 months compared with 6 months following the implementation of mandatory menu labeling regulation in king county, washington. J Acad Nutr Diet. Aug 2012;112(8):1169-1176.
49. Saelens BE, Chan NL, Krieger J, et al. Nutrition-labeling regulation impacts restaurant environments. Am J Prev Med. 2012;43:505-511.
50. Finkelstein EA, Strombotne KL, Chan NL, Krieger J. Mandatory menu labeling in one fast-food chain in King County, Washington. Am J Prev Med. Feb 2011;40(2):122-127.
51. IOM (Institute of Medicine). Accelerating Progress in Obesity Prevention: Solving the Weight of the Nation. Washington, DC: The National Academies Press; 2012.
52. Howlett E, Burton S, Heintz Tangari A, Bui-Nguyen M. Hold the salt! Effects of sodium information provision, sodium content, and hypertension on perceived cardiovascular disease risk and purchase intentions. Journal of Public Policy & Marketing. 2012;31:4-18.
53. Britt JW, Frandsen K, Leng K, Evans D, Pulos E. Feasibility of voluntary menu labeling among locally owned restaurants. Health Promot Pract. Jan 2011;12(1):18-24.
54. Bates K, Burton S, Huggins K, Howlett E. Battling the bulge: Menu board calorie legislation and its potential impact on meal repurchase intentions. Journal of Consumer Marketing. 2011;28(2):104-113.
55. Fawkes K, Levy J, Terry K, Edelstein S. Female college students’ attitudes about body image and food labels and how they affect purchasing behavior. Top Clin Nutr. 2010;25(2):165–171.

22 Impact of Menu Labeling on Consumer Behavior | Research Review | June 2013
56. Giesen JC, Payne CR, Havermans RC, Jansen A. Exploring how calorie information and taxes on high-calorie foods influence lunch decisions. Am J Clin Nutr. Apr 2011;93(4):689-694.
57. Temple JL, Johnson K, Recupero K, Suders H. Nutrition labels decrease energy intake in adults consuming lunch in the laboratory. J Am Diet Assoc. Jul 2010;110(7):1094-1097.
58. Lowe MR, Tappe KA, Butryn ML, et al. An intervention study targeting energy and nutrient intake in worksite cafeterias. Eating Behavior. Aug 2010;11(3):144-151.
59. Vadiveloo MK, Dixon LB, Elbel B. Consumer purchasing patterns in response to calorie labeling legislation in New York City. Int J Behav Nutr Phys Act. 2011;8:51.

23 Impact of Menu Labeling on Consumer Behavior | Research Review | June 2013
About Healthy Eating Research
Healthy Eating Research is a national program of the Robert Wood Johnson Foundation. Technical assistance and direction are provided by the University of Minnesota School of Public Health under the direction of Mary Story, PhD, RD, program director, and Karen M. Kaphingst, MPH, deputy director. The Healthy Eating Research program supports research to identify, analyze, and evaluate environmental and policy strategies that can promote healthy eating among children and prevent childhood obesity. Special emphasis is given to research projects that benefit children and adolescents ages 3 to 18 and their families, especially in lower-income and racial and ethnic populations at highest risk for obesity.
University of Minnesota, School of Public Health1300 South 2nd St., Suite 300Minneapolis, MN 55454www.healthyeatingresearch.org
About the Robert Wood Johnson Foundation
The Robert Wood Johnson Foundation focuses on the pressing health and health care issues facing our country. As the nation’s largest philanthropy devoted exclusively to health and health care, the Foundation works with a diverse group of organizations and individuals to identify solutions and achieve comprehensive, measurable, and timely change. For more than 40 years the Foundation has brought experience, commitment, and a rigorous, balanced approach to the problems that affect the health and health care of those it serves. When it comes to helping Americans lead healthier lives and get the care they need, the Foundation expects to make a difference in your lifetime. For more information, visit www.rwjf.org. Follow the Foundation on Twitter www.rwjf.org/twitter or Facebook www.rwjf.org/facebook. Route 1 and College Road EastP.O. Box 2316Princeton, NJ 08543–2316www.rwjf.org