Population Key Issue 1. POPULATION & MIGRATION MOVEMENT AND DIFFUSION.

Impact of Internal Migration on Population Redistribution in Europe: Urbanisation, Counterurbanisation or Spatial Equilibrium?*
Francisco Rowe, Martin Bell, Aude Bernard, Elin Charles-Edwards, Philipp Ueffi ng
Abstract: The classical foundations of migration research date from the 1880s with Ravenstein’s “Laws of migration”, which represent the fi rst comparative analyses of internal migration. While his observations remain largely valid, the ensuing century has seen considerable progress in data collection practices and methods of analy-sis, which in turn has permitted theoretical advances in understanding the role of migration in population redistribution. Coupling the extensive range of migration data now available with these recent theoretical and methodological advances, we endeavour to advance beyond Ravenstein’s understanding by examining the direc-tion of population redistribution and comparing the impact of internal migration on patterns of human settlement in 27 European countries. Results show that the overall redistributive impact of internal migration is low in most European countries but the mechanisms differ across the continent. In Southern and Eastern Europe migration effectiveness is above average but is offset by low migration intensities, whereas in Northern and Western Europe high intensities are absorbed in reciprocal fl ows resulting in low migration effectiveness. About half the European countries are experiencing a process of concentration toward urbanised regions, particularly in Northern, Central and Eastern Europe, whereas countries in the West and South are undergoing a process of population deconcentration. These results suggest that population deconcentration is now more common than it was in the 1990s when counterurbanisation was limited to Western Europe. The results show that 130 years on, Ravenstein’s law of migration streams and counter-streams remains a central facet of migration dynamics, while underlining the importance of simple yet robust indices for the spatial analysis of migration.
Keywords: Internal migration · Population redistribution · MAUP · Europe · Cross-national analysis
Comparative Population StudiesVol. 44 (2019): 201-234 (Date of release: 06.11.2019)
Federal Institute for Population Research 2019 URL: www.comparativepopulationstudies.de DOI: 10.12765/CPoS-2019-18en URN: urn:nbn:de:bib-cpos-2019-18en6
* This article belongs to a special issue on “Internal Migration as a Driver of Regional Population Change in Europe: Updating Ravenstein”.
• Francisco Rowe, Martin Bell, Aude Bernard, Elin Charles-Edwards, Philipp Ueffing202
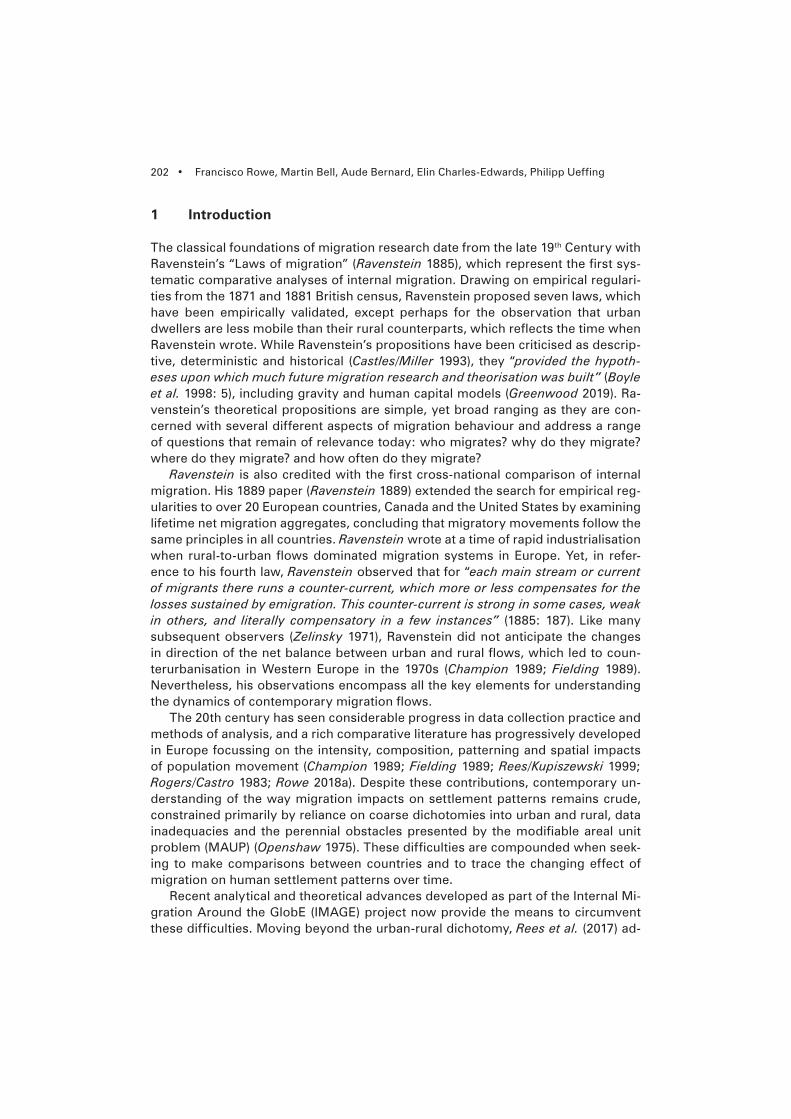
1 Introduction
The classical foundations of migration research date from the late 19th Century with Ravenstein’s “Laws of migration” (Ravenstein 1885), which represent the fi rst sys-tematic comparative analyses of internal migration. Drawing on empirical regulari-ties from the 1871 and 1881 British census, Ravenstein proposed seven laws, which have been empirically validated, except perhaps for the observation that urban dwellers are less mobile than their rural counterparts, which refl ects the time when Ravenstein wrote. While Ravenstein’s propositions have been criticised as descrip-tive, deterministic and historical (Castles/Miller 1993), they “provided the hypoth-eses upon which much future migration research and theorisation was built” (Boyle et al. 1998: 5), including gravity and human capital models (Greenwood 2019). Ra-venstein’s theoretical propositions are simple, yet broad ranging as they are con-cerned with several different aspects of migration behaviour and address a range of questions that remain of relevance today: who migrates? why do they migrate? where do they migrate? and how often do they migrate?
Ravenstein is also credited with the fi rst cross-national comparison of internal migration. His 1889 paper (Ravenstein 1889) extended the search for empirical reg-ularities to over 20 European countries, Canada and the United States by examining lifetime net migration aggregates, concluding that migratory movements follow the same principles in all countries. Ravenstein wrote at a time of rapid industrialisation when rural-to-urban fl ows dominated migration systems in Europe. Yet, in refer-ence to his fourth law, Ravenstein observed that for “each main stream or current of migrants there runs a counter-current, which more or less compensates for the losses sustained by emigration. This counter-current is strong in some cases, weak in others, and literally compensatory in a few instances” (1885: 187). Like many subsequent observers (Zelinsky 1971), Ravenstein did not anticipate the changes in direction of the net balance between urban and rural fl ows, which led to coun-terurbanisation in Western Europe in the 1970s (Champion 1989; Fielding 1989). Nevertheless, his observations encompass all the key elements for understanding the dynamics of contemporary migration fl ows.
The 20th century has seen considerable progress in data collection practice and methods of analysis, and a rich comparative literature has progressively developed in Europe focussing on the intensity, composition, patterning and spatial impacts of population movement (Champion 1989; Fielding 1989; Rees/Kupiszewski 1999; Rogers/Castro 1983; Rowe 2018a). Despite these contributions, contemporary un-derstanding of the way migration impacts on settlement patterns remains crude, constrained primarily by reliance on coarse dichotomies into urban and rural, data inadequacies and the perennial obstacles presented by the modifi able areal unit problem (MAUP) (Openshaw 1975). These diffi culties are compounded when seek-ing to make comparisons between countries and to trace the changing effect of migration on human settlement patterns over time.
Recent analytical and theoretical advances developed as part of the Internal Mi-gration Around the GlobE (IMAGE) project now provide the means to circumvent these diffi culties. Moving beyond the urban-rural dichotomy, Rees et al. (2017) ad-

Impact of Internal Migration on Population Redistribution in Europe • 203
vanced a theoretical framework which captures the way internal migration redis-tributes population across the national settlement system during the development process. They also proposed system-wide measures of internal migration impact which are independent of the size and number of spatial units used for measure-ment and identifi ed systematic links between migration intensity and migration ef-fectiveness. Coupled with a global repository of internal migration data (Bell et al. 2015a) and bespoke software, the IMAGE Studio (Stillwell et al. 2014), these devel-opments provide the framework and tools to systematically quantify the impact of internal migration on population redistribution within countries, and explore cross-national differences.
Drawing on the above resources, we compare the impact of internal migration on patterns of human settlement across 27 European countries; determine the di-rection and pace of population concentration due to internal migration within each country; and examine changes in migration impact over time. In doing so, we aim to assess the relevance of Ravenstein’s fourth law of streams and counter-streams to contemporary migration systems. By focusing on Europe, we seek to update and extend the work of Rees/Kupiszewski (1999) who explored cross-national variations in internal migration patterns across 11 European countries between the mid-1980s and mid-1990s. Profound demographic and economic changes have occurred at the start of the new millennium. Open borders and Eurozone expansion, coupled with a European debt crisis and the acceleration of population ageing, are likely to have altered the patterns of internal migration within European countries by facilitating international migration and increasing socio-economic inequalities between sub-national areas (De Beer et al. 2010; Dubois et al. 2007; Ertur et al. 2006). Interna-tional migration may have operated to substitute for within-country moves (De Beer et al. 2010), while growing sub-national disparities may have redirected the concen-tration of internal population fl ows towards a handful of destinations (Dubois et al. 2007; Ertur et al. 2006). The recent and changing nature of these events underpins a need for an update, review and monitoring of internal migration trends.
The paper is structured in fi ve sections. In Section 2, we review prior work and highlight the extent of cross-national variations in the spatial impact of internal mi-gration. In Section 3, we discuss impediments to cross-national comparison arising from differences in data types, observation intervals and geographical frameworks. In subsequent sections, we present the results of our analysis which proceeds in a series of stages. In Section 4, we fi rst assess the overall impact of internal migration on population redistribution using the Index of Net Migration Impact (INMI), a single system-wide index which transcends national differences in the zonal systems on which migration is recorded. We compare the level of redistribution in European countries to the world average and examine how cross-national differences are driven by the interaction between migration intensity and migration effectiveness. In Section 5, we examine how these system-wide differences play out to alter the pattern of human settlement at the local and regional level, moving beyond con-ventional measures based on the urban hierarchy to identify the overall effects on population concentration and deconcentration within countries, highlighting unu-sual patterns of population gains and losses. To that end, we set net migration rates

• Francisco Rowe, Martin Bell, Aude Bernard, Elin Charles-Edwards, Philipp Ueffing204
against population densities across entire national zonal systems and compare the slope of population-weighted regressions for our sample of countries. In Section 6, we examine trends over time in the context of the conceptual model proposed by Rees et al. (2017) which anticipates a range of trajectories among economically advanced countries. Section 7 provides concluding remarks by discussing the long-standing differences in migration processes that distinguish the different regions of Europe and identify the need for a more comprehensive view of population move-ment that recognises the multi-dimensional nature of the migration process.
2 Prior Work
Compared with other parts of the world, the level, characteristics and impact of internal migration in many countries of Europe are well understood. This is due to sustained research by demographers and geographers but also refl ects good data availability, with records on internal migration in parts of northern European stretching back centuries. Comparative studies are less common, refl ecting the dif-fi culties in harmonising migration data derived from different sources, over varying time intervals, and for different statistical geographies (Bell et al. 2015a). A number of cross-national studies have sought to overcome these challenges, to enumerate variations in intensity and the age profi le of migration, and to assess its spatial im-pact across the continent.
Cross-national variation in the intensity, or level of migration, is arguably the best-understood dimension of migration but is challenging to establish due to its sensitivity both to the interval over which migration is measured and to the size of the areal units used to defi ne migration. Early cross-national studies of internal mi-gration (Parish 1973; Rogers et al. 1983) were severely hampered by these issues. Parish (1973) circumvented the problem by comparing trends, rather than the ab-solute level of migration, for eight countries in the 19th and early 20th Century. The study found modest increases in intensity in all countries, though both the timing and magnitude of the increase varied, highlighting the importance of local context. The International Institute for Applied Systems Analysis’ (IIASA) comparative study of migration and settlement was the fi rst to capture regional variations in internal migration for a large sample of countries, including 13 countries in Europe. An index capturing the level of retention within regions (Rogers et al. 1983) as well as gross migraproduction rates (Rogers/Castro 1983) were calculated. Median values for re-gions were used as a comparative measure of differences in regional migration intensity between countries. Migration intensity was lowest in Bulgaria and Austria, while high levels of mobility were recorded in regions of Hungary, Finland and the former members of the Soviet Union. Differences in areal delineation affected the reliability of results, so the authors focused instead on the age profi le of migration (Rogers/Castro 1983).
Rees/Kupiszewski (1999) were the fi rst to apply a robust single measure of mi-gration intensity, Courgeau’s k (Courgeau 1973), for the purposes of cross-national comparison. Their analysis of 11 countries in Europe revealed a gradient of high mo-

Impact of Internal Migration on Population Redistribution in Europe • 205
bility in northern and western Europe tending to low mobility in southern and east-ern Europe. Sanchez/Andrews (2011) using consistent data from the 2007 European Union Survey of Income and Living Conditions, confi rmed this general pattern, as did Bell et al. (2015b) who estimated a novel, system-wide index, the aggregate crude migration intensity (ACMI) for 96 countries around the world including 30 countries in Europe. Esipova et al. (2013) confi rmed the northwest-southeast gradi-ent using data from a standard question in the 2011-2012 Gallup World survey. More recently, Bernard (2017) adopted a cohort perspective to compare the lifetime num-ber of moves of early baby boomers in 14 European countries, and Rowe (2018a) examined short- and long-distance migration patterns for a sample of 27 European countries. Both confi rmed a clear spatial gradient of high mobility in the North and West, moderating toward the South and the East. Champion et al. (2018) provide a comprehensive account of trends in internal migration intensities in the developed world. This work has revealed for the fi rst time a diversity of trends in internal migra-tion in Europe, with some countries recording a decrease while others show stabil-ity or increase (Bell et al. 2018).
The most visible signifi cance of internal migration lies in its effect in redistribut-ing populations, which is heightened under conditions of low fertility and mortality. Comparative studies of migration impact in Europe stretch back decades, many focusing on the contribution of migration to urbanisation. Fielding (1989) explored changes in the direction of population redistribution processes in 14 European countries. Population density was used as a proxy for the level of urbanisation in regions and correlated against regional net migration rates. The results revealed a shift in the dominant spatial impact of migration away from urbanisation to counter-urbanisation between the 1950s to the 1970s.
However, these shifts were neither linear nor ubiquitous and the lack of a com-parable summary metric prohibited rigorous comparison of the relative magnitude of population redistribution. Champion/Vandermotten (1997) drew on estimates of net migration for 557 regions of Europe in the three decades from the 1960s. Migra-tion was measured as a residual after subtracting natural change (births-deaths) and therefore did not isolate the impact of internal migration on regional populations. This study found strong associations between population density and regional mi-gration gains in the 1970s. However, the relationship was non-linear, with the larg-est gains recorded in regions with intermediate population densities. In the 1960s and 1980s, regional economic factors accounted for more variance in net migration rates than density, pointing to equilibrating economic forces sitting alongside struc-tural drivers of migration in Europe (Champion/Vandermotten 1997).
Rees/Kupiszewski (1999) building on this earlier work examined the association between urbanisation (again adopting population density as a proxy) and patterns of regional net migration gains and losses. The study identifi ed three main systems of population redistribution in Europe: urbanisation (Estonia, Romania, Norway, and Poland); intermediate systems (Germany, Italy, Portugal and the Czech Republic) and counter-urbanising systems (Netherlands and the United Kingdom). Net mi-gration gains and losses were also impacted by regional unemployment in certain countries. Unemployment was strongly associated with net losses in the United
• Francisco Rowe, Martin Bell, Aude Bernard, Elin Charles-Edwards, Philipp Ueffing206
Kingdom and Poland, while Portugal, Italy, and the Czech Republic displayed weak associations. The selectivity of migration with respect to gender and life course stage was also examined, with evidence of differences in the pattern of population redistribution according to the characteristics of migrants especially with respect to life course stage.
The cumulative knowledge gained over previous decades, set alongside recent fi ndings from the IMAGE project (Bell et al. 2015b; Stillwell et al. 2016), provides dis-tinctive insights into cross-national variations in internal migration in Europe. Com-pared with other parts of the world, the overall intensity of migration is moderate, but variable across countries (Rowe 2018b). Multiple studies have found evidence of a spatial gradient of high mobility in Northern and Western Europe to low mobil-ity in Southern and Eastern Europe (Bell et al. 2015b; Rees/Kupiszewski 1999; Rowe 2018a; Sánchez/Andrews 2011). The impact of migration on settlement systems also varies across the continent and over time, but with less clarity in spatial patterning. Both urbanising and counter-urbanising tendencies are evident. This is overlain by systems of migration fl ows refl ecting the relative economic fortune and function of regions. A lack of comparable system-wide metrics has made the overall impact of migration diffi cult to quantify and compare across countries.
3 Internal Migration Data in Europe
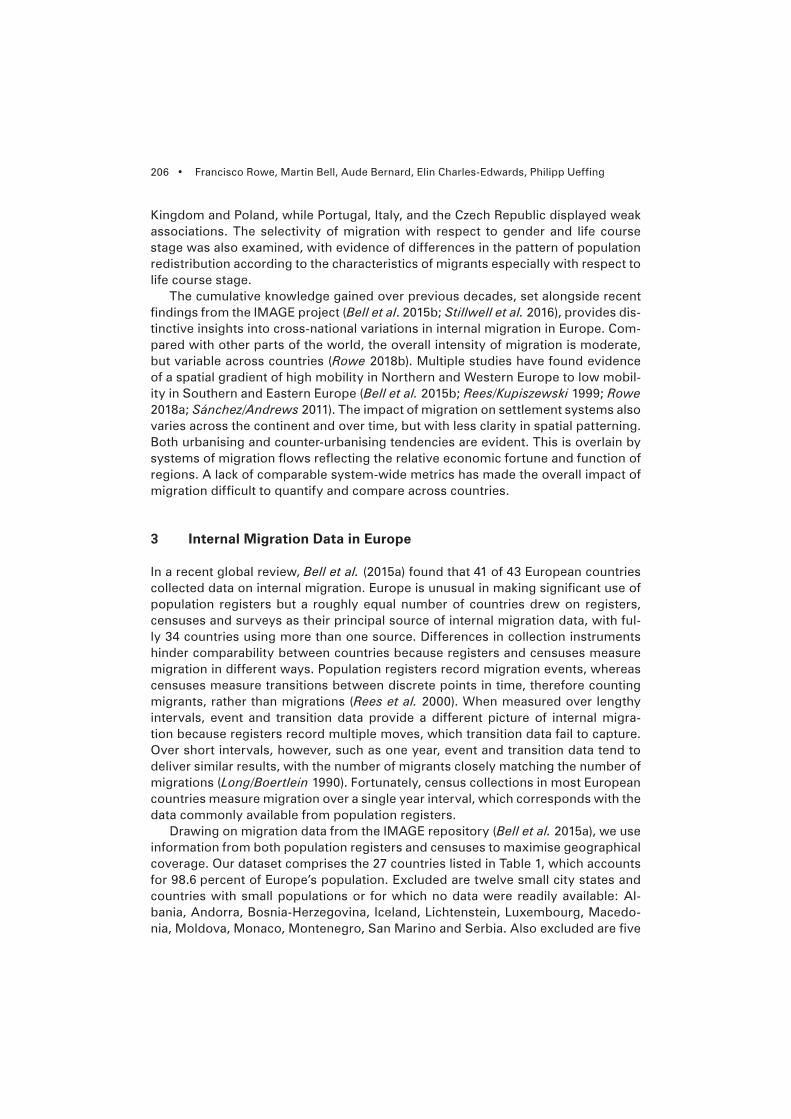
In a recent global review, Bell et al. (2015a) found that 41 of 43 European countries collected data on internal migration. Europe is unusual in making signifi cant use of population registers but a roughly equal number of countries drew on registers, censuses and surveys as their principal source of internal migration data, with ful-ly 34 countries using more than one source. Differences in collection instruments hinder comparability between countries because registers and censuses measure migration in different ways. Population registers record migration events, whereas censuses measure transitions between discrete points in time, therefore counting migrants, rather than migrations (Rees et al. 2000). When measured over lengthy intervals, event and transition data provide a different picture of internal migra-tion because registers record multiple moves, which transition data fail to capture. Over short intervals, however, such as one year, event and transition data tend to deliver similar results, with the number of migrants closely matching the number of migrations (Long/Boertlein 1990). Fortunately, census collections in most European countries measure migration over a single year interval, which corresponds with the data commonly available from population registers.
Drawing on migration data from the IMAGE repository (Bell et al. 2015a), we use information from both population registers and censuses to maximise geographical coverage. Our dataset comprises the 27 countries listed in Table 1, which accounts for 98.6 percent of Europe’s population. Excluded are twelve small city states and countries with small populations or for which no data were readily available: Al-bania, Andorra, Bosnia-Herzegovina, Iceland, Lichtenstein, Luxembourg, Macedo-nia, Moldova, Monaco, Montenegro, San Marino and Serbia. Also excluded are fi ve
Impact of Internal Migration on Population Redistribution in Europe • 207
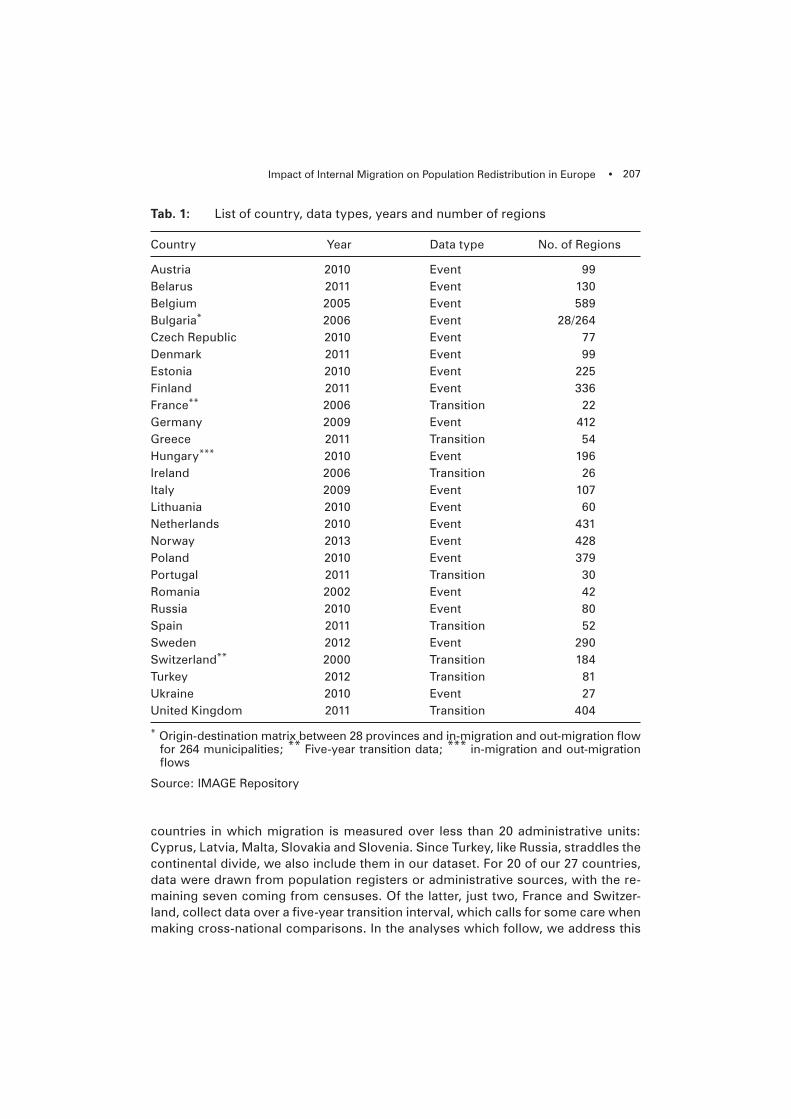
countries in which migration is measured over less than 20 administrative units: Cyprus, Latvia, Malta, Slovakia and Slovenia. Since Turkey, like Russia, straddles the continental divide, we also include them in our dataset. For 20 of our 27 countries, data were drawn from population registers or administrative sources, with the re-maining seven coming from censuses. Of the latter, just two, France and Switzer-land, collect data over a fi ve-year transition interval, which calls for some care when making cross-national comparisons. In the analyses which follow, we address this
Tab. 1: List of country, data types, years and number of regions
Country Year Data type No. of Regions
Austria 2010 Event 99Belarus 2011 Event 130Belgium 2005 Event 589Bulgaria* 2006 Event 28/264Czech Republic 2010 Event 77Denmark 2011 Event 99Estonia 2010 Event 225Finland 2011 Event 336France** 2006 Transition 22Germany 2009 Event 412Greece 2011 Transition 54Hungary*** 2010 Event 196Ireland 2006 Transition 26Italy 2009 Event 107Lithuania 2010 Event 60Netherlands 2010 Event 431Norway 2013 Event 428Poland 2010 Event 379Portugal 2011 Transition 30Romania 2002 Event 42Russia 2010 Event 80Spain 2011 Transition 52Sweden 2012 Event 290Switzerland** 2000 Transition 184Turkey 2012 Transition 81Ukraine 2010 Event 27United Kingdom 2011 Transition 404
* Origin-destination matrix between 28 provinces and in-migration and out-migration fl ow for 264 municipalities; ** Five-year transition data; *** in-migration and out-migration fl ows
Source: IMAGE Repository
• Francisco Rowe, Martin Bell, Aude Bernard, Elin Charles-Edwards, Philipp Ueffing208
by comparing the results for Europe against the global mean reported by Rees et al. (2017) for which a larger sample of countries is available.
Comparability between the 27 countries in our dataset is compromised by two further issues: differences in the years for which migration was observed and vari-ations in the spatial scale at which it was measured. For the former, we chose to balance the goals of comparability and need for up-to-date data, and elected to use data for the latest period available in the IMAGE repository. Although the timing of observation varies across a full decade from 2000-02 (e.g. Switzerland and Roma-nia) to 2012-13 (e.g. Norway), the data in Table 1 provide a broad representation of migration patterns at the start of the millennium. As demonstrated below, they also reveal wide variations between countries in the direction and extent of redistribu-tion, although we sometimes fi nd substantial variations in these trajectories from year to year. We hold origin-destination matrices for most countries, with the ex-ception of Hungary for which we only have in-migration and out-migration fl ows for each administrative unit separately. Similarly for Bulgaria we hold in-migration and out-migration fl ows for 264 municipalities but an origin-destination matrix only at a provincial level (n=28). While infl ows and outfl ows are suffi cient to estimate net mi-gration rates in Section 5, a full matrix is required to estimate measures used in Sec-tion 4, which causes the number of case study countries to vary across the paper.
Comparison of migration patterns based on varying time points may be com-plicated by the fact that countries follow different trends. The period of analysis encompasses the 2007/08 global fi nancial crisis (GFC) and recent studies have at-tributed changes in the level of migration to this discrete economic event (Bell et al. 2018; Lomax/Stillwell 2018). Yet, changes in migration intensity vary across coun-tries. Analysing a time series of annual change in migration rates for a period of up to 39 years across 27 European countries, Rowe (2018a/b) revealed that only fi ve countries – Iceland, Bulgaria, Romania, Latvia, Belarus and Croatia – experienced a pronounced decline during the GFC period between 2007 and 2009. The predomi-nant pattern across countries across most countries was of cyclical fl uctuations in the long-term trajectory of migration intensity. Yet, these studies have focused on the level of migration, rather than on the direction of migration fl ows. The impacts of the GFC on infl uencing the direction of migration fl ows is diffi cult to anticipate and expected to vary across countries according to the national structure of population distribution and local economic conditions.
The second issue that affects comparability arises from variations in the zonal systems across which migration is measured. These zonal systems range in our dataset from less than 30 regions in Bulgaria and France to more than 500 in Bel-gium. Differences in the number of regions into which a country is divided, and in their shape and size, fundamentally affect the number of migrations captured, and therefore infl uence any derived statistics. This is widely recognised as the MAUP which affects spatial modelling (Openshaw 1975). Courgeau et al. (2013) showed that this problem could be overcome by setting migration intensities against the average number of households per zone at a range of spatial scales, to derive an estimate of the aggregate crude migration intensity (ACMI), a measure of all moves within each country, irrespective of distance moved, which was directly compara-

Impact of Internal Migration on Population Redistribution in Europe • 209
ble across nations. Compared with the measure devised four decades earlier by Courgeau (1973), latterly referred to as Courgeau’s k (Bell/Muhidin 2011, 2009; Rees/Kupiszewski 1999), it offered the distinct advantage of having an intrinsic meaning. Stillwell et al. (2014) describe the random spatial aggregation software implement-ed as part of the IMAGE project to provide a general solution for countries with mi-gration data available on a fi nely grained spatial framework. Rees et al. (2017) subse-quently used these routines in the IMAGE Studio to measure the scale and pattern effects of the MAUP on two key indicators of migration impact: the Aggregate Net Migration Rate (ANMR) and the Migration Effectiveness Index (MEI). Coupling these measures with the ACMI, they derived a new index, the Index of Net Migration Im-pact (INMI), as used in this paper, which allows robust, system-wide comparisons between countries in regard to migration redistribution.
4 Overall Impact of Internal Migration
The INMI is a generalised extension of the ANMR originally proposed as one of the key measures of migration impact by Bell et al. (2002). Algebraically, the ANMR is defi ned as half the sum of the absolute net changes across all regions, divided by the population at risk:
where Di and Oi represent in-migration and out-migration fl ows from region i. Bell et al. (2002) also show that the ANMR is the product of two other key migration measures, the crude migration intensity (CMI) and the migration effectiveness index (MEI):
where:
And M indicates the total number of inter-regional migrants. The CMI measures the overall level or incidence of migration within a country, whereas the MEI indi-cates the degree of symmetry or balance between migration infl ows and outfl ows – a system-wide measure of Ravenstein’s observation with regard to the reciprocal nature of migration fl ows. While providing a robust and informative index of popula-tion redistribution in a single country, values of the ANMR are clearly dependent on spatial scale. Since ANMRs calculated for differing levels of geography are clearly
(1)
(2)
(3)
(4)

• Francisco Rowe, Martin Bell, Aude Bernard, Elin Charles-Edwards, Philipp Ueffing210
not comparable, the index is unsuitable for cross-national comparisons. Rees et al. (2017) devised a general solution by using the random spatial aggregation facility in the IMAGE Studio (Stillwell et al. 2014) to assess the effects of the MAUP on the CMI and the MEI. While the CMI was found to increase linearly with the log of the number of spatial units (Courgeau 1973), the MEI tends to remain remarkably stable when calculated for geographies of 20 spatial units or more. Note that the CMI dif-fers from the ACMI which, as explained earlier, is scale independent and measures all changes of address (Courgeau et al. 2013).
Harnessing this fi nding, Rees et al. (2017) demonstrated algebraically that the slope of the ANMR (measured across multiple levels of scale) is a product of the slope of the CMI and the average MEI measured across different levels of aggre-gation. Based on this relationship, which was found to hold empirically across a large sample of countries, Rees et al. (2017) proposed the INMI, as a measure which enables robust comparison irrespective of the number of spatial units over which migration is measured. To facilitate cross-national comparison, they advised using the mean across a sample of countries as a benchmark, as follows:
As well as providing a reliable basis for cross-national comparison, the INMI retains the particular advantage of the ANMR in distinguishing the relative contribu-tions of migration intensity and migration effectiveness in generating the aggregate level of population redistribution.
Focusing on countries for which data are available for 20 or more spatial units reduces our sample to 26 countries. We calculated the INMI for these countries and set this index against a global sample of 71 countries including all world regions as reported by Rees et al. (2017). Figure 1 presents a ranking of countries according to their INMI. INMI scores above one indicate the population redistribution impact of internal migration is greater than the global average, with values below 1 denote the opposite. The results indicate that the redistributional impact of internal migration is relatively low in Europe. Of the 27 countries, 20 show internal migration impacts below the global mean, with Spain, Ukraine, Romania and Poland displaying the lowest levels. In contrast, Lithuania and Belarus display the highest levels of popula-tion redistribution, more than twice the global mean.
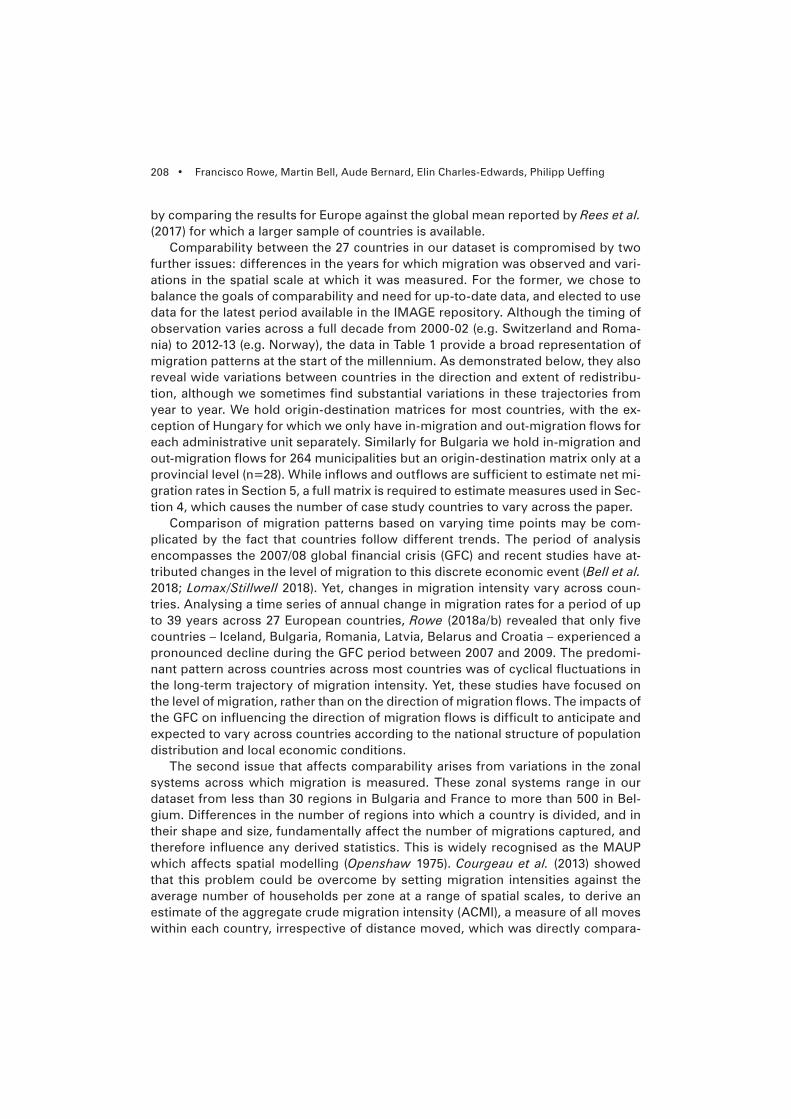
To identify the relative contributions of migration intensity and migration effec-tiveness to the INMI, Figure 2 reports the standardised ratio of the CMI slope and the average MEI to the global mean. They are denoted C and R, respectively. The plot surface indicates the INMI and the contour curves represent points of equal migration impact according to different combinations of migration intensity and migration effectiveness. The results highlight the complex interaction of these two forces in shaping population redistribution. Belarus stands out with very high levels of redistribution, primarily driven by above average levels of migration effective-ness. Migration effectiveness is 2.5 times the international average and is the prin-
(5)

Impact of Internal Migration on Population Redistribution in Europe • 211
cipal contributor to the high INMI overall impact experienced in Belarus. For Ireland, Lithuania and Estonia, levels of population of redistribution are also higher than the global mean but underpinned by different mechanisms. In Ireland, both migration intensity and migration effectiveness are above the global average, while in Lithu-ania and Estonia migration effectiveness is the driving force.
As Figure 2 shows, four clusters of countries can be identifi ed by performing a k-means cluster analysis on the standardised ratio of the CMI slope and the aver-age MEI to the global mean. Three, four and fi ve clusters solutions were evaluated and a four cluster solution was deemed as the most satisfactory. These clusters are robust to different random-number seeds. Cluster A involves four former member countries of the Soviet Union: Belarus, Estonia, Lithuania and Russia. The main fea-ture differentiating this cluster is very high levels of migration effectiveness with an average standardised MEI ratio of 2.23. In Belarus, Estonia and Lithuania, these very high levels of migration effectiveness are supported by global average levels of mi-gration intensity to produce measures of migration impact which are two times the global average, as indicated by the radial grid in Figure 2. In Russia, however, high levels of migration effectiveness are met by low migration intensity resulting in very modest overall migration impact.
Cluster B includes a group of countries in Southern Europe (Italy, Spain) and Eastern Europe (Bulgaria, Czech Republic, Poland, Romania and Ukraine). In these
Fig. 1: Index of Net Migration Impact
Note: Hungary is not included here because an origin-destination matrix is required to estimate the INMI.
Source: IMAGE Repository, global mean across a sample of 71 countries.
• Francisco Rowe, Martin Bell, Aude Bernard, Elin Charles-Edwards, Philipp Ueffing212
countries, the average level of migration effectiveness is around the global mean but levels of migration intensity are comparatively low, displaying an average CMI slope ratio of just one third of the global average, resulting in low overall levels of population redistribution. Cluster C involves a large number of Northern and West-ern countries, including the UK, Scandinavian nations, Belgium, the Netherlands, Germany, Austria, France, Switzerland and Turkey. In this cluster, relatively high levels of migration intensity are absorbed in reciprocal fl ows, resulting in low migra-tion effectiveness, which constrains the extent of population redistribution. Cluster D includes Greece, Portugal and Ireland where average levels of migration intensity correspond to average levels of migration effectiveness, leading to moderate mi-gration impact.
These patterns constitute a signifi cant fi nding. As previously demonstrated (Bell et al. 2015b; Rees/Kupiszewski 1999; Rowe 2018a; Sánchez/Andrews 2011), there is a strong spatial gradient of high migration intensity in northern and western coun-tries, moving to low migration levels in southern and eastern European countries. Bell et al. (2015b) found a modest association between the level of economic devel-opment and migration intensity across a global sample of countries. This associa-
Fig. 2: Decomposing the Index of Net Migration Impact: The roles of migration effectiveness and migration intensity
A
BB
C
D
Note: Differing marker colours and shapes indicate the cluster membership based on a kmeans analysis – see text. A=circle, B=Diamond, C=triangle and D=square. Hungary is not included here because an origin-destination matrix is required to estimate the INMI – see Table 1 for details.
Source: IMAGE Repository, global mean across a sample of 71 countries.

Impact of Internal Migration on Population Redistribution in Europe • 213
tion is present in this study, with the highest intensities recorded in more economi-cally advanced countries of Europe. Economic factors are not, however, suffi cient to explain the observed differences. Culture also plays a role. Bernard (2017) revealed a strong association between the timing of departure from the family home and the number of subsequent migrations, affecting overall migration intensities. Early departures from the parental home are common in northern and western Europe, while delayed exits are the norm in countries in southern and eastern Europe.
Our results reveal that the spatial gradient observed for migration intensity dis-solves in the case of migration effectiveness. Countries with relatively low national incomes, such as the Baltic States (Cluster A), record the highest MEIs. In contrast, high-income countries in northern and western Europe tend to record lower values (in Cluster C). This pattern is consistent with Rees et al. (2017) which posited that in early stages of development uneven patterns of regional development would trig-ger high levels of effectiveness, with a return to more symmetrical fl ows as regional disparities eased. It is important to note that spatial clustering across Europe is not as strong as it was for intensity. This is likely due to the contingencies of national space economies, refl ecting, for example, the location of natural endowments, as well as regional policy and international migration patterns. In terms of overall mi-gration impact, high migration effectiveness balances low migration intensity in southern and eastern European countries, while low levels of migration effective-ness offset high migration intensity in northern and western nations.
5 Net Internal Migration and Population Density
The system-wide measures used in the previous section indicate the overall impact of migration in redistributing population and help reveal the underlying processes, but provide no insight into their spatial manifestation. Prior work has focused par-ticularly on the contribution of rural-urban migration to the urbanisation process. However, the urban/rural dichotomy is problematic for cross-national comparisons because countries differ in the way they defi ne rural and urban areas. Moreover, the urban/rural dichotomy represents a very coarse classifi cation of space, and few countries classify the rural/urban status of migrants at the start of the migration interval which precludes rigorous analysis. To sidestep these problems, Rees et al. (2017) adopted an alternative approach based on population density. Following Fielding (1989) and Rees/Kupiszewski (1999), this aims to capture a continuum in the settlement hierarchy by classifying administrative areas based on their population density. Building on the ideas originally advanced by Courgeau (1973), area-specifi c net migration rates are then set against the logarithm of population density for each corresponding area. Application of population-weighted ordinary least squared re-gression produces an index (the slope of the regression line) which indicates the direction and strength of redistribution across regions. Population-weighted regres-sions are used to recognise the relative importance of regions within countries and correct for the presence of heteroscedasticity in regression estimates arising from

• Francisco Rowe, Martin Bell, Aude Bernard, Elin Charles-Edwards, Philipp Ueffing214
systematic variability in net migration rates because of large variations in popula-tion size and outliers (Gujarati 2004). Thus we estimate the following equation:
where NMR represents the region-specifi c net migration rate; is the logarithm of population density; ß is the regression slope; and, α is a constant. NMR is calculated as the total migration infl ows minus outfl ows for a region divided by the local total population. Population density is measured by the ratio between the local total pop-ulation and geographical area in km2. The sign of the slope indicates the direction of the association between NMR and population density, while its value denotes the strength of this relationship. A positive slope denotes net migration gains in more densely populated areas and losses from lower density regions, and points to a process of population concentration (or urbanisation). A negative slope indicates the reverse: net migration losses from high density areas matched by gains in more sparsely populated regions, leading to population deconcentration (or counterur-banisation). In a test across selected countries, the resulting index was shown to be scale independent when calculated for 30 or more spatial units (Rees et al. 2017) so the analysis presented here is confi ned to the 24 countries in our sample that meet this criterion and for which we have a complete origin-destination matrix
Building on earlier work on the relationship between urbanisation and internal migration by Geyer and colleagues (Geyer 1996; Geyer/Kontuly 1992), Rees et al. (2017) elaborated a conceptual model which proposes a systematic relationship be-tween the patterns of net internal migration and population density as a country progresses through fi ve different phases of development, as displayed in Figure 3. In the fi rst phase, as countries urbanise, a general pattern of net internal migration from low density or rural areas to high density or urban areas is expected. The second phase involves a slight acceleration in the process of urbanisation which is strengthened in the third stage, with internal migration operating to concentrate population in urban areas. In phase 4, this process might reverse into counterurban-isation, or population deconcentration, with net migration fl ows from more popu-lous areas to less dense regions. The fi nal phase 5 identifi es three alternative sce-narios: (a) re-urbanisation, (b) counterurbanisation and (c) spatial equilibrium, the latter indicative of no net impact of internal migration on population redistribution. Re-urbanisation may occur where central areas of cities undergo redevelopment. Counterurbanisation may occur as people manifest a preference for low density areas and cities shrink. Alternatively, migration fl ows across the urban hierarchy may be balanced, resulting in minimal population redistribution, a condition, which Rees et al. (2017) described as a state of spatial equilibrium. Thus, as countries reach higher stages of development, the impact of internal migration on population redistribution is expected to become more limited, and a diversity of outcomes is predicted. At stage 5, the relationship between net migration and population den-sity can fl uctuate over time depending on housing and job market conditions.
We estimate Equation (6) to analyse patterns of net migration losses and gains. By way of example, Figure 4 plots the relationship between net internal migration
(6)

Impact of Internal Migration on Population Redistribution in Europe • 215
rates and population density for Belarus, Lithuania and Belgium, and presents pop-ulation-weighted estimates of linear regression with 95 percent confi dence inter-vals. A positive regression slope of 0.73 in Belarus points to a pattern of population concentration resulting from net migration losses in low density regions and gains in densely populated areas, including the districts of Grodno, Pinsk and Viciebsk, which are large regional centres. The Belorussian settlement system stands out by the absence of intermediate cities and the presence of a few urban agglomera-tions that coexist with a disproportionately large number of low density regions. In our sample, a similar settlement pattern of population settlement is observed only in Romania. A negative slope for Belgium, -0.88 indicates the reverse pattern, net migration gains in low density areas coexisting with losses in more densely settled areas. The steepness of the slope indicates the pace of population deconcentration refl ecting processes of suburbanisation and counterurbanisation. At the same time, the large dispersion of regions suggests that while the regression line captures the overall tendency, there are in some countries very large residuals from the regres-sion, which point to the fact that the picture is more complex that density alone predicts. Finally, the fl at slope observed in Lithuania as shown by the absence of an association between net migration rates and population density and low adjusted R2 indicates that migration fl ows across the settlement hierarchy are closely balanced, resulting in minimal population redistribution. Results for all countries can be found in Appendix Figure A1.
Fig. 3: Theoretical framework linking development to population redistribution through net internal migration
1 2 3 4 5Phases of Development over Time
Deve
lopme
nt Sta
tus
High
Mid
Low
Source: Adapted from Rees et al. (2017), Figure 8.

• Francisco Rowe, Martin Bell, Aude Bernard, Elin Charles-Edwards, Philipp Ueffing216
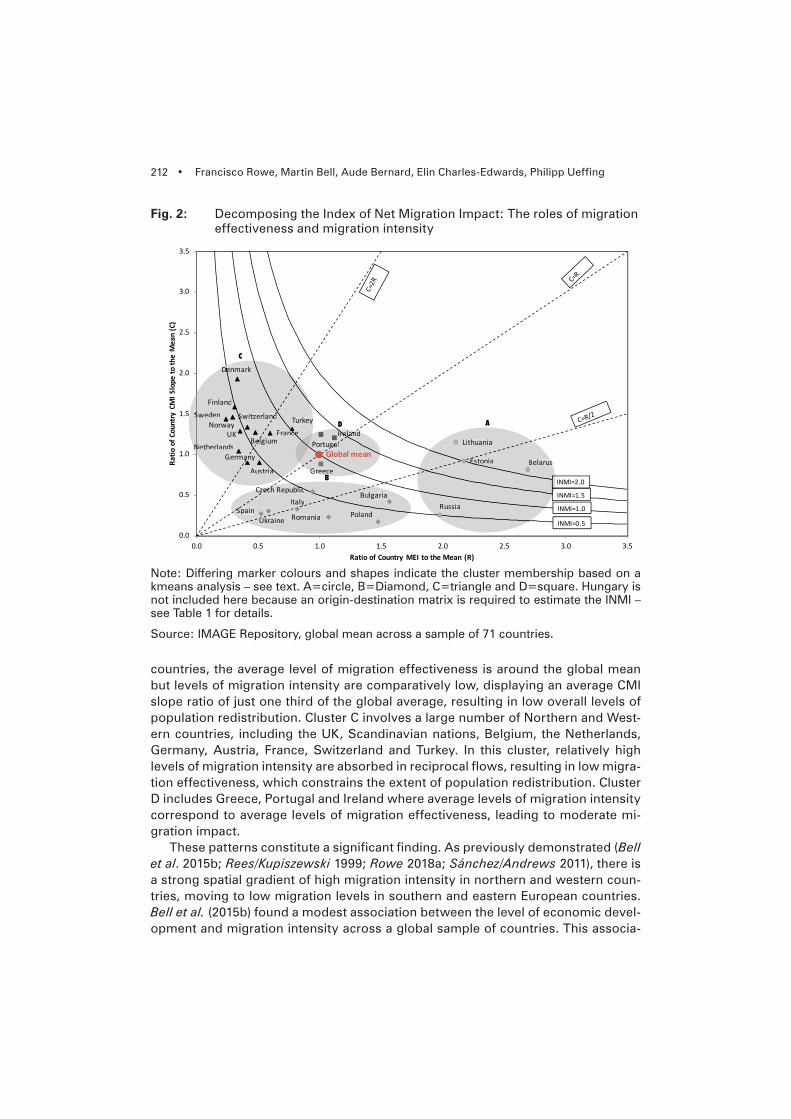
Table 2 ranks the slopes and reports the corresponding level of signifi cance and adjusted coeffi cient of determination R2 for 24 countries. It shows that the predomi-nant pattern is a process of population concentration. Although the strength of pop-ulation redistribution through migration varies, 12 of the 24 countries display slopes which are positive and statistically signifi cant, pointing to net migration gains in densely populated areas and losses in low-density regions. Positive slopes domi-nate most of Northern, Central and Eastern Europe. To the west and south of the continent, however, this pattern is reversed, with negative slopes across Belgium, Italy and Greece. For these countries the predominant process is one of popula-tion deconcentration, whereby gains are occurring in less densely populated ar-eas, fuelled by losses from the more densely populated regions. This pattern is particularly pronounced in Belgium where the slope of -0.88 is driven by popula-tion movement to rural municipalities in the Belgium-Luxembourg border, including Martelange, and Léglise, and in the province of Liege, involving Geer and Wassei-ges, with corresponding population losses in municipalities within the metropolitan region of Brussels, particularly in Sint-Gillis, Sint-Joost-ten-Node, Schaarbeek and Etterbeek. Six countries – Norway, Spain, Italy, the United Kingdom and two Baltic countries (Lithuania and Estonia) – display slopes which are close to zero and are
Fig. 4: Relationship between net internal migration rates and the logarithm of population density in Belarus, Lithuania and Belgium
Note: Linear regressions were estimated at the administrative level in Table 1, with robust standard errors using the Huber-White sandwich estimator, and were population-weighted to recognise the relative importance of regions within a country. All coeffi cients reported are signifi cant (p-value<0.05).
Source: IMAGE Repository
Impact of Internal Migration on Population Redistribution in Europe • 217
not statistically signifi cant. These suggest that migration fl ows across the settle-ment system are closely balanced, resulting in minimal population redistribution. In the United Kingdom, this pattern represents a major shift refl ecting a transition of counterurbanisation fuelled by large net migration losses in London to a pattern of limited redistribution across the country – which is consistent with the pattern of weakening counterurbanisation documented by Lomax/Stillwell (2018). Switzer-
Tab. 2: Estimated slopes capturing the relationship between net migration rate and population density
Country Year Slope Adjusted R2
Concentration or re-urbanisationBelarus 2011 0.73*** 0.69Switzerland 2000 0.68 0.03Portugal 2011 0.65*** 0.21Denmark 2011 0.56*** 0.63Bulgaria 2006 0.49** 0.27Germany 2009 0.41*** 0.27Finland 2011 0.33*** 0.24Netherlands 2010 0.31*** 0.10Russia 2010 0.31*** 0.58Sweden 2012 0.28*** 0.23Turkey 2012 0.27** 0.03Austria 2010 0.22*** 0.20Hungary 2010 0.22** 0.14
Spatial equilibriumNorway 2013 0.17 0.04Lithuania 2010 0.12 0.03Estonia 2010 0.04 0.00United Kingdom 2011 0.02 0.00Spain 2011 0.00 0.00Italy 2009 -0.08 0.02
Deconcentration or counterurbanisationPoland 2010 -0.09* 0.14Romania 2002 -0.12*** 0.14Czech Republic 2010 -0.33*** 0.09Greece 2011 -0.52*** 0.46Belgium 2005 -0.88*** 0.37
Note: * p < 0.05, ** p < 0.01, *** p < 0.001. Population-weighted regression and robust standard errors were used, based on the Huber-White sandwich estimator (Huber 1967; White 1980). Full estimated regression models are reported in Appendix Table A1.
Source: IMAGE Repository

• Francisco Rowe, Martin Bell, Aude Bernard, Elin Charles-Edwards, Philipp Ueffing218
land also stands out as an unusual case displaying a large positive but statistically insignifi cant slope and a low R2 value. These results refl ect large migration gains in dense small urban areas – such as in the district of Freienbach and Lac District in the canton of Schwyz and Fribourg respectively – and heavy losses in a small number of remote rural locations in the Goms and Leventina districts but high variability across middle density areas.
The model elaborated by Rees et al. (2017) suggests three distinctive trajectories for countries at advanced stages at development: urbanisation, counterurbanisation and spatial equilibrium. Our fi ndings show all three processes are at work within Eu-rope and have operated to form a broad spatial gradient. Population deconcentra-tion and spatial equilibrium patterns spread in the West and South of Europe, while population concentration is a feature shared by many countries in the North, Centre and East of Europe where internal migration gains are observed in urban areas.
At the same time, the results show wide variations within these broad regions. The Czech Republic, Romania and Poland display similar patterns of deconcen-tration that stand in stark contrast to the predominant pattern of concentration in surrounding countries. Similarly, in Portugal, the Lisbon area has recorded large population gains spurring population concentration which greatly differs from the minimal population redistribution observed in Spain. Behind these variations lies remarkable similarity in the relatively limited impact of internal migration on popula-tion redistribution, which is a feature anticipated by Rees et al. (2017) for countries at higher stages of development. Positive slopes in our sample ranges from 0.22 to 0.73, on par with Japan (0.42), but much lower than many developing countries in Asia where China (2.6), Vietnam (3.6), Nepal (4.4) and Mongolia (8.5) are still in the process of the urban transition experiencing substantial population gains in met-ropolitan areas (Charles-Edwards et al. 2017), and comparable to more developed countries in Latin America, such as Brazil (0.59) and Mexico (0.86) undergoing popu-lation concentration (Bernard et al. 2017; Rodríguez-Vignoli/Rowe 2018b).
Figure 5 exposes the spatial structure of net migration gains and losses under-pinning this relationship. Here, net migration rates based on administrative areas are superimposed on a base layer showing the major nodes of human settlement, which helps identify the urban areas gaining or losing population from internal mi-gration. Based on country-specifi c means and standard deviations, standardised net migration rates (z-scores) are reported to help pinpoint areas of unusually high net migration gains or losses; that is, z-scores two standard deviations outside the mean. The results reveal that diverse migration processes underpin the overall pro-cesses of population concentration. In Belarus, Portugal, Denmark and Russia, pop-ulation concentration was driven by unusually high migration gains in a handful of large urban centres, while migration losses were found in sparsely populated areas. Signifi cant gains occurred in the cities of Pinsk, Grodno and Polotsk in Belarus; in the Península de Setúbal within the Lisbon region in Portugal; in the Copenhagen metropolitan area in Denmark; and in Moscow and St Petersburg in Russia. These patterns refl ect low variability around the regression line, accompanied by relatively high adjusted R2s as shown in Table 2.

Impact of Internal Migration on Population Redistribution in Europe • 219
Fig
. 5:
Net
inte
rnal
mig
ratio
n ra
tes
(z-s
core
s) fo
r co
untr
ies
wit
h 20
reg
ion
s o
r ab
ove

• Francisco Rowe, Martin Bell, Aude Bernard, Elin Charles-Edwards, Philipp Ueffing220
No
te:
Sta
ndar
dis
ed in
tern
al n
et m
igra
tion
rate
s ar
e d
isp
laye
d b
ased
on
coun
try-
spec
ifi c
mea
n an
d s
tand
ard
dev
iatio
n. C
oun
trie
s ar
e ar
rang
ed
in t
he s
ame
ord
er a
s th
ey a
pp
eare
d in
Tab
le 2
acc
ord
ing
to t
he s
ign
and
sig
nifi c
ance
of t
heir
net
mig
ratio
n sl
op
e fr
om
sta
tistic
ally
sig
nifi c
ant
and
po
sitiv
e, th
roug
h to
sta
tistic
ally
insi
gnifi
cant
and
clo
se to
zer
o, t
o s
tatis
tical
ly s
ignifi c
ant a
nd n
egat
ive.
So
urce
: IM
AG
E R
epo
sito
ry
Fig
. 5:
Co
ntin
uatio
n
Impact of Internal Migration on Population Redistribution in Europe • 221
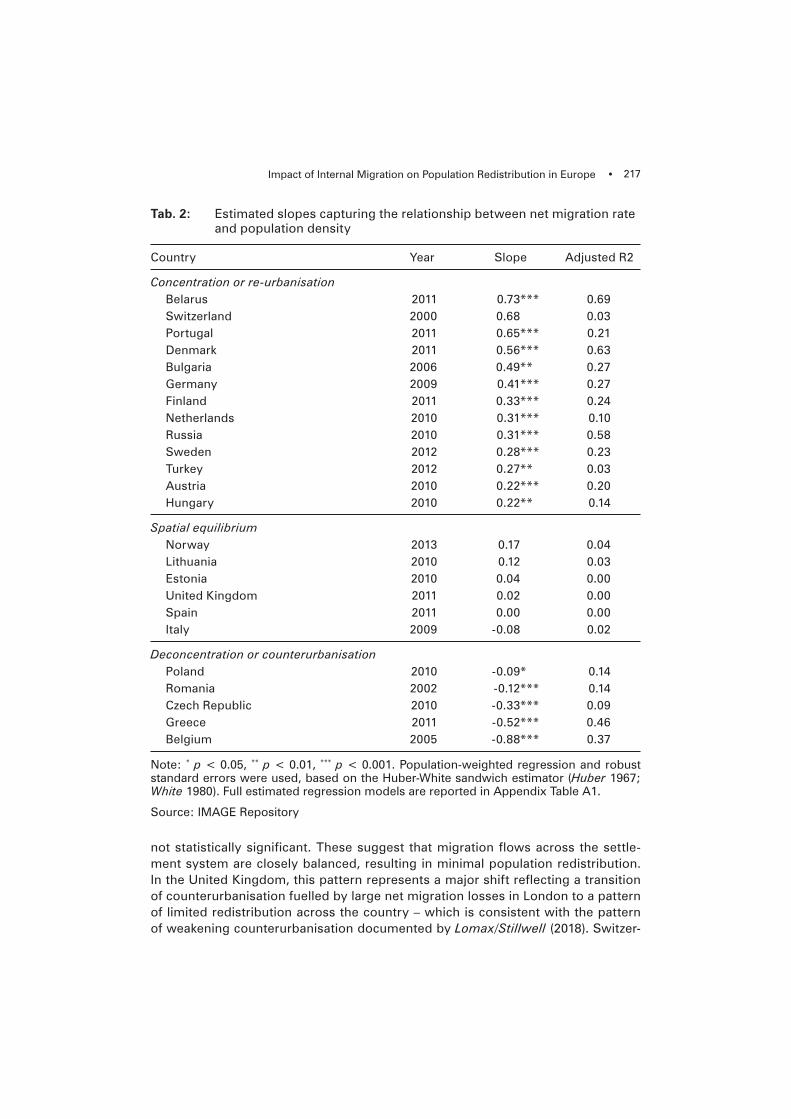
By contrast, patterns of population concentration in Switzerland, Bulgaria, Ger-many, Finland, the Netherlands, Turkey, Austria, Hungary and Sweden are the re-sult of different processes. In Turkey and Switzerland, signifi cant migration gains in dense small urban areas and heavy losses in a small number of remote rural locations shaped overall patterns of population concentration. In Austria, Bulgaria, Hungary and Sweden, population concentration occurred in large cities, and their satellites, most notably in the areas of Vienna, Sofi a, Budapest and Gothenburg. In Germany, on the other hand, migration gains were concentrated in middle-sized and small cities with widespread losses in more remote areas. For example, signifi -cant gains occurred in Dresden, Leipzig, Potsdam (near Berlin) and Tübingen (near Stuttgart), while acute losses were observed in Göttingen and around Cottbus in the east of Germany. Patterns of urban sprawl in Germany are largely a response to high property prices in large urban agglomerations (Sander 2018).
Moderate migration gains and losses underpin spatial equilibrium outcomes in Norway, Lithuania, Estonia, Spain, the United Kingdom and Italy, although with higher rates in areas of intermediate population density. In Spain, Estonia, the Unit-ed Kingdom and Italy, areas of signifi cant gain were located in proximity to key urban centres (eg. Madrid in Spain; Tallinn, Pärnu and Tartu in Estonia; London in the United Kingdom; and, Pisa in Italy), while the cities themselves underwent moderate population losses refl ecting local patterns of urban sprawl. Evidence also suggests that this pattern of spatial equilibrium in Italy refl ects substitution of inter-nal migration with other forms of mobility, notably international migration and long-distance commuting (Bonifazi et al. 2018). It is notable that Figure 5 reproduces the well-established pattern of migration gains in the north and losses in the south of Italy (Bonifazi/Heins 2000). Norway and Lithuania are distinctive in displaying high migration gains and losses in relatively low density and remote areas.
In the fi ve countries experiencing population deconcentration- Poland, Romania, Czech Republic, Greece and Belgium – net losses have occurred mainly from the larger metropolitan areas. In each case the national capitals – Warsaw, Bucharest, Prague, Athens and Brussels – recorded large migration losses. In Poland, the Czech Republic and Greece, these losses were coupled with strong migration gains on the peripheries refl ecting patterns of urban sprawl, rather than a pattern of population reversal (Gordon 1979). In Romania and Belgium, on the other hand, losses from the capital cities were balanced by migration gains in more remote areas scattered across each country.
6 Trends in Population Concentration and Deconcentration
As suggested by Rees et al. (2017), the direction and scale of population redistribu-tion through internal migration change in a non-linear fashion as countries develop, refl ecting the spatial diffusion of urban development and economic growth. At the upper end of the development spectrum, oscillations may be expected with net migration reinforcing, weakening or reshaping patterns of population concentration or dispersal. As yet however, little is known about the persistence of these patterns.

• Francisco Rowe, Martin Bell, Aude Bernard, Elin Charles-Edwards, Philipp Ueffing222
Champion (2001) demonstrated the pervasiveness of counterurbanisation in the British urban system from the 1950s to the 1990s. He also identifi ed marked varia-tions in the intensity of this process, which started in the 1950s and became more pronounced in the 1960s and 1970s during the post-industrial era, with rural areas recording the largest gains in the settlement system. By the 1970s and 1980s the in-tensity of this process had weakened, refl ecting patterns of re-urbanisation coupled with urban sprawl. During the 2000s and 2010s, counterurbanisation continued to weaken with a decrease in magnitude in the net gains and losses recorded in major metropolitan areas and in smaller towns and rural areas, respectively (Lomax/Still-well 2018) and moved to a pattern of spatial equilibrium (Table 2).
To identify changes in the impact of migration in shaping settlement patterns since the 1980s, Table 3 compares the above fi ndings with those for ten countries reported by Rees/Kupiszewski (1999). Care is needed in comparing results from the two studies because of methodological differences. In particular, Rees/Kupiszewski (1999) did not treat population density as a continuous variable but grouped it into broad categories and examined population density against the rate of population change rather than net migration rate as done in the present paper. Bearing these differences in mind, Table 3 suggests continuing population concentration in Por-tugal, Germany and Poland and a pattern of stable spatial equilibrium in Italy, but a transition from concentration to spatial equilibrium in Norway and Estonia, and from deconcentration to spatial equilibrium in the UK. In Romania and the Czech Re-public, the pattern has reversed from population concentration to dispersal while in the Netherlands dispersal has been replaced by renewed population concentration. It is notable that Rees/Kupiszewski (1999) anticipated the shift to population decon-centration in the Czech Republic. They observed a weak urbanisation process, with areas of medium density gaining migrants from both high and low density areas, refl ecting ongoing rural depopulation and local suburbanisation. From the data pre-sented here, this process of urbanisation appears to have halted with population deconcentration now being driven by net internal migration gains in areas of mid-range density.
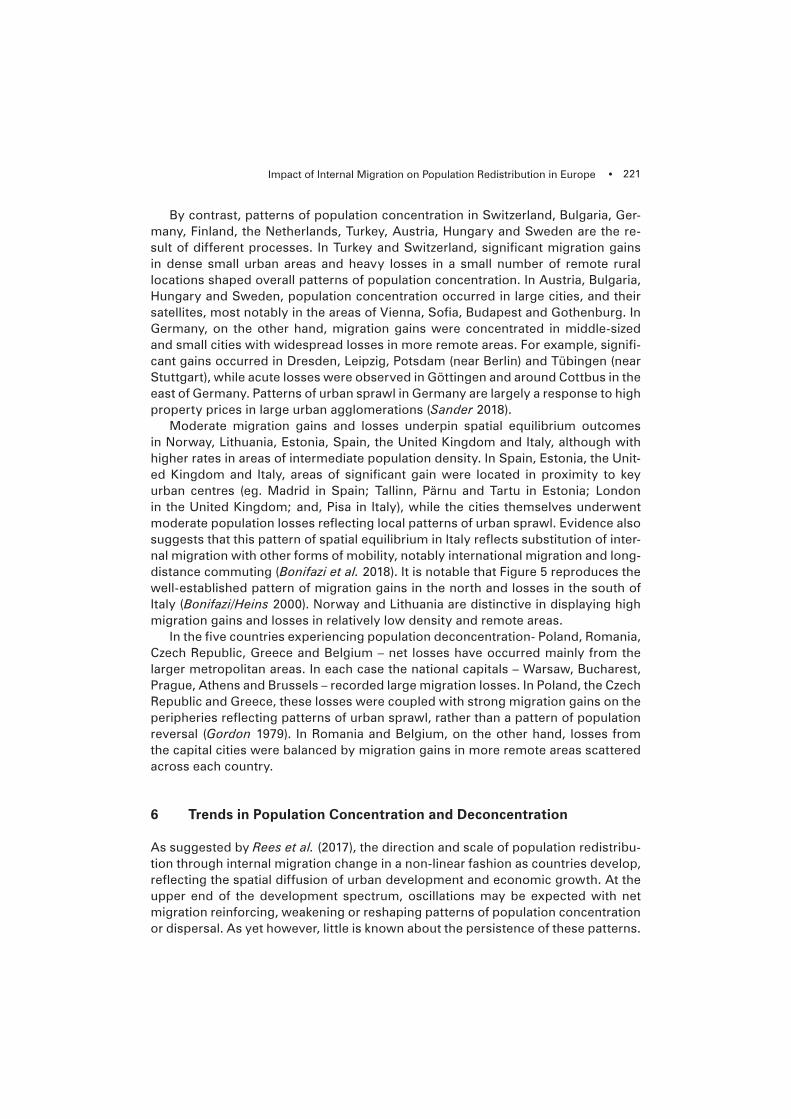
Insights into temporal trends in other countries can also be obtained by compar-ing the slope of the net migration rates against population density over time. Such analysis is, however, challenging because time-series data are scarce and, even where lengthy time series are available from population registers or censuses, anal-ysis is not straightforward. Comparisons are hindered by changes in administrative boundaries and by the way information is recorded (Rowe 2017), but methods have now been developed to produce temporally consistent spatial frameworks to over-come these problems (Blake et al. 2000; Casado-Díaz et al. 2017; Rowe et al. 2017). Drawing on data from the IMAGE repository, we generated temporally consistent geographies to examine temporal changes in the association between net migration rates and the log of population density in four countries – Finland, Germany, Italy and the Netherlands. These were the only countries for which temporally consistent time series could be assembled.
Figure 6 plots the regression slopes for these countries over recent years, reveal-ing wide variation in both the direction and scale of redistribution across the settle-

Impact of Internal Migration on Population Redistribution in Europe • 223
ment system from year to year, except in the case of Italy. Italy consistently displays a negative coeffi cients pointing to the persistence of limited population redistri-bution with small-scale counterurbanisation or spatial equilibrium with migration losses from high density areas and gains in less populous regions. Finland displays a consistently positive but declining slope from 1995 to 2003, followed by a gradu-ally increasing trend. This suggests a stable but weakening pattern of population concentration, with consistent gains in urban agglomerations and losses from low density regions, transitioning in 2003 to a phase of stronger re-urbanisation. In con-trast, Germany displays a steady progression from a moderately negative to a posi-tive slope, refl ecting a continuing transition from spatial equilibrium as observed by Rees/Kupiszewski (1999) to concentration arising from internal migration after reunifi cation. At a lower intensity, a similar trend is observed in the Netherlands with a pronounced drop at the start of the 2000s, consistent with the pattern of deconcentration observed by Rees/Kupiszewski (1999) and later transition to a posi-tive slope. This shift to population concentration is thought to refl ect the increased clustering of economic activity in the Randstad Region (OECD 2014).
Tab. 3: Population density and internal migration patterns: 10 countries analysed by Rees/Kupiszewski (1999)
1980s-1990s* 2000s-2010s**Country C SE D C SE D
Portugal X X Germany X X Poland X X Norway X X Estonia X X Italy X X Romania X XCzech Republic X XNetherlands X X United Kingdom X X
C: Population concentration; D: Population deconcentration; SE: Spatial equilibrium. Note: Rees/Kupiszewski (1999) did not explicitly refer to spatial equilibrium but used the term “intermediate process” to describe countries where most population gains occurred in middle-density areas and population losses in low and high density regions.
Source: * Rees/Kupiszewski (1999), ** results from the present paper

• Francisco Rowe, Martin Bell, Aude Bernard, Elin Charles-Edwards, Philipp Ueffing224
7 Conclusion
Completion of the demographic transition has resulted in migration, both internal and international, becoming the leading agent of demographic change in Europe. While international migration plays an important role in adding population to large urban areas, it makes more limited contributions to populations in regions lower down the urban hierarchy. This underlines the importance of internal migration in transforming settlement systems, particularly in terms of population concentration and deconcentration. However, remarkably little progress has been made in un-derstanding the spatial impact of internal migration in Europe, mainly because of issues of data comparability, coarse dichotomies between rural and urban areas, and the absence of robust comparative metrics. In this paper, we sought to address this gap by harnessing a unique international dataset of country-specifi c internal migration fl ow matrices, developed as part of the IMAGE project, and employing a newly developed suite of scale-independent migration indicators. Using the Index of Net Migration Impact (INMI), we fi rst quantifi ed the impact of migration on popu-lation redistribution at a national level in 26 countries. We decomposed the INMI into its constituent elements to determine the infl uence of migration intensity and migration effectiveness on the resulting level of migration impact. In 24 of the 27
Fig. 6: Fitted slopes capturing the relationship between the net migration rate and population density over time, selected countries
Notes: Linear regressions were estimated using 336 regions for Finland, 412 regions for Germany, 107 regions for Italy and 40 regions for Netherlands. Robust standard errors based on the Huber-White sandwich estimator and population-weighted were used.
Source: IMAGE Repository

Impact of Internal Migration on Population Redistribution in Europe • 225
countries in our sample, we then examined regional net migration rates to assess the spatial effects of this redistribution, regressing net migration against the log of population density, as a proxy for urbanisation.
Our results reveal that the effect of internal migration on population redistribu-tion, as measured by the INMI, is relatively low across Europe, with more than 80 per cent of countries in our sample showing a redistributive effect below the global average. This was particularly marked in Spain, Ukraine, Romania and Poland. With the exception of Lithuania and Belarus, which show levels of population redistribu-tion more than twice the global mean, there is limited variation between European countries in the redistributive effect of internal migration. However, decomposition of the INMI into its constituent elements revealed that the intensity and effectiveness of migration follows a marked spatial gradient. In northern and western Europe, the low redistributive effect of migration is the result of high migration intensity being absorbed by reciprocal migration fl ows, whereas in southern and eastern Europe migration fl ows are highly imbalanced but their effect on population redistribution is offset by low migration intensity. The presence of a clear spatial gradient of high mobility in the north and west of Europe moderating toward the South and East is consistent with prior studies, but our results demonstrated that this spatial gradi-ent dissolves in the case of migration impact because migration effectiveness and migration intensities vary in an inverse manner across Europe. Despite broad simi-larities in the overall impact of migration in redistributing population, there are sig-nifi cant variations between countries in its effects on the settlement pattern. In the north and east of the continent, population redistribution is directed toward more densely populated regions, leading to population concentration or re-urbanisation, whereas this pattern is reversed in the south and west where population gains are focused on lower-density regions, contributing to population deconcentration or counterurbanisation. This broad spatial gradient is interrupted by a number of coun-tries which have reached a spatial equilibrium under which internal migration alters the existing patterns of population settlement only minimally, as is the case in Nor-way, Lithuania, Estonia, Spain, the United Kingdom and Italy.
These fi ndings lend support to the model advanced by Rees et al. (2017), which hypothesised diverse trajectories for countries at the upper end of development ladder, contrasting with earlier phases where migration gains are systematically directed toward more densely populated regions. Our time-series analysis con-fi rmed variability between countries but also revealed variation over time, with an overall trend broadly toward increased population concentration in the four Euro-pean countries in our sample. In Germany and the Netherlands, the early 2000s saw a shift from population spatial equilibrium to concentration, whereas Finland displayed a persistent pattern of population concentration and Italy continued to experience small-scale counterurbanisation (or spatial equilibrium). These fi ndings demonstrate the important variations that existing within and between the regions of Europe in population redistribution processes while highlighting the diminishing impact of migration in shaping settlement patterns in highly urbanised countries.
These fi ndings underline the importance of simple yet robust indices to tease out commonalities and differences in migration processes between countries. This

• Francisco Rowe, Martin Bell, Aude Bernard, Elin Charles-Edwards, Philipp Ueffing226
global overview provides the foundation for further in-depth analysis of the particu-lar patterns of population redistribution within countries as Ravenstein pioneered 130 years ago. Since then, the direction of migration fl ows had evolved, with ur-banisation being increasingly replaced by deconcentration and spatial equilibrium in many European countries. These diverging processes confi rm the importance of considering fl ows and counter-fl ows as originally suggested by Ravenstein in his fourth law (Ravenstein 1885: 199), while highlighting the relevance of conceptualis-ing migration as a system-wide process which extends across the entire settlement system. As shown in this paper, progress in data collection practice and in meth-ods of analysis have permitted a rigorous search for empirical regularities, among which the limited redistributive effect of migration appears to be a fundamental underlying similarity shared by most European countries. Perhaps more important than commonalities are singularities that differentiate countries: the wide variations found in the effect of migration on settlement patterns confi rm the need for nu-anced investigations at a country-specifi c level. The country maps and scatter plots of net migration rates included in this paper offer a starting point to select outlying regions that represent particular cases where population gains (or losses) are higher (or lower) that the regression analysis suggests. New methods (Rodríguez-Vignoli/Rowe 2018a/b, 2017) and analytical software (Rowe et al. 2019) have been devel-oped to extend the analysis beyond exploring net migration balances and measure their impacts on the compositional population structure of areas. Additionally, the comparative analysis of migration processes at a local scale would help unravel the social, economic demographic factors that underpin the heterogeneous population dynamics across the countries of Europe.
AcknowledgementsThe views expressed are those of the authors and are not necessarily those of the United Nations. The work reported in this article forms part of the “Understanding the declining trend in internal migration in Europe” funded by Regional Studies As-sociation under the Early Career Research research grant, and it was also supported under Discovery Project DP110101363, Comparing internal migration in countries around the world: measures, theories and policy dimensions, funded by the Austral-ian Research Council. The article draws from several sources, including the IPUMS database maintained by the Minnesota Population Center and national statistical of-fi ces. We gratefully acknowledge the helpful comments from two anonymous refer-ees and the editor Prof. Phil Rees on an earlier version of the paper as well as attend-ees at the European Regional Science Association conference in Groningen, 2017 and a seminar at the School of Social Statistics within the University of Manchester.
Impact of Internal Migration on Population Redistribution in Europe • 227
References
Bell, Martin et al. 2002: Cross-National Comparison of Internal Migration: Issues and Measures. In: Journal of the Royal Statistical Society. Series A: Statistics in Society 165,3: 435-464 [doi: 10.1111/1467-985X.00247].
Bell, Martin et al. 2018: Global Trends in Internal Migration. In: Champion, Anthony; Cooke, Thomas; Shuttleworth, Ian (Eds.): Internal Migration in the Developed World. Are We Becoming Less Mobile? Oxon: Routledge: 76-98.
Bell, Martin et al. 2015a: Internal Migration Data Around the World: Assessing Contem-porary Practice. In: Population, Space and Place 21,1: 1-17 [doi: 10.1002/psp.1848].
Bell, Martin et al. 2015b: Internal Migration and Development : Comparing Migration Intensities Around the World. In: Population and Development Review 41,1: 33-58 [doi: 10.1111/j.1728-4457.2015.00025.x].
Bell, Martin; Muhidin, Salut 2011: Comparing Internal Migration Between Countries Us-ing Courgeau ’ s k. In: Stillwell, John; Clarke, Martin (Eds.): Population Dynamics and Projection Methods. London: Springer: 141-164 [doi: 10.1007/978-90-481-8930-4].
Bell, Martin; Muhidin, Salut 2009: Cross-National Comparisons of Internal Migration. In: Human Development Research Paper 30: 1-62.
Bernard, Aude 2017: Levels and Patterns of Internal Migration in Europe: A Cohort Per-spective. In: Population Studies 71,3: 293-311 [doi: 10.1080/00324728.2017.1360932].
Bernard, Aude et al. 2017: Comparing Internal Migration across the Countries of Lat-in America: A Multidimensional Approach. In: PLoS ONE 12,3 [doi: 10.1371/journal.pone.0173895].
Blake, Marcus; Bell, Martin; Rees, Philip 2000: Creating a Temporally Consistent Spatial Framework for the Analysis of Inter-Regional Migration in Australia. In: In-ternational Journal of Population Geography 6,2: 155-174 [doi: 10.1002/(SICI)1099-1220(200003/04)6:2<155::AID-IJPG180>3.0.CO;2-A].
Bonifazi, Corrado; Heins, Frank 2000: Long-Term Trends of Internal Migration in Italy. In: International Journal of Population Geography 6,2: 111-131 [doi: 10.1002/(SICI)1099-1220(200003/04)6:2<111::AID-IJPG172>3.0.CO;2-L].
Bonifazi, Corrado; Heins, Frank; Tucci, Enrico 2018: Italy. Internal Migration in a Low-Mobility Country. In: Champion, Anthony; Cooke, Thomas; Shuttleworth, Ian (Eds.): Internal Migration in the Developed World. Are We Becoming Less Mobile? Oxon: Routledge: 242-262.
Boyle, Paul; Halfacree, Keith H.; Robinson, Vaughan 1998: Exploring Contemporary Mi-gration. First. London: Longman.
Casado-Díaz, Jose Manuel; Martínez-Bernabéu, Lucas; Rowe, Francisco 2017: An Evolutionary Approach to the Delimitation of Labour Market Areas: An Em-pirical Application for Chile. In: Spatial Economic Analysis 12,4: 379-403 [doi: 10.1080/17421772.2017.1273541].
Castles, Steve; Miller, Mark 1993: International Population Movements in the Modern World. Vancouver, Canada, Canada: The Macmillan Press.
Champion, Anthony 1989: Counterurbanisation, The Changing Pace and Nature of Popu-lation Deconcentration. London: Edward Arnold.
Champion, Anthony; Cooke, Thomas; Shuttleworth, Ian 2018: A More Mobile World, or Not? In: Champion, Anthony; Cooke, Thomas; Shuttleworth, Ian (Eds.): Internal Migra-tion in the Developed World. Are We Becoming Less Mobile? 1st. ed. Oxon: 3-30.

• Francisco Rowe, Martin Bell, Aude Bernard, Elin Charles-Edwards, Philipp Ueffing228
Champion, Anthony; Vandermotten, Christian 1997: Migration, Counterurbanization and Regional Restructuring in Europe. In: Hans, Blotevogel; Fielding, Anthony (Eds.): Peo-ple, Jobs and Mobility in the New Europe. Chichester: John Wiley: 69-90.
Champion, Tony 2001: Urbanization, Suburbanization, Counterurbanization and Reur-banization. In: Paddison, Ronan (Ed.): Handbook of Urban Studies. London: SAGE Publications Ltd: 143-161 [doi: 10.4135/9781848608375.n9].
Charles-Edwards, Elin et al. 2017: Internal Migration in the Countries of Asia: Lev-els, Ages, and Spatial Impacts. In: ADRI Working Paper Series 15,2: 36 [doi: 10.1080/17441730.2019.1619256].
Courgeau, Daniel 1973: Migrations et Découpages Du Territoire. In: Population 28,3: 511-537 [doi: 10.2307/1530704].
Courgeau, Daniel; Muhidin, Salut; Bell, Martin 2013: Estimer Les Changements de Rési-dence Pour Permettre Les Comparaisons Internationales. In: Population 67,4: 747 [doi: 10.3917/popu.1204.0747].
De Beer, Joop et al. 2010: Demographic and Migratory Flows Affecting European Re-gions and Cities. Luxembourg [https://www.espon.eu/demifer, 29.10.2019].
Dubois, Alexandre et al. 2007: Regional Disparities and Cohesion: What Strategies for the Future. Volume IP/B/REGI/. Brussels: European Parliament [https://www.europarl.europa.eu/hearings/20070625/regi/study_en.pdf, 31.10.2019].
Ertur, Cem; Le Gallo, Julie; Baumont, Catherine 2006: The European Regional Conver-gence Process, 1980-1995: Do Spatial Regimes and Spatial Dependence Matter? In: International Regional Science Review 29,1: 3-34 [doi: 10.1177/0160017605279453].
Esipova, Neli; Pugliese, Anita; Ray, Julie 2013: The Demographics of Global Internal Migration. In: Migration Policy Practice 3,2: 3-6.
Fielding, Anthony 1989: Migration and Urbanization in Western Europe Since 1950. In: The Geographical Journal 155,1: 60-69 [doi: 10.2307/635381].
Geyer, Hermanus 1996: Expanding the Theoretical Foundation of Differential Urbaniza-tion. In: Tijdschrift Voor Economische En Sociale Geografi e 87,1: 44-59 [doi: 10.1111/j.1467-9663.1998.tb01536.x].
Geyer, Hermanus S.; Kontuly, Thomas 1992: A Theoretical Foundation for the Concept of Differential Urbanization. In: International Regional Science Review 15,2: 157-177 [doi: 10.1177/016001769301500202].
Gordon, Peter 1979: Deconcentration without a “Clean Break”. In: Environment and Planning A 11,3: 281-289 [doi: 10.1068/a110281].
Greenwood, Michael 2019: The Migration Legacy of E. G. Ravenstein. In: Migration Studies 7, 2: 269-278 [doi: 10.1093/migration/mny043].
Gujarati, Damodar 2004: Basic Econometrics. Fourth Edi. Boston, USA, USA: McGraw-Hill.
Huber, Peter 1967: The Behavior of Maximum Likelihood Estiamtes Under Nonstandard Conditions. In: Proceedings of the Fifth Berkeley Symposium on Mathematical Statis-tics and Probability. Volume 1. California: University of California Press: 221-233.
Lomax, Nik; Stillwell, John 2018: United Kingdom Temporal Change in Internal Migra-tion. In: Champion, Anthony; Cooke, Thomas; Shuttleworth, Ian (Eds.): Internal Migra-tion in the Developed World: Are We Becoming Less Mobile? Abingdon: Routledge: 120-146.

Impact of Internal Migration on Population Redistribution in Europe • 229
Long, John; Boertlein, Celia 1990: Comparing Migration Measures Having Different In-tervals. In: Current Population Reports, Series P-23, Special Studies 166. Washington DC.: US Bureau of the Census: 1-11.
OECD 2014: OECD Territorial Reviews: Netherlands. Paris: OECD Publishing [doi: 10.1787/9789264008908-en].
Openshaw, Stan 1975: Modifi able Areal Unit Problem. In: Concepts and Teachniques in Modern Geography. Norwich: Geo Books: 169-174 [https://www.uio.no/studier/emn-er/sv/iss/SGO9010/openshaw1983.pdf, 31.10.2019].
Parish, William 1973: Internal Migration and Modernization : The European Case. In: Economic Development and Cultural Change 21,4: 591-609.
Ravenstein, Ernst Georg 1889: The Laws of Migration. In: Journal of the Royal Statistical Societytical Society 52,2: 241-305.
Ravenstein, Ernst Georg 1885: The Laws of Migration. In: Journal of the Royal Statistical Society 48,2: 167-235.
Rees, Philip et al. 2000: Problems and Solutions in the Measurement of Migration Inten-sities. In: Population Studies 54,2: 207-222 [doi: 10.1080/713779082].
Rees, Philip et al. 2017: The Impact of Internal Migration on Population Redistribution: An International Comparison. In: Population, Space and Place 23,6 [doi: 10.1002/psp.2036].
Rees, Philip; Kupiszewski, Marek 1999: Internal Migration and Regional Population Dy-namics in Europe: A Synthesis. Population Studies No.32. Strasbourg: Council of Eu-rope.
Rodríguez-Vignoli, Jorge; Rowe, Francisco 2018a: Efectos Cambiantes de La Migración Sobre El Crecimiento, La Estructura Demográfi ca y La Segregación Residencial En Ciudades Grandes. In: Población y Desarrollo 125,1: 1-90 [www.cepal.org/es/suscrip-ciones, 31.10.2019].
Rodríguez-Vignoli, Jorge; Rowe, Francisco 2018b: How Is Internal Migration Reshaping Metropolitan Populations in Latin America? A New Method and New Evidence. In: Population Studies 72,2: 253-273 [doi: 10.1080/00324728.2017.1416155].
Rodríguez-Vignoli, Jorge; Rowe, Francisco 2017: ¿Contribuye La Migración Interna a Re-ducir La Segregación Residencial?: El Caso de Santiago de Chile 1977-2002? In: Re-vista Latino-Americana de Población 11,21: 7-45 [doi: 10.31406/relap2017.v11.i2.n21.1].
Rogers, Andrei; Castro, Luis 1983: Regional Migration Differentials. In: IIASA Nations Working Paper. Laxenburg, Austria: International Institute For Applied Systems Analy-sis.
Rogers, Andrei; Willekens, Frank; Ledent, Jacques 1983: Migration and Settlement: A Multiregional Comparative Study. In: Environment and Planning A: Economy and Space 15,12: 1585-1612 [doi: 10.1068/a151585].
Rowe, Francisco 2018a: Establishing the Extent and Pace of the Contemporary Trend of Migration Decline in Europe. In: Regions Magazine 1,1 [doi: 10.1080/13673882.2018.00001008].
Rowe, Francisco 2018b: Is Internal Migration Declining in Europe?. In: Regional Studies Association Conference. A World of Flows – Labour Mobility, Capital and Knowledge in an Age of Global Reversal and Regional Revival. June 3rd-6th, Lugano, Switzerland.
Rowe, Francisco 2017: The CHilean Internal Migration (CHIM) Database: Temporally Consistent Spatial Data for the Analysis of Human Mobility. In: Region 4,3: 1 [doi: 10.18335/region.v4i2.198].

• Francisco Rowe, Martin Bell, Aude Bernard, Elin Charles-Edwards, Philipp Ueffing230
Rowe, Francisco; Casado-Díaz, Jose Manuel; Martínez-Bernabéu, Lucas 2017: Func-tional Labour Market Areas for Chile. In: Region 4,3: 7 [doi: 10.18335/region.v4i2.199].
Rowe, Francisco; Patias, Nikos; Rodríguez-Vignoli, Jorge 2019: CIM: Compositional Impact of Migration. R Package Version 1.0.0.: 1-13. Repository CRAN [https://cran.r-project.org/package=CIM, 31.10.2019].
Sánchez, Aida; Andrews, Dan 2011: To Move or Not to Move: What Drives Residential Mobility Rates in the OECD? In: Working Papers 846: 40 [doi: 10.1787/5kghtc7kzx21-en].
Sander, Nikola 2018: Germany. Internal Migration within a Changing Nation. In: Cham-pion, Anthony; Cooke, Thomas; Shuttleworth, Ian (Eds.): Internal Migration in the De-veloped World. Are We Becoming Less Mobile? Oxon: Routledge: 226-241.
Stillwell, John et al. 2016: Internal Migration around the World: Comparing Distance Travelled and Its Frictional Effect. In: Environment and Planning A 48,8: 1657-1675 [doi: 10.1177/0308518X16643963].
Stillwell, John et al. 2014: The IMAGE Studio: A Tool for Internal Migration Analysis and Modelling. In: Applied Spatial Analysis and Policy 7,1: 5-23 [doi: 10.1007/s12061-014-9104-4].
White, Halbert 1980: A Heteroskedasticity-Consistent Covariance Matrix Estima-tor and a Direct Test for Heteroskedasticity. In: Econometrica 48,4: 817-838 [doi: 10.2307/1912934].
Zelinsky, Wilbur 1971: The Hypothesis of the Mobility Transition. In: Geographical Re-view 61,2: 219-249 [doi: 10.2307/213996].
Date of submission: 04.06.2019 Date of acceptance: 29.09.2019
Dr. Francisco Rowe (). University of Liverpool. Liverpool, United Kingdom. E-mail: [email protected] URL: https://www.liverpool.ac.uk/environmental-sciences/staff/francisco-javier-rowe-gonzalez/
Prof. Dr. Martin Bell, Dr. Aude Bernard, Dr. Elin Charles-Edwards. University of Queensland. Brisbane, Australia. Shanghai University. Shanghai, China. E-mail: [email protected], [email protected], [email protected]: https://sees.uq.edu.au/profi le/8939/martin-bell
https://researchers.uq.edu.au/researcher/11037https://researchers.uq.edu.au/researcher/1049
Philipp Ueffi ng. United Nations Department of Economic and Social Affairs, Population Division. New York, United States of America.E-mail: ueffi [email protected]: https://population.un.org/

Impact of Internal Migration on Population Redistribution in Europe • 231
Appendix
Fig. A1: Slope of net internal migration rate (z-scores) as a function of log population density

• Francisco Rowe, Martin Bell, Aude Bernard, Elin Charles-Edwards, Philipp Ueffing232
Fig. A1: Continuation
Note: Linear regressions were estimated at the administrative level in Table 1, with robust standard errors using the Huber-White sandwich estimator (Huber 1967; White 1980), and population-weighted to recognise the relative importance of regions within a country. See Appendix Table A1 for the estimated regression coeffi cients.
Source: IMAGE Repository

Impact of Internal Migration on Population Redistribution in Europe • 233
Tab. A1: Regression Coeffi cients between net migration rate and population density
Country Log10(den) Constant Observations Adjusted R2
Coeffi cient t Coeffi cient t
Belarus 0.728*** -12.62 -1.604*** (-14.34) 130 0.689
Switzerland 0.678 -1.38 -1.736 (-1.48) 184 0.03
Portugal 0.654*** -4.44 -1.534*** (-4.01) 30 0.206
Denmark 0.555*** -12.8 -1.367*** (-11.99) 99 0.633
Bulgaria 0.491*** -3.62 -1.072*** (-4.49) 264 0.274
Germany 0.413*** -10.65 -1.085*** (-10.89) 412 0.268
Finland 0.333*** -9.12 -0.597*** (-8.48) 336 0.242
Netherlands 0.310*** -6.00 -0.912*** (-6.48) 431 0.095
Russia 0.307*** -9.17 -0.503*** (-8.86) 80 0.582
Sweden 0.275*** -6.88 -0.574*** (-7.24) 290 0.232
Turkey 0.273** -2.67 -0.621* (-2.17) 81 0.031
Austria 0.215** -3.31 -0.520*** (-3.76) 99 0.200
Hungary 0.220** -2.85 -0.507** (-3.25) 196 0.135
Norway 0.172 -1.87 -0.350* (-2.44) 428 0.039
Lithuania 0.124 -1.26 -0.277 (-1.34) 60 0.028
Estonia 0.040 -0.37 -0.103 (-0.36) 225 0.000
Spain 0.002 -0.06 -0.005 (-0.05) 52 0.000
United Kingdom 0.020 -2.67 -0.054 (-0.37) 404 0.000
Italy -0.077 (-0.75) 0.190 -0.79 107 0.017
Poland -0.090* (-2.00) 0.217* -2.05 379 0.014
Romania -0.115*** (-4.75) 0.243*** -3.65 42 0.141
Czech Republic -0.332*** (-5.26) 0.779*** -4.95 77 0.092
Greece -0.520*** (-10.55) 1.257*** -8.77 54 0.463
Belgium -0.875*** (-8.24) 2.467*** -8.97 589 0.372
Note: t statistics in parentheses. * p < 0.05, ** p < 0.01, *** p < 0.001. Population-weighted regression and robust standard errors were used, based on the Huber-White sandwich estimator.
Source: IMAGE Repository
Published byProf. Dr. Norbert F. Schneider
Federal Institute for Population Research D-65180 Wiesbaden / Germany
2019
Managing Editor Prof. Philip ReesDr. Katrin Schiefer
Copy Editor Julia Luther
Editorial AssistantBeatriz Feiler-FuchsWiebke Hamann
LayoutBeatriz Feiler-Fuchs
E-mail: [email protected]
Scientifi c Advisory BoardKarsten Hank (Cologne)Michaela Kreyenfeld (Berlin)Marc Luy (Vienna) Natalie Nitsche (Vienna)Peter Preisendörfer (Mainz)Zsolt Spéder (Budapest)Rainer Wehrhahn (Kiel)
Comparative Population Studies
www.comparativepopulationstudies.de
ISSN: 1869-8980 (Print) – 1869-8999 (Internet)
Board of ReviewersMartin Abraham (Erlangen)Laura Bernardi (Lausanne)Hansjörg Bucher (Bonn)Claudia Diehl (Konstanz)Andreas Diekmann (Zurich)Gabriele Doblhammer-Reiter (Rostock)Jürgen Dorbritz (Wiesbaden)Anette Eva Fasang (Berlin)E.-Jürgen Flöthmann (Bielefeld)Alexia Fürnkranz-Prskawetz (Vienna)Beat Fux (Salzburg)Joshua Goldstein (Berkeley)Sonja Haug (Regensburg)Hill Kulu (Liverpool)Aart C. Liefbroer (The Hague)Kurt Lüscher (Konstanz)Emma Lundholm (Umeå)Nadja Milewski (Rostock)Dimiter Philipov (Vienna)Roland Rau (Rostock)Tomáš Sobotka (Vienna)Jeroen Spijker (Barcelona)Olivier Thévenon (Paris)Helga de Valk (Brussels)Heike Trappe (Rostock)Michael Wagner (Cologne)