Impact of flood by a possible failure of the Mosul · PDF fileImpact of flood by a possible...
44
Alessandro Annunziato, Ioannis Andredakis, Pamela Probst Hydrodynamic Simulations Impact of flood by a possible failure of the Mosul dam Version 2, 18 April 2016
-
Upload
nguyenhanh -
Category
Documents
-
view
216 -
download
1
Transcript of Impact of flood by a possible failure of the Mosul · PDF fileImpact of flood by a possible...

Alessandro Annunziato, Ioannis Andredakis, Pamela Probst
Hydrodynamic Simulations
Impact of flood by a possible failure of the Mosul dam
Version 2, 18 April 2016


Impact of flood by a possible failure of the Mosul Dam

This publication is a Technical report by the Joint Research Centre, the European Commission’s in-house science
service. It aims to provide evidence-based scientific support to the European policy-making process. The scientific
output expressed does not imply a policy position of the European Commission. Neither the European
Commission nor any person acting on behalf of the Commission is responsible for the use which might be made
of this publication.
JRC Science Hub
https://ec.europa.eu/jrc
JRC98482
© European Union, 2016
Reproduction is authorised provided the source is acknowledged.
Printed in Italy
All images © European Union 2016
How to cite: Annunziato et al., Mosul Dam Flood Simulations
2
Table of contents
Executive Summary ............................................................................................... 3
1. Introduction ................................................................................................... 4
1.1 Basic dam information ................................................................................ 4
1.2 Dam instability .......................................................................................... 4
2 Hydraulic calculations varying the break size ....................................................... 6
2.1 Affected population .................................................................................. 13
3 Sensitivity Analysis on the initial Lake Level ...................................................... 15
4 Conclusions .................................................................................................. 24
5 Limitations and Uncertainties in this study ........................................................ 25
References ......................................................................................................... 26
Acknowledgements .............................................................................................. 26
List of figures ...................................................................................................... 27
6 Appendix I: Different scenarios of dam failure ................................................... 28
7 Appendix II: Inundation maps of major cities .................................................... 33
8 Appendix III – Maps related to Lake Level Sensitivity Analysis ............................... 4

3
Executive Summary
The dam of Mosul on the Tigris river in northern Iraq is the largest in the country and
holds around 11 km3 of water. Built on water permeable rock, the inherent instability of
the Mosul dam has been known since it was built and this was mitigated by continuous
grouting. In recent years adequate maintenance has not taken place, leading to concerns
about the safety of the dam. From 2003 the government decided to lower maximum water
level from 330 to 319 metres. During the recent conflict, maintenance has again been
disrupted and signs at the dam have triggered renewed concerns highlighted in the
Schnabel report. As a result, the government of Iraq have contracted the Italian
engineering company Trevi to undertake remedial work on the dam. This work is scheduled
to start later in the Spring of 2016.
In late February 2016 the Iraqi government advised the residents of Mosul to move at
least 5 km away from the river in case of breach. A UN mission of UNDAC experts left for
Iraq in early April to assess the situation, supported by an associated expert from the
European Union Civil Protection Mechanism.
A number of studies have been devoted to the possible effects of a failure of the dam. In
this study we perform a number of medium-resolution (180m) dynamic hydraulic
simulations starting from various constant percentages of destruction of the dam and
allowing the corresponding quantity of water (supposing the lake to be at its highest level)
to flow downslope for periods of 6 and 12 days. Compared to previous studies we provide
in addition a complete timescale of the water flow progression, detailed maps of the water
depth and extent in the affected cities’ areas and focus more on the numbers of population
affected by various water depths.
The main scenario analysed in this study, where the dam is 26% destroyed, the level of
the lake is at its maximum value of 330m, and most of the lake’s water is allowed to flow
out fast, results in a very high wave of water (in places 25m high, mean height around
12m) arriving at Mosul city after 1h40min. The capital Baghdad is reached after about
3.5 days with a max water height of 8m and a mean of around 2m.
The simulations suggest that in the above scenario a total of more than 6 million people
(close to one sixth of the country’s population) will be affected by floodwaters, with two
million of them facing water of more than 2m. Water heights of more than 10m would
inundate an area with 270 000 people, most of them in Mosul city and its surroundings,
whose lives, houses and infrastructure would risk complete destruction.
A number of other scenarios involving lower initial levels of the lake are also analysed,
considering levels of 319m (the current one), and 309, 307, 305 and 300m. Significant
reductions in the affected populations and later arrival times are seen for lower initial lake
levels. The differences are quite prominent in Mosul as well as in Baghdad, where we also
provide detailed maps of the inundation in the various cases.
These results are a first-order approximation, favouring speed of calculation over detail
for a rapid assessment; it is planned to refine them later using the available high resolution
ground elevation data (that take much longer to run) and more detailed, time-dependent
scenarios of dam failure.

4
1. Introduction
1.1 Basic dam information
The dam of Mosul was constructed between 1981 and 1986 in northern Iraq. It dams the
river Tigris, forming an artificial lake that holds 11.1 km3 of water at full capacity and its
primary function is to control water flow in the Tigris river. It is located 40km NW of the
city of Mosul and its primary function is to supply electricity to the city’s 1.7 million
inhabitants. It is the largest dam in Iraq, measuring 2km in length and 113m in height. It
is an earth-fill embankment-type dam with a clay core.
Figure 1: The dam of Mosul (Google Earth, 2010)
1.2 Dam instability
Concerns about the dam’s stability and safety began already during construction: because
the dam is built on a foundation of gypsum, anhydrite and limestone, i.e. water-soluble
minerals, water can seep under the dam and compromise its stability, posing the risk of
catastrophic failure (Ref.1 and references therein). To avoid this, continuous maintenance
has taken place since the dam’s opening, in the form of grouting: new leaks are plugged
by injecting a cement mixture into the compromised spots. This ad-hoc solution in itself is
not deemed satisfactory, since grouting at one location causes the seepage of subsurface
water to move to another location but does not stop it (Ref. 2).
In any case, most of this maintenance was stopped in 2014, after the area was taken over
by the forces of the so-called Daesh. Later in 2014 the area passed again under the control
of the of the Peshmerga, the military forces of the autonomous region of Iraqi Kurdistan,
but the maintenance has not been fully restarted and fears about the dam’s stability have
multiplied. According to media reports, the grouting machines have been damaged and
there is no cement supply, and even the gates of the overflow spillway (visible on the right
of the dam in the photo above) are malfunctioning (Ref. 3). Moreover, as spring advances,
the water level is expected to increase from snowmelt, increasing further the pressure on
the dam. Another possible threat that has been mentioned is deliberate destruction of part
of the dam as a warfare act; this scenario was invoked primarily during the 2003 Gulf war.
In early March 2016 it was announced (Ref. 4) that the Iraqi government had awarded a
contract to a European company to resume maintenance and guarding of the dam. It is
not clear, however, when the works would actually start. The Iraqi government also
announced an experts’ mission to assess the dam’s stability in late February. (Ref. 5)

5
Despite many warnings and studies indicating the possible instability of the dam, the
official stance of local officials until recently has been reassuring, claiming that the risks
were exaggerated (Ref. 3). In late February, however, this was reversed, with the Iraqi
Prime Minister advising the population of Mosul to move at least 5km away from the Tigris’
river bed in the case of failure (Ref. 6).
1.4 Past studies of flood effects by dam failure
The most detailed study until of the possible mechanisms and eventual effects by failure
of the Mosul Dam until this day remains the one of Swiss Consultants in 1984, summarised
in Ref. 1. In that study a number of dam failure models were developed, based on a
progressive breach of various widths and most of the water of the reservoir was emptied
in 6 to 8 hours after the initial breach. Most interesting to compare with this present paper
is the tracing of the wave downstream. Those results of 1984 can be summarised as
follows:
- The initial height of the wave is 55m, decreasing to 45m after the first 20km.
- Mosul city will be affected by the flood 4 hours after the breach; the maximum wave
height will be 24m and it will inundate 74 km2 of the Mosul city area.
- The city of Tikrit will be reached after 22h and the maximum height will be 15m,
inundating 69 km2.
- Northern Baghdad will be reached after 38 hours and central Baghdad after 44 hours,
with a wave of 4m. A total of 217 km2 will be inundated.
No detailed affected population numbers have been calculated in this study; rough
estimates in the media mention around 500 000 people in direct risk of loss of life.
A preliminary study (Ref. 9) on the Mosul dam failure inundation on a much shorter time
scale was carried out in early March 2016 by the Institute of Environment and
Sustainability of the Joint Research Centre. In this 2-dimensional hydraulic modeling at
low resolution, it was calculated that 4.7 million people would be affected, an area of 7,700
square km would be inundated and Mosul would face a mean flood depth of 9.8m affecting
200 000 people.
Another study by Thair et al (Ref. 10) consider a time for the creation of the break. The
break time is up to about 4h in the case of 330 m a.s.l.; in this study we assumed an
instantaneous opening, in order to assess a worst-case scenario.

6
2 Hydraulic calculations varying the break size
A number of calculations has been performed in order to estimate the dam break
propagation from the Mosul dam into the downstream valley in the 6 days following the
break event. The calculations have been performed using the HyFlux2 computer code,
developed at the JRC (Ref. 7) and routinely used for Tsunami and Storm surge events but
originally developed to analyse dam break problems.
In order to execute the calculations some
preliminary analysis of the topography and
retrieval of dam characteristics have been
performed: using those data we proceeded to
determine the original topography of the
valley where the dam was built (i.e. without
the lake’s water) and definition of the break
characteristics.
The original topography has been obtained by the publication of Elias Issa (Ref. 8) that is
reporting the results of a bathymetric survey in the lake performed in 2011. Unfortunately,
it was not possible to contact the author and therefore we have used the image below in
order to obtain the elevation above the sea level of the lake bottom, i.e. the original
topography without the lake. the current better available topography, i.e. SRTM 90 m,
consider the lake at an elevation of 307-310 m. We considered the elevation of the lake
at 330m that is the maximum normal operational water elevation (and thus taking the
worst-case scenario as far as water volume is concerned).
Figure 2: Lake bathymetry (from Issa 2015)
From the figure above the dam bottom topography has been obtained, resampled at 90m
and substituted to the STRM90 in the area of the lake. The dam break has been simulated
by considering a reduction of pixels in the topography so that water could flow out of the
lake.
The following figure represents the topography of the dam valley with the dam simulated.
To simulate the break, a few pixels of those that play the role of the dam (red squares in
the figure) have been substituted by lower pixels in order to allow a direct connection
7
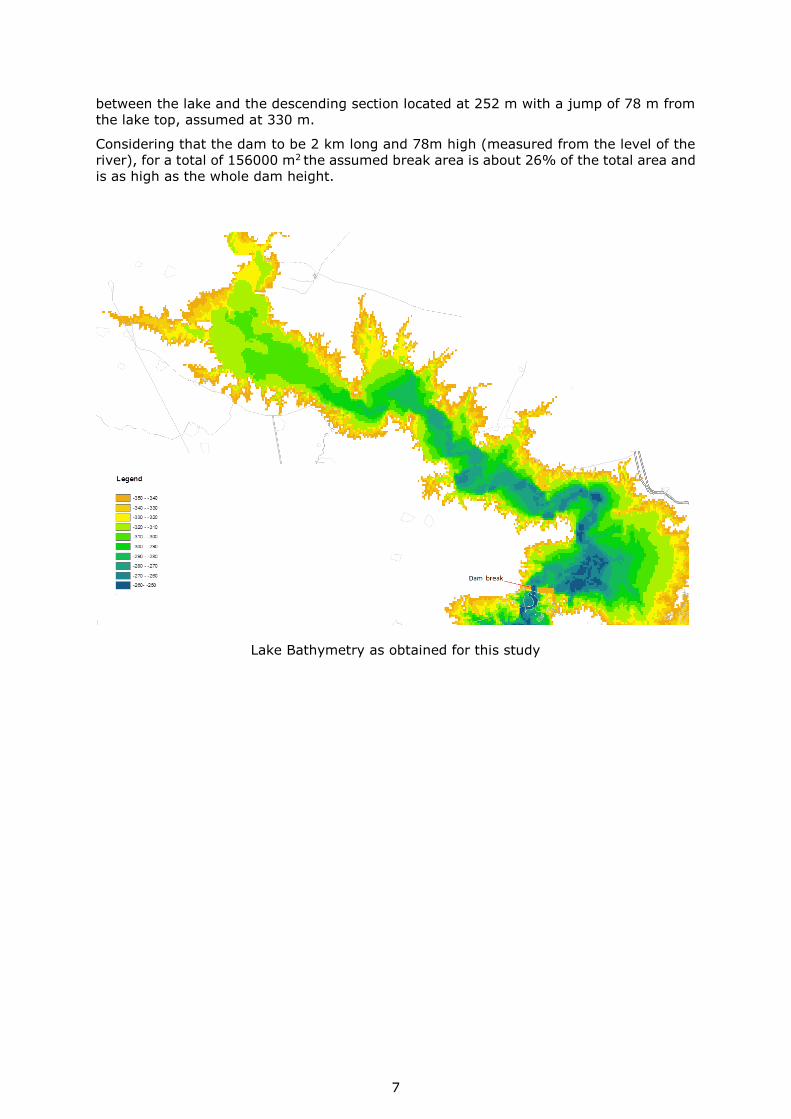
between the lake and the descending section located at 252 m with a jump of 78 m from
the lake top, assumed at 330 m.
Considering that the dam to be 2 km long and 78m high (measured from the level of the
river), for a total of 156000 m2 the assumed break area is about 26% of the total area and
is as high as the whole dam height.
Lake Bathymetry as obtained for this study

8
Break simulation
252 m
330 m
Figure 4: Dam breach representation
Figure 3: Dam breach profile

9
The above break can be considered a large one, as the total elimination of the whole dam
from top to bottom might not be realistic. For a sensitivity analysis, a case with 60% area
break was run; the results of this 60% break are not very different from the ones of 26%,
used in the rest of the study. A case with a strong reduction of this area was also run, with
an area of only 7% limited to the upper part of the dam, to simulate a deliberate explosion.
The results of the 26% case here are therefore considered representative of a rather
severe break. Indicative results and maps resulting from the other scenarios are given in
Appendix I.
Results of the dam break event (26% break)
The propagation of the water flow is indicated in the time sequence below for the 6 days
of the simulation. The simulation was run using 10 cores on a Linux machine with a
resolution of 180 m per each cell and took about 24 h of CPU time.

10
Figure 5: Time evolution maps of the water flow.

11
Figure 6: Overview map of water flow and travel time

12
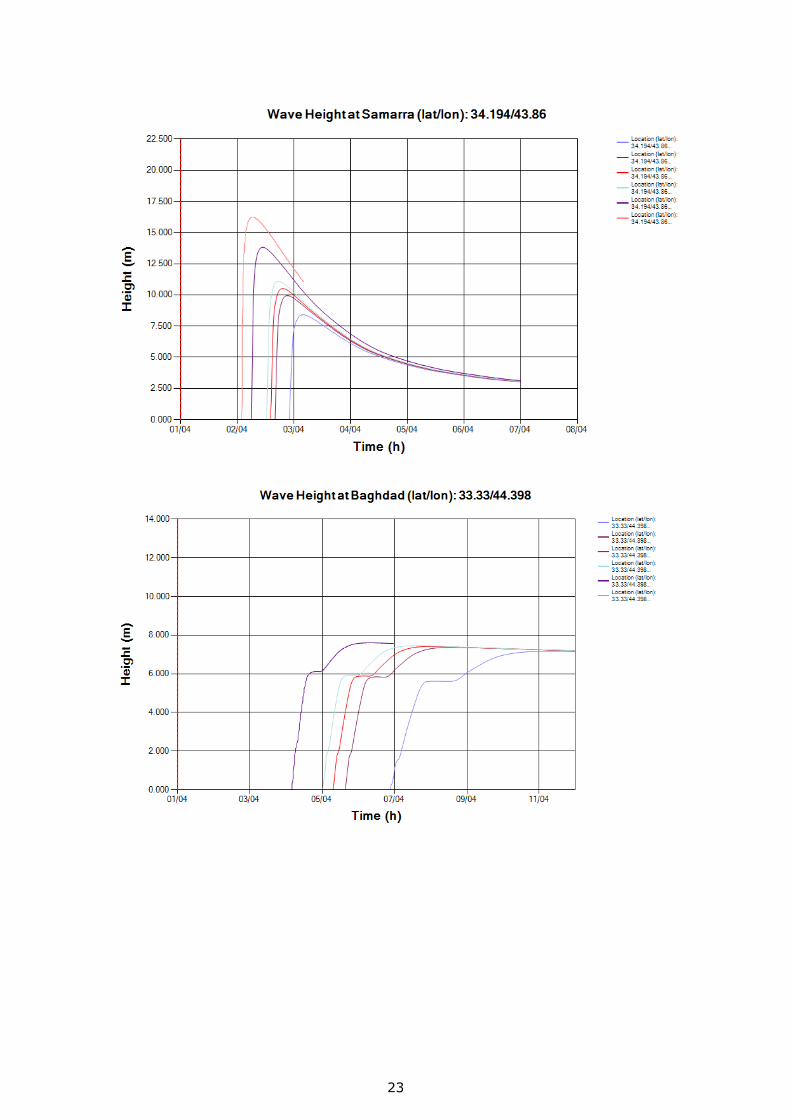
The progression of the flow in the valley occurs following the average local slope. At the
beginning, when the slope is higher the speed is quite large, in the order of 40 km/h then
the speed decreases and finally almost stops in Baghdad where a very flat area exists. As
it can be seen also from the plot below, the various cities upstream Baghdad keep the
water high for much shorter period while in this last city the height of the water is lower
but stays for much longer. The flow progression can be visualised as an animation in this
URL: http://goo.gl/CqdQhX
Item Height (metres a.s.l)
Distance (km)1
Slope (%)
Average speed (km/h)
Time of wave arrival
(h)2
Time of max height (h)
Max Height (m)
Dam break 252 0 - 0 0 78
Mosul 217 69 -0.05 40. 1.7 6.2 26.4
Bayji 109 180 -0.06 11. 16.8 23.5 14.3
Tikrit 89 47 -0.04 11. 21.0 26.5 14.4
Samarra 66 54 -0.04 18. 25.8 30.8 16.1
Bagdad 38 108 -0.03 2.6 67.0 117.0 7.9
Figure 7: Water height versus time for the lake and for the major cities downstream.
1 Distance between two points 2 Time of arrival is considered at the city centre. In the case of Baghdad the periphery is
reached a few hours earlier

13
2.1 Affected population
For population calculations in this section we use the same scenario as above, i.e.
maximum initial lake level of 330m. To obtain numbers for the population affected by
the flood wave we superimposed the maximum water height maps of the above analysis
on the LANDSCAN 2014 Global Population Database, with a resolution of approximately
1km2. Altough SRTM 90m is the best complete available topography layer (Sentinel data
are sparse for this region), it is important to mention that the in some areas there could
be local errors which could affect the flood depth and flood extent, therefore the maps
should be used with caution and always considering real ground conditions. In the
estimation of the population possibly affected current refugee camps and displaced people
are not included and may be included, if available, in a future revision of this document.
The floodwave raster was binned in 5 water height classes, with these limit values: 0.1m,
0.5m, 2m, 5m, 10m. Any area with more than 0.1m of water we consider to be affected
by flooding. The total population and area affected by the different water heights is given
in the table below:
The total population affected by floodwaters higher than 0.1m is a little over 6 million
people or a very significant 16% of the total population of Iraq. The flooded area is
close to 2% of the country’s total surface.
A sub-total of more than half a million people would be exposed to floodwaters of
more than 5m high, thus having their lives at immediate peril; a large percentage of
those would have less than two hours warning time, as will be shown below.
Moreover, a very significant surface area will be inundated, with subsequent destruction
of critical infrastructure, houses, crops and all livelihood. The cost of the damage is not
easy to calculate, but it is easy to understand that the scale of the disaster would be
enormous and the economic impact in the country and the whole region would be
impossible to bear.
We repeated the above calculation for the greater areas (5 – 10 km from the city centre)
of five major cities along the Tigris river and the results are shown in the Table below.

14
The lower part of the Table gives the time for the arrival of the first volume of water, that
of the maximum height (that in general has a significant delay of at least a few hours with
respect to the first wave) and the maximum water height in meters. (these figures are
copied and rounded from the table with the detailed results of the simulations in the
previous Section).
It is worthwhile to comment on the case of Mosul – the reader is also referred to the
detailed map of the inundation in each of the above cities, in Appendix I. There are a few
points to highlight:
1. The city is built on either side of Tigris, with densely inhabited neighbourhoods
close to the river. As a result, a very large number of people will be exposed to
prodigious heights of floodwater: 183 000 people, more than 10% of the city’s
population of 1.7 million will be affected by more than 10m wave height, which
could mean complete destruction.
2. The warning time will be very short; even if a dam breach is signalled
immediately, within 3 hours the water height in Mosul will have already reached
close to 20m (see the graph with depth and time reached in the previous chapter).
Evacuation of almost 250 000 people from the banks of Tigris in a few hours is very
difficult to accomplish.
3. Due to the ground morphology, as can also be seen in the map in Appendix I, the
water level drops sharply at around 4 km away from the river bed. A possible
evacuation, therefore, would have to be carried out at this distance; the value of
4-5km agrees well with that recommended by the Iraqi government in March 2016.
4. The value for the maximum wave height in Mosul in these calculations is in good
agreement with the values estimated in the study of Swiss Consultants in 1984
(24m). The time of arrival is also in good agreement: SC gave a value of 4h for a
wave of 24m, while we give 3 hours for 20m and 6 hours for the maximum of 26m.
Significant damage and loss of life should also be expected in the other cities along the
river, with very high water levels of more than 10m present. It is interesting to notice that
in Samarra, a long way downriver, the maximum height is actually larger than that of
Tikrit, higher upstream.
In Baghdad, heights of up to 8m were shown by the calculations in a few places; the mean
value in the Baghdad greater area, however, is quite lower, at around 2m. More than 1
million people would be exposed to depths of 2-5m. What is worrying in this case, as can
be seen in the height-time graph in the previous section, is that the floodwaters take much
longer to drain away from the Baghdad area, owing to the flat ground morphology.

15
3 Sensitivity Analysis on the initial Lake Level
On request of the UNDAC team onsite a number of additional calculations have been
performed in order to assess the effect of the lake level reduction on the inundation depth
and extent. The initial break size was kept as the intermediate case (26% of the total
area) as we saw no large differences with the 60% break and because we considered
unrealistic a complete or partly complete destruction of the dam.
The following cases have been considered from 300 m (minimum operational level for the
power plant) to 330 m (the base case maximum:
Elevation (m a.s.l.)
Initial Volume (km3)
Final Volume (km3)
Discharged Volume
(km3)
330 9.6 0.5 9.1
319 5.9 0.5 5.4
309 3.6 0.5 3.1
307 3.3 0.5 2.8
305 2.9 0.5 2.4
300 2.2 0.5 1.7
The reduction of the initial water level strongly reduces the amount of water that is
discharged in case of break from about 9.1 to 1.7 cubic km; the release time is increased
from 12 to 21 hours3.
The effect on the maximum water height and arrival time can be seen in the following
tables and plots.
The effect of the reduction on the maximum height is more evident in Mosul rather than
in Baghdad, where the maximum height remains unchanged but the larger effect is on the
extent of the flooding as lowering the initial height the flooded area is largely reduced,
consistently with the reduction in the discharged volume. The highest lake area cases will
be extended beyond 6 days while all the other cases have been run for 12 days.
Appendix B reports all the maps related to these cases. The map below shows the variation
of the inundated areas in Baghdad by increasing the lake height. It is possible to note the
larger inundation that takes place as the lake height is increased. On the right of the map
the arrival times are also shown and it is possible to note how the lake height reduction
tends to move the arrow related to 1 day to northern area, which means that the time for
arriving to the various locations increases.
The tables after the next map indicate the
population and area affected by varying
the lake level. As a whole, from 6.2 million
people globally affected the population
globally affected reduces to 2.2 million,
thus at least 1/3 of the population
affected by the largest height. The figure
on the right indicates the overall
population as a function of the lake
height.
3 Release time is difficult to establish because the level is decreasing exponentially. We
consider arbitrarily as the time at which the level is smaller than 1m
0
2
4
6
8
290 300 310 320 330 340
Mill
ion
of
peo
ple
un
der
inu
nd
atio
n
Lake Height (m absl)
Population vs Lake Height

16
Maximum Height
Lake Elevation Mosul Banyji Tikrit Samarra Bagdad
330 26.3 14.3 14.5 16.1 8.0
319 22.7 11.8 11.8 13.8 7.6
309 19.2 9.3 9.5 11.1 7.5
307 18.6 8.9 9.1 10.4 7.4
305 17.9 8.3 8.7 9.9 7.3
300 16.0 7.3 7.8 8.3 7.1
0
5
10
15
20
25
30
295 300 305 310 315 320 325 330 335
Max
imu
m h
eigh
t (m
)
Lake Elevation (m a.s.l)
Maximum height vs Lake Elevation
Mosul Banyji Tikrit
Samarra Bagdad Linear (Mosul)
Poly. (Banyji) Linear (Samarra) Linear (Bagdad)

17
Arrival times
Lake Elevation Mosul Banyji Tikrit Samarra Bagdad
330 1:40 16:56 21:08 26.12 76:15
319 2:29 18:59 24:07 30.05 76:20
309 2:55 22:54 29:00 36.48 96:40
307 2:54 23:45 30:04 38.12 103:05
305 3:17 24:53 31:19 40.12 111:31
300 3:40 28:32 35:58 46.18 141:33
0.00
20.00
40.00
60.00
80.00
100.00
120.00
140.00
160.00
295 300 305 310 315 320 325 330 335
Tim
e o
f ar
riva
l (h
)
Lake Elevation (m a.s.l)
Arrival time vs. Lake Elevation
Mosul Banyji Tikrit Samarra
Bagdad Linear (Mosul) Linear (Banyji) Linear (Tikrit)
Linear (Samarra) Poly. (Bagdad)

18

19

20

21

22
23

24
4 Conclusions
In this study we present numerical simulations of the flood wave following a breach of the
Mosul dam, long known to be potentially unstable due to the water-permeable ground in
which it was built. A few scenarios were run, within the time-limits set by this rapid-
assessment report, considering the worst case scenario of a full reservoir and varying the
percentage of dam surface destruction. Most conclusions are drawn from the case where
the lake is at its maximum level of 330m and 26% of the dam is destroyed; while larger
break percentages don’t show siginficant differences. The focus of this study is the time-
evolution and the characteristics of the flood wave and its effects on the population on the
banks of the river Tigris.
Our calculations show the following:
1. The floodwave will reach the city of Mosul in less than two hours, it will attain
heights of more than 20m in around 3hours and its maximum height at the city,
26m, after 6 hours. An area housing about 180 000 people, almost 10% of the
city’s population, would be exposed to a floodwave of more than 10m, thus risking
complete annihilation.
2. The water wil continue downstream, having still a very significant height that is
only slowly reduced and affect a total of about 6 million people. A total of more
than 500 000 people (including Mosul) would be exposed to floodwaves of more
than 5 metres in height. An area of 7 200 square km would be inundated, with a
huge economic and social cost.
3. According to these simulations, in the case of Mosul, an evacuation within 4 to 5
km from the river would be advisable.
4. Our results are in good agreement with results of previous studies. Here we add a
detailed time profile of the floodwave’s height and an up-to-date estimate of the
affected population using GIS. We also provide detailed maps of the potentially
affected cities.
Further analyses have been performed by varying the initial lake height in view of
identifying the effect of the lake height reduction on the maximum flow depth and the
extent of inundation and affected population. The results show that the lake height
reduction plays a very important role in the reduction of both quantities and also
in the times elongation so that more time is available for the population to
evacuate from the possibly affected areas: as a matter of fact the arrival time in
Bagdhad increases from 3 to 6 days by reducing from 330 to 300 m height with obvious
improvements in the possible consequences.

25
5 Limitations and Uncertainties in this study
There are a number of factors that can influence the numerical results and the conclusions
of this study. These should always be kept in mind when considering the results, and
especially if life-or-death decisions are to be taken based on them. Uncertainties and errors
can be introduced by the following factors.
1. Errors in the data and low resolution of the ground topography: In this study we used ground data of 180m resolution that can “smooth out” particular ground features. This can also affect the times and depths reported for the flood wave. The authors expect to be able to run simulations of higher resolution (that are quite time-consuming) in the near future.
2. Errors in the data and changes in the population numbers: In the first draft of this study we used the population data of LANDSCAN 2014 with a rather low resolution of around 1 km2 and we continued using this set for consistency. More importantly, this data set cannot possibly take into account recent population movements caused by warfare. The population data we give should be considered under these restrictions. Future modelling would use more detailed population data sets recently made available, such as the Global Human Settlement Layer (GHSL).
3. Modelling of the dam failure: As mentioned in the text, these simulations model the dam break to be almost instantaneous; it might be more realistic to introduce a gradual failure, as has been done in other studies. This would lower the maximum flood-wave height and the arrival time of this maximum (but would have lesser effects on the inundation extent). It is not the intention of this study to model the dam break with precision, but rather to estimate the affected population in a rapid-assessment manner.
4. The lake bathymetry was deduced by digitising a raster image in the study of Issa (2015). A more precise bathymetry would render the water volumes and the flow-out times more accurate.

26
References
1. Al-Ansari, Adamo, Issa, Sissakian, Knutsson, “Mystery of Mosul Dam the Most Dangerous Dam in the World: Dam Failure and its Consequences”, Journal of Earth Science and Geotechnical Engineering, Vol. 5 no. 3, 2015, 95-111.
2. Kelley, Wakeley, Broadfoot, Pearson, McGill, Jorgeson, Talbot, McGrath, “Geologic Setting of Mosul Dam and its Engineering Implications”, Final Report, US Army Corps of Engineers, ERDC TR-07-10, September 2007
3. The Guardian, 2 Mar 2016, http://www.theguardian.com/world/2016/mar/02/mosul-dam-engineers-warn-it-could-fail-at-any-time-killing-1m-people
4. Iraq Business News, 3 Mar 2016, http://www.iraq-businessnews.com/2016/03/03/iraq-signs-contract-with-italian-firm-to-consolidate-mosul-dam/
5. Iraqi Ministry of Water Resources: http://www.mowr.gov.iq/ar/node/75 6. The Guardian, 29 Feb 2016, “Iraqi PM and US issue warnings over threat of Mosul dam
collapse”, http://www.theguardian.com/world/2016/feb/29/iraq-us-issue-warnings-threat-of-mosul-dam-collapse
7. G. Franchello, E. Krausmann - 'HyFlux2: a numerical model for the impact assessment of severe inundation scenario to chemical facilities and downstream environment' - EUR 23354 EN – 2008
8. Elias Issa – ‘Sedimentological and Hydrological Investigation of Mosul Dam Reservoir’ – Doctoral Thesis - Luleå University of Technology, 2015
9. Hojas-Gascon, Bianchi, Alfieri, Dottori, Salamon, JRC/ERCC report, 4/3/2016, private communication. K
10. Thair M. Al-Taiee 1 and Anass M. M. Rasheed – “Simulation Tigris River Flood Wave in Mosul City due to a Hypothetical Mosul Dam Break” - Thirteenth International Water Technology Conference, IWTC 13 2009, Hurghada, Egypt
Acknowledgements
The authors would like to thank Giovanni Franchello for his help with setting up the Hyflux2 code and Andrea Gerhardinger for the digitalisation of the bathymetry maps and general GIS support.

27
List of figures
Figure 1: The dam of Mosul (Google Earth, 2010) ..................................................... 4
Figure 2: Lake bathymetry (from Issa 2015) ............................................................ 6
Figure 3: Dam breach profile .................................................................................. 8
Figure 4: Dam breach representation ....................................................................... 8
Figure 5: Time evolution maps of the water flow. .................................................... 10
Figure 6: Overview map of water flow and travel time ............................................. 11
Figure 7: Water height versus time for the lake and for the major cities downstream. . 12
Figure 8: Dam failure profiles for the different scenarios run. The dam is seen face-on. 28
Figure 9: Height-Depth graph for the lake, for the three scenarios: 7% damage (blue),
26% damage (brown), 60% damage (red) ............................................................. 29
Figure 10: Height-Time graph for Mosul, for the three scenarios: 7% damage (blue), 26%
damage (brown), 60% damage (red)..................................................................... 29
Figure 11: Height-Time graph for Baghdad, for the three scenarios: 7% damage (blue),
26% damage (brown), 60% damage (red) ............................................................. 30
Figure 12: Comparison of the inundation maps for two scenarios: 7% (blue) and 26%
damage (orange area). ........................................................................................ 31
28
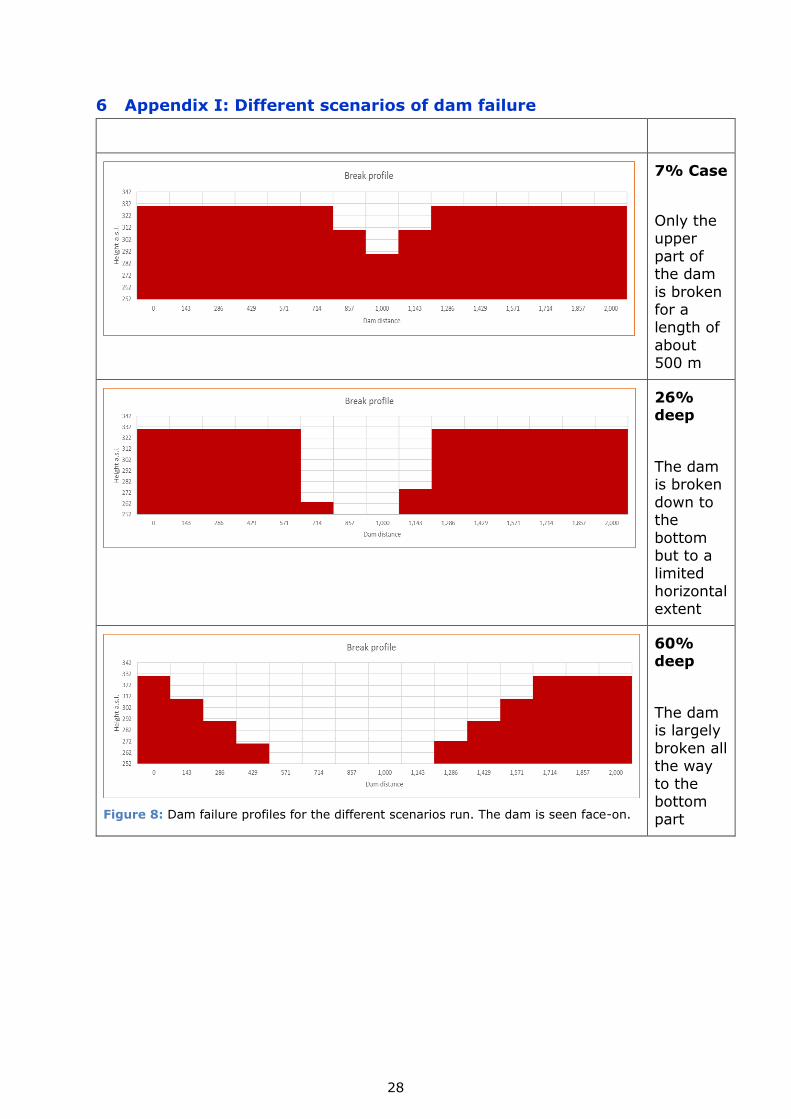
6 Appendix I: Different scenarios of dam failure
7% Case
Only the upper
part of the dam
is broken for a length of
about 500 m
26% deep
The dam is broken
down to the
bottom but to a limited
horizontal extent
Figure 8: Dam failure profiles for the different scenarios run. The dam is seen face-on.
60% deep
The dam is largely
broken all the way
to the bottom part

29
Figure 9: Height-Depth graph for the lake, for the three scenarios: 7% damage (blue), 26% damage (brown), 60% damage (red)
Figure 10: Height-Time graph for Mosul, for the three scenarios: 7% damage (blue), 26% damage (brown), 60% damage (red)

30
Figure 11: Height-Time graph for Baghdad, for the three scenarios: 7% damage (blue), 26%
damage (brown), 60% damage (red)
7% break 26% break 60% break
ORIGINAL LAKE VOLUME
(km3)
9.6 9.6 9.6
Residual Volume After Break 3.2 0.5 0.5
LOST WATER VOLUME 6.4 9.1 9.1
The table above shows that the final amount of water expelled in the 28 and 60% cases is the same, while the one with 7% is 30% less; the emptying time is also much longer and this explains the much smaller dynamic and final height in Baghdad.

31
Figure 12: Comparison of the inundation maps for two scenarios: 7% (blue) and 26% damage (orange area).

32

33
7 Appendix II: Inundation maps of major cities
These maps show the flood wave height contours superimposed on maps of the cities. All
maps in this Appendix use the results of the 26% damage scenario with the maximum
initial level of the lake, 330m. Background data were extracted from OpenStreetMap
(OSM). We used the city’s streets and (where enough data were available) the land-use
classification to indicate the approximate extent of the inhabited urban areas. As inhabited
areas (shown in light grey) we used the following classes of OSM: Residential, Commercial,
Industrial, Military, Cemetery. In places where the flood wave colours overshadow those
of the urban areas, one could consider the existence of city-like streets as a rough indicator
of inhabited areas.


2

3

4
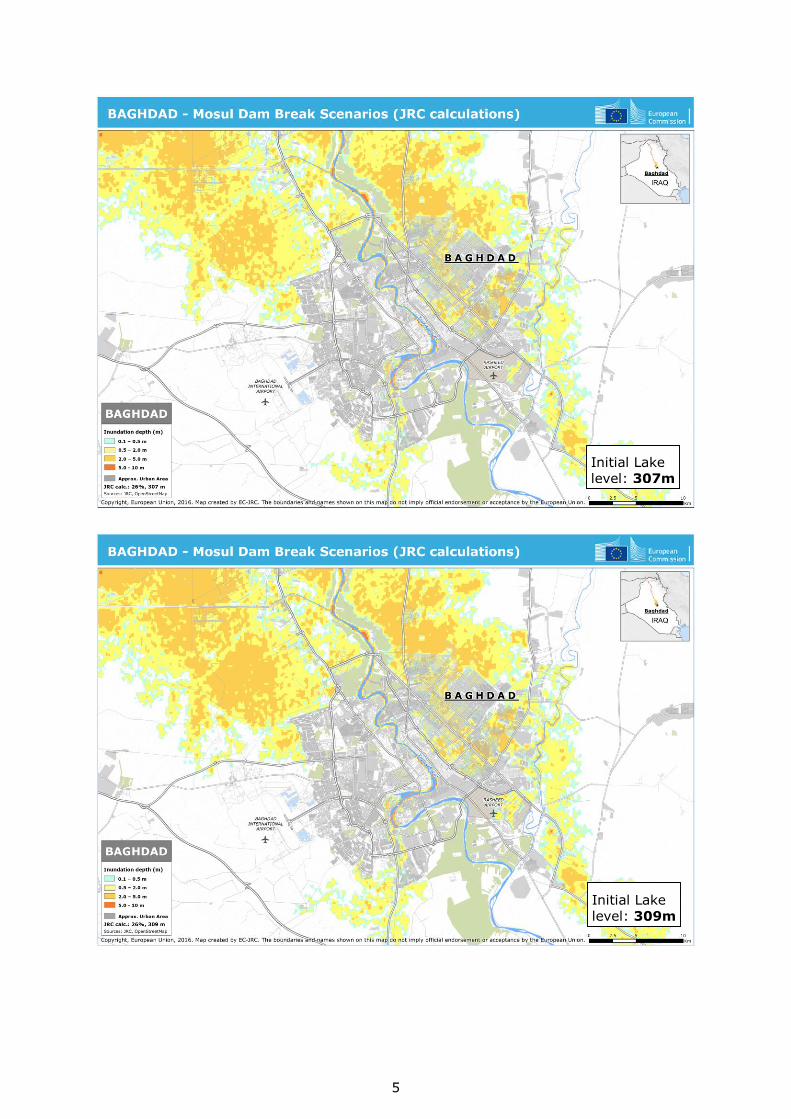
8 Appendix III – Maps related to Lake Level Sensitivity Analysis
In this Appendix we show maps of the expected inundation in Baghdad, depending on the
level of the lake when the breach occurs; as previously, the levels considered are 300,
305, 307, 309, 319 (current level) and 330m (maximum level).
Initial Lake
level: 300m
Initial Lake
level: 305m
Initial Lake
level: 300m
5
Initial Lake
level: 307m
Initial Lake
level: 309m

6
Initial Lake
level: 319m
Initial Lake
level: 330m

7
How to obtain EU publications
Our publications are available from EU Bookshop (http://bookshop.europa.eu),
where you can place an order with the sales agent of your choice.
The Publications Office has a worldwide network of sales agents.
You can obtain their contact details by sending a fax to (352) 29 29-42758.
Europe Direct is a service to help you find answers to your questions about the European Union
Free phone number (*): 00 800 6 7 8 9 10 11
(*) Certain mobile telephone operators do not allow access to 00 800 numbers or these calls may be billed.
A great deal of additional information on the European Union is available on the Internet.
It can be accessed through the Europa server http://europa.eu

8
JRC Mission
As the Commission’s
in-house science service,
the Joint Research Centre’s
mission is to provide EU
policies with independent,
evidence-based scientific
and technical support
throughout the whole
policy cycle.
Working in close
cooperation with policy
Directorates-General,
the JRC addresses key
societal challenges while
stimulating innovation
through developing
new methods, tools
and standards, and sharing
its know-how with
the Member States,
the scientific community
and international partners.
Serving society Stimulating innovation Supporting legislation