
Impact of Democratic Political Transition on the Economy ...
19
See discussions, stats, and author profiles for this publication at: https://www.researchgate.net/publication/303019469 Impact of Democratic Political Transition on the Economy of Ghana Chapter · April 2016 CITATIONS 0 READS 1,059 1 author: Some of the authors of this publication are also working on these related projects: Assessment of the economic and social benefits of meteorological services in Ghana View project Screwworm fly bio-economic modelling View project Kwabena Asomanin Anaman University of Ghana 140 PUBLICATIONS 583 CITATIONS SEE PROFILE All content following this page was uploaded by Kwabena Asomanin Anaman on 13 May 2016. The user has requested enhancement of the downloaded file.
Transcript of Impact of Democratic Political Transition on the Economy ...
See discussions, stats, and author profiles for this publication at: https://www.researchgate.net/publication/303019469
Impact of Democratic Political Transition on the Economy of Ghana
Chapter · April 2016
CITATIONS
0READS
1,059
1 author:
Some of the authors of this publication are also working on these related projects:
Assessment of the economic and social benefits of meteorological services in Ghana View project
Screwworm fly bio-economic modelling View project
Kwabena Asomanin Anaman
University of Ghana
140 PUBLICATIONS 583 CITATIONS
SEE PROFILE
All content following this page was uploaded by Kwabena Asomanin Anaman on 13 May 2016.
The user has requested enhancement of the downloaded file.
6
Impact of Democratic Political Transition on the Economy of Ghana
Kwabena Asomanin Anaman
Introduction
In this chapter, we examine the impacts of democratic political transition on the economy of Ghana based on the assessment of the impacts on the macro-economy and industry groups. This examination is done from a human development perspective. Human development incorporates shared economic growth that ensures minimal adverse impact on the environment while protecting citizens against deprivation, securing for them peace and security as well as participation in economic and political governance processes. It is dependent on the attainment of peaceful democratic transitions given the rancour that is characteristic of the quadrennial national elections in Ghana. This is because democratic political transitions since 1992 have coincided with reduced focus on the socio-economic development of the country. The current winner-takes-all political system encourages the emergence of electoral winners and losers who are less likely to make efforts to develop a more inclusive governance structure to tackle the numerous socio-economic problems facing the country.
The rest of this chapter is organized along the following lines. The next section deals with the economic theoretical framework of the study. The macroeconomic analysis of impacts of democratic transitions are discussed next with emphasis on impacts measured on the bases of inflation, economic growth, money supply and exchange rate and government revenues, expenditures and budget deficits. This section is followed by a discussion of impacts on selected industries and the stock market. A few conclusions are reported at the end of the chapter.
Issues in Ghana’s Electoral Politics136
Economic Theoretical Framework
The relationship between democratic transition, the economy and human development in Ghana is examined in this chapter. There is no doubt that these three areas are interlinked; however, the nature of the inter-connections must be teased out. How do democratic transitions impact on the economy? How is this impact transmitted into the spheres of human development? Democratic political transition refers to a process that establishes a democratic political regime that is based on the rule of the party or parties that get most votes in contested elections. This is different from democratic consolidation, which refers to the process by which democratic norms, rules and institutions are progressively incorporated in the workings of the political order. Successive peaceful democratic transitions lead to democratic consolidation.
Human development is a multi-faceted concept. However, for the purpose of this chapter, the definition of human development is based on the framework provided by Sen (1993). Human development is envisioned as a process that leads to the broadening of human choices in society. Similarly the central proposition of Welzel and Inglehart (1999:6-7) suggests that human development is based on three important factors that are all linked to the growth and expansion of human choices in society. These three factors are (1) physical and cognitive human resources (2) a culture that gives high priority to aspirations for liberty, and (3) democracy and institutionalization of human rights. The three factors derive from three spheres of social reality that are economic structure, political structure and a regime of freedoms and human rights. These three spheres interact to expand human choices. In the economic sphere, economic development increases the productivity and stock of human resources through the expansion of human capital and physical capital. Human resources increase with economic development and vice versa. Growth of human resources favours a culture of rising aspirations for liberty, and rising aspirations for liberty produce increasing pressures to establish and preserve broad-based democracy that then institutionalizes human freedom and rights.
There is a wealth of literature on the relationship between the economy, specifically economic development, and democracy. Lipset’s (1959) research on the social requisites for democracy poses economic development as a central requirement for the establishment of democracy. Other authors, including Cutright and Wiley (1969), Winham (1970), Bollen and Jackman (1985), Helliwell (1992) and Burkhart and Lewis-Beck (1994) have demonstrated a significant causal link between economic development and democracy. This view is supported by evidence from economic development in countries such as South Korea and Taiwan over the last 40 years.
The political business cycle literature emphasizes the link between democratic political transition and the general state of the economy. The work of Nordhaus (1975) underscores the tendency for incumbent political parties to spend excessively
Anaman: Impact of Democratic Political Transition on the Economy of Ghana 137
during an election year (refer also to more recent works such as Acemoglu and Robinson 2001; Gonsalez 2002; Rodrik and Wacziarg 2005; Libich et al. 2010). This theory suggests that government expenditure typically increases on activities with short-term payoffs during election years. The higher expenditure is then hard to cut once the elections are over. Gonzales (2002) suggests that excessive spending by incumbent parties is likely to be observed in new democracies and in countries where the margin between the incumbent party and the main opposition party is narrow. Given the narrow margin between the incumbent party and the opposition in Ghana over the last three national elections, a hypothesis that emerges is that political spending is likely to be relatively large in election years in this country.
Political succession through elections can be considered as a form of game that can also be conceptualized as an investment project. In such a game there are winners and losers whose payoffs cover a time horizon of several years thus necessitating an analysis from an investment perspective. Voters choose a group of people or party to manage their affairs over a four-year period. This choice confers on the winning party or group the management of government policies costing about 100 billion Ghana cedis over the four-year period (based on an average budget of 25 billion Ghana cedis of national government spending per year using actual government spending for 2012 of the current government as a guide and adjusting for inflation). With government spending averaging between 25 to 35 per cent of the gross domestic product of the country, the elected government has considerable amount of power and resources to manage (or mismanage) the affairs of the country.
Democratic political transition can be also analysed from an economic viewpoint based on the welfare economics ideas first proposed by Vilfredo Pareto. Pareto`s optimality criterion states that a societal project or programme, such as democratic political transition, is efficient for society if it improves the welfare of one group without making other groups worse off. Pareto optimality is rarely obtained in real life as societal change, by its very nature, often makes some people worse off while others may gain from the change. Democratic elections create winners and losers. In Ghana’s winner-take-all electoral system, winners take all the spoils of the electoral contest leaving losers with personal debt, the pain of loss, and other intangible costs.
The Potential Pareto Improvement Criterion is the theoretical basis of modern cost-benefit analysis. It also provides the theoretical tool to analyse societal changes that result in the kind of winners and losers that is obtained from national elections in a competitive multi-party political system. This criterion asserts that if the winners can hypothetically compensate the losers, then from a societal viewpoint, the programme is desirable. The compensation noted here is hypothetical (see also Kaldor 1939 and Hicks 1939). Note that the reverse situation may exist and this implies a deterioration or net negative societal outcome. We argue that democratic political change is a societal change where there are winners and losers and these are directly related to the winner-take-all political system where there are winners and losers.
Issues in Ghana’s Electoral Politics138
Democratic transitions, such as those that occurred in Ghana in January 2001 and January 2009, create winners and losers. Given the dominance of Ghana’s two major parties, the National Democratic Congress (NDC) and the New Patriotic Party (NPP), the winners and losers in a democratic political transition are those people and institutions directly connected to the political parties in terms of the level of activism and leadership position in the party. They are the most directly affected by democratic political transitions. Given the traditional social structure of the support system in Ghana, chief wage earners or breadwinners are the major financial backers of activities of a large number of people. The loss of employment by the chief wage earners during democratic transition therefore has a multiplier effect on the number of losers affected by the change. The opposite effect holds for principal wage earners whose positions may have been enhanced by the democratic transition. In the next section, we discuss the impacts of democratic transitions on the macroeconomy.
Macro-economic Impacts of Democratic Transitions
The macroeconomy while impossible to touch like bread or butter is a useful concept that captures the aggregation of small economic units of a society. It does not imply a linear aggregation of small economic units but a concept that articulates the composite nature of the aggregate of all economic units. The performance of the macroeconomy affects human development through several sources. These include the impacts generated through change in purchasing power (inflation), change in incomes of individuals (economic growth) and changes in the quantity and quantity of economic sectors or industries that employ people.
A major function of government is the stabilization of the macroeconomy by controlling inflation and increasing employment opportunities. In this chapter, the impacts of democratic transition on the macroeconomy are assessed through the changes in the following parameters: (1) inflation (2) economic growth based on changes in real gross domestic product (3) money supply and exchange rate, and (4) government expenditures, revenues and budget deficits.
Inflation
Inflation, defined as the general increase in the price level of the economy, erodes the purchasing power of individuals through increases in prices, and reducing the real amounts of goods and services that can be purchased by individuals with their existing incomes. If democratic transition results in rising inflation, then society on the whole suffers. However increased inflation has losers and winners. Losers from increased inflation, as a result of democratic transition, include people on fixed incomes such as retirees, civil servants and others who lack the capacity to adjust their incomes upwards in line with increasing inflation.
Anaman: Impact of Democratic Political Transition on the Economy of Ghana 139
On the other hand, there are winners from increased inflation and these include owners of physical assets that generate services in high demand by consumers and producers of commodities with fast rising prices. Such owners can quickly adjust their prices.
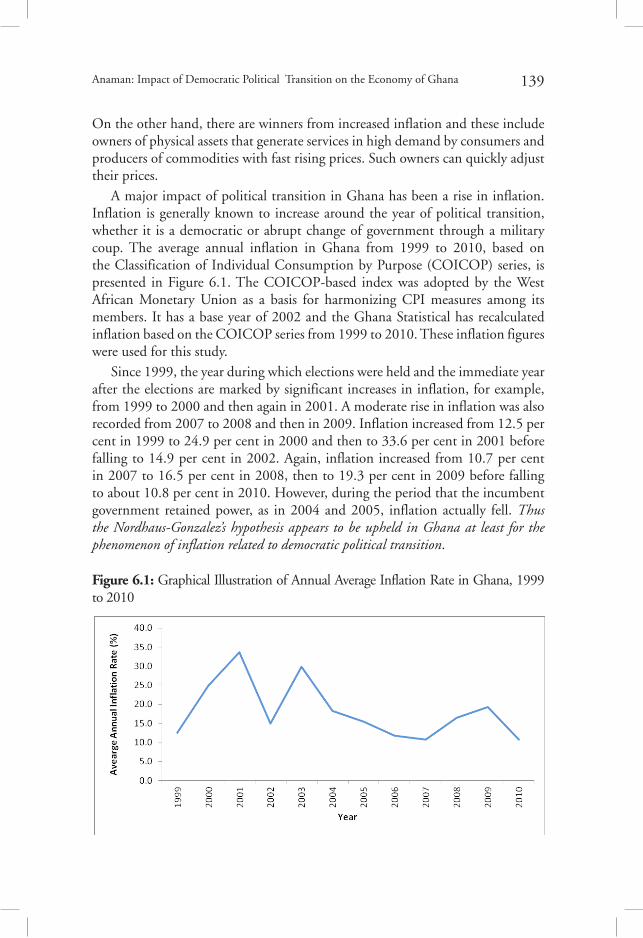
A major impact of political transition in Ghana has been a rise in inflation. Inflation is generally known to increase around the year of political transition, whether it is a democratic or abrupt change of government through a military coup. The average annual inflation in Ghana from 1999 to 2010, based on the Classification of Individual Consumption by Purpose (COICOP) series, is presented in Figure 6.1. The COICOP-based index was adopted by the West African Monetary Union as a basis for harmonizing CPI measures among its members. It has a base year of 2002 and the Ghana Statistical has recalculated inflation based on the COICOP series from 1999 to 2010. These inflation figures were used for this study.
Since 1999, the year during which elections were held and the immediate year after the elections are marked by significant increases in inflation, for example, from 1999 to 2000 and then again in 2001. A moderate rise in inflation was also recorded from 2007 to 2008 and then in 2009. Inflation increased from 12.5 per cent in 1999 to 24.9 per cent in 2000 and then to 33.6 per cent in 2001 before falling to 14.9 per cent in 2002. Again, inflation increased from 10.7 per cent in 2007 to 16.5 per cent in 2008, then to 19.3 per cent in 2009 before falling to about 10.8 per cent in 2010. However, during the period that the incumbent government retained power, as in 2004 and 2005, inflation actually fell. Thus the Nordhaus-Gonzalez’s hypothesis appears to be upheld in Ghana at least for the phenomenon of inflation related to democratic political transition.
Figure 6.1: Graphical Illustration of Annual Average Inflation Rate in Ghana, 1999 to 2010
Issues in Ghana’s Electoral Politics140
Economic Growth
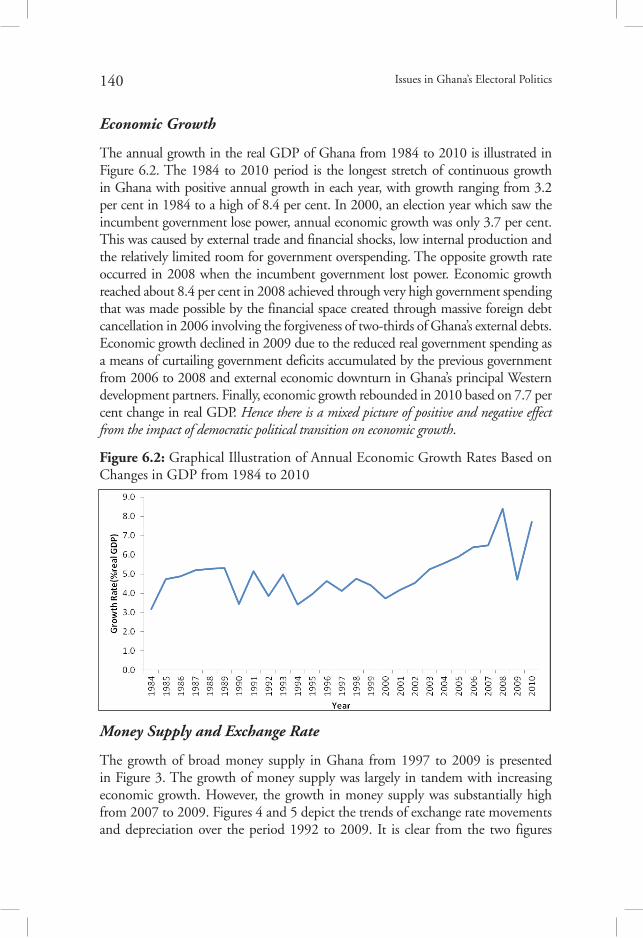
The annual growth in the real GDP of Ghana from 1984 to 2010 is illustrated in Figure 6.2. The 1984 to 2010 period is the longest stretch of continuous growth in Ghana with positive annual growth in each year, with growth ranging from 3.2 per cent in 1984 to a high of 8.4 per cent. In 2000, an election year which saw the incumbent government lose power, annual economic growth was only 3.7 per cent. This was caused by external trade and financial shocks, low internal production and the relatively limited room for government overspending. The opposite growth rate occurred in 2008 when the incumbent government lost power. Economic growth reached about 8.4 per cent in 2008 achieved through very high government spending that was made possible by the financial space created through massive foreign debt cancellation in 2006 involving the forgiveness of two-thirds of Ghana’s external debts. Economic growth declined in 2009 due to the reduced real government spending as a means of curtailing government deficits accumulated by the previous government from 2006 to 2008 and external economic downturn in Ghana’s principal Western development partners. Finally, economic growth rebounded in 2010 based on 7.7 per cent change in real GDP. Hence there is a mixed picture of positive and negative effect from the impact of democratic political transition on economic growth.
Figure 6.2: Graphical Illustration of Annual Economic Growth Rates Based on Changes in GDP from 1984 to 2010
Money Supply and Exchange Rate
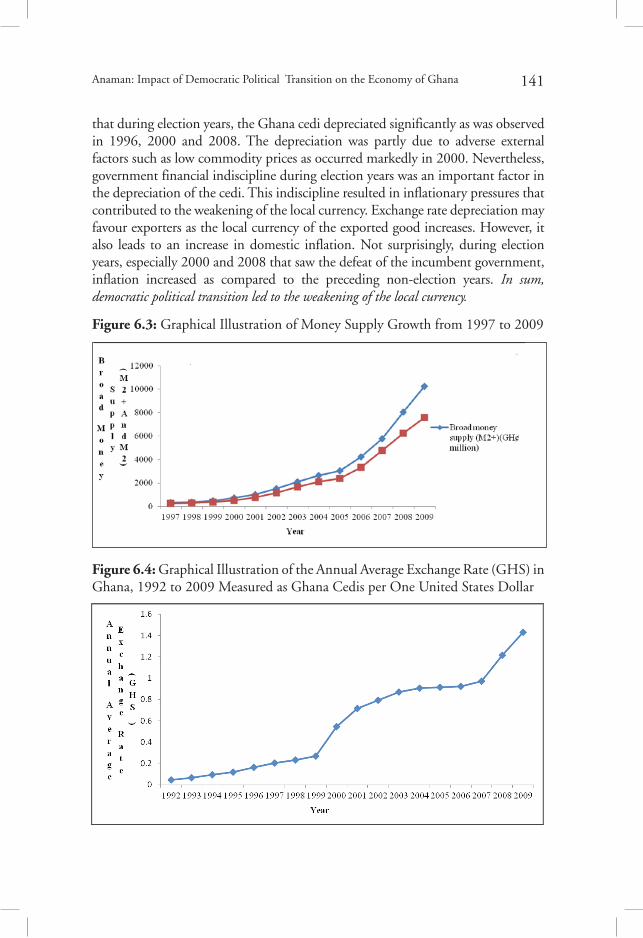
The growth of broad money supply in Ghana from 1997 to 2009 is presented in Figure 3. The growth of money supply was largely in tandem with increasing economic growth. However, the growth in money supply was substantially high from 2007 to 2009. Figures 4 and 5 depict the trends of exchange rate movements and depreciation over the period 1992 to 2009. It is clear from the two figures
Anaman: Impact of Democratic Political Transition on the Economy of Ghana 141
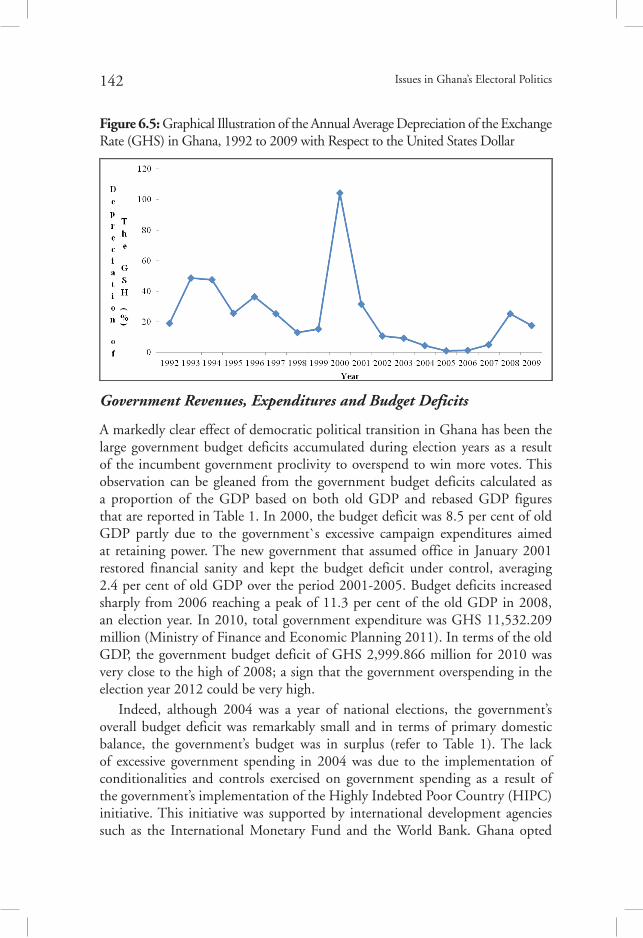
that during election years, the Ghana cedi depreciated significantly as was observed in 1996, 2000 and 2008. The depreciation was partly due to adverse external factors such as low commodity prices as occurred markedly in 2000. Nevertheless, government financial indiscipline during election years was an important factor in the depreciation of the cedi. This indiscipline resulted in inflationary pressures that contributed to the weakening of the local currency. Exchange rate depreciation may favour exporters as the local currency of the exported good increases. However, it also leads to an increase in domestic inflation. Not surprisingly, during election years, especially 2000 and 2008 that saw the defeat of the incumbent government, inflation increased as compared to the preceding non-election years. In sum, democratic political transition led to the weakening of the local currency.
Figure 6.3: Graphical Illustration of Money Supply Growth from 1997 to 2009
Figure 6.4: Graphical Illustration of the Annual Average Exchange Rate (GHS) in Ghana, 1992 to 2009 Measured as Ghana Cedis per One United States Dollar
Issues in Ghana’s Electoral Politics142
Figure 6.5: Graphical Illustration of the Annual Average Depreciation of the Exchange Rate (GHS) in Ghana, 1992 to 2009 with Respect to the United States Dollar
Government Revenues, Expenditures and Budget Deficits
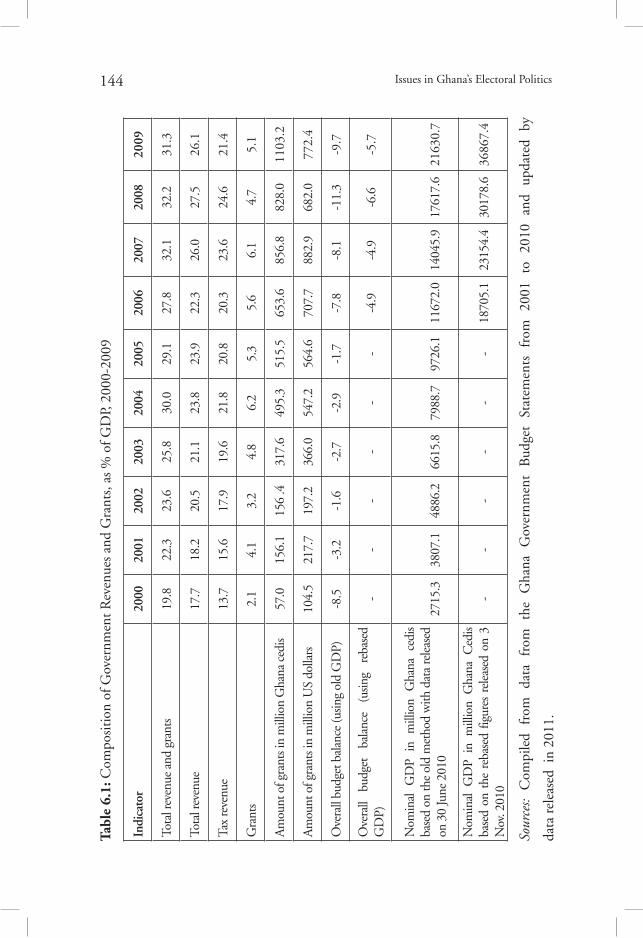
A markedly clear effect of democratic political transition in Ghana has been the large government budget deficits accumulated during election years as a result of the incumbent government proclivity to overspend to win more votes. This observation can be gleaned from the government budget deficits calculated as a proportion of the GDP based on both old GDP and rebased GDP figures that are reported in Table 1. In 2000, the budget deficit was 8.5 per cent of old GDP partly due to the government`s excessive campaign expenditures aimed at retaining power. The new government that assumed office in January 2001 restored financial sanity and kept the budget deficit under control, averaging 2.4 per cent of old GDP over the period 2001-2005. Budget deficits increased sharply from 2006 reaching a peak of 11.3 per cent of the old GDP in 2008, an election year. In 2010, total government expenditure was GHS 11,532.209 million (Ministry of Finance and Economic Planning 2011). In terms of the old GDP, the government budget deficit of GHS 2,999.866 million for 2010 was very close to the high of 2008; a sign that the government overspending in the election year 2012 could be very high.
Indeed, although 2004 was a year of national elections, the government’s overall budget deficit was remarkably small and in terms of primary domestic balance, the government’s budget was in surplus (refer to Table 1). The lack of excessive government spending in 2004 was due to the implementation of conditionalities and controls exercised on government spending as a result of the government’s implementation of the Highly Indebted Poor Country (HIPC) initiative. This initiative was supported by international development agencies such as the International Monetary Fund and the World Bank. Ghana opted
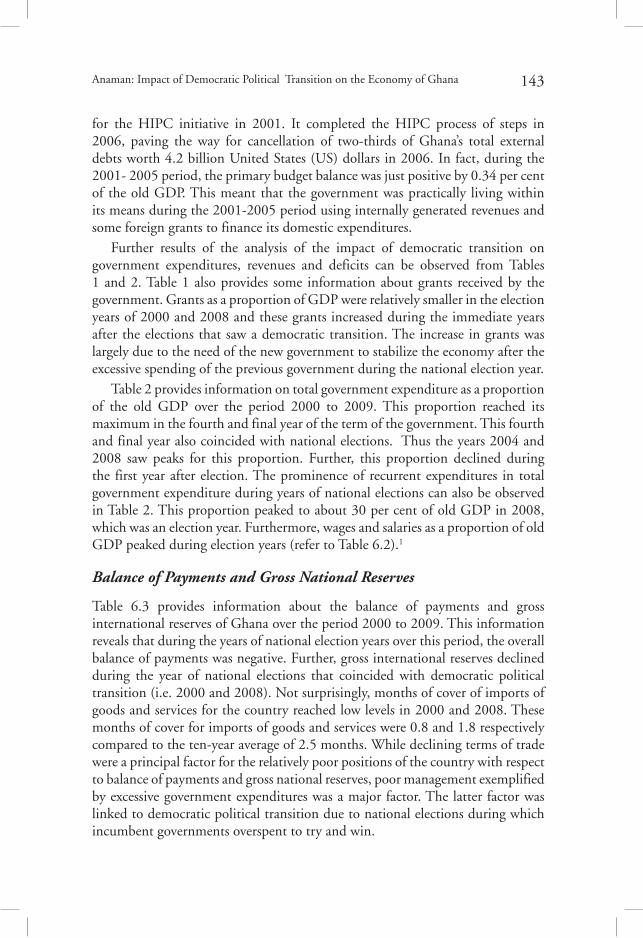
Anaman: Impact of Democratic Political Transition on the Economy of Ghana 143
for the HIPC initiative in 2001. It completed the HIPC process of steps in 2006, paving the way for cancellation of two-thirds of Ghana’s total external debts worth 4.2 billion United States (US) dollars in 2006. In fact, during the 2001- 2005 period, the primary budget balance was just positive by 0.34 per cent of the old GDP. This meant that the government was practically living within its means during the 2001-2005 period using internally generated revenues and some foreign grants to finance its domestic expenditures.
Further results of the analysis of the impact of democratic transition on government expenditures, revenues and deficits can be observed from Tables 1 and 2. Table 1 also provides some information about grants received by the government. Grants as a proportion of GDP were relatively smaller in the election years of 2000 and 2008 and these grants increased during the immediate years after the elections that saw a democratic transition. The increase in grants was largely due to the need of the new government to stabilize the economy after the excessive spending of the previous government during the national election year.
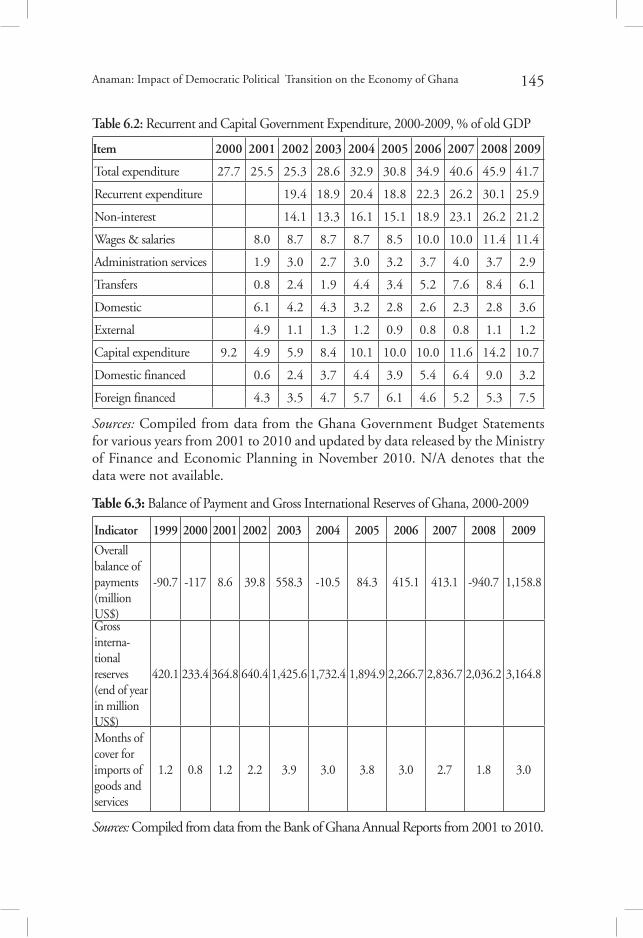
Table 2 provides information on total government expenditure as a proportion of the old GDP over the period 2000 to 2009. This proportion reached its maximum in the fourth and final year of the term of the government. This fourth and final year also coincided with national elections. Thus the years 2004 and 2008 saw peaks for this proportion. Further, this proportion declined during the first year after election. The prominence of recurrent expenditures in total government expenditure during years of national elections can also be observed in Table 2. This proportion peaked to about 30 per cent of old GDP in 2008, which was an election year. Furthermore, wages and salaries as a proportion of old GDP peaked during election years (refer to Table 6.2).1
Balance of Payments and Gross National Reserves
Table 6.3 provides information about the balance of payments and gross international reserves of Ghana over the period 2000 to 2009. This information reveals that during the years of national election years over this period, the overall balance of payments was negative. Further, gross international reserves declined during the year of national elections that coincided with democratic political transition (i.e. 2000 and 2008). Not surprisingly, months of cover of imports of goods and services for the country reached low levels in 2000 and 2008. These months of cover for imports of goods and services were 0.8 and 1.8 respectively compared to the ten-year average of 2.5 months. While declining terms of trade were a principal factor for the relatively poor positions of the country with respect to balance of payments and gross national reserves, poor management exemplified by excessive government expenditures was a major factor. The latter factor was linked to democratic political transition due to national elections during which incumbent governments overspent to try and win.
Issues in Ghana’s Electoral Politics144
Tabl
e 6.
1: C
ompo
siti
on o
f Gov
ernm
ent R
even
ues
and
Gra
nts,
as
% o
f GD
P, 2
000-
2009
Indi
cato
r20
0020
0120
0220
0320
0420
0520
0620
0720
0820
09
Tota
l rev
enue
and
gra
nts
19.8
22.3
23.6
25.8
30.0
29.1
27.8
32.1
32.2
31.3
Tota
l rev
enue
17.7
18.2
20.5
21.1
23.8
23.9
22.3
26.0
27.5
26.1
Tax
reve
nue
13.7
15.6
17.9
19.6
21.8
20.8
20.3
23.6
24.6
21.4
Gra
nts
2.1
4.1
3.2
4.8
6.2
5.3
5.6
6.1
4.7
5.1
Am
ount
of g
rant
s in
mill
ion
Gha
na c
edis
57.0
156.
115
6 .4
317.
649
5.3
515.
565
3.6
856.
882
8.0
1103
.2
Am
ount
of g
rant
s in
mill
ion
US
dolla
rs10
4.5
217.
719
7.2
366.
054
7.2
564.
670
7.7
882.
968
2.0
772.
4
Ove
rall
budg
et b
alan
ce (u
sing
old
GD
P)-8
.5-3
.2-1
.6-2
.7-2
.9-1
.7-7
.8-8
.1-1
1.3
-9.7
Ove
rall
budg
et
bala
nce
(usin
g re
base
d G
DP)
--
--
--
-4.9
-4.9
-6.6
-5.7
Nom
inal
G
DP
in
mill
ion
Gha
na
cedi
s ba
sed
on th
e ol
d m
etho
d w
ith d
ata
rele
ased
on
30
June
201
027
15.3
3807
.148
86.2
6615
.879
88.7
9726
.111
672.
014
045.
917
617.
621
630.
7
Nom
inal
GD
P in
mill
ion
Gha
na C
edis
base
d on
the
reb
ased
fig
ures
rel
ease
d on
3
Nov
. 201
0-
--
--
-18
705.
123
154.
430
178.
636
867.
4
Sour
ces:
Com
pile
d fr
om
data
fr
om
the
Gha
na
Gov
ernm
ent
Bud
get
Stat
emen
ts
from
20
01
to
2010
an
d up
date
d by
data
rel
ease
d in
201
1.
Anaman: Impact of Democratic Political Transition on the Economy of Ghana 145
Table 6.2: Recurrent and Capital Government Expenditure, 2000-2009, % of old GDP
Item 2000 2001 2002 2003 2004 2005 2006 2007 2008 2009
Total expenditure 27.7 25.5 25.3 28.6 32.9 30.8 34.9 40.6 45.9 41.7
Recurrent expenditure 19.4 18.9 20.4 18.8 22.3 26.2 30.1 25.9
Non-interest 14.1 13.3 16.1 15.1 18.9 23.1 26.2 21.2
Wages & salaries 8.0 8.7 8.7 8.7 8.5 10.0 10.0 11.4 11.4
Administration services 1.9 3.0 2.7 3.0 3.2 3.7 4.0 3.7 2.9
Transfers 0.8 2.4 1.9 4.4 3.4 5.2 7.6 8.4 6.1
Domestic 6.1 4.2 4.3 3.2 2.8 2.6 2.3 2.8 3.6
External 4.9 1.1 1.3 1.2 0.9 0.8 0.8 1.1 1.2
Capital expenditure 9.2 4.9 5.9 8.4 10.1 10.0 10.0 11.6 14.2 10.7
Domestic financed 0.6 2.4 3.7 4.4 3.9 5.4 6.4 9.0 3.2
Foreign financed 4.3 3.5 4.7 5.7 6.1 4.6 5.2 5.3 7.5
Sources: Compiled from data from the Ghana Government Budget Statements for various years from 2001 to 2010 and updated by data released by the Ministry of Finance and Economic Planning in November 2010. N/A denotes that the data were not available.
Table 6.3: Balance of Payment and Gross International Reserves of Ghana, 2000-2009
Indicator 1999 2000 2001 2002 2003 2004 2005 2006 2007 2008 2009
Overall balance of payments (million US$)
-90.7 -117 8.6 39.8 558.3 -10.5 84.3 415.1 413.1 -940.7 1,158.8
Gross interna-tional reserves (end of year in million US$)
420.1 233.4 364.8 640.4 1,425.6 1,732.4 1,894.9 2,266.7 2,836.7 2,036.2 3,164.8
Months of cover for imports of goods and services
1.2 0.8 1.2 2.2 3.9 3.0 3.8 3.0 2.7 1.8 3.0
Sources: Compiled from data from the Bank of Ghana Annual Reports from 2001 to 2010.
Issues in Ghana’s Electoral Politics146
Microeconomic Impacts of Democratic Transition
Democratic Transition and Performance of Industries or Sub-sectors of the Economy
Microeconomic analysis, based on the performance of individual industries, was captured by analysing the real growth rates of these industries using 1974 to 2009 data released by GSS on 30 June 2010 using the nomenclature of the old GDP system. Simple statistical analysis of the real outputs of industries would capture the spikes and trends of their real growth rates during periods of democratic transition. Fourteen industries or sub-sectors are reported by GSS. These are (1) crops and livestock, (2) cocoa, (3) forestry and logging, (4) fishing, (5) mining and quarrying, (6) manufacturing, (7) electricity and water, (8) construction, (9) transport, storage and communications, (10) wholesale and retail trade, restaurants and hotels, (11) finance and insurance, real estate and business services, (12) government services, (13) community, social and personal services, and finally (14) producers of private non-profit services.
The results of the analysis showed that all the industries increased their real total output over the 1993 to 2009 period. Of particular importance to this study is the result over the election years and the years immediately after those years. The real value of outputs of all the industries increased over the transition years (2000 to 2001) with the exception of the mining and quarrying industry. The sharp drop in the production of electricity and water from 2006 to 2007 was due to power rationing from August 2006 to September 2007 as a result of the low volume of water in the Akosombo dam, the principal source of energy of the country. In terms of the absolute size of the industries, we observed no major impacts of democratic transition on the size of the various industries. However, the manufacturing industry continued to shrink in relative size (proportionate to GDP) over the period.
Democratic Transition and the Ghana Stock Exchange
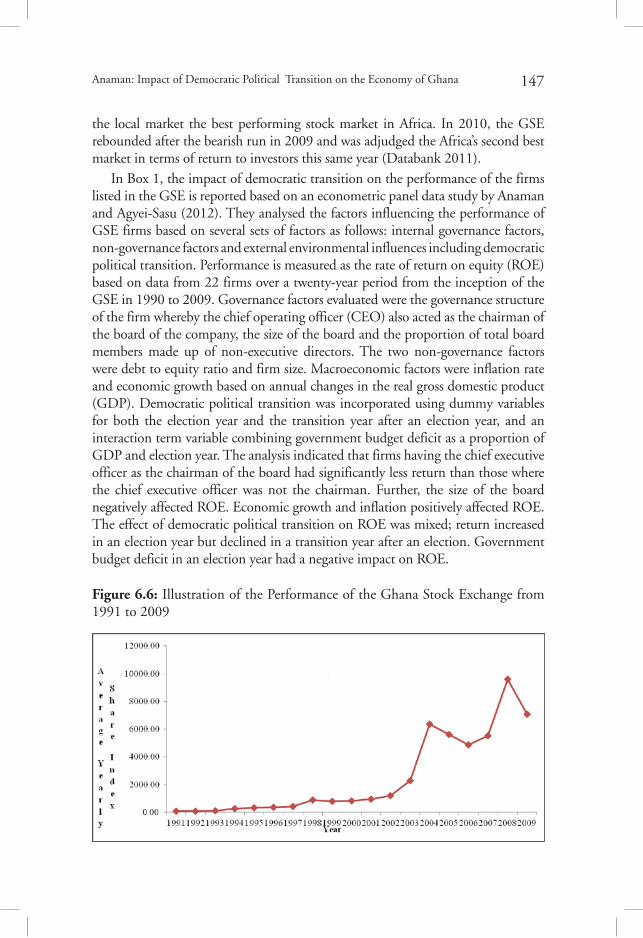
The Ghana Stock Exchange (GSE) is part of the finance, real estate and business services subsector of the economy described above. The GSE was established in 1990. The performance of the GSE is measured by the GSE All Share Index. The performance of the GSE in its first decade (1990 to 1999) was consistent. However from 2000 to the present, the performance of the GSE appeared to be influenced by developments during democratic transitions. GSE performance was relatively high in an election year and then declined in the year following an election (refer to Figure 6). For example, in 2009, considered to be a democratic transition year, the GSE All-Share index dropped by 46.6 per cent making the GSE the worst performing market in Africa for that year. In 2008, which was an election year, the GSE All Share Index increased by 58 per cent from its 2007 closing level making
Anaman: Impact of Democratic Political Transition on the Economy of Ghana 147
the local market the best performing stock market in Africa. In 2010, the GSE rebounded after the bearish run in 2009 and was adjudged the Africa’s second best market in terms of return to investors this same year (Databank 2011).
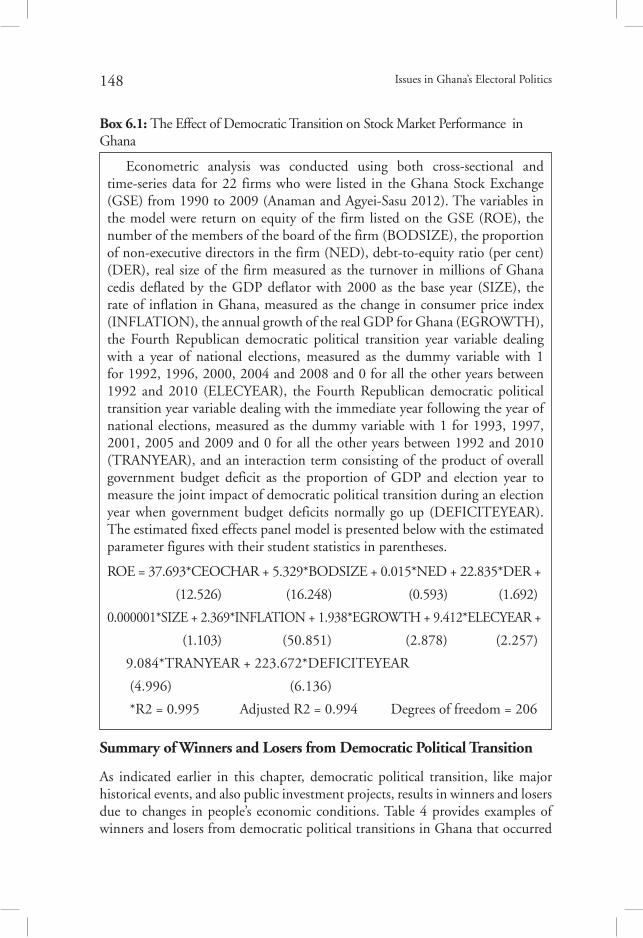
In Box 1, the impact of democratic transition on the performance of the firms listed in the GSE is reported based on an econometric panel data study by Anaman and Agyei-Sasu (2012). They analysed the factors influencing the performance of GSE firms based on several sets of factors as follows: internal governance factors, non-governance factors and external environmental influences including democratic political transition. Performance is measured as the rate of return on equity (ROE) based on data from 22 firms over a twenty-year period from the inception of the GSE in 1990 to 2009. Governance factors evaluated were the governance structure of the firm whereby the chief operating officer (CEO) also acted as the chairman of the board of the company, the size of the board and the proportion of total board members made up of non-executive directors. The two non-governance factors were debt to equity ratio and firm size. Macroeconomic factors were inflation rate and economic growth based on annual changes in the real gross domestic product (GDP). Democratic political transition was incorporated using dummy variables for both the election year and the transition year after an election year, and an interaction term variable combining government budget deficit as a proportion of GDP and election year. The analysis indicated that firms having the chief executive officer as the chairman of the board had significantly less return than those where the chief executive officer was not the chairman. Further, the size of the board negatively affected ROE. Economic growth and inflation positively affected ROE. The effect of democratic political transition on ROE was mixed; return increased in an election year but declined in a transition year after an election. Government budget deficit in an election year had a negative impact on ROE.
Figure 6.6: Illustration of the Performance of the Ghana Stock Exchange from 1991 to 2009
Issues in Ghana’s Electoral Politics148
Econometric analysis was conducted using both cross-sectional and time-series data for 22 firms who were listed in the Ghana Stock Exchange (GSE) from 1990 to 2009 (Anaman and Agyei-Sasu 2012). The variables in the model were return on equity of the firm listed on the GSE (ROE), the number of the members of the board of the firm (BODSIZE), the proportion of non-executive directors in the firm (NED), debt-to-equity ratio (per cent) (DER), real size of the firm measured as the turnover in millions of Ghana cedis deflated by the GDP deflator with 2000 as the base year (SIZE), the rate of inflation in Ghana, measured as the change in consumer price index (INFLATION), the annual growth of the real GDP for Ghana (EGROWTH), the Fourth Republican democratic political transition year variable dealing with a year of national elections, measured as the dummy variable with 1 for 1992, 1996, 2000, 2004 and 2008 and 0 for all the other years between 1992 and 2010 (ELECYEAR), the Fourth Republican democratic political transition year variable dealing with the immediate year following the year of national elections, measured as the dummy variable with 1 for 1993, 1997, 2001, 2005 and 2009 and 0 for all the other years between 1992 and 2010 (TRANYEAR), and an interaction term consisting of the product of overall government budget deficit as the proportion of GDP and election year to measure the joint impact of democratic political transition during an election year when government budget deficits normally go up (DEFICITEYEAR). The estimated fixed effects panel model is presented below with the estimated parameter figures with their student statistics in parentheses.
ROE = 37.693*CEOCHAR + 5.329*BODSIZE + 0.015*NED + 22.835*DER +
(12.526) (16.248) (0.593) (1.692)
0.000001*SIZE + 2.369*INFLATION + 1.938*EGROWTH + 9.412*ELECYEAR +
(1.103) (50.851) (2.878) (2.257)
9.084*TRANYEAR + 223.672*DEFICITEYEAR
(4.996) (6.136)
*R2 = 0.995 Adjusted R2 = 0.994 Degrees of freedom = 206
Box 6.1: The Effect of Democratic Transition on Stock Market Performance in Ghana
Summary of Winners and Losers from Democratic Political Transition
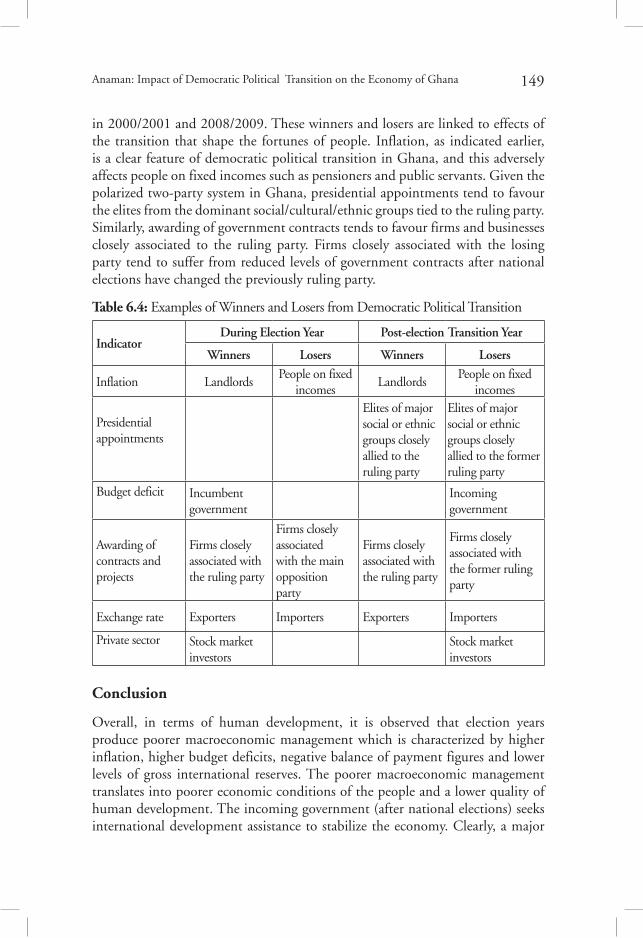
As indicated earlier in this chapter, democratic political transition, like major historical events, and also public investment projects, results in winners and losers due to changes in people’s economic conditions. Table 4 provides examples of winners and losers from democratic political transitions in Ghana that occurred
Anaman: Impact of Democratic Political Transition on the Economy of Ghana 149
in 2000/2001 and 2008/2009. These winners and losers are linked to effects of the transition that shape the fortunes of people. Inflation, as indicated earlier, is a clear feature of democratic political transition in Ghana, and this adversely affects people on fixed incomes such as pensioners and public servants. Given the polarized two-party system in Ghana, presidential appointments tend to favour the elites from the dominant social/cultural/ethnic groups tied to the ruling party. Similarly, awarding of government contracts tends to favour firms and businesses closely associated to the ruling party. Firms closely associated with the losing party tend to suffer from reduced levels of government contracts after national elections have changed the previously ruling party.
Table 6.4: Examples of Winners and Losers from Democratic Political Transition
IndicatorDuring Election Year Post-election Transition Year
Winners Losers Winners Losers
Inflation LandlordsPeople on fixed
incomesLandlords
People on fixed incomes
Presidential appointments
Elites of major social or ethnic groups closely allied to the ruling party
Elites of major social or ethnic groups closely allied to the former ruling party
Budget deficit Incumbent government
Incoming government
Awarding of contracts and projects
Firms closely associated with the ruling party
Firms closely associated with the main opposition party
Firms closely associated with the ruling party
Firms closely associated with the former ruling party
Exchange rate Exporters Importers Exporters Importers
Private sector Stock market investors
Stock market investors
Conclusion
Overall, in terms of human development, it is observed that election years produce poorer macroeconomic management which is characterized by higher inflation, higher budget deficits, negative balance of payment figures and lower levels of gross international reserves. The poorer macroeconomic management translates into poorer economic conditions of the people and a lower quality of human development. The incoming government (after national elections) seeks international development assistance to stabilize the economy. Clearly, a major

Issues in Ghana’s Electoral Politics150
impact of political transition in Ghana has been the increase in inflation that impacts on the poorer sections of society more severely through loss of purchasing power for goods and services.
Government expenditure during election years is atypical, raising questions on the mode of operations of government in election years. Our analysis suggests that there is an emerging culture of high government deficit arising from government spending during election years that is driven primarily by the excessive desire to retain power. Budget deficits are expenditure beyond the revenues and grants raised by the country. Hence they represent substantial shortfalls in revenue mobilisation. The atypical case of 2004 was due to the strict conditionalities and controls on government spending imposed on the government after it opted for the HIPC initiative. It is imperative that legislative rules and laws are enacted in an attempt to eliminate the culture of excessive budget spending in election years.
Acknowledgments
The author thanks Dr. Jemima Agyare (formerly of the Institute for Democratic Governance, Accra), and Messrs Charles Yaw Okyere and Felix Agyei-Sasu for their assistance in completing the study. The support of the Institute for Democratic Governance, Accra, Ghana and the United Nations Development Programme Office, Accra, Ghana for the development of this paper is gratefully acknowledged.
Note
1. On November 2010, the Ghana Statistical Service formally announced the completion of the rebasing of Ghana’s GDP. The rebasing was based on 2006 social accounting and use tables and concluded that Ghana’s GDP was about 60 per cent larger than previously thought (refer to rebased figures in Table 1 for the period, 2006 to 2010). Hence the budget deficits as a proportion of the rebased GDP are significantly smaller.
References
Acemoglu, D. and J.A. Robinson, 2001, ‘A Theory of Political Transitions’, The American Economic Review, 91(4), pp. 938–963.
Anaman, K.A. and Agyei-Sasu, F., 2012, ‘Impact of Democratic Political Transition on the Performance of Business Firms in Ghana’, Economic Papers: A Journal of Applied Economics and Policy, 31, pp. 391-400.
Bollen K.A. and Jackman, R.W., 1985, ‘Economic and Noneconomic Determinants of Political Democracy in the 1960s’, Research in Political Sociology, 1, pp. 27-48.
Burkhart, R.E., and Lewis-Beck, M.S., 1994, ‘Comparative Democracy: The Economic
Anaman: Impact of Democratic Political Transition on the Economy of Ghana 151
Development Thesis’, American Political Science Review, 88, pp. 903-910Cutright, P. and Wiley, J.A., 1969, ‘Modernization and Political Representation: 1927-
1966’, Studies in Comparative International Development, 5(1), pp. 23-44.Databank, 2011, Investment and Macroeconomic Developments in some African Countries,
Accra, Ghana: Databank Research Department.Gonsalez, M.D.L.A., 2002, ‘Do Changes in Democracy Affect the Political Budget Cycle? Evidence from Mexico’, Review of Development Economics, 6(2), pp. 204-224.
Helliwell, J., 1992, Empirical Linkages between Democracy and Economic Growth, National Bureau of Economic Research Working Paper No. 4066, Washington DC, USA.
Hicks, J.R., 1939, ‘The Foundations of Welfare Economics’, Economic Journal, 49(196), pp. 696-712.
Kaldor, N., 1939, ‘Welfare Propositions and Inter-personal Comparisons of Utility’, Economic Journal, 49(195), pp. 549-552.
Libich, J., Savage, J. and Stehlik, P., 2010, ‘Fiscal Neglect in a Monetary Union’, Economic Papers, 29(3), pp. 301-309.
Lipset, S.M., 1959, Economic Development and Political Legitimacy, London: Bobbs-Merril.
Ministry of Finance and Economic Planning, 2011, 2010 Fiscal Data Final, 31 May, Accra, Ghana: Ministry of Finance and Economic Planning.
Nordhaus, W., 1975, ‘The Political Business Cycle’, Review of Economic Studies, 42, pp. 169-90.
Rodrik, D. and R. Wacziarg, 2005, ‘Do Democratic Transitions Produce Bad Economic Outcomes?’, The American Economic Review 95(2), pp. 50–55.
Sen, A., 1993, ‘Markets and Freedom: Achievements and Limitations of the Market Mechanism in Promoting Individual Freedoms’, Oxford Economic Papers, 45(4), 519-541.
Welzel, C. and Inglehart, R., 1999, Analyzing Democratic Change and Stability: A Human Development Theory of Democracy, Paper FS III 99-202, Berlin, Germany: Wissenschaftszentrum Berlin für Sozialforschung GmbH.
Winham, G.R., 1970, ‘Political Development and Learner’s Theory: Further Test of a Causal Model’, American Political Science Review, 64(4), pp. 810-818.