Impact of credit risk on corporate financial performance ...
14
Vol. 11(1), pp. 1-14, January 2019 DOI: 10.5897/JEIF2018.0940 Article Number: C17A26360107 ISSN 2006-9812 Copyright © 2019 Author(s) retain the copyright of this article http://www.academicjournals.org/JEIF Journal of Economics and International Finance Full Length Research Paper Impact of credit risk on corporate financial performance: Evidence from listed banks on the Ghana stock exchange Richard Oduro 1* , Michael Amoh Asiedu 1 and Samuel Gamali Gadzo 1 1 Department of Banking and Finance, School of Business, University of Education, Winneba, Ghana. 2 Department of Accounting, School of Business, University of Education, Winneba, Ghana. Received 16 October, 2018; Accepted 16 January, 2019 A bank’s financial performance and survival can be threatened when there is an increased exposure to credit risk. On this basis, this study seeks to identify the factors that determine the level of bank credit risk and further estimates the effects of bank credit risk on corporate financial performance using financial data from banks on the Ghana Stock Exchange over a 15-year period from 2003 to 2017. Using the method of 2SLS, it was observed variables such as capital adequacy, operating efficiency, profitability, and net interest margin are inversely related to credit risk. Conversely, bank size and financing gap tend to relate positively with credit risk. Also, anualised changes in inflation tend to positively affect credit risk. Again, it was observed that, increase in bank credit risk negatively affects corporate financial performance which is consistent with Basel accord. Thus, for banks to survive in their industry, critical attention needs to be paid to management of its credit risk exposure. Key words: Credit risk, corporate performance, loan default, interest rate. INTRODUCTION The banking sector of every country plays a significant role in its economy’s growth and development. One of such roles is to act as an intermediary between lenders and borrowers. Associated with this role is the risk that depositors will suddenly withdraw their deposits (liquidity risk) and the risk that borrowers will default in repayment of interest and the principal loans on time (credit risk). These risks, especially credit risk, have a high tendency of adversely affecting financial performance of these institutions and if not well managed, persistent exposure to these risks poses threat to the survival of these institutions. There have been several studies on banking crisis in different economies and the role plays by credit risk in these crises. A study undertaken by Hasan et al. (2014) revealed that, higher level of credit risk was one of the major causes of bank failures and the global financial crisis in both developing and developed countries. The global financial crisis, which originated in the US in mid- 2007, was attributed to the rapid default of sub-prime *Corresponding author. E-mail: [email protected]. Author(s) agree that this article remain permanently open access under the terms of the Creative Commons Attribution License 4.0 International License
Transcript of Impact of credit risk on corporate financial performance ...

Vol. 11(1), pp. 1-14, January 2019
DOI: 10.5897/JEIF2018.0940
Article Number: C17A26360107
ISSN 2006-9812
Copyright © 2019
Author(s) retain the copyright of this article
http://www.academicjournals.org/JEIF
Journal of Economics and International Finance
Full Length Research Paper
Impact of credit risk on corporate financial performance: Evidence from listed banks on the Ghana
stock exchange
Richard Oduro1*, Michael Amoh Asiedu1 and Samuel Gamali Gadzo1
1Department of Banking and Finance, School of Business, University of Education, Winneba, Ghana.
2Department of Accounting, School of Business, University of Education, Winneba, Ghana.
Received 16 October, 2018; Accepted 16 January, 2019
A bank’s financial performance and survival can be threatened when there is an increased exposure to credit risk. On this basis, this study seeks to identify the factors that determine the level of bank credit risk and further estimates the effects of bank credit risk on corporate financial performance using financial data from banks on the Ghana Stock Exchange over a 15-year period from 2003 to 2017. Using the method of 2SLS, it was observed variables such as capital adequacy, operating efficiency, profitability, and net interest margin are inversely related to credit risk. Conversely, bank size and financing gap tend to relate positively with credit risk. Also, anualised changes in inflation tend to positively affect credit risk. Again, it was observed that, increase in bank credit risk negatively affects corporate financial performance which is consistent with Basel accord. Thus, for banks to survive in their industry, critical attention needs to be paid to management of its credit risk exposure. Key words: Credit risk, corporate performance, loan default, interest rate.
INTRODUCTION The banking sector of every country plays a significant role in its economy’s growth and development. One of such roles is to act as an intermediary between lenders and borrowers. Associated with this role is the risk that depositors will suddenly withdraw their deposits (liquidity risk) and the risk that borrowers will default in repayment of interest and the principal loans on time (credit risk). These risks, especially credit risk, have a high tendency of adversely affecting financial performance of these institutions and if not well managed, persistent exposure
to these risks poses threat to the survival of these institutions.
There have been several studies on banking crisis in different economies and the role plays by credit risk in these crises. A study undertaken by Hasan et al. (2014) revealed that, higher level of credit risk was one of the major causes of bank failures and the global financial crisis in both developing and developed countries. The global financial crisis, which originated in the US in mid-2007, was attributed to the rapid default of sub-prime
*Corresponding author. E-mail: [email protected].
Author(s) agree that this article remain permanently open access under the terms of the Creative Commons Attribution
License 4.0 International License

2 J. Econ. Int. Finance loans or mortgages (Ashby, 2011; Flaherty et al., 2013). This crisis in effect led to the collapse of some financial institutions; some banks facing financial distress which led to their bankruptcy and subsequent closure. Also, the recent banking crisis which started in 2008 in several banks of the USA and European countries was attributed to poor credit risk management practices which led to increasing interest in the studying of credit risk issue (Juta and Ingrįda, 2009).
In the case of Sub-Saharan Africa, the Nigerian banking sector crises in 2009 and 2010 was attributable to high exposure to credit risk, weak and isolated financial systems and poor regulatory and supervision from the regulators, Bank of Nigeria (Marchettini et al., 2015).
In the case of Ghana, the situation is not different. From an Asset Quality Review (AQR) of banks conducted by the Bank of Ghana in 2015 and updated in 2016, some indigenous banks were identified as vulnerable with inadequate capital, high levels of non-performing loans, and weak corporate governance systems. In August 2017, the Bank of Ghana closed two of those banks (UT Bank and Capital Bank) and approved the acquisition by GCB Bank of some of their assets and liabilities under a Purchase and Assumption Agreement (PAA). Even though the closure of these banks was due to several other factors, high level of non-performing loans and hence higher exposure to credit risk played significant role in the closure as about 78% of the loan portfolios of these banks were subject to impairment. Exposing these banks to high credit risk eventually led to the revocation of their licenses (Bank of Ghana, 2017). Again in 2018, the regulator, Bank of Ghana merged five banks (namely BEIGE Bank, Sovereign Bank, Construction Bank, Unibank and Royal Bank) into a new bank known as the Consolidated Bank. Report issued by the regulator on the basis of this consolidation indicates that two of these five banks (Royal and Sovereign Bank) were included in the merger due to poor credit risk and liquidity risk management hence increasing their level of credit risk exposure.
Studies on credit risk and how it impacts corporate financial performance in developed economies are adequately represented in the corporate finance literature. We can cite the work of Altman and Saunders (1998) who did a study on credit risk measurement in a developed economies; Fatemi and Fooladi (2006) who studied the credit risk management practices among selected financial institutions, Weber et al. (2010) who also explored into incorporating sustainability criteria into credit risk management, Acharya et al. (2013) who dealt with aggregation of bank risk and Rampini et al. (2014) also dealt with dynamic risk management approach in managing credit risk. In the developing economies, however, there is still relatively not much study in the area of credit risk and corporate financial performance. Few studies identified include Odonkor et al. (2011) who
dealt with risk and how it impacted corporate financial performance of banks in Ghana, Sakyi et al. (2014) who did a similar study but focused on non-bank financial institutions and Apanga et al. (2016) who also studied credit risk management of Ghanaian listed banks. Evidently, studies on credit risk exposure and how it impacts the performance of financial institutions in the Sub-Saharan Africa and Ghana in particular, remains scanty and with the emergence of the recent instability in the banking system of Ghana, it has become undoubtedly necessary to assess the impact that exposure to credit risk will have on the performance of these banking institutions and this has been the focused of this study. This study attempts to fill this gap by first identifying the factors that determine the credit risk exposure of listed commercial banks in Ghana and then secondly, estimate the impact that the exposure to credit risk will have on the financial performance of these banks. Review of related literature and hypothesis development Determinants of credit risk Basel Committee on Banking Supervision (1999) defined credit risk as the potential loss to a bank when a borrower or counterparty fails to meet its credit obligations in accordance with agreed terms. It is a surrogate to loan default risk, which is the risk that a borrower would not be able to fulfil his credit obligation as and when due (Balogun and Alimi, 1990). In identifying the main influencers of credit risk exposure, Goldstein and Turner (1996) took a holistic view of those factors and argued that, the accumulation of non-performing loans is generally attributable to a number of factors, namely economic downturns, macroeconomic volatility, terms of trade deterioration, high interest rate, excessive reliance on overly high-priced inter-bank borrowings, insider lending and moral hazard. However, Berger and De Young (1997) and then Bloem and Gorter (2001) asserted that, the factors that lead to higher credit risk exposure is more micro rather than the macro factors identified by Goldstein and Turner. They rather identified factors such as poor credit management, over optimistic assessments of creditworthiness during economic booms, relaxed supervision role from the regulator and moral hazard that result from generous government guarantees.
Other researchers have taken a different dimension in respect to what determines the level of credit risk exposure. For instance, Sufian et al. (2008) supporting the claim that, credit risk exposure is influenced by adverse movement of macroeconomic variables, they stressed on the importance of a strong capital based and strong capital structure. His view is of the fact that, this offers banks in developing economies the ability to

endure financial crunches and protect depositors in times of bankruptcy and distress macroeconomic conditions. This may be the possible basis on which Bank of Ghana (BOG), the regulator persistent increase in the capital requirement in the banking industry. For instance, on 11 September 2017, BOG gave a directive which requires that, the minimum stated capital requirement of universal banks operating in Ghana from GHS120 million to GHS400 million and required that banks comply by the end of December 2018 (PWC, 2018). Effect of credit risk on corporate financial performance Credit risk has been identified as the key risk in banking operations that influence banks’ performance in terms of profitability, solvency and liquidity (Sinkey, 1992). Good corporate financial performance is an evidence of effective business management. The banks are into business, like any other firm, with the purpose of making profit; hence, before granting a credit facility to a borrower, it has to be sure on the capability of repayment by the borrower before granting such facility. A high exposure to credit risk is a panacea to possible profitability deterioration as there is an inverse relationship between credit risk exposure and returns on investment. The profitability of a bank is adversely affected by defaults. Provisions for bad and doubtful debts are directly subtracted from the revenues of good loans.
However, a sharp contrast from Kohn (1994) indicates that, there is a trade-off between the two. Riskier securities (higher yield loans) pay a high risk premium (higher average return) because there is a greater uncertainty of payment. So, higher exposure to credit risk can possibly lead to greater returns.
Credit risk leads to capital inadequacy (insolvency). Capital adequacy shows the financial capability of a bank to meet up with its financial obligations. An acceptable capital adequacy position is equivalent to saying that a bank is not over exposed to risks (Garderner, 2007). The role of adequate capital base is to absorb unexpected and exceptional losses that it might experience especially in situations of uncertainty. The more capital a bank has, the more are its creditors or the government insurance agency protected, and the greater is the capital loss that can be sustained without resulting in bankruptcy (Shah, 1996).
Credit risk, if not well managed brings liquidity crises. A more liquid bank is able to meet up with financial demands from its customers and thus create more value and confidence in the eye of the public. A loss in liquidity shows that they cannot meet up with demand if customers turn up and thus crisis can develop (Gaffney, 2009).
The performance of a bank has linear relationship with the credit and recovery process (Asari et al, 2011). Asari
Oduro et al. 3 et al. (2011) rightly argued that banks are unable to earn profit from credits in default. The provisions for loan defaults reduce total loan portfolio of banks and as such affects interest earnings on such assets. This constitutes huge cost to banks. Study of the financial statement of banks indicates that unsecured loans have a direct effect on profitability of banks. This is because charge for bad debts is treated as expenses on the profit and loss account and as such impacts negatively the profit position of banks (Price Water-House Coopers, 2009).
Berger and De Young (1997) indicate that failing banks have huge proportions of bad loans prior to failure and that asset quality is a statistically significant predictor of insolvency. Fofack (2005) also reported banks holding huge loan defaults in their books can run into bankruptcy if such institutions are unable to recover their bad debts. A possible effect of loan defaults is on shareholders’ earnings. Dividend payments are based on banks’ performance in terms of net profit. Thus since loan defaults have an adverse effect on profitability of banks; it can affect the amount of dividend to be paid to shareholders. The effect of loan defaults on the amount of dividend paid to shareholders can also affect capital mobilization because investors will not invest in banks that have huge non-performing loans portfolio.
Kargi (2011) evaluated the impact of credit risk on the profitability of Nigerian banks. Financial ratios as measures of bank performance and credit risk were collected from the annual reports and accounts of sampled banks from 2004-2008 and analyzed using descriptive, correlation and regression techniques. The findings revealed that credit risk management has a significant impact on the profitability of Nigerian banks. It concluded that banks’ profitability is inversely influenced by the levels of loans and advances, non-performing loans and deposits thereby exposing them to great risk of illiquidity and distress.
Kithinji (2010) assessed the effect of credit risk management on the profitability of commercial banks in Kenya. Data on the amount of credit, level of non-performing loans and profits were collected for the period 2004 to 2008. The findings revealed that the bulk of the profits of commercial banks is not influenced by the amount of credit and non-performing loans, therefore suggesting that other variables other than credit and non-performing loans impact profits.
It can be inferred from the literature on the effect of loan default that all banks incur certain loan losses when some borrowers default in repaying their loans. Irrespective of the extent of the risk involved loan default reduces profitability and liquidity of banks. Given the foregoing problems amongst others which banks can encounter if they do not manage their credit risk well, the managers should see to it that while carrying out their operational function of risk assumption, a judicious balance between profitability, liquidity and capital adequacy must be considered.
4 J. Econ. Int. Finance On this premises, the study seeks to test the following hypothesis; Hypothesis, H0 : Profitability of the Ghanaian banks is inversely related to their credit risk exposure. RESEARCH METHODS Data A panel data on the seven 1 banks listed on the Ghana stock exchange over a fifteen year period from 2003 to 2017 were used. Data from three banks; Eco-bank, CAL bank and UT bank were made up of pre-listing and post-listing data to ensure that the data are balanced. The data of UT bank however excluded 2017 financial statement as during this period the bank was taken over by GCB Bank. The time period (2003 to 2017) was selected on the basis that, it provides a current time series observations and also represents the period over which there were a major reformation in the Ghanaian banking system where the concept of universal banking principle was amplified which led to the revision of the banking law in 2004 (Act 673) to provide a sound legal framework, increasing the scope of financial liberalization and intermediation consistent with Bank of Ghana supervision policies. Bank specific data in relation to determinants of banks’ performance were collected from audited accounts of the listed banks and from the fact book of the Ghana Stock Exchange (2018). Data on the macroeconomic variables were collected from the World Development Indicators data base (World Bank Online, 2018) from 2003 to 2017. Model parameters In identifying the factors that influenced credit risk, the parameters of the model for the study need to be specified. The specification procedure adopted was in line with the procedure used by Aspachs et al. (2005), Saunders and Cornett (2007), Shen et al. (2009) and Vodova (2011) was followed where the functional forms of the model to estimate the determinants bank credit risk is expressed as follows;
(1) Credit risk exposure is measured by loan loss provision ratio (LLR). The model is specified to include bank-specific factors, namely; Capital adequacy measured by capital ratio (CR), financial risk measured by leverage ratio (LR), financial stability (Z-score), management efficiency ratio (MER), Business operational efficiency measured by trading income as a percentage of total revenues (TTR), net interest ratio (NIR), Earnings potential measured by return on equity (ROE), and return on assets (ROA), liquidity risk measured by financing gap ratio (FG), loan deposit ratio (LDR) and bank size measured by total asset (SIZE). Also, included in the model in (1) are common market factors which include percentage change in inflation (IFL), growth in gross domestic product (GDP) and short term yield on government securities measured by the short term yield curve (SYC).
Similarly, specifying the model to assess the effect of credit risk
1 Ecobank Ghana Ltd., GCB Bank, Cal Bank Ltd, SG-SSB Limited, HFC Bank Ltd., Standard Chartered Bank, and UT Bank Ltd.
on bank performance, it can be functionally expressed as;
(2) The model in (2) is specified to include loans loss provision ratio (LLR), financial risk measured by leverage ratio (LR), expense efficiency ratio (EER), net interest income ratio (NIR), Bank size (SIZE), Short-term borrowing to total liabilities (SBL) ratio. Also, included in the model in (2) is a common market factors known as slope of the yield curve (SYC). The model To estimate the determinants of credit risk, the standard linear specification for a panel data regression model was followed and the functional model in (1) is expanded as follows;
(3) Where, denotes a proxy measure of credit risk ratio for bank i
at time t, with i =1…7 (number of banks) and t = 2003 … 2017 (15 time periods). represents endogenous variable in the model.
CR, LR, ZS, MER, TTR, NIR, ROE, ROA, FG, LDR, SIZE, IFL, GDP and SYC denoted capital ratios, leverage ratio, financial stability, management efficiency, trading income to total revenues, net interest ratio, earnings potential, return on assets, liquidity gap, loan deposit ratio, bank size, change in inflation, growth in gross domestic product and changes in short term yield curve respectively. 𝑖 denotes corresponding sensitivities to the explanatory variables respectively and denotes the error term.
Again, to estimate the effect of credit risk on corporate performance, the functional model in (2) is expanded as follows;
(4) Where 𝑂 denotes a proxy measure of corporate performance
(which is return on asset) for bank i at time t, with i =1…7 (number of banks) and t = 2003 … 2017 (15 time periods). LLR denotes loans and advances impairment loss provision ratio. In order to estimate the effects credit risk on bank profitability, model (4) is specified to include other explanatory variables (control variables) that may help in the estimation of bank profitability though they are not the main variables of interest. These include LLR, LR, MER, NIR, SIZE, FG and SYC. 𝑖 denotes corresponding sensitivities to the explanatory variables respectively and denotes a stochastic disturbance.
We can observe that, the endogenous variable in (3) is considered as exogenous variable in (4) and also the endogenous variable in (4) is considered exogenous variable in (3). When this happens, it is likely such variables may correlate with the disturbance term ( ) in the case of model (1) and ( ) in the case of model (2) leading to endogeniety, hence violating the generalised method (GM) assumptions and making our ordinary least square (OLS) estimates biased. To solve this likely problem, we substitute model (1) into model (2), as follows;
(5)
= 𝑓(𝐶 , , 𝑍𝑆, 𝑀𝐸 , 𝑇𝑇 , 𝑁𝐼 , 𝑂𝐸, 𝑂 , 𝐹𝐺, 𝐷 , 𝑆𝐼𝑍𝐸, 𝐼𝑁𝐹, 𝐺𝐷𝑃, 𝑆𝑌𝐶)
𝑂 = 𝑓( , , 𝑀𝐸 , 𝑁𝐼 , 𝑆𝐼𝑍𝐸, 𝐹𝐺, 𝑆𝑌𝐶)
𝑖 ,𝑡 = 0 + 1𝐶 + 2 + 3𝑍𝑆 + 4𝑀𝐸 + 5𝑇𝑇 + 6𝑁𝐼 + 7 𝑂𝐸 + 8 𝑂 + 9𝐹𝐺
+ 10 𝐷 + 11𝑆𝐼𝑍𝐸 + 12∆𝐼𝑁𝐹 + 13∆𝐺𝐷𝑃 + 14∆𝑆𝑌𝐶 + 𝑖
𝑂 𝑖 ,𝑡 = 0+ 1 + 2 + 3 𝑀𝐸 + 4 𝑁𝐼 + 5 𝑆𝐼𝑍𝐸 + 6 𝐹𝐺 + 7 𝑆𝑌𝐶 + 𝑖
𝑂 𝑖 ,𝑡 = 0+ 1 ( 0 + 1𝐶 + 2 + 3𝑍𝑆 + 4𝐸𝐸 + 5𝑇𝑇 + 6𝑁𝐼 + 7 𝑂 + 8 𝑂𝐸
+ 9𝑆𝐼𝑍𝐸 + 10𝐹𝐺 + 11 𝐷 + 12𝐼𝐹 + 13𝐺𝐷𝑃 + 14𝑆𝑌𝐶 + 𝑖) + 2
+ 3 𝐸𝐸 + 4 𝑁𝐼 + 5 𝑆𝐼𝑍𝐸 + 6 𝐹𝐺 + 7 𝑆𝑌𝐶 + 𝑖

It can be observed that ROA is a linear function of (among other things), and hence will be correlated with . This violates the GM assumptions, and the OLS estimator will be biased.
Justification of application of 2SLS
The Equations 1 and 2 are specified to include one endogenous variable, LLR in the case of (1) and ROA in the case of (2). So LLR which a dependent variable for (1) is jointly determined by ROA together with other variables as specify in (1). Also, ROA which is a dependent variable in (2) is jointly determined by LLR and other variables as specified in (2). In this case, endogeneity in these econometric models is likely to arise as a result of measurement error, simultaneity, omitted variables, sample selection errors, etc. Thus, the estimates obtained from the ordinary least squares (OLS) regression of model (2) become inconsistent and biased.
Following the identification procedure outline by Gujarati (2004), model (1) which estimates the determinants of credit risk and its effect on bank profitability as shown in model (2) have two endogenous variables (LLR and ROA), thus m = 2 and this is equal to the number of equations with the presence of endogeneity k = 2. In the bank profitability equation, there are eight variables (CR, ZS, TTR, ROE, FG, LDR, IFL and GDP) excluded but are present in model (1). In this case, the model (2) is over-identified since
– , thus requiring the application of instrumental variable(s) through the use of Two Stage Least Squares (2SLS) estimation procedure for the parameters.
Method of estimation: Two Stage Least Squares (2SLS) method
This method involves two successive applications of OLS. It is aimed at eliminating the likely correlation between ROA and u. To do this, we find a proxy for ROA, that will not be correlated with u.
Let us call this proxy 𝑂 ̂. The first stage of 2SLS is to generate the proxy and the second stage is to simply substitute the proxy for ROA, and estimate the resulting equation using OLS. The proxy should however be such that, it should belong to model (2) in the second equation (the one predicting ROA), but does not belong to model (1) (the one predicting LLR). In other words, a variable Z needs to be found so that it can determine ROA, but that does not influence LLR. Thus, the variable needs to satisfy the following condition;
𝑐 𝑍 and 𝑐 𝑍 𝑂
Then the following equation needs to be estimated using OLS:
(6)
What is being done here is to include all of the exogenous variables from model (1) on the RHS Equation (6) and add Z. These estimates would allow the generation of a new set of values for the
variable 𝑂 ̂ so that;
𝑂 ̂ 𝑍 𝐶 𝑍𝑆 𝐸𝐸 𝑇𝑇
𝑁𝐼 𝑂 𝑂𝐸 𝑆𝐼𝑍𝐸 𝐹𝐺 𝐷 𝐼𝐹 𝐺𝐷𝑃 𝑆𝑌𝐶 (7)
Now, 𝑂 ̂ can be substituted for ROA in model (1) as follows;
Oduro et al. 5
(8) Equation 8 can be re-written as;
(9) The new equation is then estimated using OLS. This will produce consistent estimates of all the parameters including . Fixed or random effect In applying 2SLS regression model to estimate a model parameters, either the fixed effect model (FEM) or the random effect model (REM) or the Error Components Model (ECM) may be used. In the FEM, the observed variables (a firm’s performance) expressed in terms of explanatory variables are treated as if the observe variables were non-random. In FEM, it is assumed that the intercept varies for each bank (that is over space), but is constant across through time and the regression coefficients are assumed to be common across the banks. This allows for a limited degree of bank specific characteristics and disturbances capture differences over space and time. Thus, the individual specific effect is correlated with the independent variables. Conversely, the REM assumes a common average value for the intercepts and a cross-sectional difference in the intercept values of each bank is reflected in an error term.
In deciding between FEM and REM, Judge et al. (1980) stated that, it depends on the assumption one makes about the likely correlation between the cross-section specific, error components and the regressors. If it is assumed that the error components and the regressors are uncorrelated, REM may be appropriate, but if they correlate, FEM may be appropriate. However, in this study, the choice between FEM and REM is based on the Hausman tests (Hausman, 1978; Baltagi, 2001). Hausman tests the null hypothesis that, the preferred model is REM as opposed to the alternative hypothesis that the preferred model is the FEM. Measurement and justification of variables used in the credit risk and performance model With credit risk being the dependent variable, the determinants of credit risk of listed banks in Ghana were grouped into bank-specific determinants ( as in equation (3)) and common determinants
((𝑌 as in equation (3)). The measurement and justification of these
factors are presented in this section of the methodology. Table 1 presents the different variables, their corresponding specific measures, data source and expected relationship with the dependent variable. Dependent variable
Loans and advances impairment loss ratio (LLR): The dependent variable in the model is measured by the amount of impairment of loans and advances granted by the banks which is determined in accordance with the Bank of Ghana prudential guidelines and IFRS 9. The amount of impairment loss is based on loans and advances that have proved uncollectible, and is written off against the related allowance for loan impairment. For the purpose of the model, the LLR ratio is determined as the amount of
𝑂 𝑖 ,𝑡 = 0+ 1 𝑍 + 1𝐶 + 2 + 3𝑍𝑆 + 4𝐸𝐸 + 5𝑇𝑇 + 6𝑁𝐼 + 7 𝑂 ̂ + 8 𝑂𝐸
+ 9𝑆𝐼𝑍𝐸 + 10𝐹𝐺 + 11 𝐷 + 12𝐼𝐹 + 13𝐺𝐷𝑃 + 14𝑆𝑌𝐶 + 𝑖
𝑖 ,𝑡 = 0 + 1𝐶 + 2 + 3𝑍𝑆 + 4𝐸𝐸 + 5𝑇𝑇 + 6𝑁𝐼 + 7( 𝑂 ̂𝑖 ,𝑡 + 𝑖 ) +
8 𝑂𝐸 + 9𝑆𝐼𝑍𝐸 + 10𝐹𝐺 + 11 𝐷 + 12𝐼𝐹 + 13𝐺𝐷𝑃 + 14𝑆𝑌𝐶 + 𝑖
𝑖 ,𝑡 = 0 + 1𝐶 + 2 + 3𝑍𝑆 + 4𝐸𝐸 + 5𝑇𝑇 + 6𝑁𝐼 + 7 𝑂 ̂𝑖 ,𝑡 + 8 𝑂𝐸 +
9𝑆𝐼𝑍𝐸 + 10𝐹𝐺 + 11 𝐷 + 12𝐼𝐹 + 13𝐺𝐷𝑃 + 14𝑆𝑌𝐶 + ( 𝑖 + 7 𝑖 )

6 J. Econ. Int. Finance Table 1. Specific measure of study variables.
Variable Indicators Denoted by Measure Data source Expected sign
Dependent
Loan an advance impairment loss ratio
LLR Loan and advance impairment loss divided by total gross loans and advances outstanding
Banks’ credit department and bank’s annual financial statements
Independents
Bank – specific:
Capital adequacy Capital ratio CR 𝑆𝑎 𝑒 𝑑𝑒 𝑓 𝑑
𝑖 𝑒𝑖𝑔𝑡𝑒𝑑 𝑎 𝑒𝑡 Banks annual reports Negative
Leverage ratio LR
𝑆𝑎 𝑒 𝑑𝑒 𝑓 𝑑
𝑇 𝑡𝑎 𝑎 𝑒𝑡
Banks annual reports Positive
Z-score ZS
𝑂𝐸 𝑂
𝑆𝑡𝑎 𝑑𝑎 𝑑 𝑑𝑒 𝑖𝑎𝑡𝑖 𝑓 𝑂
Banks annual reports Negative
Operational efficiency Efficiency ratio MER
𝑂 𝑒 𝑎𝑡𝑖 𝑔 𝑓𝑖𝑡
𝑇 𝑡𝑎 𝑖 𝑐 𝑒
Banks annual reports Negative
Trading income to total revenue
TTR 𝑇 𝑎𝑑𝑖 𝑔 𝑖 𝑐 𝑒
𝑇 𝑡𝑎 𝑖 𝑐 𝑒 Banks annual reports Positive
Earnings potential Net interest ration
NIR
𝐼 𝑡𝑒 𝑒 𝑡 𝑖𝑒 𝑑
𝐼 𝑡𝑒 𝑒 𝑡 𝑏𝑒𝑎 𝑖 𝑔 𝑎 𝑒𝑡
Banks annual reports Positive
Return on equity
ROE
𝑁𝑒𝑡 𝑖 𝑐 𝑒
𝐸 𝑖𝑡
Banks annual reports Negative
Return on asset ROA
𝑁𝑒𝑡 𝑖 𝑐 𝑒
𝑇 𝑡𝑎 𝑎 𝑒𝑡
Banks annual reports Negative
Size SIZE Logarithm of total Assets Banks annual reports Positive
Liquidity Financing gap FG
𝑎 𝐷𝑒 𝑖𝑡
𝑇 𝑡𝑎 𝑎 𝑒𝑡
Banks annual reports
Net loan to deposit ratio
LDR 𝑎
𝐷𝑒 𝑖𝑡 Banks annual reports
Common market
Annualised percentage change in inflation
IFL Consumer Price Index Ghana statistical service Positive
GDP growth GDP Real GDP growth Ghana statistical service Negative
Slope of the yield curve SYC GoG 5-year bond yield Ministry of Finance Negative

impairment charges as a percentage of the total gross loans and advances outstanding. Return on asset and return on equity: Previous studies into the relationship between bank operating risk and profitability have used return on asset (ROA) and return on equity (ROE) as a proxy of measuring profitability (Ara et al., 2009). This study adopted a similar measure of profitability (that is, return on asset (ROA)). ROA measures the effectiveness of management in the utilization of the funds contributed by both shareholders of the bank and other credit providers. It is computed as the ratio of net operating profit and average total assets indicating how efficient a bank is managing its assets to generate income. This study did not use return on equity (ROE) as a measure of profitability due to its major drawback of overstating the ROE ratio for banks with high financial gearing. Independent variable The independent variables in the model are grouped into two; bank specific determinants and common determinants. Bank-specific factors: The main bank-specific factors in the model are capital adequacy, bank’s asset quality, business operational efficiency, earning potentials, size and liquidity. Each of these factors is measured by indicators which are expected to have influence on the credit risk of the bank. The following paragraph provides a description of the bank-specific factors and the indicators for each identified factor. Capital adequacy: measures the bank ability to accommodate shocks (financial strength) and promote stability and efficiency in the banks operation. It is measured by three alternative variables: capital ratios (CR), leverage ratio (LR), and Z-score (ZS). Capital ratio represents the ratio of equity capital (shareholders capital and reserves) divided by risk-weighted assets as reported by each bank. Leverage measures the size of average total assets relative to average total equity. It is one of the standard indicators implied by the structural approach to the pricing of default risk. Higher leverage would correlate positively with default risk. Z-score is a derivative measure of bank capitalization. It is computed as a sum of return on asset (ROA) and return on equity (ROE) to total assets ratio scaled by the standard deviation of ROA (Boyd and Runkle, 1993). A higher value of Z-score indicates a higher resistance to shocks and implies a lower credit risk and vice versa. Business operational efficiency: is measured by quality of management and differences in the business models adopted by the banks. Management quality is approximated by Management efficiency ratio (MER) which is represented by the ratio of operating expenses to total revenues. It measures management flexibility to adjust operational costs to changes in the business development signalled by revenues. A higher MER is an indication of a higher is the default risk.
Business model is represented by trading income as a percentage of total revenues (TTR). Earnings potential: assess the ability of the bank to generate income using the available assets. It is represented by three profitability ratios: net interest income ratio (NIR), return on equity (ROE), and return on assets (ROA). The NIR is lending margin charged by a bank and is calculated as the percentage interest yield on interest bearing assets. Since loans are priced according to their risk level, a higher lending margin may therefore signal higher risked portfolio. Therefore, a higher net interest income ratio would imply higher default risk. The ROE and ROA measure the profit a bank can generate from it available asset, hence should correlate
Oduro et al. 7 negatively with default risk. ROE (ROA) is computed as the ratio of net income and shareholders’ fund (total assets). A higher ROE or ROA indicates better profit prospects for growth and resilience to shocks, and thus should be associated with lower credit risk. Bank Size (size): is calculated as the natural log of the bank's total assets contributes to its credit since it has ability to mobilize funds from diversified sources. It is suggested that, banks face less credit risk as they grow in size as they can be selective as to who to grant credit facility to and also, are able to obtain funding at a lower cost due to implicit guarantee but beyond particular levels; they begin to face credit risk due to diseconomies of scale. Bank size is expected to be positively related with credit risk.
A bank is exposed to liquidity risk where there is maturity mismatch when liquid liabilities (in the form of customer deposits) are transformed into risky liquid assets (in the form of loans). It shows to what degree a bank is capable of dealing with sudden and unexpected liquidity demand from depositors. In measuring liquidity risk, two indicators were used: financing gap ratio (FG) and loan deposit ratio (LDR).
Financing gap ratio is the difference between a bank's average core loans and its average core deposits standardized by the total asset of the bank. A value above zero implies that, the bank is not able to endure a sudden customer demand, hence indicate high liquidity risk which pushes the bank to an acute situation if customers default.
Short-term loan to deposit measures the degree to which banks can withstand a sudden liquidity distress. A bank with a higher share of short-term borrowing would be more vulnerable in the event of a bank run and hence a higher LLR. Common market factors These are factors in model (3) which affect credit risk in the banking industry as a whole. Three main factors were considered as possible factors which influence the credit risk faced by banks on the Ghana stock exchange. They include percentage change in inflation (IFL), growth in gross domestic product (GDP) and slope of the yield curve (SYC).
It is very characteristic of commercial banks to adjust for inflation factor in pricing their loan products during a period of downturn which affects the premium paid to cover their credit risk insurance. Also, monetary and fiscal policies of central bank affect the supply of money which affects inflation which has influence on the credit status of the banks. Annual percentage change in inflation was included in the model using the annualised percentage change consumer price index as reported by Ghana statistical service as a measure of inflation changes. Recent studies (Shen et al., 2009) revealed that the annual percent change in inflation (INF) had a significantly positive correlation with bank's credit risk, thus, in this study, we expect annual percentage change to correlate positively with credit risk.
GDP growth was also introduced into the model as credit risk general reduces as there is an improvement in the economy as indicated by growth in the GDP rates. GDP growth is therefore negatively correlated with the share of non-performing loans and positively with the recovery rate.
In measuring the GDP growth, the real figures were used in order to ascertain the actual impact of GDP on credit risk of the banks. The study therefore expects a negative correlation between GDP growth and credit risk insurance premium.
The slope of the yield curve reflects growth prospects of the economy and expected future short-term interest rates. If the yield curve is steepened, it is a signal of positive prospects for economic growth (hence a decline in non-performing loans and hence improvement in recovery rate would be expected). A steepening of the yield curve (future improvement in economic conditions) should
8 J. Econ. Int. Finance
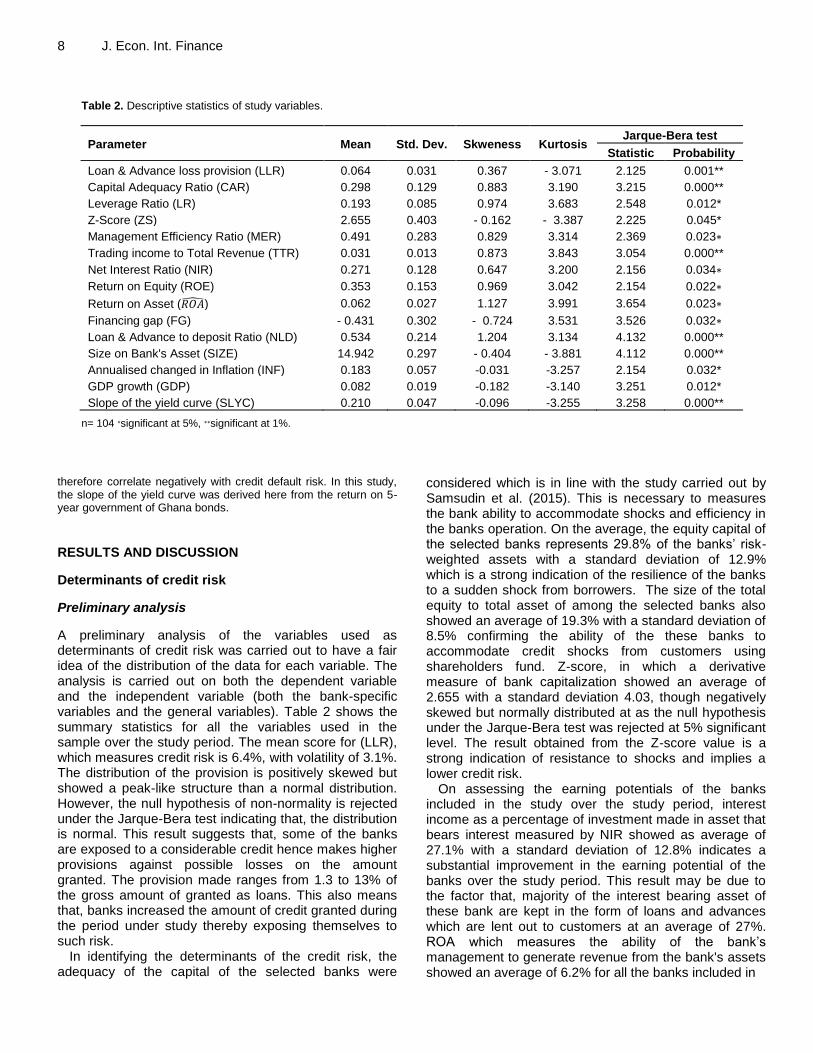
Table 2. Descriptive statistics of study variables.
Parameter Mean Std. Dev. Skweness Kurtosis Jarque-Bera test
Statistic Probability
Loan & Advance loss provision (LLR) 0.064 0.031 0.367 - 3.071 2.125 0.001**
Capital Adequacy Ratio (CAR) 0.298 0.129 0.883 3.190 3.215 0.000**
Leverage Ratio (LR) 0.193 0.085 0.974 3.683 2.548 0.012*
Z-Score (ZS) 2.655 0.403 - 0.162 - 3.387 2.225 0.045*
Management Efficiency Ratio (MER) 0.491 0.283 0.829 3.314 2.369 0.023∗
Trading income to Total Revenue (TTR) 0.031 0.013 0.873 3.843 3.054 0.000**
Net Interest Ratio (NIR) 0.271 0.128 0.647 3.200 2.156 0.034∗
Return on Equity (ROE) 0.353 0.153 0.969 3.042 2.154 0.022∗
Return on Asset ( 𝑂 ̂) 0.062 0.027 1.127 3.991 3.654 0.023∗
Financing gap (FG) - 0.431 0.302 - 0.724 3.531 3.526 0.032∗
Loan & Advance to deposit Ratio (NLD) 0.534 0.214 1.204 3.134 4.132 0.000**
Size on Bank's Asset (SIZE) 14.942 0.297 - 0.404 - 3.881 4.112 0.000**
Annualised changed in Inflation (INF) 0.183 0.057 -0.031 -3.257 2.154 0.032*
GDP growth (GDP) 0.082 0.019 -0.182 -3.140 3.251 0.012*
Slope of the yield curve (SLYC) 0.210 0.047 -0.096 -3.255 3.258 0.000**
n= 104 ∗significant at 5%, ∗∗significant at 1%. therefore correlate negatively with credit default risk. In this study, the slope of the yield curve was derived here from the return on 5-year government of Ghana bonds.
RESULTS AND DISCUSSION
Determinants of credit risk
Preliminary analysis
A preliminary analysis of the variables used as determinants of credit risk was carried out to have a fair idea of the distribution of the data for each variable. The analysis is carried out on both the dependent variable and the independent variable (both the bank-specific variables and the general variables). Table 2 shows the summary statistics for all the variables used in the sample over the study period. The mean score for (LLR), which measures credit risk is 6.4%, with volatility of 3.1%. The distribution of the provision is positively skewed but showed a peak-like structure than a normal distribution. However, the null hypothesis of non-normality is rejected under the Jarque-Bera test indicating that, the distribution is normal. This result suggests that, some of the banks are exposed to a considerable credit hence makes higher provisions against possible losses on the amount granted. The provision made ranges from 1.3 to 13% of the gross amount of granted as loans. This also means that, banks increased the amount of credit granted during the period under study thereby exposing themselves to such risk.
In identifying the determinants of the credit risk, the adequacy of the capital of the selected banks were
considered which is in line with the study carried out by Samsudin et al. (2015). This is necessary to measures the bank ability to accommodate shocks and efficiency in the banks operation. On the average, the equity capital of the selected banks represents 29.8% of the banks’ risk-weighted assets with a standard deviation of 12.9% which is a strong indication of the resilience of the banks to a sudden shock from borrowers. The size of the total equity to total asset of among the selected banks also showed an average of 19.3% with a standard deviation of 8.5% confirming the ability of the these banks to accommodate credit shocks from customers using shareholders fund. Z-score, in which a derivative measure of bank capitalization showed an average of 2.655 with a standard deviation 4.03, though negatively skewed but normally distributed at as the null hypothesis under the Jarque-Bera test was rejected at 5% significant level. The result obtained from the Z-score value is a strong indication of resistance to shocks and implies a lower credit risk.
On assessing the earning potentials of the banks included in the study over the study period, interest income as a percentage of investment made in asset that bears interest measured by NIR showed as average of 27.1% with a standard deviation of 12.8% indicates a substantial improvement in the earning potential of the banks over the study period. This result may be due to the factor that, majority of the interest bearing asset of these bank are kept in the form of loans and advances which are lent out to customers at an average of 27%. ROA which measures the ability of the bank’s management to generate revenue from the bank's assets showed an average of 6.2% for all the banks included in

the study over the study period with a variation of 2.7%. A similar measure, ROE which measures the returns the bank was able to generate on the investment made by the shareholders showed as average 35.3% with a standard deviation of 15.3%. Both ROA and ROE depicted as positively skewed distribution but somewhat normally distributed as the null hypothesis under the Jarque-Bera test was rejected at 5% level of significance. This picture suggests a good performance during the period under study.
In assessing the quality of loans granted, the average financing gap ratio (FG) is 43% with a variation of 30.2% between the ratios of 77 to 146%. Though the distribution seems to have a long tail to the right, it appears to be a little leptokurtic relative to the normal distribution. However, the null hypothesis under the Jarque-Bera test was rejected at 5% significant level indicating that, the distribution is approximately normal and good for further statistical analysis. The negative ratios indicate a favourable financing gap ratio, that is, the banks kept a considerable amount of liquidity and hence faced minimal liquidity risk during study period. Also, the ratio of loan and advances to total deposits (NLD), an alternative measure of loan quality, showed that, a mean of 53.4% of all deposits mobilised by the banks were given as loans with a minimum of 23.3% and a maximum of 125.5%. This result is an indication of the bank lending out a significant amount of their deposits to the extent that, other banks granted loans worth more than the value of their deposits indicating that funds other than deposits were given out. Such banks could be regarded as having very strong capital based and strong credit policies.
The average asset of the banks used in the study recorded a score of 14.942 (translating to into over GHS3 billion) with a variation of 0.297 in terms of standard deviation values ranging between 13.932 to 15.839. The total assets recorded an average of 12.53% is kept in the form of liquid asset (cash, balance with Bank of Ghana and short term funds). About 42.3% of the total bank assets were kept as risky asset in the form of investment in long term asset, loans and advances and other medium term securities). The higher proportion of asset kept as risky asset may have been motivated the higher returns associated with such assets and also being kept liquid in order to meet financial obligations in a real time as and when due.
Assessing the implication of the common market indicators on credit risk, the annualised inflation showed an average rate of 18.3% with a standard deviation of 5.7% over the study period. Though the distribution of the annualised inflation rates is positively skewed, the null hypothesis under the Jarque-Bera test is rejected at 5% significant level indicating that the distribution of the annualised inflation rates is normal. Similar statistics is observed in respect of growth in the GDP rates and the slope of the yield curve. The GDP showed average growth of 8.2% with a standard deviation of 1.9% over
Oduro et al. 9 the study period whereas the Government of Ghana five year bond showed an average rate of 21% with a standard deviation of 4.7%. The distribution of GDP growth and that of the yield curve appears to be negatively sloped but are normally distributed at 5 and 1% level of significance respectively. Inter-correlations The object of this section is to examine the presence of multi-collinearity, which occurs when there is a strong correlation between two or more predictor variables in a regression model (Field, 2009). Hair et al. (2014) provided two approaches in identifying and dealing with multi-collinearity. First is an examination of the correlation matrix among the predictors. The absolute correlation coefficient greater than or equal to 0.60 is an indication of substantial colliniarity. The results of the study, from Table 3, reported the highest absolute correlation coefficient of 0.514 with most correlation coefficients falling below 0.2 indicating absence of colliniarity. This high correlation occurred between ROA and ROE which is expected since both measure tends to measure profitability of the banks. However, even though they exhibit high correlation, the correlation coefficient is within the acceptable limit.
Secondly, to avoid a collinearity due to the combined effect of two or more predictors, we apply the variance inflation factor (VIF). A threshold of VIF values of 10 is applied following the recommendation of Gaur and Gaur (2009) and Hair et al. (2014). VIF values are shown in Table 3 which indicates no problem of multicollinearity. Regression analysis In testing the stated hypothesis (Hypothesis 1), a multiple regression was carried out to determine whether or not factors such as capital adequacy, business operational efficiency, earning potential and firm liquidity determines the volatility in the firm’s exposure to risk. The result of the regression analysis is shown in Table 4.
The result obtained from the analysis shows that, the model estimate fits the data as the fitness test, using the F statistic showed that, the null hypothesis of equally between the co-efficient of the predictor variables cannot be accepted at 1% level of significance. The adjusted R-square also showed that, the predictors well explained 62.8% of the variations in the credit risk which is an indication that, the selected predictor variables determine the credit risk exposure by Ghanaian banks.
On the bank-specific variables, there is a negative significant relationship between capital adequacy ratio and credit risk at 1%. This provides evidence that, bank with a strong capital adequacy is also able to absorb possible loan losses and thus avoids bank ‘run’,

10 J. Econ. Int. Finance
Table 3. inter-correlations among study variables.
CAR LR ZS MER TTR NIR ROE ROA FG LDR SIZE INF GDP SYC
CAR (20.15)
LR 0.456** (30.52)
ZS -0.451** -0.334** (10.25)
MER -0.010 -0.006 0.091 (10.22)
TTR 0.146 -0.005 0.113 0.282** (30.16)
NIR 0.406** 0.084 -0.161 -0.079 0.088 (10.96)
ROE -0.494** -0.442** 0.458** 0.106 0.095 -0.139 (0.29)
ROA -0.161 0.434** 0.430** 0.072 0.056 -0.150 0.514** (30.12)
FG -0.025 -0.399** -0.129 -0.069 -0.076 0.031 -0.051 -0.379** (20.22)
LDR 0.018 0.028 -0.133 -0.037 -0.157 0.024 -0.101 -0.020 0.430** (40.12)
SIZE 0.009 -0.430** -0.116 -0.089 0.040 0.060 -0.026 -0.413** 0.512** 0.023 (30.52)
INF 0.021 0.130 -0.108 -0.014 -0.045 0.151 -0.116 -0.002 -0.003 0.074 -0.168 (00.19)
GDP -0.091 0.044 0.048 -0.030 0.058 -0.064 0.085 0.053 -0.064 -0.101 -0.120 -0.119 (1.0)
SYC 0.147 -0.059 -0.227* 0.008 -0.064 0.115 -0.213* -0.210* 0.044 -0.024 0.051 0.328** -.112 (3.21)
VIF values are reported in parentheses on the diagonal. n = 104; *. Correlation is significant at the 0.05 level (2-tailed), **. Correlation is significant at the 0.01 level (2-tailed).
Table 4. Determinants of credit risk.
Parameter Expected
relationship Coefficient Std. error t-Statistic Sig.
(Constant) ? 0.504∗ 0.305 1.651 0.071
Capital Adequacy Ratio (CAR) - -0.266∗∗∗ 0.038 -6.995 0.005
Leverage Ratio (LR) - 0.115 0.081 1.408 0.163
Z-Score (ZS) - -0.107∗∗∗ 0.030 -3.602 0.006
Management Efficiency Ratio (MER) - -0.027∗∗ 0.012 -2.317 0.023
Trading income to Total Revenue (TTR) - -0.421∗ 0.218 -1.931 0.057
Net Interest Ratio (NIR) + -0.067∗∗ 0.030 -2.286 0.015
Return on Equity (ROE) - -0.322∗∗∗ 0.069 -4.693 0.008
Return on Asset (ROA) - -0.252 0.295 -0.854 0.108
Financing gap (FG) ? 0.110∗∗∗ 0.018 6.228 0.006
Loan & Advance to deposit Ratio (LDR) ? 0.113∗∗∗ 0.021 5.275 0.006
Size on Bank's Asset (SIZE) + -0.084∗∗∗ 0.019 -4.329 0.007
Annualised changed in inflation (INF) + 0.104∗∗ 0.058 1.803 0.075
GDP growth (GDP) - -0.033 0.141 -0.237 0.814

Oduro et al. 11 Table 4. Contd.
Slope of the yield curve (SYC) - -0.019 0.065 -0.286 0.775
Dependent Variable: Loan & Advance loss provision (LLR). R-square = 0.798. R-square Adjusted = 0.628. F(103) = 2.68. p = 0.000*p is significant at the 0.1 level (2-tailed), **significant at the 0.05 level (2-tailed) and ***significant at the 0.01 level (2-tailed)
insolvency and failure. Thus if a bank in Ghana wishes to be resistant to its credit risk exposure, it needs to increase in equity capital in relation to its total assets. This observation is in line with the study by Louati et al. (2015) who examine the role of capital adequacy in the credit risk exposure of Islamic and conventional banks, and concluded that, the ability of a bank to withstand credit risk shocks is to capitalise adequately.
This also confirms the Bank of Ghana recent directive of increasing the capital requirement of commercial banks in Ghana from GHS120 million to GHS400 million effectively by the end of 2019. Z-score, a measure of solvency of banks which makes use of profitability measures, also showed a negative significant relationship between credit risk and bank’s solvency at 1% level of significance. The result implies that, for banks in Ghana to mitigate the effect of credit risk exposure, they should engage in more profitable activities which would increase their possibility of survival which intend to reduce their exposure to credit risk. This observation is in line with Imbierowicz and Rauch (2014) who concluded that, striving to survive in the industry would lead to reduction in credit risk exposure. Leverage ratio showed a positive relationship with credit risk, though the relationship is not significant. This implies that, in analysing factors that influence the credit risk exposure of Ghanaian banks, shareholders’ capital in relation to total asset do not significantly contribute to the variations in the credit risk exposure.
In assessing the role of business operation efficiency in explaining the volatility in the credit risk exposure, two proxy measures were used; Management efficiency ratio (MER) and Trading income to total revenue ratio. The MER which measures how well management is able to control operational expense so as to accumulate funds to meet any sudden shock from credit risk showed a negative significant relationship with credit risk at 5%. The implication of this result is that, as management increases their efficiency in managing expenses, thereby increasing operation profit, credit risk exposure is expected to decrease significantly. Similar story could be told about trading income to total revenue which relates significantly negative with credit risk at 10% level of significance.
Return on equity (ROE)) as expected showed a significant inverse relationship with credit risk at 1%
significant level. Return on asset (ROA) similarly showed an inverse relationship but the relationship appears not to be significant. This brings out the fact that, the role of management of profitability in relation to shareholder investment plays a significant role in managing credit risk. Efficient management of profitability in relation to shareholders’ value and even total asset is necessary for effectively managing credit risk as this would ensure accumulation of returns necessary to meet any shock that may be triggered by credit risk exposure. Net interest ratio (NIR) however showed a significant inverse relationship with credit risk at 5% level of significance as against the expected positive relationship from the literature. The NIR measures the interest earned by the bank as a percentage of total interest bearing assets. The result therefore shows that, higher interest yield investments by the banks would help in significantly manage impact of credit risk. This result contracts the view put forward by Inci and Jiri Podpiera (2010) who studied the fundamental determinants of credit default risk for European large complex financial institutions and concluded that net interest ratio significantly contributes positively to credit risk. This variation in the result may be due to difference in macro-economic framework and differences in the economies within which the studies were carried out.
The relationship between bank size (SIZE), financing gap and credit risk is significantly positive at 1 and 1%, respectively providing the evidence that as banks grow bigger in size, they have the incentive to increase risk on customer default as they are able to hold more loans and consequently have larger financing gap ratio. That is, larger banks have the capacity to mobilize more deposits in which they are able to sell at relatively cheaper price. Such banks are thus able to take greater risks by granting more loans to deficit units, thereby exposing themselves to higher credit risk. This result is in line with the findings of Lucchetta (2007), Bunda et al. (2010), Rauch et al., (2009) who concluded that, as banks grow in size, their exposure to credit risk increases.
Among the three macro-economic variables which entered the model, only the annualised changes in inflation tend to significantly affect credit risk with the direction of effect being significantly positive. The changes in GDP and the slope of the yield curve, though relate negatively with credit risk exposure, they tend to be

12 J. Econ. Int. Finance
Table 5. Determinants of banks’ profitability.
Parameter Coefficient Std0. error t-Statistic Sig 0.
(Constant) 10.215 0.138 80.792 0.000∗∗∗
Loan and Advance loss provision (LLR) -0.268 0.072 -30.717 0.002∗∗∗
Leverage Ratio (LR) 0.157 0.032 40.863 0.000∗∗∗
Management Efficiency Ratio (MER) -0.012 0.008 -10.507 0.080∗
Net Interest Ratio (NIR) -0.019 0.019 -00.987 0.326
Size on Bank's Asset (SIZE) 0.074 0.109 00.679 0.201
Financing gap (FG) -0.143 0.042 -30.405 0.001∗∗∗
Slope of the yield curve (SLYC) 0.092 0.044 20.079 0.040∗∗
Dependent Variable: Return on Asset (ROA) R-square = 0.881. R-square Adjusted = 0.783. F(103) = 3.48. p = 0.000*p is significant at the 0.1 level (2-tailed), **significant at the 0.05 level (2-tailed) and ***significant at the 0.01 level (2-tailed).
insignificant. Effect of credit risk on banks’ profitability Regression analysis The second objective of the study seeks to analyse the effect of credit risk (measured by loan and advance loss provision (LLP)) on the performance of banks in Ghana with return on asset (ROA) being a proxy of measuring corporate performance.
In testing the stated hypothesis (Hypothesis 2), another regression analysis was carried out to find out the effect of credit risk on corporate profitability with liquidity ratio, management efficiency ratio, net interest margin, bank size, short term borrowing and the slope of the yield curve being controlled variables. The result of the regression analysis is shown in Table 5 using the return on asset as the dependent variable, a proxy measure of performance.
The model estimate fits the data well as the F statistic, which measures the common importance of the explanatory variables, showed that, the null hypothesis of equality between the co-efficient of the predictor variables is rejected at 1% level of significance. The adjusted R-square also showed that, the predictors well explained 78.3% of the variations in the corporate profitability which is an indication that, profitability of Ghanaian banks are determined by the selected predictor variables.
There appears to be an inverse relationship between credit risk and corporate performance. This is indicated by a negative regression coefficient between Loan and Advance loss provision, the instrumental variable and return on asset, a measure of bank profitability. This relationship tends to be statistically significant at 1% indicating that, as bank increases it exposure to credit risk, it tends to have a negative impact on the
performance of the company in terms of profitability. This confirms the findings of Ebrahim et al. (2016), Athanasoglou et al. (2005) and Athanasoglou et al. (2008) who concluded that serious banking problems have arisen from the failure of financial institutions to recognize impaired assets and create reserves for writing off these assets. They concluded that, banks with high credit risk tend to experience a lower profit level on their income statement. In the Ghanaian context, banks provide higher volume of lending thereby holding lesser liquid assets on their statement of financial position tend to have higher volatility in their earnings which pose the threat of lower interest income due to high level of non-collectability resulting in lower return on assets. Consequently, this arises due to the higher interest charged on such loans (due to the incorporation risk premiums in determining interest rates) thereby, increasing the obligation on the customer which increase the risk of non-payment hence loss of interest income.
Leverage ratio, measured by total equity in the total assets of the bank (LR), positively relates to the performance of banks in Ghana and is statistically significant at 1%. This implies that, as firm increases its capital base through equity, the firm tends to generate much profit since it escapes the payment of interest to debt providers. This finding is consistent with the work of Kosmidou (2008), who concluded that, a well-capitalised banks face lower risks of solvency as cost of funding is reduce to the minimum. According to Berger et al., (1995), a financial institution with a strong capital structure is essential for the development of developing economies such as Ghana; for this offer extra financial strength deals with financial crises and provides assurance to depositors during turbulent macroeconomic conditions.
On assessing the role of management efficiency in determining corporate profitability, Management Efficiency Ratio (MER) was used. This showed an inverse

relationship with profitability at 10% significant level. The result implies that, increase in management operational expenses (a measure of management efficiency) reduces corporate profit. Thus, management must strive to achieve efficiency in their expense management if it wishes to increase their profit levels. This is in line with the findings from studies undertaken by Athanasoglou et al. (2005), Pasiouras and Kosmidou (2007) and Kosmidou (2008) who also concluded a significant positive relationship existed between management efficiency in expense management and corporate profitability. This result therefore requires banks to improve their managerial practices in order to maximize profit.
In assessing whether the size of a bank (SIZE) plays a role in the profitability of the bank, the result indicated that, bank size, measured by the natural logarithm of a bank's total assets showed a positively relationship with bank profitability (ROA) but was not statistically significant. This implies that, the size of bank does not determine whether a bank would be profitable or not. This result tends to contrast the theory of economies of scale as confirmed by Athanasoglou et al., (2006), Pasiouras and Kosmidou (2007) where banks benefit from increasing returns to scale arising from corporate expansion.
The slope of the yield curve also depicted a positive significant relationship with the bank’s profitability at 5% significance level indicating that, as the government of Ghana increases the rate of interest on it corporate bonds and other financial instruments, banks tend to take advantage of an invest in such instruments, thereby increasing the profit level. CONCLUSION AND RECOMMENDATION From the result of the study, conclusion was arrived on the basis that, though there may be other factors that affect the credit risk of banks in Ghana, capital adequacy, management operational efficiency, management of liquidity risk and the size of the bank, annualised changes in inflation and changes in GDP are major determinants of credit risk due to their high statistical significance level of association with credit risk.
Also the profitability of banks is greatly affected by credit risk, capital adequacy, management efficiency and the slope of the yield curve. Banks with high exposure to credit risk inversely affect the profits generating ability of the bank resulting from high risk of non-payment of loan and hence loss in interest income.
On the basis of the results obtained and the conclusions arrived at, the study makes the following recommendations: Considering the identified determinants of bank credit risk, combined with the how credit risk impacts bank
Oduro et al. 13 profitability, an efficient operational expense management of banks would not only increase the profit margin of these banks but also reduce the tendency of threat on the survival of these banks. This is due to the significant relationship between management expense ratio and credit risk and also with profitability.
Again, the study results confirmed that there exists a significant inverse relationship between the credit risk of commercial banks in Ghana and their profitability. Management should therefore adopt strategies to reduce their credit risk exposure to ensure increase in profitability. Some strategies would include the use of collaterals as security of granting loans should be further reviewed to reduce further incidence of bad debts, credit risk managers and lending officers should adhere strictly to good lending practice; they should know the purpose of the loan and ensure the feasibility of every loan proposed.
Also, with capital adequacy having significant relationship with credit risk provides an indication that, banks should be well capitalised in terms of equity capital so as to be able to withstand the likely shocks that are associated with credit default. CONFLICT OF INTERESTS The authors declare that they have no conflict of interest.
REFERENCES Acharya, Viral V, Nada M (2013). A Crisis of Banks as Liquidity
Providers, Working Paper. Altman EI, Saunders A (1998). Credit risk measurement: developments
over the last 20 years, Journal of Banking and Finance 21(11):1721-1742.
Apanga M, Appiah K, Arthur J (2016). Credit risk management of Ghanaian listed banks. Internation Journal of Law and Management 58(2):162-178.
Ara H, Bakaeva M, Sun J (2009), Credit risk and profitability in commercial banks in Sweden. University of Gothenburg.
Asari F, Muhamad NA, Ahmed W, Latif N, Abdullah N, Jusoff K (2011). An analysis of non-performing loan, interest rate and inflation rate using Stata software. World Applied Sciences Journal 12:41-48.
Ashby S (2011). Picking up the pieces: Risk management in a post crises world. London Financial Services Knowledge Transfer Network.
Aspachs O, Erlend N, Muriel T (2005), Liquidity, Banking regulation and macro-economy, Mimeo: London School of Economics.
Athanasoglou PP, Brissimis SN, Delis MD (2005). Bank-Specific, Industry-Specific and Macroeconomic Determinants of Bank Profitability. Bank of Greece Working Paper, No. 25.
Athanasoglou PP, Brissimis SN, Delis MD (2008). Bank-Specific, Industry-Specific and Macroeconomic Determinants of Bank Profitability. Journal of International Financial Markets, Institutions and Money 18 (2):121-136.
Bank of Ghana (2017). Liquidation of five indigenous banks into consolidated bank. Bank of Ghana public notice. www.bog.gov.gh
Balogun ED, Alimi A (1990). Loan delinquency among small farmers in developing countries: A case study of the small-farmers credit programme in Lagos State, Nigeria. Economic and Financial Review 26(3):36-44.
Basel Committee (1999). Principles for the management of credit risk.

14 J. Econ. Int. Finance
Basel Committee on banking supervision. Berger A, Herring R, Szegö G (1995). The role of capital in financial
institutions. Journal of Banking and Finance. pp. 393-430. Berger AN, De Young R (1997). Effects of Geographic Expansion on
Bank Efficiency. Journal of Financial Services Research 19:163-184. Bloem MA, Gorter NC (2001). Treatment of Non-Performing Loans in
Macroeconomic Statistics. IMF Working Paper, WP/01/209. Bunda I, Alexopoulou I, Ferranda A (2010). Determinants of
government bond spreads in new EU countries. Eastern European Economics 48(5):5-37.
Ebrahim A, Khalil A, Mohamed K, Xiangpei H (2016). A Study of Credit Risk and Commercial Banks’ Performance in Yemen: Panel Evidence. Journal of Management Policies and Practices 4(1):57-69.
Fatemi A, Fooladi I (2006). Credit risk management: a survey of practices, Managerial Finance 32(3):227-233.
Field A (2009). Discovering Statistics using SPSS, 3rd ed., Sage Publications Ltd, London.
Fofack H (2005). Non-Performing Loans in Sub-Saharan Africa: Causal Analysis and Macroeconomic Implications. World Bank Policy Research Working Paper, No. WP 3769.
Flaherty JC, Gourgey G, Natarajan S (2013). Five lessons learned: risk management after the crisis, The European Financial review.
Gaffney M (2009). Money, Credit and Crisis. American Journal of Economics and Sociology 68(4):983-1038.
Garderner EPM (2007), Risk management: a new risk management tools for banks. Bradford: Emerald Publishing Group
Gaur AS, Gaur SS (2009). Statistical Methods for Practice and Research: A Guide to Data Analysis using SPSS, 2nd ed., Sage Publications Ltd, London.
Goldstein M, Turner P (1996). Banking Crises in Emerging Economics: Origins and Policy Options. BIS Economic Paper 46.
Hair JF, Black WC, Babi BJ, Anderson RE (2014). Multivariate Data Analysis: A Global Perspective, 7th ed., Pearson, London.
Hasan I, Liu L, Zhang G (2014). The determinant of global bank credit-default-swap spreads. Bank of Finland, Research Discussion Paper No. 33/2014
Imbierowicz B, Rauch C (2014). The relationship between liquidity risk and credit risk in banks. Journal of Banking & Finance 40:242-256.
Inci O, Podpiera J (2010). The fundamental determinants of credit default risk for European large complex financial institutions. IMF Working Papers, Vol.10, pp. 1-31, 2010. Available at SSRN: https://ssrn.com/abstract=1750682
Juta S, Ingrįda J (2009). An Assesment and Management of Credit Risk in Baltic States’ Banks. Journal of Business Management 2:93-100.
Kargi HS (2011). Credit Risk and the Performance of Nigerian Banks. AhmaduBello University, Zaria.
Kithinji AM (2010). Credit Risk Management and Profitability of Commercial Banks in Kenya. School of Business, University of Nairobi, Nairobi.
Lucchetta M (2007). What do data say about monetary policy, bank
liquidity and bank risk taking? Economic Notes by Banca Monte dei Paschi di Siena SpA 36(2):189-203.
Marchettini D, Macagni M, Maino R (2015). Evolving banking trends in Sub Saharan Africa, key features and challenge. IMF series.
Odonkor TA, Osei KA, Abor J, Adjasi CKD (2011). Bank risk and performance in Ghana. Internation Journal of Financial Services Management 5(2):107-120.
Pasiouras F, Kosmidou K (2007). Factors Influencing the Profitability of Domestic and Foreign Commercial Banks in the European Union. Research in International Business and Finance 21(2):222-237.
Rampini AA, Sufi A, Viswanathan S (2014). Dynamic Risk management. Journal of Financial Economics 111:271-296.
Rauch A, Wiklund J, Frese M, Lumpkin GT (2009). Bank Orientation and Business performance An Assessment of Past Research and Suggestions for the Future. Entrepreneurship Theory and Practice pp. 761-786.
Ribeiro M (2006). Credit Prudential Framework for Banks. Paper presented at the National Banking College, Accra, Ghana.
Sakyi PA, Ofoeda I, Kyereboah-Coleman A, Abor JY (2014) Risk and performance of non-bank financial institutions. International Journal of Financial Services management 7(1):19-35.
Samsudin S, Lou W, Bhatti I, Misman FN (2015)., Islamic banks credit risk: a panel study. Procedia Economics and Finance 31:75-82.
Saunders A, Cornett MM (2007). Financial Markets and Institutions; an Introduction to the Risk Management Approach, New Jersey, McGraw Hill.
Shah KA (1996). Why Capital Adequacy Regulation for Banks? Journal of Financial Regulation and Compliance 4(3):278-291.
Shen CH, Chen YK, Kao LF, Yeh CY (2009). Bank liquidity risk and performance. http://www.finance.nsysu.edu.tw/SFM/17thSFM/program/fullpaper/083-231345511.pdf
Sinkey JC (1992). Commercial bank Financial Management, New York: Macmillan Publishing Company.
Weber O, Scholz RW, Michalik G (2010). Incorporating sustainability criteria into credit risk management. Business Strategy and the Environment 19:39-50.