Really Managing Corporate Credit Risk You Can’t Afford to Wait
49
Really Managing Corporate Credit Risk – You Can’t Afford to Wait Phil Burch, CTP Vice President and CFO Nichols Brothers, Inc. 918.398.2715 [email protected] George Garner President CreditPoint Software 918.639.4205 [email protected]
Transcript of Really Managing Corporate Credit Risk You Can’t Afford to Wait

Really Managing Corporate Credit Risk – You Can’t Afford to Wait
Phil Burch, CTP
Vice President and CFO
Nichols Brothers, Inc.
918.398.2715
George Garner
President
CreditPoint Software
918.639.4205


Industry Statistics on Write-offs
• How Big is the Problem?
• # of Fortune 1000 Companies with
DSO>90 Days
• Bad Debt Expense
• Largest Uninsured loss is from Trade
Receivables

Lower Perceived Financial
Rating
Deteriorates Key
Financial Ratios
Management Time
Income
Interest Expense
Borrowing
Financial Effect of Credit Losses
Uses Cash
Increase in
Working Capital
Negative impact on Stock and Shareholder Value
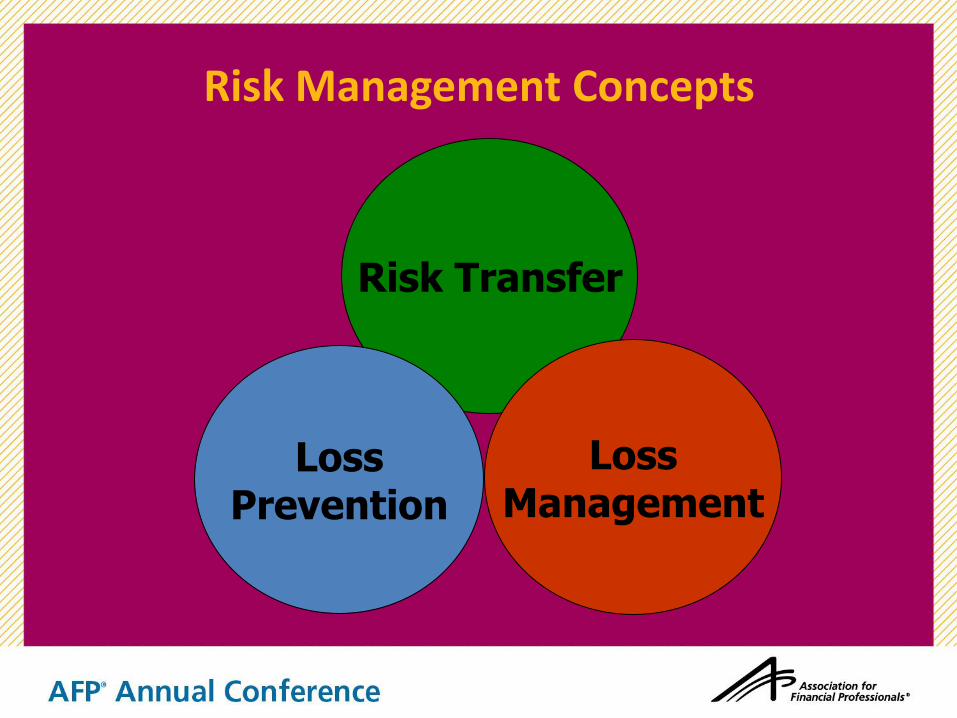
Risk Management Concepts
Risk Transfer
Loss Management
Loss Prevention

Unmanaged Credit Risk
Risk Transfer
Credit Losses Credit Loss
Prevention
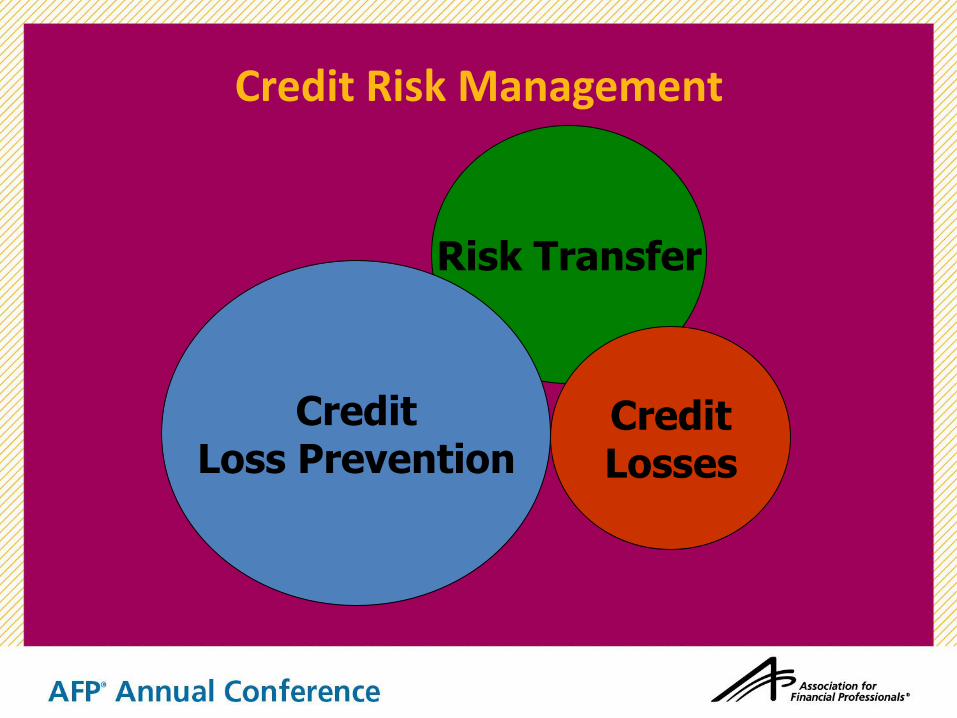
Credit Risk Management
Risk Transfer
Credit Losses
Credit Loss Prevention

Credit Policy
Credit Loss Prevention
Credit Scoring
Invoice Process
Measuring
Reporting
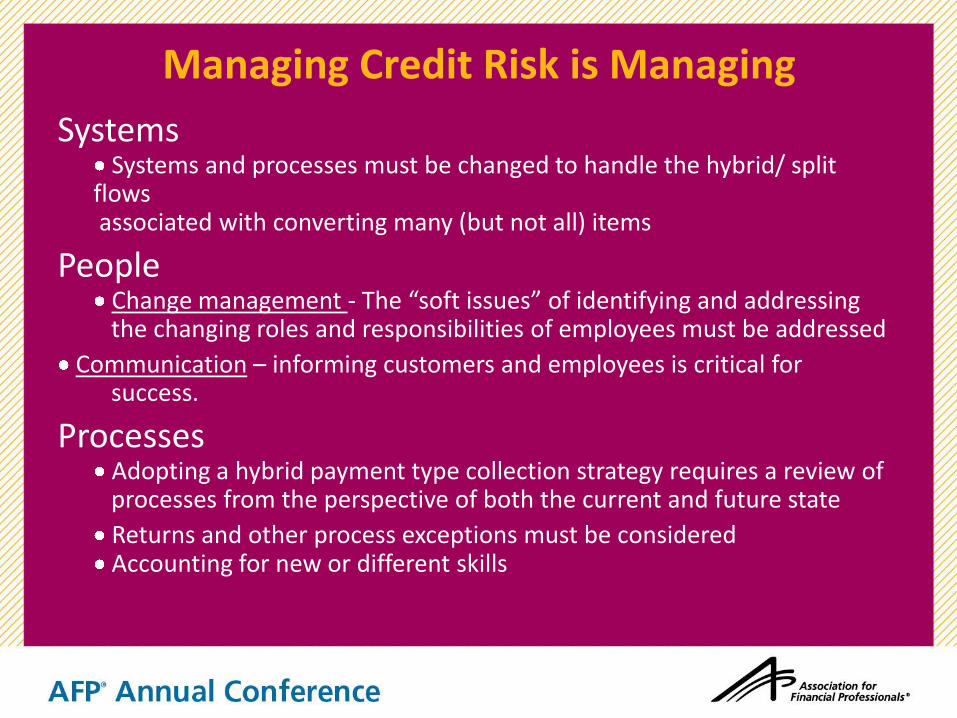
Managing Credit Risk is Managing
Systems Systems and processes must be changed to handle the hybrid/ split
flows associated with converting many (but not all) items
People Change management - The “soft issues” of identifying and addressing
the changing roles and responsibilities of employees must be addressed
Communication – informing customers and employees is critical for success.
Processes Adopting a hybrid payment type collection strategy requires a review of
processes from the perspective of both the current and future state
Returns and other process exceptions must be considered Accounting for new or different skills

HIGH OIL OR GAS PRICES HIGH CUSTOMER CASH FLOW AGGRESSIVE SPENDING $1,000,000 CREDIT LOSS = $3,000,000 REPLACEMENT REVENUE
$20 MM
$3 MM
$30
$20
$10
MARGIN 5 % 33 %
TIGHT POLICY FLEXIBLE POLICY
LOW OIL OR GAS PRICES LOW CUSTOMER CASH FLOW UNCERTANITY $1,000,000 CREDIT LOSS = $20,000,000 REPLACEMENT REVENUE

Term and Conditions
Credit Risk Transfer
Collateral
Credit Insurance

Collection Policy
Credit Loss Management
Collection Process
Measuring
Reporting

Proactive and Systematic
Mitigated Risk
Data Aggregation, Accessibility
Workflow Automation, Productivity
Standardized, Streamlined
Process

CASE STUDY #1

The Reason We’re Here…
To Standardize the Collections Process
Reduce working capital allocation charge Improve cash flow Improve DSO

Current Challenge Business Impact
Inconsistency in collectors’ follow ups: tracking short/slow pays, promises, & disputes
Year-over-year, DSO is slow to improve
Account resolution moves slowly (some accounts are over one year old)
Lack of accountability and visibility into collectors’ activities
Repeat offender accounts disproportionately affecting bad debt reserves
Inconsistency in approach between collectors, managers & regions
No formalized process to maximize efforts in collecting dollars (especially during quarter-end and year-end)
Specific Challenges
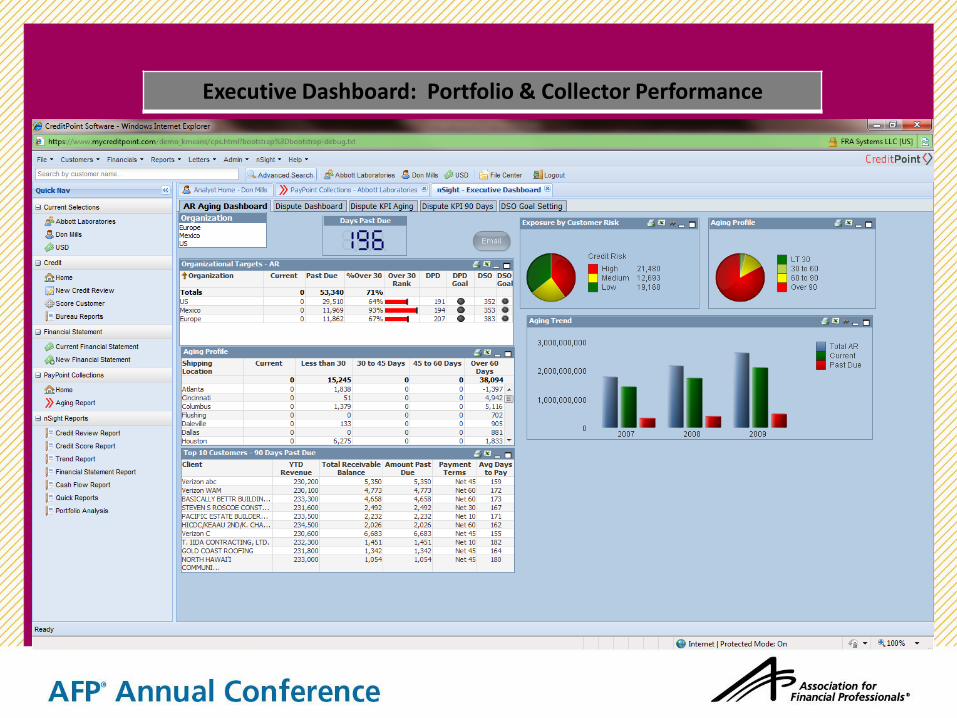
Executive Dashboard: Portfolio & Collector Performance
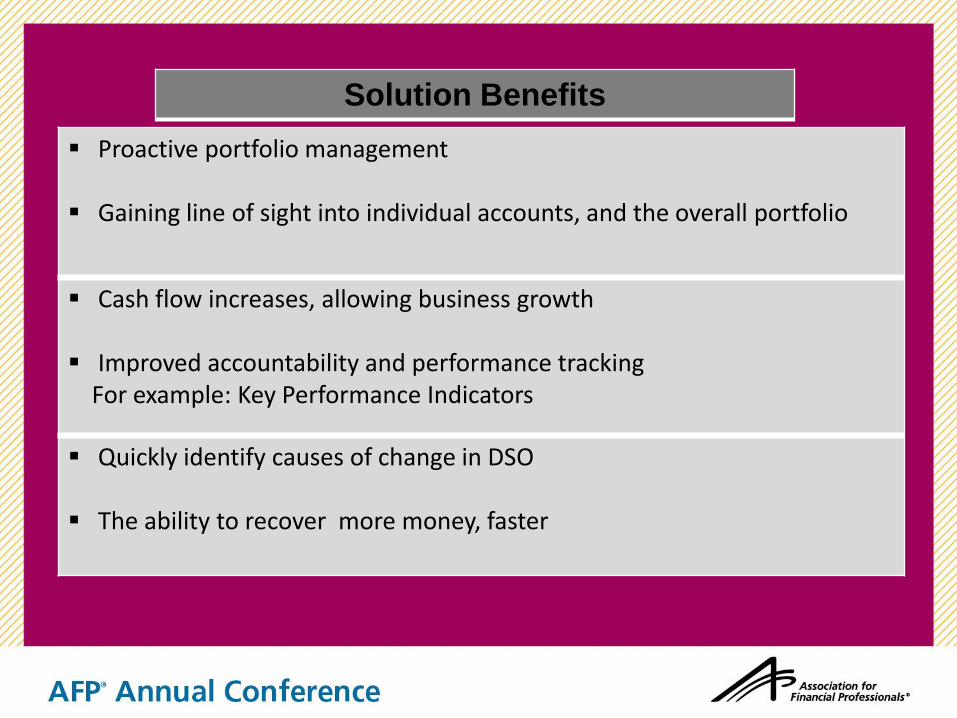
Proactive portfolio management
Gaining line of sight into individual accounts, and the overall portfolio
Cash flow increases, allowing business growth
Improved accountability and performance tracking For example: Key Performance Indicators
Quickly identify causes of change in DSO
The ability to recover more money, faster
Solution Benefits
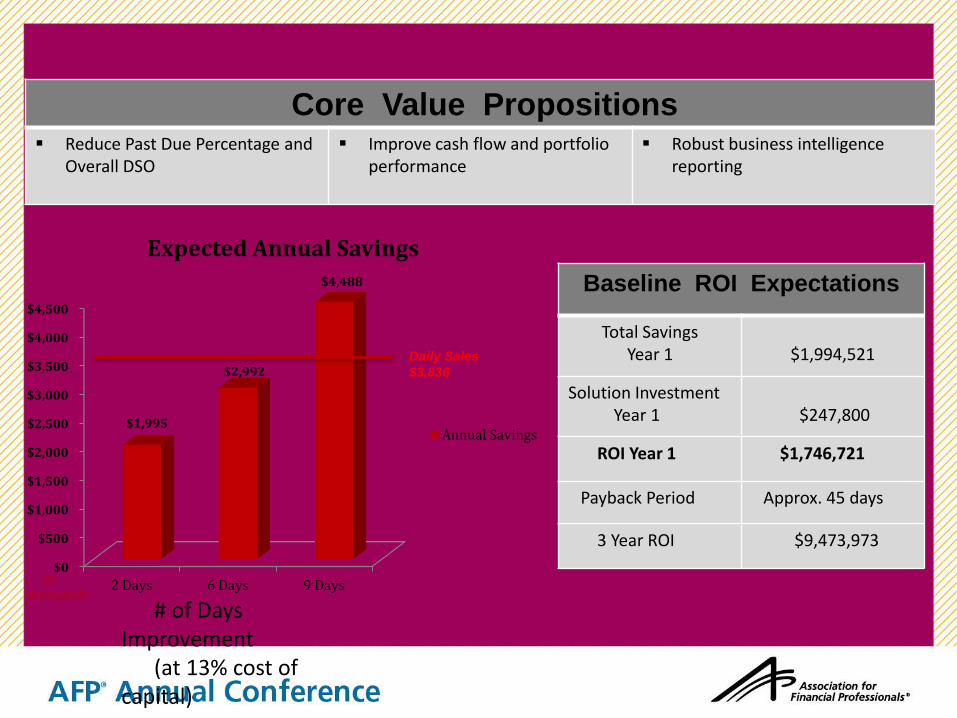
Core Value Propositions Reduce Past Due Percentage and
Overall DSO Improve cash flow and portfolio
performance
Robust business intelligence reporting
Baseline ROI Expectations
Total Savings Year 1
$1,994,521
Solution Investment Year 1
$247,800
ROI Year 1 $1,746,721
Payback Period Approx. 45 days
3 Year ROI $9,473,973
$0
$500
$1,000
$1,500
$2,000
$2,500
$3,000
$3,500
$4,000
$4,500
2 Days 6 Days 9 Days
$1,995
$2,992
$4,488
Expected Annual Savings
Annual Savings
in thousands
Daily Sales
$3,836
# of Days Improvement (at 13% cost of capital)
CASE STUDY #2

A Global Success Story Transforming Credit Risk
Management
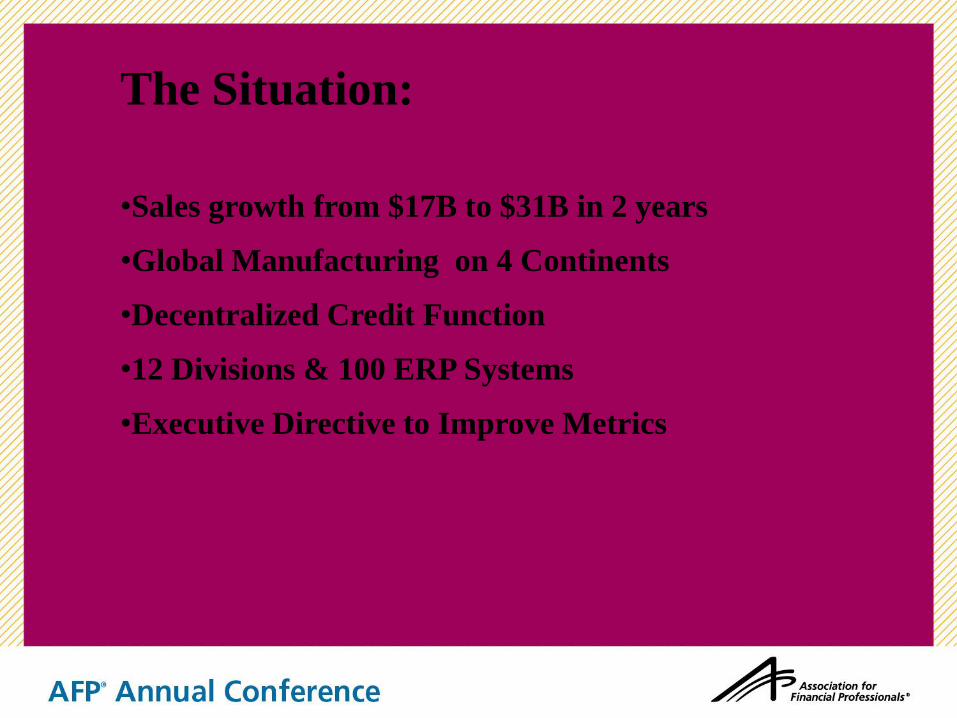
The Situation:
•Sales growth from $17B to $31B in 2 years
•Global Manufacturing on 4 Continents
•Decentralized Credit Function
•12 Divisions & 100 ERP Systems
•Executive Directive to Improve Metrics

Major Benefits of Project:
•Establish Global Shared Services Center
•Reduce staffing costs by 85%
•Total Project Savings of $10 Million
•Annual Department Reduction of $2M
•50% Reduction in Credit Decision Time
•30% Gain in Customer Credit Tracking
•Ability to quantify/segment portfolio risk
•Ability to obtain total customer exposure
•Enhanced Risk Analysis Modeling

CASE STUDY #3
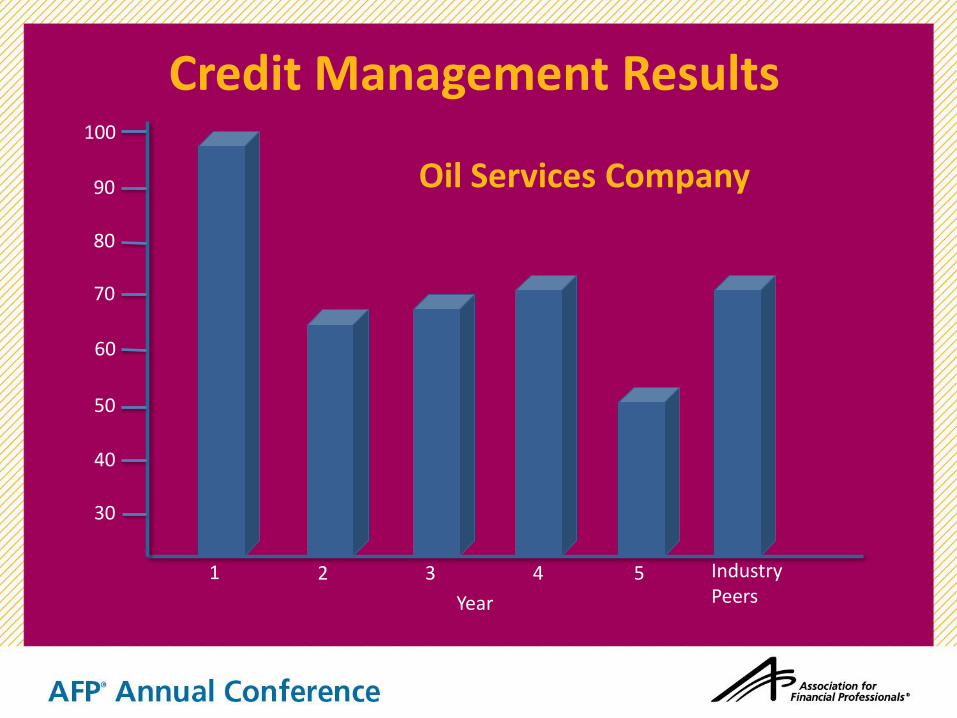
Credit Management Results
Year
80
2 3 5 Industry Peers
4
100
90
60
70
1
50
40
30
Oil Services Company

1
SAMPLE
Accounts Receivable Analysis
2
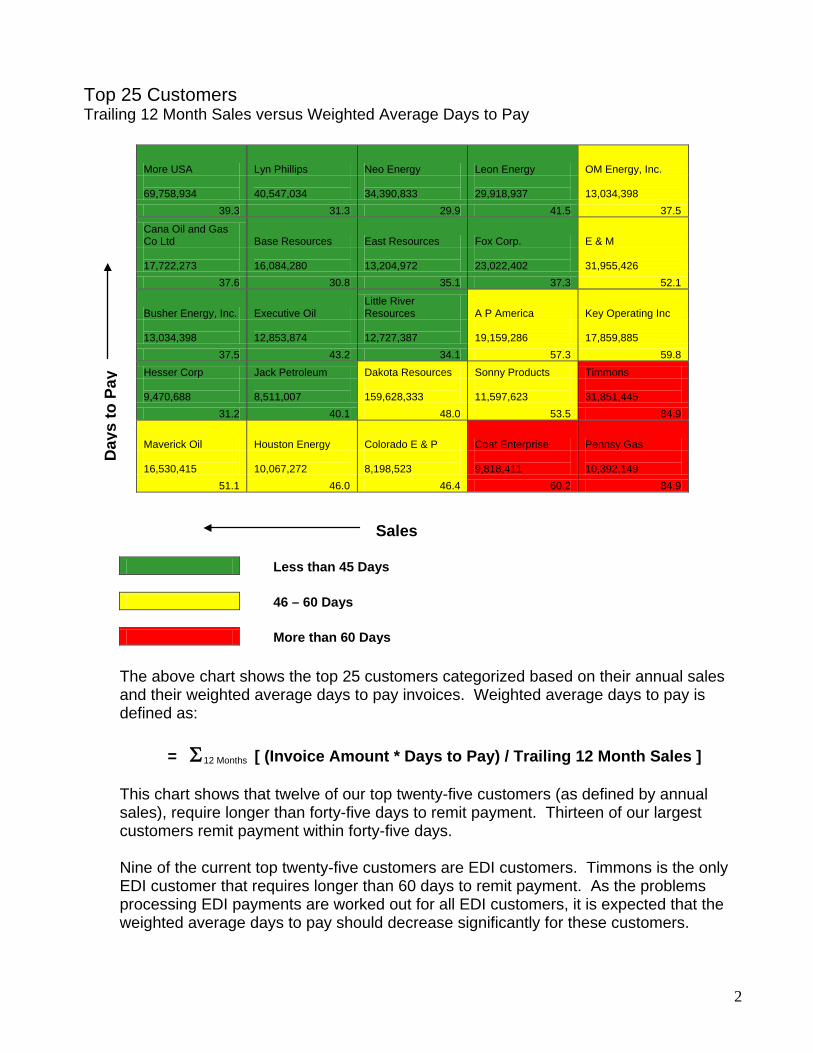
Top 25 Customers Trailing 12 Month Sales versus Weighted Average Days to Pay
More USA Lyn Phillips Neo Energy Leon Energy OM Energy, Inc. 69,758,934
40,547,034
34,390,833
29,918,937
13,034,398
39.3 31.3 29.9 41.5 37.5
Cana Oil and Gas Co Ltd Base Resources East Resources Fox Corp. E & M 17,722,273
16,084,280
13,204,972
23,022,402
31,955,426
37.6 30.8 35.1 37.3 52.1
Busher Energy, Inc. Executive Oil Little River Resources A P America Key Operating Inc
13,034,398
12,853,874
12,727,387
19,159,286
17,859,885
37.5 43.2 34.1 57.3 59.8 Hesser Corp Jack Petroleum Dakota Resources Sonny Products Timmons 9,470,688
8,511,007
159,628,333
11,597,623
31,851,445
31.2 40.1 48.0 53.5 84.9
Maverick Oil Houston Energy Colorado E & P Coat Enterprise Pennsy Gas 16,530,415
10,067,272
8,198,523
9,818,411
10,392,149
51.1 46.0 46.4 60.2 84.9
Less than 45 Days 46 – 60 Days More than 60 Days
The above chart shows the top 25 customers categorized based on their annual sales and their weighted average days to pay invoices. Weighted average days to pay is defined as: = Σ12 Months [ (Invoice Amount * Days to Pay) / Trailing 12 Month Sales ] This chart shows that twelve of our top twenty-five customers (as defined by annual sales), require longer than forty-five days to remit payment. Thirteen of our largest customers remit payment within forty-five days. Nine of the current top twenty-five customers are EDI customers. Timmons is the only EDI customer that requires longer than 60 days to remit payment. As the problems processing EDI payments are worked out for all EDI customers, it is expected that the weighted average days to pay should decrease significantly for these customers.
Sales
Day
s to
Pay

3
Accounts Receivable
0.00%10.00%20.00%30.00%40.00%50.00%60.00%70.00%
Feb-04Mar-04Apr-04May-04Jun-04Jul-04Aug-04Sep-04Oct-04Nov-04Dec-04
Current % Over 30 % Over 60 % Over 90
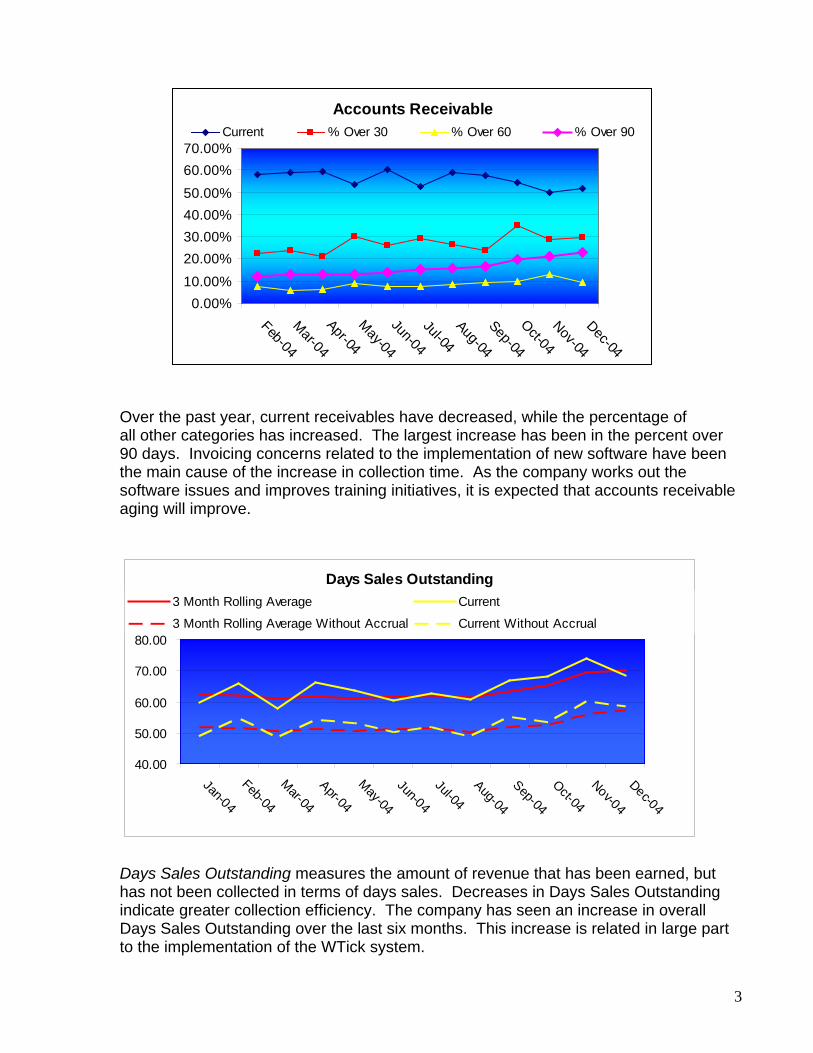
Over the past year, current receivables have decreased, while the percentage of
all other categories has increased. The largest increase has been in the percent over 90 days. Invoicing concerns related to the implementation of new software have been the main cause of the increase in collection time. As the company works out the software issues and improves training initiatives, it is expected that accounts receivable aging will improve.
Days Sales Outstanding
40.00
50.00
60.00
70.00
80.00
Jan-04
Feb-04
Mar-04
Apr-04
May-04
Jun-04
Jul-04Aug-04
Sep-04
Oct-04
Nov-04
Dec-04
3 Month Rolling Average Current
3 Month Rolling Average Without Accrual Current Without Accrual
Days Sales Outstanding measures the amount of revenue that has been earned, but has not been collected in terms of days sales. Decreases in Days Sales Outstanding indicate greater collection efficiency. The company has seen an increase in overall Days Sales Outstanding over the last six months. This increase is related in large part to the implementation of the WTick system.
4
Percent Accrued Revenue at Month End
0.00%
10.00%
20.00%
30.00%
40.00%
50.00%
60.00%
Jan-04
Feb-04
Mar-04
Apr-04
May-04
Jun-04
Jul-04Aug-04
Sep-04
Oct-04
Nov-04
Dec-04
Accrued Revenue Goal 19 %
Percent Billings Last 3 Days
0.00%5.00%
10.00%15.00%20.00%25.00%30.00%35.00%40.00%
Jan-04Feb-04Mar-04Apr-04May-04Jun-04Jul-04Aug-04Sep-04Oct-04Nov-04Dec-04
Billings Last 3 Days Goal 15%
Receipts Versus Billing
40,000,000
50,000,000
60,000,000
70,000,000
80,000,000
90,000,000
100,000,000
Jan-04
Feb-04
Mar-04
Apr-04
May-04
Jun-04
Jul-04Aug-04
Sep-04
Oct-04
Nov-04
Dec-04
Receipts Billing
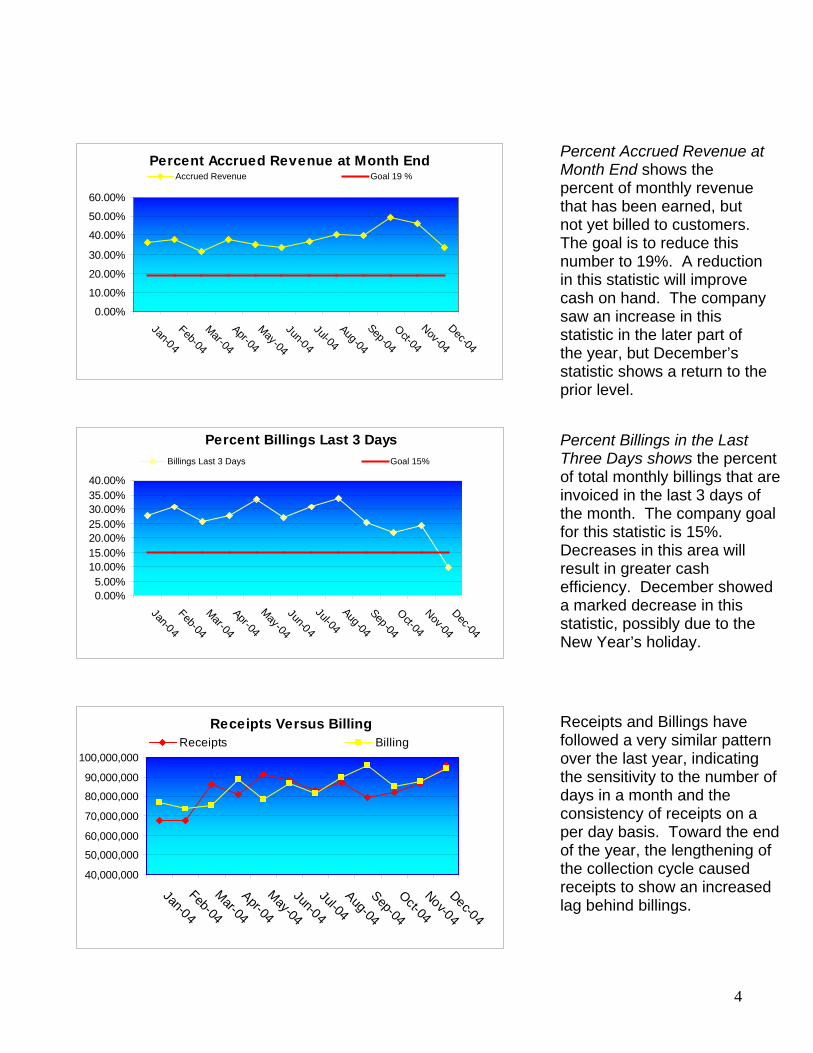
Percent Accrued Revenue at Month End shows the percent of monthly revenue that has been earned, but not yet billed to customers. The goal is to reduce this number to 19%. A reduction in this statistic will improve cash on hand. The company saw an increase in this statistic in the later part of the year, but December’s statistic shows a return to the prior level.
Percent Billings in the Last Three Days shows the percent of total monthly billings that are invoiced in the last 3 days of the month. The company goal for this statistic is 15%. Decreases in this area will result in greater cash efficiency. December showed a marked decrease in this statistic, possibly due to the New Year’s holiday.
Receipts and Billings have followed a very similar pattern over the last year, indicating the sensitivity to the number of days in a month and the consistency of receipts on a per day basis. Toward the end of the year, the lengthening of the collection cycle caused receipts to show an increased lag behind billings.

5
Chargebacks
-500,000
1,000,0001,500,0002,000,0002,500,0003,000,0003,500,000
Jan-04
Feb-04
Mar-04
Apr-04
May-04
Jun-04
Jul-04Aug-04
Sep-04
Oct-04
Nov-04
Dec-04
Dolla
rs
0200400600800100012001400
Invo
ices
Chargeback Amount # Chargebacks
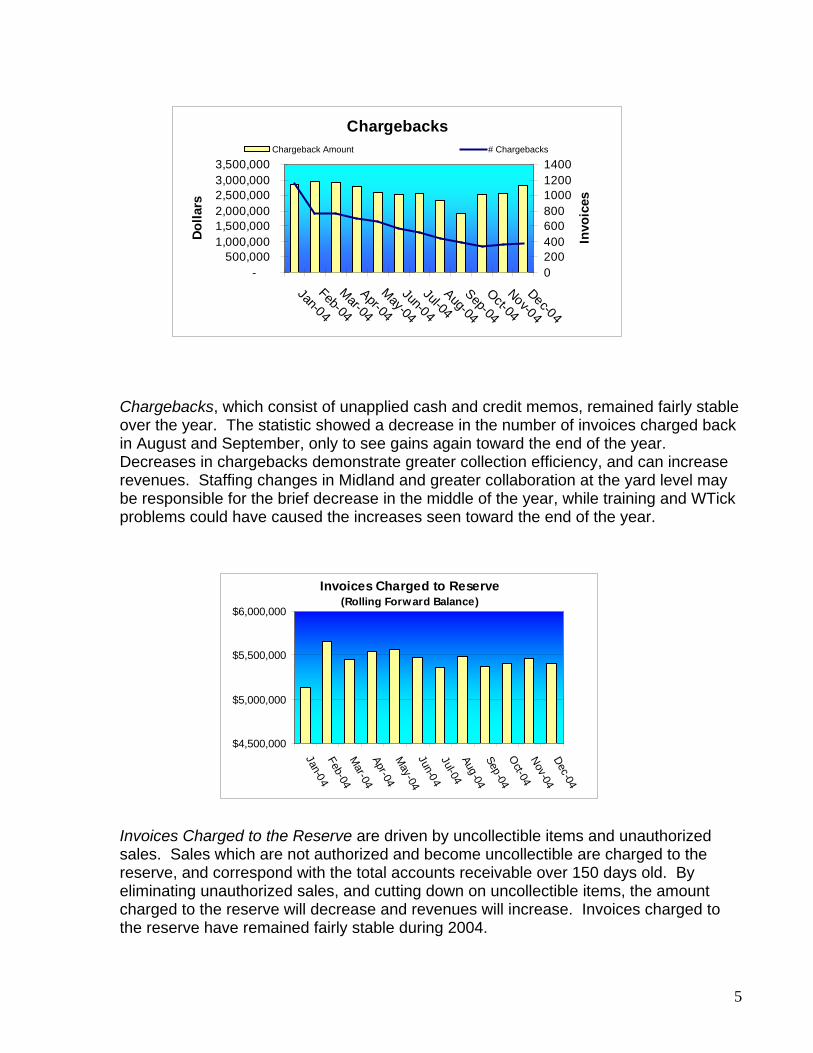
Chargebacks, which consist of unapplied cash and credit memos, remained fairly stable over the year. The statistic showed a decrease in the number of invoices charged back in August and September, only to see gains again toward the end of the year. Decreases in chargebacks demonstrate greater collection efficiency, and can increase revenues. Staffing changes in Midland and greater collaboration at the yard level may be responsible for the brief decrease in the middle of the year, while training and WTick problems could have caused the increases seen toward the end of the year.
Invoices Charged to Reserve(Rolling Forward Balance)
$4,500,000
$5,000,000
$5,500,000
$6,000,000
Jan-04Feb-04M
ar-04Apr-04M
ay-04Jun-04Jul-04Aug-04Sep-04O
ct-04Nov-04Dec-04
Invoices Charged to the Reserve are driven by uncollectible items and unauthorized sales. Sales which are not authorized and become uncollectible are charged to the reserve, and correspond with the total accounts receivable over 150 days old. By eliminating unauthorized sales, and cutting down on uncollectible items, the amount charged to the reserve will decrease and revenues will increase. Invoices charged to the reserve have remained fairly stable during 2004.

6
Problems Outstanding
-
500,000
1,000,000
1,500,000
2,000,000
2,500,000
3,000,000
Jan-04
Feb-04
Mar-04
Apr-04
May-04
Jun-04
Jul-04Aug-04
Sep-04
Oct-04
Nov-04
Dec-04
0
200
400
600
800
1000
1200Problem Amount Number of Problems
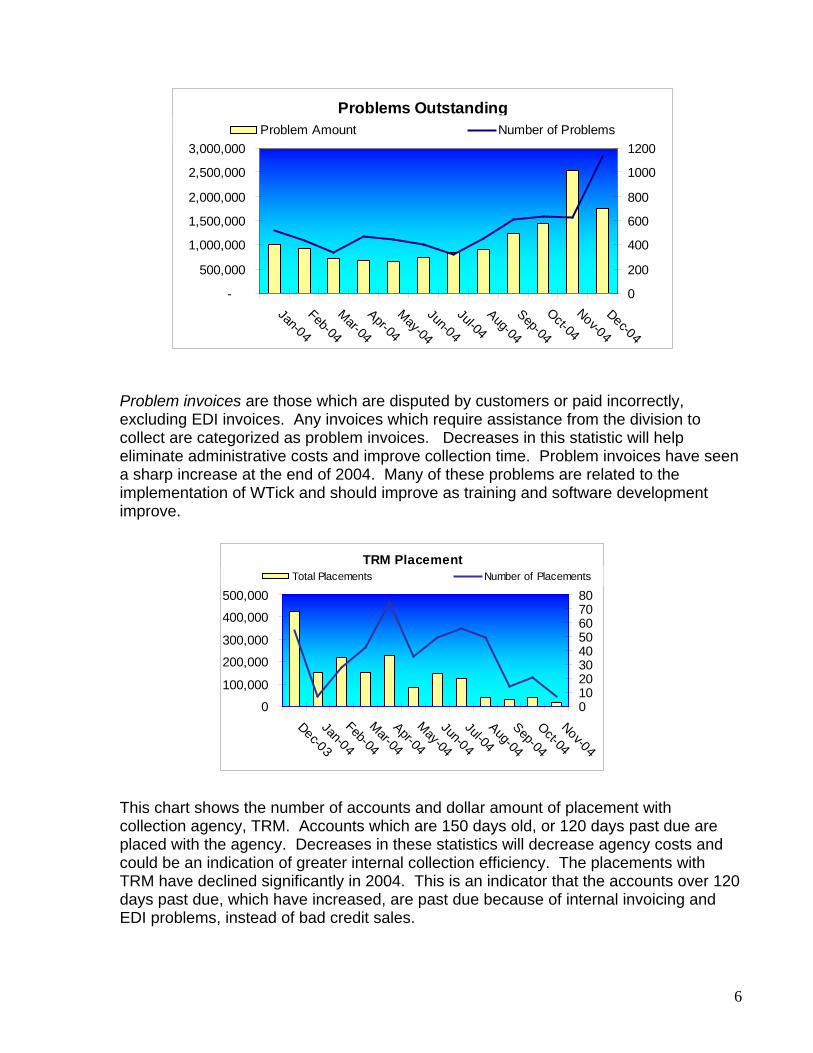
Problem invoices are those which are disputed by customers or paid incorrectly, excluding EDI invoices. Any invoices which require assistance from the division to collect are categorized as problem invoices. Decreases in this statistic will help eliminate administrative costs and improve collection time. Problem invoices have seen a sharp increase at the end of 2004. Many of these problems are related to the implementation of WTick and should improve as training and software development improve.
TRM Placement
0
100,000
200,000
300,000
400,000
500,000
Dec-03
Jan-04
Feb-04
Mar-04
Apr-04
May-04
Jun-04
Jul-04Aug-04
Sep-04
Oct-04
Nov-04
01020304050607080
Total Placements Number of Placements
This chart shows the number of accounts and dollar amount of placement with collection agency, TRM. Accounts which are 150 days old, or 120 days past due are placed with the agency. Decreases in these statistics will decrease agency costs and could be an indication of greater internal collection efficiency. The placements with TRM have declined significantly in 2004. This is an indicator that the accounts over 120 days past due, which have increased, are past due because of internal invoicing and EDI problems, instead of bad credit sales.

7
Auto Posting Hit Rate
64%
66%
68%
70%
72%
Jan-04
Feb-04
Mar-04
Apr-04
May-04
Jun-04
Jul-04Aug-04
Sep-04
Oct-04
Nov-04
Dec-04
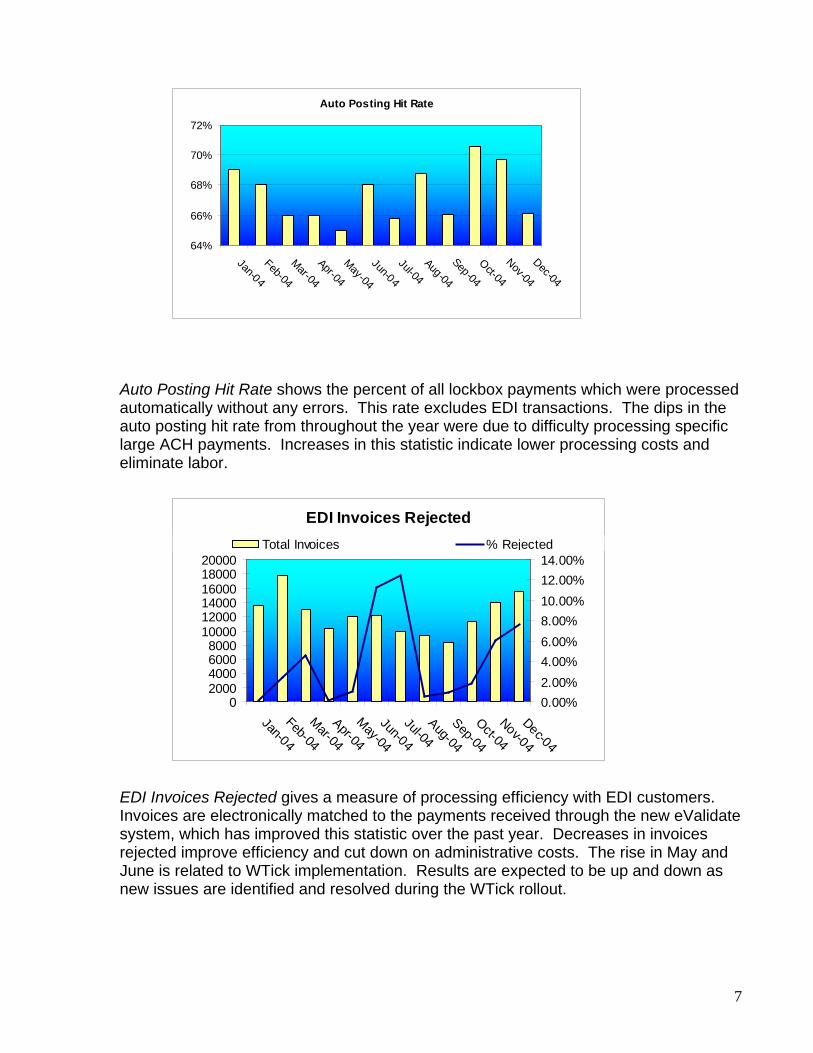
Auto Posting Hit Rate shows the percent of all lockbox payments which were processed automatically without any errors. This rate excludes EDI transactions. The dips in the auto posting hit rate from throughout the year were due to difficulty processing specific large ACH payments. Increases in this statistic indicate lower processing costs and eliminate labor.
EDI Invoices Rejected
02000400060008000
100001200014000160001800020000
Jan-04
Feb-04
Mar-04
Apr-04
May-04
Jun-04
Jul-04Aug-04
Sep-04
Oct-04
Nov-04
Dec-04
0.00%2.00%4.00%6.00%8.00%10.00%12.00%14.00%
Total Invoices % Rejected
EDI Invoices Rejected gives a measure of processing efficiency with EDI customers. Invoices are electronically matched to the payments received through the new eValidate system, which has improved this statistic over the past year. Decreases in invoices rejected improve efficiency and cut down on administrative costs. The rise in May and June is related to WTick implementation. Results are expected to be up and down as new issues are identified and resolved during the WTick rollout.
8
Unauthorized Sales
0
500,000
1,000,000
1,500,000
2,000,000
2,500,000
3,000,000
Jan-04
Feb-04
Mar-04
Apr-04
May-04
Jun-04
Jul-04Aug-04
Sep-04
Oct-04Nov-04
Dec-04
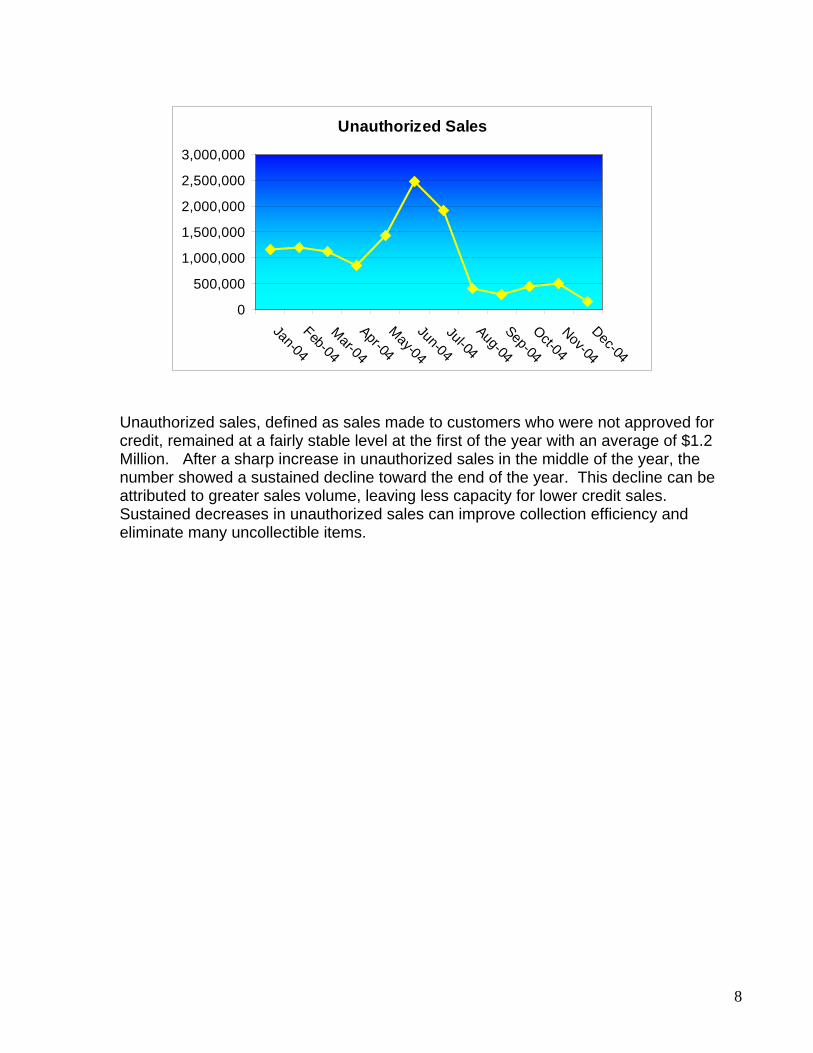
Unauthorized sales, defined as sales made to customers who were not approved for credit, remained at a fairly stable level at the first of the year with an average of $1.2 Million. After a sharp increase in unauthorized sales in the middle of the year, the number showed a sustained decline toward the end of the year. This decline can be attributed to greater sales volume, leaving less capacity for lower credit sales. Sustained decreases in unauthorized sales can improve collection efficiency and eliminate many uncollectible items.

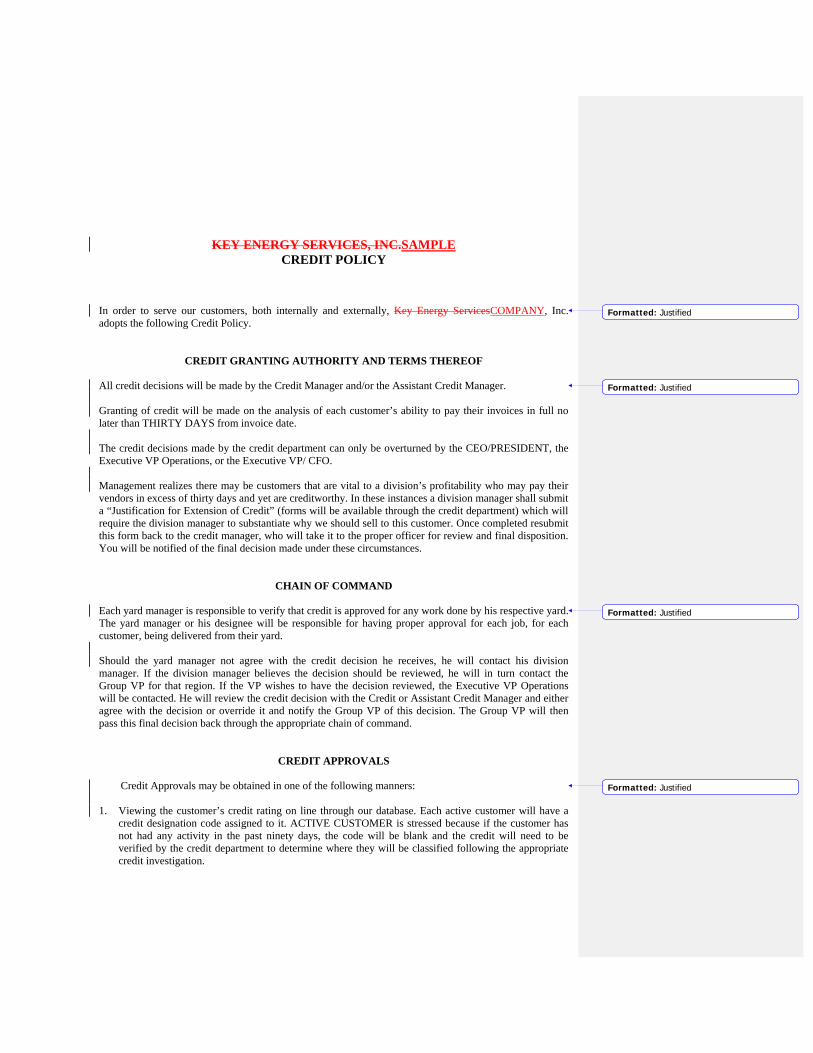
KEY ENERGY SERVICES, INC.SAMPLE CREDIT POLICY
In order to serve our customers, both internally and externally, Key Energy ServicesCOMPANY, Inc. adopts the following Credit Policy.
CREDIT GRANTING AUTHORITY AND TERMS THEREOF All credit decisions will be made by the Credit Manager and/or the Assistant Credit Manager. Granting of credit will be made on the analysis of each customer’s ability to pay their invoices in full no later than THIRTY DAYS from invoice date. The credit decisions made by the credit department can only be overturned by the CEO/PRESIDENT, the Executive VP Operations, or the Executive VP/ CFO. Management realizes there may be customers that are vital to a division’s profitability who may pay their vendors in excess of thirty days and yet are creditworthy. In these instances a division manager shall submit a “Justification for Extension of Credit” (forms will be available through the credit department) which will require the division manager to substantiate why we should sell to this customer. Once completed resubmit this form back to the credit manager, who will take it to the proper officer for review and final disposition. You will be notified of the final decision made under these circumstances.
CHAIN OF COMMAND Each yard manager is responsible to verify that credit is approved for any work done by his respective yard. The yard manager or his designee will be responsible for having proper approval for each job, for each customer, being delivered from their yard. Should the yard manager not agree with the credit decision he receives, he will contact his division manager. If the division manager believes the decision should be reviewed, he will in turn contact the Group VP for that region. If the VP wishes to have the decision reviewed, the Executive VP Operations will be contacted. He will review the credit decision with the Credit or Assistant Credit Manager and either agree with the decision or override it and notify the Group VP of this decision. The Group VP will then pass this final decision back through the appropriate chain of command.
CREDIT APPROVALS
Credit Approvals may be obtained in one of the following manners: 1. Viewing the customer’s credit rating on line through our database. Each active customer will have a
credit designation code assigned to it. ACTIVE CUSTOMER is stressed because if the customer has not had any activity in the past ninety days, the code will be blank and the credit will need to be verified by the credit department to determine where they will be classified following the appropriate credit investigation.
Formatted: Justified
Formatted: Justified
Formatted: Justified
Formatted: Justified
2. If the customer is not in our database or does not have a credit designation, the location with the potential sale shall immediately notify the credit department of the customer name, address, estimated amount of credit needed, and the date of commencement of the potential service. The credit department will always provide a response as rapidly as possible but may need to prioritize responses, especially during times of peak request, as to when the services will be rendered. The more “lead time” given, the more thorough the credit investigation.
The following is a listing of each credit classification with a brief description and what action, if any, a location needs to take. REQ – Unlimited credit line. No approval REQUIRED A SPECIFIED DOLLAR AMOUNT – If the service required is to be less than the amount listed for this customer, no further action is needed. However, if the service will or could exceed this dollar amount the credit department will need to be contacted to approve the requested sale. CONFR – Any sales to this customer, regardless of the dollar amount will need prior approval of the credit department. This code is also for customers who pay at the end of the job. THE EXCEPTION BEING ANY JOB BELOW ONE THOUSAND DOLLARS ($1,000.00) WILL NOT NEED AN APPROVAL NUMBER. CO. - CKCHEK – If the service is to be less than $10,000.00 a company check, prior to commencement of the services will be accepted and no further action is needed. If the service is to exceed $10,000.00 the credit department will need contacted for approval of the check. CASH– Certified funds via a cashier’s check or a wire transfer must be received prior to commencement of services. HOLD – Do not accept a job under any circumstances. RTSMSA-Refused to sign MSA. Do not accept a job under any circumstances. Any non-oilfield related entity (business or individual) which is not listed in our credit book, that requires immediate service, may have the services without prior credit approval, provided the job will be less than one thousand dollars ($1,000.00) and provided the yard has the customer complete a credit application and notifies the credit department of the sale. The information from the credit application and the manner in which we are paid will give us the necessary information to list them in our credit book for future sales. In all cases where credit department approval is required and such approval is given, a number will be assigned for the approval showing the customer name, the location and person requesting the approval, the amount of estimated credit required and the date requested. A space will be provided in the data entry screen for the number that was issued and the location is responsible for obtaining and placing this number in the space so designated. Failure by the location to obtain this number, prior to the service, will be considered an UNAUTHORIZED SALE.
INTEREST CHARGES & BAD DEBT RESERVE All invoices over 60 days old, from date of invoice, will carry an internal interest charge, expensed down to the yard level, at the prime rate plus 2% for authorized sales & prime rate plus 7% for unauthorized sales. Interest will accrue until such time as the invoice is paid or until it is reserved for bad debt. Prime will be the prime rate, as published in the Wall Street Journal, on the first business day of each quarter & will be reviewed & changed as necessary on the first business day of the next quarter. In addition, at 120 days past due, the invoice will be 100% reserved as bad debt expense charged to the yard. There are two exceptions to this as follows: All invoices to what are deemed as “Major Accounts” & all invoices to customers that upper management has signed off on “A Justification for Extension of Credit to Extended Pay Customers”. Invoices in either of these categories
will not be reserved for bad debt. Once an invoice is paid it will no longer be reserved as bad debt, but interest charged will never be reversed.

1
SAMPLE
Accounts Receivable Analysis

2
Top 25 Customers Trailing 12 Month Sales versus Weighted Average Days to Pay
More USA Lyn Phillips Neo Energy Leon Energy OM Energy, Inc. 69,758,934
40,547,034
34,390,833
29,918,937
13,034,398
39.3 31.3 29.9 41.5 37.5
Cana Oil and Gas Co Ltd Base Resources East Resources Fox Corp. E & M 17,722,273
16,084,280
13,204,972
23,022,402
31,955,426
37.6 30.8 35.1 37.3 52.1
Busher Energy, Inc. Executive Oil Little River Resources A P America Key Operating Inc
13,034,398
12,853,874
12,727,387
19,159,286
17,859,885
37.5 43.2 34.1 57.3 59.8 Hesser Corp Jack Petroleum Dakota Resources Sonny Products Timmons 9,470,688
8,511,007
159,628,333
11,597,623
31,851,445
31.2 40.1 48.0 53.5 84.9
Maverick Oil Houston Energy Colorado E & P Coat Enterprise Pennsy Gas 16,530,415
10,067,272
8,198,523
9,818,411
10,392,149
51.1 46.0 46.4 60.2 84.9
Less than 45 Days 46 – 60 Days More than 60 Days
The above chart shows the top 25 customers categorized based on their annual sales and their weighted average days to pay invoices. Weighted average days to pay is defined as: = Σ12 Months [ (Invoice Amount * Days to Pay) / Trailing 12 Month Sales ] This chart shows that twelve of our top twenty-five customers (as defined by annual sales), require longer than forty-five days to remit payment. Thirteen of our largest customers remit payment within forty-five days. Nine of the current top twenty-five customers are EDI customers. Timmons is the only EDI customer that requires longer than 60 days to remit payment. As the problems processing EDI payments are worked out for all EDI customers, it is expected that the weighted average days to pay should decrease significantly for these customers.
Sales
Day
s to
Pay
3
Accounts Receivable
0.00%10.00%20.00%30.00%40.00%50.00%60.00%70.00%
Feb-04Mar-04Apr-04May-04Jun-04Jul-04Aug-04Sep-04Oct-04Nov-04Dec-04
Current % Over 30 % Over 60 % Over 90
Over the past year, current receivables have decreased, while the percentage of
all other categories has increased. The largest increase has been in the percent over 90 days. Invoicing concerns related to the implementation of new software have been the main cause of the increase in collection time. As the company works out the software issues and improves training initiatives, it is expected that accounts receivable aging will improve.
Days Sales Outstanding
40.00
50.00
60.00
70.00
80.00
Jan-04
Feb-04
Mar-04
Apr-04
May-04
Jun-04
Jul-04Aug-04
Sep-04
Oct-04
Nov-04
Dec-04
3 Month Rolling Average Current
3 Month Rolling Average Without Accrual Current Without Accrual
Days Sales Outstanding measures the amount of revenue that has been earned, but has not been collected in terms of days sales. Decreases in Days Sales Outstanding indicate greater collection efficiency. The company has seen an increase in overall Days Sales Outstanding over the last six months. This increase is related in large part to the implementation of the WTick system.

4
Percent Accrued Revenue at Month End
0.00%
10.00%
20.00%
30.00%
40.00%
50.00%
60.00%
Jan-04
Feb-04
Mar-04
Apr-04
May-04
Jun-04
Jul-04Aug-04
Sep-04
Oct-04
Nov-04
Dec-04
Accrued Revenue Goal 19 %
Percent Billings Last 3 Days
0.00%5.00%
10.00%15.00%20.00%25.00%30.00%35.00%40.00%
Jan-04Feb-04Mar-04Apr-04May-04Jun-04Jul-04Aug-04Sep-04Oct-04Nov-04Dec-04
Billings Last 3 Days Goal 15%
Receipts Versus Billing
40,000,000
50,000,000
60,000,000
70,000,000
80,000,000
90,000,000
100,000,000
Jan-04
Feb-04
Mar-04
Apr-04
May-04
Jun-04
Jul-04Aug-04
Sep-04
Oct-04
Nov-04
Dec-04
Receipts Billing
Percent Accrued Revenue at Month End shows the percent of monthly revenue that has been earned, but not yet billed to customers. The goal is to reduce this number to 19%. A reduction in this statistic will improve cash on hand. The company saw an increase in this statistic in the later part of the year, but December’s statistic shows a return to the prior level.
Percent Billings in the Last Three Days shows the percent of total monthly billings that are invoiced in the last 3 days of the month. The company goal for this statistic is 15%. Decreases in this area will result in greater cash efficiency. December showed a marked decrease in this statistic, possibly due to the New Year’s holiday.
Receipts and Billings have followed a very similar pattern over the last year, indicating the sensitivity to the number of days in a month and the consistency of receipts on a per day basis. Toward the end of the year, the lengthening of the collection cycle caused receipts to show an increased lag behind billings.
5
Chargebacks
-500,000
1,000,0001,500,0002,000,0002,500,0003,000,0003,500,000
Jan-04
Feb-04
Mar-04
Apr-04
May-04
Jun-04
Jul-04Aug-04
Sep-04
Oct-04
Nov-04
Dec-04
Dolla
rs
0200400600800100012001400
Invo
ices
Chargeback Amount # Chargebacks
Chargebacks, which consist of unapplied cash and credit memos, remained fairly stable over the year. The statistic showed a decrease in the number of invoices charged back in August and September, only to see gains again toward the end of the year. Decreases in chargebacks demonstrate greater collection efficiency, and can increase revenues. Staffing changes in Midland and greater collaboration at the yard level may be responsible for the brief decrease in the middle of the year, while training and WTick problems could have caused the increases seen toward the end of the year.
Invoices Charged to Reserve(Rolling Forward Balance)
$4,500,000
$5,000,000
$5,500,000
$6,000,000
Jan-04Feb-04M
ar-04Apr-04M
ay-04Jun-04Jul-04Aug-04Sep-04O
ct-04Nov-04Dec-04
Invoices Charged to the Reserve are driven by uncollectible items and unauthorized sales. Sales which are not authorized and become uncollectible are charged to the reserve, and correspond with the total accounts receivable over 150 days old. By eliminating unauthorized sales, and cutting down on uncollectible items, the amount charged to the reserve will decrease and revenues will increase. Invoices charged to the reserve have remained fairly stable during 2004.
6
Problems Outstanding
-
500,000
1,000,000
1,500,000
2,000,000
2,500,000
3,000,000
Jan-04
Feb-04
Mar-04
Apr-04
May-04
Jun-04
Jul-04Aug-04
Sep-04
Oct-04
Nov-04
Dec-04
0
200
400
600
800
1000
1200Problem Amount Number of Problems
Problem invoices are those which are disputed by customers or paid incorrectly, excluding EDI invoices. Any invoices which require assistance from the division to collect are categorized as problem invoices. Decreases in this statistic will help eliminate administrative costs and improve collection time. Problem invoices have seen a sharp increase at the end of 2004. Many of these problems are related to the implementation of WTick and should improve as training and software development improve.
TRM Placement
0
100,000
200,000
300,000
400,000
500,000
Dec-03
Jan-04
Feb-04
Mar-04
Apr-04
May-04
Jun-04
Jul-04Aug-04
Sep-04
Oct-04
Nov-04
01020304050607080
Total Placements Number of Placements
This chart shows the number of accounts and dollar amount of placement with collection agency, TRM. Accounts which are 150 days old, or 120 days past due are placed with the agency. Decreases in these statistics will decrease agency costs and could be an indication of greater internal collection efficiency. The placements with TRM have declined significantly in 2004. This is an indicator that the accounts over 120 days past due, which have increased, are past due because of internal invoicing and EDI problems, instead of bad credit sales.
7
Auto Posting Hit Rate
64%
66%
68%
70%
72%
Jan-04
Feb-04
Mar-04
Apr-04
May-04
Jun-04
Jul-04Aug-04
Sep-04
Oct-04
Nov-04
Dec-04
Auto Posting Hit Rate shows the percent of all lockbox payments which were processed automatically without any errors. This rate excludes EDI transactions. The dips in the auto posting hit rate from throughout the year were due to difficulty processing specific large ACH payments. Increases in this statistic indicate lower processing costs and eliminate labor.
EDI Invoices Rejected
02000400060008000
100001200014000160001800020000
Jan-04
Feb-04
Mar-04
Apr-04
May-04
Jun-04
Jul-04Aug-04
Sep-04
Oct-04
Nov-04
Dec-04
0.00%2.00%4.00%6.00%8.00%10.00%12.00%14.00%
Total Invoices % Rejected
EDI Invoices Rejected gives a measure of processing efficiency with EDI customers. Invoices are electronically matched to the payments received through the new eValidate system, which has improved this statistic over the past year. Decreases in invoices rejected improve efficiency and cut down on administrative costs. The rise in May and June is related to WTick implementation. Results are expected to be up and down as new issues are identified and resolved during the WTick rollout.

8
Unauthorized Sales
0
500,000
1,000,000
1,500,000
2,000,000
2,500,000
3,000,000
Jan-04
Feb-04
Mar-04
Apr-04
May-04
Jun-04
Jul-04Aug-04
Sep-04
Oct-04Nov-04
Dec-04
Unauthorized sales, defined as sales made to customers who were not approved for credit, remained at a fairly stable level at the first of the year with an average of $1.2 Million. After a sharp increase in unauthorized sales in the middle of the year, the number showed a sustained decline toward the end of the year. This decline can be attributed to greater sales volume, leaving less capacity for lower credit sales. Sustained decreases in unauthorized sales can improve collection efficiency and eliminate many uncollectible items.
KEY ENERGY SERVICES, INC.SAMPLE CREDIT POLICY
In order to serve our customers, both internally and externally, Key Energy ServicesCOMPANY, Inc. adopts the following Credit Policy.
CREDIT GRANTING AUTHORITY AND TERMS THEREOF All credit decisions will be made by the Credit Manager and/or the Assistant Credit Manager. Granting of credit will be made on the analysis of each customer’s ability to pay their invoices in full no later than THIRTY DAYS from invoice date. The credit decisions made by the credit department can only be overturned by the CEO/PRESIDENT, the Executive VP Operations, or the Executive VP/ CFO. Management realizes there may be customers that are vital to a division’s profitability who may pay their vendors in excess of thirty days and yet are creditworthy. In these instances a division manager shall submit a “Justification for Extension of Credit” (forms will be available through the credit department) which will require the division manager to substantiate why we should sell to this customer. Once completed resubmit this form back to the credit manager, who will take it to the proper officer for review and final disposition. You will be notified of the final decision made under these circumstances.
CHAIN OF COMMAND Each yard manager is responsible to verify that credit is approved for any work done by his respective yard. The yard manager or his designee will be responsible for having proper approval for each job, for each customer, being delivered from their yard. Should the yard manager not agree with the credit decision he receives, he will contact his division manager. If the division manager believes the decision should be reviewed, he will in turn contact the Group VP for that region. If the VP wishes to have the decision reviewed, the Executive VP Operations will be contacted. He will review the credit decision with the Credit or Assistant Credit Manager and either agree with the decision or override it and notify the Group VP of this decision. The Group VP will then pass this final decision back through the appropriate chain of command.
CREDIT APPROVALS
Credit Approvals may be obtained in one of the following manners: 1. Viewing the customer’s credit rating on line through our database. Each active customer will have a
credit designation code assigned to it. ACTIVE CUSTOMER is stressed because if the customer has not had any activity in the past ninety days, the code will be blank and the credit will need to be verified by the credit department to determine where they will be classified following the appropriate credit investigation.
Formatted: Justified
Formatted: Justified
Formatted: Justified
Formatted: Justified

2. If the customer is not in our database or does not have a credit designation, the location with the potential sale shall immediately notify the credit department of the customer name, address, estimated amount of credit needed, and the date of commencement of the potential service. The credit department will always provide a response as rapidly as possible but may need to prioritize responses, especially during times of peak request, as to when the services will be rendered. The more “lead time” given, the more thorough the credit investigation.
The following is a listing of each credit classification with a brief description and what action, if any, a location needs to take. REQ – Unlimited credit line. No approval REQUIRED A SPECIFIED DOLLAR AMOUNT – If the service required is to be less than the amount listed for this customer, no further action is needed. However, if the service will or could exceed this dollar amount the credit department will need to be contacted to approve the requested sale. CONFR – Any sales to this customer, regardless of the dollar amount will need prior approval of the credit department. This code is also for customers who pay at the end of the job. THE EXCEPTION BEING ANY JOB BELOW ONE THOUSAND DOLLARS ($1,000.00) WILL NOT NEED AN APPROVAL NUMBER. CO. - CKCHEK – If the service is to be less than $10,000.00 a company check, prior to commencement of the services will be accepted and no further action is needed. If the service is to exceed $10,000.00 the credit department will need contacted for approval of the check. CASH– Certified funds via a cashier’s check or a wire transfer must be received prior to commencement of services. HOLD – Do not accept a job under any circumstances. RTSMSA-Refused to sign MSA. Do not accept a job under any circumstances. Any non-oilfield related entity (business or individual) which is not listed in our credit book, that requires immediate service, may have the services without prior credit approval, provided the job will be less than one thousand dollars ($1,000.00) and provided the yard has the customer complete a credit application and notifies the credit department of the sale. The information from the credit application and the manner in which we are paid will give us the necessary information to list them in our credit book for future sales. In all cases where credit department approval is required and such approval is given, a number will be assigned for the approval showing the customer name, the location and person requesting the approval, the amount of estimated credit required and the date requested. A space will be provided in the data entry screen for the number that was issued and the location is responsible for obtaining and placing this number in the space so designated. Failure by the location to obtain this number, prior to the service, will be considered an UNAUTHORIZED SALE.
INTEREST CHARGES & BAD DEBT RESERVE All invoices over 60 days old, from date of invoice, will carry an internal interest charge, expensed down to the yard level, at the prime rate plus 2% for authorized sales & prime rate plus 7% for unauthorized sales. Interest will accrue until such time as the invoice is paid or until it is reserved for bad debt. Prime will be the prime rate, as published in the Wall Street Journal, on the first business day of each quarter & will be reviewed & changed as necessary on the first business day of the next quarter. In addition, at 120 days past due, the invoice will be 100% reserved as bad debt expense charged to the yard. There are two exceptions to this as follows: All invoices to what are deemed as “Major Accounts” & all invoices to customers that upper management has signed off on “A Justification for Extension of Credit to Extended Pay Customers”. Invoices in either of these categories

will not be reserved for bad debt. Once an invoice is paid it will no longer be reserved as bad debt, but interest charged will never be reversed.


![Cloud Can’t Wait [Infographic]](https://static.fdocuments.in/doc/165x107/54c384594a79593a698b458a/cloud-cant-wait-infographic.jpg)


![Social Media Facts You Can’t Afford to Snub [Infographic]](https://static.fdocuments.in/doc/165x107/58cf8d811a28ab65538b480d/social-media-facts-you-cant-afford-to-snub-infographic.jpg)