Impact of CEO age on employees’ turnover: Evidence from ...
25
American Journal of Humanities and Social Science (AJHSS) Volume 11, 2021 56 Impact of CEO age on employees’ turnover: Evidence from Chinese Listed Companies ZHANG Chang-Zheng, HOU Rui-Zhi, ZHANG Xin-Yue School of Economics &Management, Xi’an University of Technology, China Abstract The paper addresses the research gap on the forming mechanism of employees’ turnover from the perspective of CEO age. Taking Chinese A-share listed companies during the period of 2011 to 2016 composing of 3296 observations as the research sample, empirical analysis has reached four valuable findings. First, CEO age, on the whole has an significant and positive impact on employees’ turnover rate; Second, there is a weaker positive link between CEO age and employees’ turnover rate in knowledge-intensive enterprises than that in labor-intensive enterprises; Third, independent directors play a positive moderating role in affecting the link between CEO age and employees’ turnover rate; Finally, female executives can restrain the employees’ turnover intention, while they cannot play any role in moderating the link between CEO age and employee’ turnover rate. Rich robustness tests and endogeneity tests have confirmed the validity of the main findings. Moreover, higher employees’ compensation level is strongly accompanied with higher employees’ turnover rate. Theoretical and practical implications are discussed in the end. Key words: CEO age, Female executives, Employees’ turnover rate, Upper echelons, employees’ compensation, Knowledge-intensive enterprises, labor-intensive enterprises 1. Introduction The whole population of the employees within an enterprise tends to be increasingly getting younger, and the competition for high talents among modern firms is getting more and fiercer. With the emergence of two facts, the turnover rate of employees is getting much higher. With the radical development of network information technology and the rapid diversification of interpersonal communication methods, the negative ripple effect of employees’ turnover has been magnified infinitely (Hesford et al., 2016; Wo ng, Y.-t. et al., 2015). In this case, it is more practical to address the mechanisms of employees’ turnover behavior. How to attract and retain excellent talents and further take effective measures to reduce their turnover rate, without doubt, has become a core topic of a top priority among various topics in human resource management within modern enterprises. At present, a flood of literature has examined the influencing factors of employees’ turnover behavior by adopting multiple research methods and various empirical samples. According to
Transcript of Impact of CEO age on employees’ turnover: Evidence from ...

American Journal of Humanities and Social Science (AJHSS) Volume 11, 2021
56
Impact of CEO age on employees’ turnover: Evidence from
Chinese Listed Companies
ZHANG Chang-Zheng, HOU Rui-Zhi, ZHANG Xin-Yue
School of Economics &Management, Xi’an University of Technology, China
Abstract
The paper addresses the research gap on the forming mechanism of employees’ turnover from
the perspective of CEO age. Taking Chinese A-share listed companies during the period of
2011 to 2016 composing of 3296 observations as the research sample, empirical analysis has
reached four valuable findings. First, CEO age, on the whole has an significant and positive
impact on employees’ turnover rate; Second, there is a weaker positive link between CEO age
and employees’ turnover rate in knowledge-intensive enterprises than that in labor-intensive
enterprises; Third, independent directors play a positive moderating role in affecting the link
between CEO age and employees’ turnover rate; Finally, female executives can restrain the
employees’ turnover intention, while they cannot play any role in moderating the link
between CEO age and employee’ turnover rate. Rich robustness tests and endogeneity tests
have confirmed the validity of the main findings. Moreover, higher employees’ compensation
level is strongly accompanied with higher employees’ turnover rate. Theoretical and practical
implications are discussed in the end.
Key words: CEO age, Female executives, Employees’ turnover rate, Upper echelons,
employees’ compensation, Knowledge-intensive enterprises, labor-intensive enterprises
1. Introduction
The whole population of the employees within an enterprise tends to be increasingly
getting younger, and the competition for high talents among modern firms is getting more and
fiercer. With the emergence of two facts, the turnover rate of employees is getting much
higher. With the radical development of network information technology and the rapid
diversification of interpersonal communication methods, the negative ripple effect of
employees’ turnover has been magnified infinitely (Hesford et al., 2016; Wong, Y.-t. et al.,
2015). In this case, it is more practical to address the mechanisms of employees’ turnover
behavior. How to attract and retain excellent talents and further take effective measures to
reduce their turnover rate, without doubt, has become a core topic of a top priority among
various topics in human resource management within modern enterprises.
At present, a flood of literature has examined the influencing factors of employees’ turnover
behavior by adopting multiple research methods and various empirical samples. According to

American Journal of Humanities and Social Science (AJHSS) Volume 11, 2021
57
existing findings, three kinds of factors that affect employees’ turnover behavior have been
found, which include the environmental factors in macro-level, the organizational factors in
micro-level and the employees’ characteristics factors in individual level (Lee and Micthell,
1991; Mobley, 1977; Price, 1977; Weng, &McElroy, 2016; Zopiatis et al., 2014). In recent
years, scholars have made new valuable contributions by studying the employees’ turnover
behavior from various new perspectives of job embeddedness, employee career management
and psychological contract, etc., which are mainly rooted in the organizational-level factors.
Quite a few researchers strongly agree that organizational-level factors are playing an
increasingly irreplaceable role in determining employees’ turnover behavior, which have
become the most valuable antecedents worthy of further in-depth investigations on
employees’ turnover behavior (Dawley et al., 2010). Among the organizational-level factors,
the leadership style of top managers is one of the academic circles’ focuses in recent years.
The view that there is a strong relationship between employees’ turnover and their (direct)
managers’ leadership styles is found to widely distribute in articles across various business
magazines, public media and academic literature. Statistics show that about 40%-50% of the
employees will propose to quit because of the poor working environment and working
atmosphere shaped by their managers who cannot perform their management responsibilities
with suitable leadership styles. Hence, a consensus among scholars is that the bad leadership
styles of the employees’ direct managers with whom the employees directly contact at daily
work are basically the most direct and critical reasons why they choose to leave. In line with
the upper echelon theory, the leadership styles of the managers in each organizational level
are determined and shaped by the CEOs to a large degree (Hambrick and Mason, 1984).
What is more, the upper echelon theory strongly argues that the CEOs’ demographic profiles
affect their strategic choices, talents (definition and) selection and thus the responding
enterprises’ competitive edge (Thitima and Piruna, 2015). According to such logic, CEOs’
demographic profiles can determine both the leadership style of the employees’ direct
managers and the rationality of the enterprises’ strategy, which are two critical factors of
employees’ turnover behavior. Considering the three following points, we choose CEO age
from the multiple demographic characteristics as the focal variable of employees’ turnover
behavior: ①There is a “black-box” in the link between CEO age and employees’ turnover,
which has not been revealed by the existing literature; ②CEO age plays a critical role in
shaping CEOs’ attitudes, values and beliefs under the background of China, which is famous
for Confucian culture (Soojin Yim, 2013); ③The last but not the least, we have great interest
and enthusiasm in exploring the impact of CEO age.
CEOs’ age can reflect their growth experiences and living environment backgrounds,
which have a direct effect on CEOs’ capabilities, goals and preferences when they make and
execute strategic decisions for their enterprises. In the field of social psychology and business
management, a few scholars have ever used age as an objective indicator to measure and
capture the individuals’ risk preferences, the degree of career concerns, the values, and the
richness in experiences when they are in the processes of strategies formulation and selection.
At present, the literature on the effect of CEO age focuses on the issues including strategic

American Journal of Humanities and Social Science (AJHSS) Volume 11, 2021
58
choice, risk-taking, executive compensation and corporate performance, and so on (Kunze et
al., 2013; Hua Wei Huang et al., 2012; Soojin Yim, 2013). The existing research results show
that CEO age can indeed have different effects on multiple organizational process and
outcome variables, which have proved that CEOs of different ages do have different values,
attitudes and decision preferences, as well as different strategic investment decisions,
leadership styles and management capabilities. In addition, the most closely related research
stream is the research literature on the relationship between the age composition of senior
management team and the turnover behavior of senior managers. Quite a few scholars have
studied whether the age composition of senior management team can affect the turnover
behavior of senior managers from the perspective of social identity theory. According to
social identity theory, since senior managers’ age, as a critical demographic characteristic, can
reflect individuals’ values, beliefs and attitudes, then age differences among senior managers
can be regarded as a separating factor(Kunz et al., 2013), which are not conducive to the
positive interactions among senior managers. Instead, the separating factors would lead to
interpersonal conflicts, as well as the decline of cohesion. Such factors eventually increase
the turnover rate of senior managers (Williams and O’ Reilly, 1998). On the other hand,
senior managers of the similar ages usually have similar experiences and values, and hold
similar ideas on corporate strategy. In this case, the sense of belonging and cohesion among
senior manager’s increases, which eventually leads to much lower intention of leaving.
Therefore, it is can be naturally reasoned that there is a potential link between CEO age and
employees’ turnover behavior, which has not been examined by existing studies.
To sum up, drawing on the framework of upper echelon theory, we expect that CEO age
is an important antecedent affecting employees’ turnover, and simultaneously based on the
literature review, we find that the impacts of CEO age on employees’ turnover have not been
explored to an acceptable degree. Therefore, this study intends to empirically explore the
determining mechanisms of employees’ turnover behavior from the perspective of CEO age
based on the data of Chinese listed companies. The research findings of this paper are
expected to enrich the theoretical knowledge of upper echelon, and make up the research
gaps on the influencing factors of employees’ turnover.
2 Literature review and hypotheses
2.1 The negative link between CEO age and employees’ turnover
A large number of research findings in the fields of psychology science and behavioral
science show that the time background of an individual’s birth and the cultural & physical
environment of an individual’s growth will determine his or her personalities and preferences,
and further produce different cognitive abilities, thinking modes and values (Malmendier and
Geoffrey, 2011; Till et al., 2015). These differences can affect individual behavior
decision-making, and ultimately reflect in the business decision-making process, thus
affecting employee behavior choice. As an important demographic characteristic of CEO, age
American Journal of Humanities and Social Science (AJHSS) Volume 11, 2021
59
has a complex and diverse impact on CEO's behavior, strategic choice and management style
in the process of duty performance, showing the characteristics of non-linear change. From
different theoretical perspectives, the impact of CEO age on employee turnover has two
completely opposite but each has its own internal logic possibility, that is, positive impact and
negative impact. This paper attempts to put forward the competitive hypothesis of the
relationship between the two, and intends to test and compare the correctness of the two
possible logical paths in practice through empirical data.
First, according to the overconfidence theory, younger CEOs generally have a higher
level of overconfidence, which would show as that they are keener to take risks and support
changes than senior CEOs do. The more confident young CEOs are, the stronger their
preferences for innovation (or R&D) projects. They hope to prove their abilities and
competencies through the successful implementation of innovation initiatives (Malmendier
and Tate, 2003). According to this logic, younger CEOs are more likely to use their own
capabilities to promote the implementation and performance of innovation projects. Some
studies have found that CEOs’ characteristic of overconfidence is positively linked with
higher level of risk-taking intention, which is conducive to improving the efficiency of capital
allocation and the improvement of enterprises’ value, establishing a good public image of the
enterprises, and further building employee self-confidence and accountability. As for the
daily internal operation and management style, overconfident younger CEOs tend to adopt
technology-oriented and innovation-oriented strategies with a higher possibility, and further
attempt to guide the enterprise's objectives, management methods, profit patterns,
organizational structure, and so on, to operate around such differentiation strategies with the
purpose of maintaining the vitality of the enterprises. In this process, younger CEOs also
provide employees with meaningful and inspiring opportunities and platforms, which would
help employees realize their self-worth during the process of pursuing the strategic objectives
of their responding enterprises. In this case, employees have lower intention of leaving.
Second, from the perspective of psychological contract theory, with the ever-increasing
development and innovation of management concepts and management methods, the
emergence of a new type of employment practice has resulted in subtle changes in the
relationship between organizations and employees (Meckler et al., 2003). Psychological
contract plays a more and more important role in the organization, which has become an
invisible commitment between the organization and employees maintaining the relationship
between the organization and its members. Such a bilateral commitment becomes the binding
force of both sides. Organizations and employees need to invest in each other in order to
achieve a balance between the expectations of the organizations on employees and those of
the employees on organizations. Under the condition of the new type of employment practice,
young CEOs have stronger desires to pursue for super firm performance by engaging
themselves into firm operation activities with the eager expectation of obtaining good
reputation and recognition from multiple stakeholders. This is consistent with the front-line
employees’ eager ambitions of improving their abilities and realizing their self-worth. This is
especially true when the employees born after 1995 enter the workplace. Facing the younger

American Journal of Humanities and Social Science (AJHSS) Volume 11, 2021
60
CEOs inspired by healthy psychological contract, most of the employees also have the
willingness to cooperate with younger CEOs to achieve corporate strategic goals which are
actually in alignment with their own personal goals. In this process, younger CEOs would
provide their employees with more opportunities of realizing self-worth and higher growth
discretion by persistently involving them into challenging, changing and innovating
initiatives. Therefore, employees are more willing to stay in such kinds of organizations.
Third, from the perspective of human capital theory, with the increase of age, the
extraversion and flexibility of an individual in terms of intellectual efficiency and
enterprising ability, the core components of human capital, gradually get weakened. With the
increase of age, on the one hand, senior CEOs’ mental ability, energy and learning capability
would decline significantly; on the other hand, senior CEOs are becoming more rigid and
resistant to change. As a result, senior CEOs’ competencies in effectively promoting change
and innovation by integrating, organizing and controlling multiple resources and complex
information are getting gradually weakened. Under such rigid leadership, the organizations
may face higher risk of being eliminated, and thus the position safety of employees will be
affected. In addition, in order to obtain more income and stronger ability in the future,
employees need to invest and accumulate their human capital. With the growth of CEOs’ age,
their accumulation rate of human capital decreases, and their human capital structure is
getting aging and even outdated. The senior CEOs’ rigid leadership styles cannot provide
employees’ with suitable learning platform and sufficient room for improving their human
capital, which is necessary for young employees to achieve growth and future career success.
In this case, it is difficult for senior CEOs to help employees accelerate human capital
accumulation, which is more likely to create the risk of passive resignation for younger
employees. Hence, according to human capital theory, (younger) employees are more willing
to work with younger CEOs with faster human capital update.
Finally, according to the leadership style theory, each generation has the specialized
characteristics of the times embedded in the workplace. The growth environment has shaped
a typical "Authoritative" leadership style of senior CEOs, which tends to concentrate the
decision-making power into their own hands. In this case, senior CEOs focus on work
efficiency and quantitative objectives, showing strict attitudes towards their subordinates and
lacking necessary concerns on employees’ subjective welfare. As the same time, employees
are also wary and hostile to senior CEOs. senior CEOs who adopt "Authoritative" leadership
style like to set team work goals by themselves, and do not give their subordinate employees
the right to participate in decision-making or express their voice. This kind of leadership style
tends to suppress the initiative and enthusiasm of employees, which would lead to negative
psychological phenomena such as "unfairness" and "nothing to do with me", resulting in
employees’ negative non-cooperative behavior (Uzonwanne, 2016). The care and support of
senior leaders to employees are an important prerequisite for employees to be willing to stay
in and contribute to their organizations (Dawley et al., 2010). When employees recognize that
they are supported by leaders, they show greater satisfaction and stronger organizational
commitment (Clark et al. 2008), which can produce higher job performance and less turnover

American Journal of Humanities and Social Science (AJHSS) Volume 11, 2021
61
intention. On the contrary, the "Authoritative" leadership style is difficult to establish a
mutually beneficial relationship between superiors and subordinates, which will bring
dissatisfaction to employees, and then lead to the possibility of employees’ turnover.
Based on the above discussion, this paper proposes the following hypothesis:
H1a: CEO age has a positive impact on employees’ turnover rate.
2.2 The negative link between CEO age and employees’ turnover
First, from the perspective of social capital theory, there is a positive link between CEO
age and the quality of CEOs’ social network. With the growth of CEO age, the richness of the
available external material or non-material resources embedded in the CEOs’ social network
would be improved gradually (Till et al., 2015). Information resource derived from senior
CEOs’ social network is beneficial to setting the right strategy, material resource and
financial resource derived from senior CEOs’ social network can expand the potential
strategic choice scope, human resource and policy resource derived from senior CEOs’ social
(and governmental) network can enhance the execution performance of the strategy. CEO age
gives older CEOs resources to improve corporate performance. Employees benefit from these
resources brought by the social capital of senior CEOs in many ways. Therefore, the age of
CEO will be accompanied by the decrease of employee turnover intention.
Second, from the perspective of risk-aversion theory, there is a moderate negative
correlation between CEO age and CEOs’ risk-taking. With the growth of age, senior CEOs
pursue more stable living conditions and less risky business environment, and their
decision-making pattern tends to be stable. For an example, vroom and Pahl (1971) have ever
compared the influence of age on a manager’s risk preference of financial decision-making,
and finally confirmed that the older the manager is, the more he/she agrees with the plan with
lower risk. For another example, Ackert et al (2002) have found that senior CEOs hold lower
proportion of risky assets, and their risk aversion attitudes increase with age. A recent
research has confirmed that real estate investment trusts managed by CEOs with short
managerial decision horizons have a lower standard deviation of return on assets (Yung et al.
2017). Because younger CEOs have a higher desire for career success, they not only tend to
overestimate their operation ability and their correctness of information processing, but also
they tend to overestimate the earnings and underestimate the risks in the process of strategic
decision-making. Such facts are likely to cause higher probability of decision-making errors.
Hence, younger CEOs with excessive risk-taking, on the whole, have a negative impact on
corporate performance. The stock price of their companies fluctuates more, and the decline of
performance directly affects the material interests of employees (Hirshleifer, 2012). When
younger CEOs’ aggressive decisions negatively affect employee's interest and thus
employee's expectations on future individual growth cannot be fulfilled, employees would
think that the organization violates the psychological contract between them, and will make a
series of actions to express dissatisfaction or even protest, which may be manifested as
resignation. Therefore, the senior CEOs’ accurate self-awareness and moderate risk aversion
can ensure the stable development of the enterprise to the best degree, which is beneficial to
ensuring the vital interests of employees and reducing the turnover rate.

American Journal of Humanities and Social Science (AJHSS) Volume 11, 2021
62
Finally, from the perspective of stewardship theory, senior CEOs are more inclined to
create a stable internal environment and a harmonious atmosphere to ensure the stability of
employees. According to the stewardship theory, the older the CEO’s are, the stronger the
sense of their social responsibility is, and the more attention is paid to moral behavior (Hua
Wei Huang et al., 200?). Senior CEOs can strictly require themselves and team members to
complete their duties efficiently under the drive of sense of responsibility without too much
external supervision and material incentives. Their behavioral and decision-making
objectives are highly consistent with the strategic objectives of the enterprises. Senior CEOs,
especially those close to retirement, have stronger motivation to leave a better operation
platform (or environment) for their successors. Meanwhile, they are more tolerant of young
employees, showing higher tolerance of young employees’ mistakes and providing more
opportunities for young employees’ career growth. When senior CEOs are going to leave
office, they would try their best to ensure a good corporate governance environment and
reduce the turnover rate of employees.
Based on the above discussion, this paper proposes the competing hypothesis of H1b:
H1b: CEO age has a negative impact on employees’ turnover rate.
3 Methodology
3.1 Sample and data
A-share listed companies in China are taken as the initial sample framework.
Considering the fact that the knowledge intensity of each industry varies to a large degree,
which would moderate the link between CEO age and employees’ turnover rate because the
characteristics of employees in different industries have significant differences, the paper
attempts to divide the whole samples into knowledge-intensive enterprises and
labor-intensive enterprises.
Referring to the Catalogue of Statistical Classification of High-tech Industries published
by the National Bureau of Statistics of China, the classification of high-tech enterprises in the
latest Chinese Statistical Yearbook of 2016, and a large number of research articles on
knowledge-based enterprises (Foo and Hepworth, 2000; Ngah and Wong, 2020; Vandergriff,
2006; Wenping, 2004), the enterprises belonging to the following industries are selected as
the research samples of knowledge-intensive enterprises: Electrical Machinery and
Equipment Industry, Chemical Raw Materials and Chemicals Industry, Computers,
Communications and other Electronic Equipment Industry, Automobiles Industry, Petroleum
processing, Coking and Nuclear Fuel Processing Industry, Railways, Ships, Aerospace and
Other Transportation Equipment Industry, Pharmaceutical Industry, and Instruments and
Special Equipment Industry; The enterprises belonging to the following industries are
selected as the research samples of labor-intensive enterprises: Agriculture, Forestry, Animal
Husbandry and Fishery Industry, Textile Industry, Wholesale and Retail Industry, Wood
Processing and Wood, Rattan and Palm Grass Products Industry and Accommodation and
Catering Industry.

American Journal of Humanities and Social Science (AJHSS) Volume 11, 2021
63
The following steps are executed to refine our final research sample: (1) To select the
listed companies belonging to the above knowledge-intensive industries and labor-intensive
industries; (2) To select the listed companies during the period of 2011-2016; (3) To select
the companies that have not ever been publicly punished during the sampling years; (4) To
select the companies that have not ever been marked with ST or PT during the sampling years;
(5) To remove the listed companies with unexplained performance decline during the
sampling years or with more than more than three zero paid executives during the sampling
years; (6) To select listed companies which fully disclose the required data in the responding
years.
Most of the sample data of this paper come from CSMAR and the annual reports of
listed companies disclosed by Cninfo.com. Part of the sample data, including the data needed
to calculate the employees’ turnover rate, have been collected from the Chinese National
Statistical Yearbook over 2011-2016. After selecting the data, the main continuous variables
have been arranged in ascending order, and the extreme values on both sides are processed
with 1% winsorize tail reduction to eliminate the potential distortions of extreme data on
empirical results. Based on the above procedures, a panel data consisting of 3296 firm-year
observations are reached as the final research samples. The data processing tool is SPSS23
and STATA12.
3.2 Variables
CEO age (CAGE): Referring existing literature on CEO age (Ginesti, 2019; Haider et al.,
2019; Naseem et al., 2020), CAGE is measured by the physiological age of the CEOs
disclosed in the annual reports of the sample companies in each responding sample years.
Employees’ turnover rate (ETR): Referring to the suggestions of existing literature (Cui
Chun-fang, 2009;Sun Xiaoyun, 2016), based on the interviewing results with the human
resource managers on the practices of employees’ retention and recruitment, ETR is
calculated according to the Equation (1).
ETR = (Number of Budget Employees - Number of Employees at the end of the year) /
Number of Budget Employees
Equation (1)
In Equation (1), Number of Budget Employees (of a sample listed company) is
calculated according to Equation (2).
Number of Budget Employee=(1 + Average Industry Recruitment Ratio) * Number of
Employees at the beginning of the year
Equation (2)
In Equation (2), Average Industry Recruitment Ratio is calculated according to Equation
(3). We expect that in order to maintain the sustainable development of the industry, the

American Journal of Humanities and Social Science (AJHSS) Volume 11, 2021
64
minimum recruitment ratio of the industry would be at least the average turnover rate of the
same industry. Otherwise, such an industry would shrink.
Average Industry Recruitment Ratio = Average Number of Employees of the industry
across this year - Average Number of Employees of the industry across last year) / Total
Number of Registered Employees in the industry in last year
Equation (3)
Average Number of Employees of the industry across this year is the average of the
employees’ number of the industry at the beginning of this year and the employees’ number
of the industry at the end of this year. In a similar way, Average Number of Employees of the
industry across last year is the average of the employees’ number of the industry at the
beginning of last year and the employees’ number of the industry at the end of last year.
When the difference between the Average Number of Employees of the industry in this year
and the Average Number of Employees of the industry in last year is negative, Average
Industry Recruitment Ratio is set as zero. The data needed in Equation (3) can be reached in
China Statistical Yearbook of each year.
Control variables: According to existing literature on antecedents of employees’
turnover rate (Basnyat and Clarence, 2019; Malek et al., 2018; O'Halloran, 2012; Santhanam
et al., 2017), ten control variable have been chosen. (1) SSSJ measures the years’ number
since the sample firm went public, which is expected to be negatively related to ETR; (2)
SIZE is set as the logarithm of total assets, which is expected to be negatively related to ETR;
(3) SGR means the growth rate of total sales measured by the difference between total sales
in t year and total sales in t-1 year, which is expected to be negatively related to ETR; (4)
ROA means firm performance measured by return on total assets, which is expected to
reduce ETR; (5) EPAY means employees’ average pay level measured by the logarithm of
the average compensation of non-executive employees, which is expected to be negatively
related to ETR; (6)TRADE is set as 1 when a sample firm belongs to knowledge-intensive
enterprises, otherwise, TRADE is set as 0. TRADE is expected to positively predict ETR; (7)
TENURE is measured by the years’ number since the CEO took his or her highest position,
which is expected to be positively related to ETR; (8) IDR means the ratio of independent
directors, which is expected to be negatively related to ETR; (9) SPP is set as 1 when CEO
duality appears, otherwise SPP is set as 0. SPP is expected to be positively related to ETR.
(10) OSP is set as 1 when a CEO holds the share of the company; otherwise, OSP is set as 0.
OSP is expected to be negatively linked with ETR.
3.3 Description of data characteristics
a. Variable description in distribution characteristics
We have executed the descriptive statistical analysis of all research variables designed
for this study. (1) The average CEO age is 53.08 years old, the minimum CEO age is 25 years

American Journal of Humanities and Social Science (AJHSS) Volume 11, 2021
65
old, and the maximum CEO age is 78 years old. The age gap between the oldest CEO and the
youngest CEO exceeds 50 years old. (2) The standardized deviation of Employees’ turnover
rate (ETR) is 0.227, and the full range of ETR is over 0.9. It can be known there are
significant differences in employees’ turnover rate among sample companies, which proves
the validity of our measure method on calculating ETR and further highlights the practical
significance of this study. In addition, the average listing age (SSSJ) is about 12.55 years old,
the average return on assets (ROA) is about 4.2%, the average sales growth rate (SGR) is
about 31%, the average of the ratio of independent directors (IDR) is about 37.9%, the
possibility of CEO duality (SPP) is about 21%, the possibility of holding firm shares for the
CEOs is about 43%, about 53% sample firms belong to knowledge-intensive enterprises, and
the average CEO tenure is about 5.8 years.
We also have carried out the normal distribution test of the research variables by
adopting Kolmogorov-Smirnov test, P-P Figures and Q-Q Figures. Results show that part of
the research variables cannot pass the Kolmogorov-Smirnov test, while most of the variables
can be regarded as being close to normal distribution through the tests of P-P Figures and
Q-Q Figures, including CAGE and ETR. In other words, the sample data of this paper is
suitable for empirical analysis by adopting regression analysis.
b. Correlation analysis
The results of Pearson correlation analysis among research variables are shown in
Table1. There is significant positive correlation between CAGE and ETR (P<0.05), which
initially meets the expectation of H1a. However, more accurate conclusion need to be
verified by further rigorous empirical analysis. SSSJ and EPAY are positively related with
ETR (P<0.01), while SIZE, ROA, SGR and OSP are negatively related with ETR (P<0.01).
Most of the correlations confirm to prior research results, and such a fact has also verified the
rationality of variable design and data selection in this paper. However, contrary to our
expectation, the positive link between EPAY and ETR draws our interest, which needs
further verification in the next empirical analysis.

American Journal of Humanities and Social Science (AJHSS) Volume 11, 2021
66
Table 1 Correlation results among research variables
TURNOBER AGE SSSJ EPAY ROA SIZE SGR IDR SPP OSP TRADE TENURE
TURNOVER 1.000
AGE .038** 1.000
SSSJ .166*** .047*** 1.000
EPAY .060*** -.029** .111*** 1.000
ROA -.169*** .005 -.171*** .013** 1.000
SIZE -.056*** .130*** .223*** -.032*** -.056*** 1.000
SGR -.092*** -.077*** -.008 .113** -.049** -.028** 1.000
IDR -.003 -.050*** -.025** -.032** -.041** -.005 .016 1.000
SPP .001 -.062*** -.205*** -.033** .032** -.104*** -.028** .138*** 1.000
OSP -.074*** .150*** -.313*** -.024* .131*** .017 -.033** .050*** .164*** 1.000
TRADE -.021 -.052** -.019 -.013 -.095*** -.017 .057*** .074*** .005 .111*** 1.000

American Journal of Humanities and Social Science (AJHSS) Volume 11, 2021
67
Note:*., **. and ***. respectively represents the coefficients are significant at the level of 0.1, 0.05 and 0.01(Bilateral).
TENURE .021* .370*** .054*** -.029** .071*** .083*** -.055*** -.019 .052*** .243*** -.055*** 1.000

American Journal of Humanities and Social Science (AJHSS) Volume 11, 2021
68
c. Multicollinearity analysis
In regression, multicollinearity refers to the extent to which independent variables are correlated.
Multicollinearity exists when one independent variable is correlated with another independent variable, or
when one independent variable is correlated with a linear combination of two or more independent variables.
The analysis of regression coefficients is contingent on the extent of multicollinearity. If the set of
independent variables is characterized by a little bit of multicollinearity problem, the analysis of regression
coefficients should be valid and straightforward. If there is a lot of multicollinearity problem, the analysis
will be hard to interpret and can be skipped. Hence, the analysis of regression coefficients should be
preceded by an analysis of multicollinearity.
Two methods are adopted to deal with the problem of multicollinearity, one is correlation coefficients
examination, and the other is Variance Inflation Factor (VIF). As for the correlation coefficients
examination, all the coefficients in Table1 are less than 0.5, which indicates that there is very limited
multicollinearity problem needing to be concerned. As for the VIF method, the maximum value of VIF in
Model(1), an empirical model designed for testing H1a and H1b, is 1.265, which is far smaller than 5. The
fact indicates an acceptable multicollinearity problem.
itititititit
ititititititit
IDROSPTENURETRADE
EPAYROASGRSIZESSSJCAGE
1110987
654321
SPP
ETR Model(1)
d. Autocorrelation problems analysis
Autocorrelation is a mathematical representation of the degree of similarity between a given time series
and a lagged version of itself over successive time intervals. The main consequence is that although the
estimator of the regression coefficient may be unbiased, it does not have the minimum variance. It may
underestimate the variance of error term and result in that the regression equation cannot predict explained
variables effectively. In other words, high degree of autocorrelation would lead to invalid prediction.
There are two main methods of autocorrelation test, i.e., Durbin-Watson test and Generalized Least
Square test. In this paper, the result of Durbin-Watson test, i.e., DW value is used to judge the potential
autocorrelation problem. DW values of all empirical models in this paper are calculated, and all of the DW
values are very close to 2, which indicate that the autocorrelation problem is weak and the model designed
in this paper is effective.
4 Results
4.1Hypotheses test based on OLS regression
a. Hypotheses test with whole sample
This section will fit the whole sample data with Model (1), and empirically test the relationship
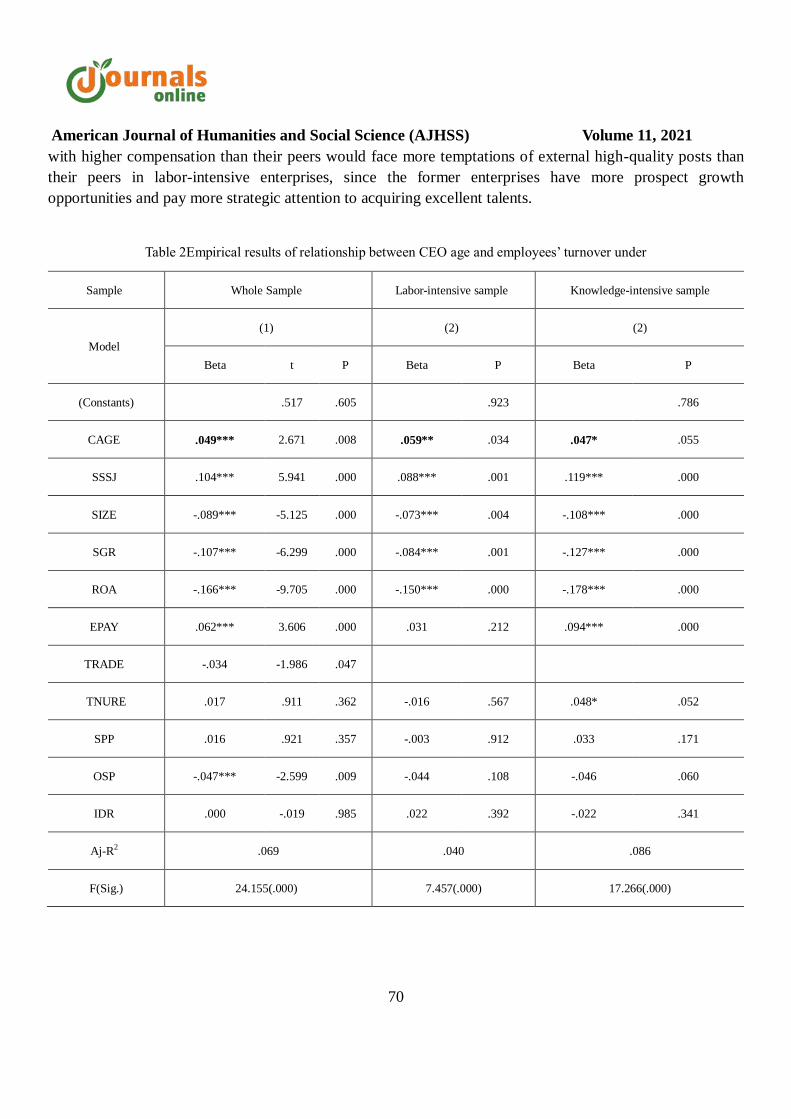
between CEO age and employees’ turnover rate. The regression results are shown in Table 2. In Table 2, the
standardized coefficient of CEO age on employees’ turnover rate (ETR) is 0.049 (P<0.01), indicating there

American Journal of Humanities and Social Science (AJHSS) Volume 11, 2021
69
is a positive impact of CEO age on employees’ turnover rate. H1a is confirmed, while H1b does not hold.
When it comes to the regression results of control variables, most of the control variables do play the
expected roles in affecting employees’ turnover rate. However, the coefficients of SSSJ (β=0.104, p<0.01)
and EPAY(β=0.062, p<0.01) are inconsistent with our expected results. We try to explain the unexpected
result of SSSJ as follows: If one listed company went public earlier, then its decision-making system and
management style are relatively rigid and inflexible, and the enterprise's entrepreneurial consciousness and
innovation tendency will be restrained, which is not conducive to the growth of employees. We try to
explain the unexpected results of EPAY as follows: Higher pay of one employee means higher individual
performance and higher contribution to the his or her enterprise, which are derived from the employee’s
specialized human capital or valuable social capital. In human resource market, such employees are
welcomed by the other enterprises, especially their competitors. These companies will offer higher salaries
than the current level to attract such excellent employees. Faced with more and better external job hopping
opportunities, highly paid employees are likely to choose to leave even if they are not dissatisfied with the
company.
b. Hypotheses test with knowledge-intensive and labor-intensive enterprises
To remove TRADE from Model (1), Model (2) is built, which is adopted to respectively simulate the
sub-sample data of knowledge-intensive enterprises and labor-intensive enterprises. Regression results are
shown in Table 2.
Regression coefficient of CAGE on ETR in labor-intensive enterprises (β=0.059, p=0.034) is obviously
greater than that in knowledge-intensive enterprises (β=0.45, p=0.055). The fact shows that industry
characteristics can moderate the link between CEO age and employees’ turnover rate. For knowledge-based
enterprises, there are more stringent requirements in selecting CEOs. Determined by the knowledge-based
nature of such enterprises, their CEO’s have higher knowledge level, cultural competence and
comprehensive capability. At the same time, their values are increasingly diversified under the influence of
the knowledge-based industry environment. In this case, the effects of CEO age will be weakened by the
other demographic characteristics of CEOs adjusted by knowledge, such as educational background, values,
cultural competence and other characteristics. Therefore, the impact of CEO age on employee turnover rate
will be weakened. In addition, employees of knowledge-intensive enterprises also have obvious
characteristics that employees of other industries do not have. Compared with other industries, employees of
knowledge-intensive enterprises have a greater influence on top leaders’ decision-making. In other words,
not only CEOs unilaterally affect employees, but also they are more and more reversely affected by
employees. Therefore, in this case, the effects of CEOs’ age itself on multiple enterprise operation issues
would be weakened by other knowledge-related factors.
As for the control variables, it is found that there is no significant link between EPAY and ETR (β=0.031,
p=0.212), while there is a much stronger positive link between the two (β=0.094, p=0.000). In
knowledge-intensive enterprises, employees’ compensation level has higher impact on their turnover
behavior. Such a fact further proves our explanation from the perspective of “external employment
opportunities” on the positive link between EPAY and ETR. Employees in knowledge-intensive enterprises
American Journal of Humanities and Social Science (AJHSS) Volume 11, 2021
70
with higher compensation than their peers would face more temptations of external high-quality posts than
their peers in labor-intensive enterprises, since the former enterprises have more prospect growth
opportunities and pay more strategic attention to acquiring excellent talents.
Table 2Empirical results of relationship between CEO age and employees’ turnover under
Sample Whole Sample Labor-intensive sample Knowledge-intensive sample
Model
(1) (2) (2)
Beta t P Beta P Beta P
(Constants) .517 .605 .923 .786
CAGE .049*** 2.671 .008 .059** .034 .047* .055
SSSJ .104*** 5.941 .000 .088*** .001 .119*** .000
SIZE -.089*** -5.125 .000 -.073*** .004 -.108*** .000
SGR -.107*** -6.299 .000 -.084*** .001 -.127*** .000
ROA -.166*** -9.705 .000 -.150*** .000 -.178*** .000
EPAY .062*** 3.606 .000 .031 .212 .094*** .000
TRADE -.034 -1.986 .047
TNURE .017 .911 .362 -.016 .567 .048* .052
SPP .016 .921 .357 -.003 .912 .033 .171
OSP -.047*** -2.599 .009 -.044 .108 -.046 .060
IDR .000 -.019 .985 .022 .392 -.022 .341
Aj-R2 .069 .040 .086
F(Sig.) 24.155(.000) 7.457(.000) 17.266(.000)

American Journal of Humanities and Social Science (AJHSS) Volume 11, 2021
71
c. Hypotheses test considering year effects and industry effects
Five year dummy variables and fifteen industry dummy variables are introduced into Model (2), in
which the variable named “TRADE” related to industry characteristics has been removed from the control
variables. Model (3) is constructed. The regression results of Model (3) have confirmed H1a again even
simultaneously considering the year effects and industry effects.
4.2 Robustness test
a. Robustness test on the change of CEO age’s measure
Considering the in homogeneity and discontinuity of the impact of CEO age on employees’ turnover
behavior, we set a dummy variable for CEO age (CAGE_DUMMY). CAGE_DUMMY is set as 1 when
CEO age of a given sample firm is higher than the mean of CEO age in the whole sample (i.e., 53.08 years
old); otherwise, CAGE_DUMMY is set as 0. In model (1), CAGE is changed into CAGE_DUMMY, and
Model (4) is built. Regression results of Model (4) are shown in Table 3. Results show that there is a
positive relationship between CAGE_DUMMY and ETR (β=0.073,p=0.000), indicating that the empirical
results do not change with the change of CEO age’s measures. H1a still holds.
Table 3. Robustness test results adopting alternative measure of CEO age (CAGE_DUMMY)
Model(4) B Std. Beta P
(Constants) .131 .102 1.283 .200
SSSJ .005 .001 .102*** 5.798 .000
EPAY .041 .011 .063*** 3.696 .000
ROA -1.005 .103 -.167*** -9.752 .000
SIZE -.045 .008 -.092*** -5.331 .000
SGR -.050 .008 -.107*** -6.314 .000
SPP .009 .010 .017 .954 .340
OSP -.021 .008 -.046*** -2.525 .012
TENURE .001 .001 .017 .950 .342
IDR .002 .052 .001 .046 .963
TRADE -.015 .008 -.034** -1.974 .048
CAGE_DUMMY .034 .008 .073*** 4.147 .000

American Journal of Humanities and Social Science (AJHSS) Volume 11, 2021
72
Adj-R2 .067
F(Sig.) 22.378(.000)
b. Robustness test on changing the measure of employees’ turnover rate
Two alternative measures of employees’ turnover rate are used to execute the robustness test.
ETR_DIFF is calculated by the difference between the employees’ average number in t-1 year and the
employees’ average number in t year. To replace ETR in Model (1) with ETR_DIFF, Model (5) is built.
ETR_DUMMY is set as 1 when ETR_DIFF is positive; otherwise, ETR_DUMMY is set as 0. To replace
ETR in Model(1) with ETR_DUMMY, Model (6) is built. Regression results of Model (5) and Model (6)
are shown in Table 4. H1a still holds.
Table 4. Robustness test results adopting alternative measures of employee turnover rate
Model
(5): ETR_DIFF (6): ETR_DUMMY
B Std. Beta t P B Std. Beta t P
(Constants) .129 .073 1.767 .077 1.062 .225 4.722 .000
SSSJ .004 .001 .124*** 7.113 .000 .014 .002 .147*** 8.474 .000
EPAY .032 .008 .068*** 4.045 .000 .036 .024 .025 1.507 .132
ROA -.843 .074 -.194*** -11.450 .000 -2.585 .221 -.198*** -11.678 .000
SIZE -.037 .006 -.105*** -6.151 .000 -.125 .018 -.118*** -6.902 .000
SGR -.035 .006 -.103*** -6.122 .000 -.059 .017 -.059*** -3.484 .001
SPP .008 .007 .019 1.122 .262 .027 .021 .022 1.296 .195
OSP -.017 .006 -.051*** -2.873 .004 -.043 .018 -.044** -2.433 .015
TERM .000 .001 .010 .573 .567 -.006 .002 -.047** -2.546 .011
IDR .022 .037 .010 .598 .550 .223 .111 .034** 2.006 .045
TRADE -.010 .006 -.031* -1.823 .068 -.002 .017 -.002 -.147 .883
AGE .025 .006 .073*** 4.202 .000 .004 .001 .059*** 3.258 .001

American Journal of Humanities and Social Science (AJHSS) Volume 11, 2021
73
c. Robustness test by adopting Independent Sample T Test
The whole sample is divided into two “independent” sub-samples according to the value of
CAGE_DUMMY. If CAGE_DUMMY is 1, the sub-sample is named as senior CEO sample (SC_Sample),
and the other sub-sample is named as younger CEO sample (YC_Sample). The Independent Sample T Test
result is shown in Table 5. It can be known that there is a significant difference in means of employees’
turnover rate (ETR) between YC_Sample and SC_Sample. To be specific, the mean of ETR in SC_Sample
is higher than that in YC_Sample. H1a is confirmed once again.
Table 5 Independent sample t test on ETR between YC_Sample and SC_Sample
T-test of mean equivalence
t df Sig.(Bilateral) Mean differences Std.
ETR
Assumed equal variance -3.803 3297 .000 -.03113 .00818
Assumed variance is not equal -3.718 2306.695 .000 -.03113 .00837
d. Robustness test by adopting STATA
Stata12 is used to construct the Least Squares Dummy Variable Model to analyze whether the
Goodness of fit of Fixed Effect Model or Random Effect Model is better than the Least Square Regression
Model. The results show that the Goodness of fit of Fixed Effect Model is not necessarily superior to the
Least Square Regression Model, while the Goodness of fit of Random Effect Model is superior to the Least
Square Regression Model. Therefore, we run the regression analysis by adopting Random Effect Model with
Model (1). Results are shown in Table 6. The test result of H1a does change with the change of empirical
analysis methods and analysis tools.
Table 6. Robustness test results by running Random Effect Regression Analysis
Model(1) Coef. Std. Err. z P>|z|
CAGE .0129* .0067 1.91 0.057
SSSJ .0049*** .0007 6.86 0.000
EPAY .0328*** .0114 2.87 0.004
ROA -.9931*** .1084 -9.16 0.000
SIZE -.0384*** .0090 -4.27 0.000
SGR -.0461*** .0081 -5.64 0.000
IDR -.0020 .0514 -0.04 0.968

American Journal of Humanities and Social Science (AJHSS) Volume 11, 2021
74
SPP .0204** .0097 2.09 0.037
OAP -.0129 .0085 -1.51 0.132
TENURE 00057 .0010 0.53 0.596
TRADE .0465** .0199 2.34 0.019
_cons .1066 .1047 1.02 0.309
Adj R-sq 0.1092
F(Sig.) 230.35(0.000)
e. Endogeneity test
When a firm’s employees’ turnover rate is too high, more senior CEOs may be chosen as the new CEO
in order to improve operation quality of the enterprise and restore the enterprise-employee relationship,
since shareholder and boards may hold higher recognition of senior CEOs’ management competence.
Considering the potential endogeneity problem of Model (1), especially the endogeneity derived from the
possible reciprocal causation between CEO age and employees’ turnover rate, two methods are used to
address it, respectively the One-period Lagged-Term Regression and Two-stage Least Square Regression.
itititititit
ititititititti
IDROSPTENURETRADE
EPAYROASGRSIZESSSJCAGE
1110987
654321)1(
SPP
ETR Model(7)
One-period Lagged-Term Regression takes Model (7) as the regression model adopting the method of
OLS. Regression results of Model(7) show that CEO age in t year would have higher impact on employees’
turnover rate in t+1 year, and the standardized coefficient of CAGEt on ETRt+1 (β=0.074, p<0.01) is higher
than that of CAGEt on ETRt+1 (β=0.062, p<0.01) . The fact shows that the effect of CEO age on employees’
turnover behavior a rather strong time lags. Results of Two-stage Least Square Regression also confirm H1a
again with a positive coefficient (B=0.0018, P<0.01). It is found that, even considering the potential
endogeneity problem, H1a still holds.
4.3 Further exploration
a. Moderating role of independent directors in the relationship between CEO age and employees’
turnover rate
Empirical results in this study find no link between independent directors and employees’ turnover rate,
which is not confirmed with our expectation. Considering the uniqueness of independent directors in
corporate governance mechanisms, we further explore the moderating role of independent directors in the
link between CEO age and employees’ turnover rate. Model (8) is constructed by introducing the interaction
item of CAGE and IDR (ZSCORE_CAGE*ZSCORE_ZIDR) into model (1).

American Journal of Humanities and Social Science (AJHSS) Volume 11, 2021
75
ititititititit
itititititititit
ZIDRCAGEIDROSP
TENURETRADEEPAYROASGRSIZESSSJ
ZCAGE*SPP
ETR
12111098
7654321
Model(8)
Table 7. Moderating effect of Independent Director on the relationship between CEO age and employees’ turnover rate
B Std. Beta t P
(Constants) .067 .105 .640 .522
SSSJ .005 .001 .103*** 5.839 .000
EPAY .040 .011 .062*** 3.610 .000
ROA -1.006 .103 -.167*** -9.745 .000
SIZE -.044 .008 -.091*** -5.260 .000
SGR -.050 .008 -.108*** -6.314 .000
SPP .010 .010 .017 .998 .319
OSP -.021 .008 -.047** -2.577 .010
TENURE .001 .001 .019 .990 .322
TRADE -.015 .008 -.034** -1.984 .047
IDR .005 .052 .002 .102 .918
CAGE .002 .001 .048** 2.580 .010
ZCAGE*ZIDR .008 .004 .037** 2.160 .031
Aj-R2 .065
F(Sig.) 20.023(0.000)
Results in Table 7 show that the regression coefficient of ZCAGE*ZIDR on ETR is significantly positive
(β=0.037, p<0.05), indicating independent directors would enhance the positive link between CEO age and
employees’ turnover rate. The fact that CEOs have the absolute power to appoint independent directors

American Journal of Humanities and Social Science (AJHSS) Volume 11, 2021
76
makes independent directors dependent and obedient to CEOs, which has weakened the monitoring and
advice effectiveness of independent directors.
b. Impact of female executives on employees’ turnover rate
In addition, female executives have been proved to have essential impact on various organizational issues,
including firm performance, executive compensation, strategic change and tax avoidance, etc. However,
there is rare literature investigating the link between female executives and employees’ turnover, and
especially it is true in China. Facing the fact that female executives are playing ever-increasingly important
roles in corporate governance of Chinese enterprises, it is of significance to enrich the study on female
executives’ consequences by investigating the potential link between female executives and employees’
turnover.
By adding FEMALE and CAGE*FEMALE into Model (1), Model(1+) has been built. Regression results
would show that CAGE is positively related to ETR, indicating CEO age has a negative effect on
employees’ turnover rate, while female executives have no moderating effect on the link between CEO age
and employees’ turnover rate. The possible reasons are shown as follows.
First, female executives are regarded to be more ethical in performing their responsibilities by most of
the literature investigating female executives. Ethical decision-makings would be helpful in enhancing social
responsibility performance which can shape friend environment for the responding firm’s operation. Hence,
firms with more female executives may face less risky & uncertain situations. In addition, employees in a
firm with high-leveled social reputations due to its female executives’ ethical behavior would enjoy higher
sense of mission and honor. In this case, it is expected that employees of a firm with higher ratio of female
executives have weaker intention to leave.
Second, female executives are regarded to be more risk-averse than their male peers. Male-dominated
top management teams in China have been proved by existing literature to hold higher risk-preference in
strategic and operating decision-makings than their female peers do, usually with the purpose of betting a
lucky prospects which can maximize their private benefits. On the contrary, being more cautious in the
decision-making process, female executives are less likely to abuse resources, and tend to take moderate
risks. As evidence, all the literature about the link between female executives and performance volatility has
shown that they are negatively correlated, and most of the literature on the performance consequences of
female executives has confirmed the enhancement effects on firm performance of female executives. Hence,
employees in firms with higher ratio of female executives would like to stay due to higher expectation of
future firm performance and more favorable expectation of performance volatility.
5 Conclusions
5.1 Theoretical findings
The research objective is to examine the role of CEO age in determining employees’ turnover rate. The
research sample is a set of panel data from Chinese A-share listed companies during 2011 to 2016 consisting
of 3296 observations. The Multiple Linear Regression based on OLS, Random Effect Regression Analysis,

American Journal of Humanities and Social Science (AJHSS) Volume 11, 2021
77
Independent Sample T Test, One-period Lagged-Term Regression and Two-stage Least Square Regression is
used to empirically analyze the data. According to the empirical study, it can be concluded as follows:
(1) CEO age has positive effect on employees’ turnover rate. Though older CEOs may have higher social
capital, which would probably improve firm performance, they show the weakness of too conservative
decision-making preferences and being not good at flexible leadership, which would determine employees’
turnover decisions to a larger degree. In other words, the “similarity-attraction” effect plays the critical role
in the age-dynamic between CEOs and employees. (2) CEO age play a more important role in resulting in
employees’ turnover rate knowledge-intensive enterprises than it does in labor-intensive enterprises. (3)
Independent directors have no direct effect on employees’ turnover, however, it can indirectly result in
higher employees’ turnover rate by positively moderating the link between CEO age and employees’
turnover rate. (4) Employees’ compensation level is accompanied with much higher employees’ turnover
rate, which can be explained from the perspective of external talents competition by the other enterprises.
The originality of this study is to add the new research perspective of CEO age into the traditional
determinants model of turnover behavior, and further verify the rationality of this perspective in explaining
and predicting employee turnover behavior, which is beneficial to enriching the research on the forming
mechanisms of employees’ turnover behavior and expanding the upper echelon theory.
5.2 Practical suggestions
According to the findings, several meaningful suggestions would be proposed as follows. (1) For the board
and shareholders, when it comes to the appointment of new CEOs, the age-match between CEOs and
non-executive employees should be considered with caution. The difference between CEO age and the
average of employees’ age should be narrowed to an acceptable degree. Otherwise, the leadership style and
thinking minds between the new CEOs and employees would not align with each other, which would lead to
higher internal conflicts and weaker execution of firm strategy, resulting in higher employees’ turnover rate.
(2) For senior CEOs, they should pay more attention to new venturing initiatives with the attempt of
avoiding too conservative intention, and try to learn and practice the flexible leadership style marked with
excellent communication and care on persons. By doing so, the positive link between CEO age and
employees’ turnover rate would be avoided to a large degree. When senior CEOs head a labor-intensive
enterprise, or lead an enterprise mostly composed of young persons, such a suggestion is especially effective.
(3) For regulatory authorities of listed companies, they should try to set proper mechanism of appointing
independent directors by changing the existing way of appointing independent directors by CEOs. It is
suggested that an organization similar to the "Association of Independent Directors " should be established,
in which the members are qualified independent directors. The CSRC supervises the organization, which is
responsible for appointing appropriate independent directors to each listed company according to the
proportion requirements. The expenses of independent directors are fixed allowances, which are paid by the
listed company to the association of independent directors. The association of independent directors is
responsible for assessing the responsibility performance of independent directors and paying corresponding
remuneration to them accordingly. This mechanism not only makes the independent director independent
from the listed companies (and the CEOs), but also economically.

American Journal of Humanities and Social Science (AJHSS) Volume 11, 2021
78
5.3 Research limitations
There are few research limitations in this study. First, the measure of employee’s turnover rate has not
considered the distinction between voluntary turnover behavior and passive resignation behavior. There is a
strong need to investigate and compare the antecedents of the two behaviors, especially from the perspective
of CEO age, since each of the two turnover behaviors have rather different consequences. Second, the
moderating role of independent directors in the link between CEO age and employees’ turnover rate has
been identified in this study, which indicates the contingent nature of the relationship between the two.
Therefore, it is of good theoretical significance for further studies to explore the moderating mechanisms of
some other corporate governance mechanisms on the link between CEO age and employees’ turnover rate.
For instance, it can be expected that share concentration degree, CEO duality or ownership attributes may
have moderating effects on the links between the two. Third, the links between CEO age and employees
turnover rate would be different from each other in various culture backgrounds, which needs further
exploration.
Acknowledgements
This research was supported by the National Social Science Fund Project "Research On The Compensation
Adjustment Effect Of Female Executives’ Participation Degree In Corporate Governance And Its
Performance Improvement Mechanism (20BGL147)".
References
1) Ackert L.F, Church B K. and Englis B. The Asset Allocation Decision and Investor Heterogeneity: A
Puzzle. Journal of Economic Behavior and Organization, 2002,47(4): 423-433.
2) Basnyat, S. and Clarence Lao, C.S. Employees’ perceptions on the relationship between human resource
management practices and employee turnover: A qualitative study. Employee Relations, 2019,42(2):
453-470.
3) Clark R.A., Hartline M.D. and JonesK.C. The effects of leadership style on hotel employees'
commitment to service quality. Cornell Hospitality Quarterly, 2008,50(2): 209-231.
4) Cui Chun-fang. Probe into the calculation and application of the dimission rate at the start-up stage of
enterprise. Sci-tech Information Development & Economy, 2009,19(4):199-209. (In Chinese)
5) Dawley D., Houghton J.D., and Bucklew N.S. Perceived organizational support and turnover intention:
The mediating effects of personal sacrifice and job fit.The Journal of Social
Psychology, 2010,150 (3):238-257.
6) Foo S. and Hepworth M. The implementation of an electronic survey tool to help determine the
information needs of a knowledge-based organization. Information Management & Computer Security,
2000,8(2): 53-64.
7) Ginesti G. Top management characteristics and intellectual capital performance in small Italian

American Journal of Humanities and Social Science (AJHSS) Volume 11, 2021
79
companies. Corporate Governance, 2019,19(6): 1153-1166.
8) Haider I., Sultana N., Singh H. and Tham Y.H. CEO age and analysts forecast properties. Asian Review
of Accounting, 2019,28(1): 1-23.
9) Hambrick DC and Mason PA. Upper echelons: The organization as a reflection of its top managers.
Social Science Electronic Publishing, 1984, 9 (2): 193-206.
10) Hesford J.W., Malina M.A. and Pizzini, M. Turnover and Unit-Level Financial Performance: An
Analysis of the Costs and Benefits of Voluntary and Involuntary Turnover in Unskilled Jobs. Advances
in Management Accounting, 2016, 26: 35-65.
11) Hirshleifer D., A. Low and S. H. Teoh. Are Overconfident s Better Innovators?. The Journal of Finance,
2012, 67(4): 1457-1498.
12) Hua Wei Huang, Ena Rose Green and Chen Lee. Age and Financial Reporting Quality. Accounting
Horizons, 2012,26(4): 725-740.
13) Kunze F, Boehm S and Bruch H. Organizational Performance Consequences of Age Diversity:
Inspecting the Role of Diversity-Friendly HR Policies and Top Managers’ Negative Age Stereotypes.
Journal of Management Studies, 2013, 50 (3): 413-442.
14) LeeT.W and MicthellT. R.The unfolding effects of organizational commitment and anticipated job
satisfaction on voluntary employee turnover. Motivation and emotion,1991,15(l):99-121.
15) Malek K., Kline S.F. and DiPietro R. The impact of manager training on employee turnover intentions.
Journal of Hospitality and Tourism Insights, 2018,1(3): 203-219.
16) Malmendier Ulrike and Geoffrey Tate. Overconfidence and Early-life Experience: The Effect of
Managerial Traits on Corporate Financial Policies. Journal of Finance, 2011 (5): 35-53.
17) Malmendier Ulrike and Geoffrey Tate. Who Makes Acquisitions? Overconfidence and the Market’s
Reaction. Journal of Financial Economics, 2003,89(1): 20-43.
18) Mobley W H. Intermediate linkage in the relationship between jobsatisfaction and employee
turnover.Journal of Applied Psychology,1977,62(2):237-240.
19) Meckler M, Drake B H and Levinson H. Putting psychology back into psychological contracts. Journal
of Management Inquiry, 2003(12): 217-228.
20) Ngah R. and Wong K.Y. Linking knowledge management to competitive strategies of knowledge-based
SMEs. The Bottom Line, 2020,33(1): 42-59.
21) Naseem M.A., Lin J., Rehman R.U., Ahmad M.I. and Ali R. Does capital structure mediate the link
between CEO characteristics and firm performance?j. Management Decision, 2020,58(1): 164-181.
22) O'Halloran P. L. Performance pay and employee turnover. Journal of Economic Studies, 2012,39(6):
653-674.
23) Price J L. Reflections on the determinants of voluntary turnover. International Journal of Manpower,
2001,22(7):600-624.
24) Robinsonsl, Kraatzms and Rousseaudm. Changing Obligations and the Psychological Contract: A
Longitudinal Study. Academy of Management Journal, 1994(37): 137 -52.
25) Santhanam N., T.J. K. Dyaram L. and Ziegler H. Impact of human resource management practices on

American Journal of Humanities and Social Science (AJHSS) Volume 11, 2021
80
employee turnover intentions: Moderating role of psychological contract breach. Journal of Indian
Business Research, 2017,9(3): 212-228.
26) Soojin Yim. The acquisitiveness of youth: Age and acquisition behavior. Journal of Financial Economics,
2013,108: 250-273.
27) Sun Xiaoyun. A study on the relationship among internal compensation gap, employee turnover
behavior and enterprise performance. Dissertation for Master Degree, Liaoning University, 2016. (In
Chinese)
28) Thitima Sitthipongpanich and Piruna Polsiri. Do and board characteristics matter? A study of Thai
family firms. Journal of Family Business Strategy, 2015,6(2): 119-129.
29) Till von den Driesch, Maika Eva Susanne da Costa, Tessa Christina Flatten and Malte Brettel. How
experience, personality, and network affect firms' dynamic capabilities. European Management
Journal, 2015, 33(4): 245-256.
30) Uzonwanne F.C. Influence of age and gender on decision-making models and leadership styles of
non-profit executives in Texas, USA. International Journal of Organizational Analysis, 2016,24(2):
186-203.
31) Vandergriff L.J. Unified approach to agile knowledge-based enterprise decision support. VINE,
2006,36(2): 199-210.
32) Vroom V. and Pahl B. Relationship between age and risk taking among managers. Journal of Applied
Psychology, 1971,55 (5): 399-405.
33) Weng Q and McElroy J C. Organizational career growth,affective occupational commitment and
turnover intentions. Journal of Vocational Behavior, 2016, 80 (2):256-265.
34) Williams K Y, O’Reilly III C A. Demography and diversity in organizations: A review of 40 years of
re-search. Research in Organizational Behavior, 1998,20: 77-140.
35) Wong, Y.-t., Wong, Y.-W. and Wong, C.-s. An integrative model of turnover intention: Antecedents and
their effects on employee performance in Chinese joint ventures. Journal of Chinese Human Resource
Management, 2015, 6(1):71-90.
36) Yung K., Li D.D. and Jian Y. Managerial decision horizon and real estate investment trusts (REITs).
Review of Behavioral Finance, 2017,9(1): 63-78.
37) Zopiatis A, Constanti P and Theocharous A L. Job involvement, commitment, satisfaction and turnover:
Evidence from hotel employees in Cyprus.Tourism Management,2014.,41 (1):129-140.
38) Wenping, W. Organic mechanism and capacity grey set optimization for knowledge-based enterprise.
Kybernetes, 2004,33(2): 372-381.