2000 Use of Fluorescent Probes to Assess Physiological Functions of Bacteria at Single-cell Level

IMPACT OF BACTERIA ON THE PHENOTYPE, FUNCTIONS,
AND THERAPEUTIC ACTIVITIES OF INVARIANT
NKT CELLS IN MICE
SUNGJUNE KIM
IMPACT OF BACTERIA ON THE PHENOTYPE, FUNCTIONS,
AND THERAPEUTIC ACTIVITIES OF INVARIANT
NKT CELLS IN MICE
By
Sungjune Kim
Dissertation
Submitted to the Faculty of the
Graduate School of Vanderbilt University
in partial fulfillment of the requirements
for the degree of
DOCTOR OF PHILOSOPHY
in
Microbiology and Immunology
August, 2008
Nashville, Tennessee
Approved
Professor Henry E. Ruley
Professor Wasif N. Khan
Professor Louise A. Rollins-Smith
Professor Guoqiang Gu
Professor Luc Van Kaer

DEDICATION
To my loving wife and parents
for their love and support
ii
ACKNOWLEDGEMENTS
This thesis work would not have been possible without the financial support of the
Vanderbilt Physician Scientist Training Program, VUMC discovery grant, and NIH
grants AI50953, NS44044 and HL68744. I would first like to express my deepest
gratitude to Luc Van Kaer for his support throughout my graduate studies. He was always
patient and had best interest for my success, and treated me with respect of a colleague.
As my mentor, he has taught me how to think and write critically as a scientist, and it has
been a great privilege and honor for me to have been under his close tutelage. I would
like to extend my gratitude to all the members of the Van Kaer Lab as well. I will always
be thankful for their friendship and support. In particular, I would like to recognize Saif
Lalani who has worked closely with me throughout this thesis work. Many experiments
were done in collaboration with him and his contributions were essential to the success of
this thesis work. I would like to recognize Vrajesh Parekh whose expertise and help were
also crucial. The techniques that he took the time to personally teach me have been
extremely useful for my research. I would like to thank Tiffaney Vincent who managed
the lab and contributed to my work directly and indirectly. I thank Danyvid Olivares-
Villagomez for his jokes and many interesting discussions, Yanice Mendez-Fernandez
for teaching me the basics of infectious studies, and Lan Wu for her support throughout
the years.
I would like to give thanks to the faculty, students, and staff of the Department of
Microbiology and Immunology, but the efforts and advice of my thesis committee Dr.
Earl Ruley, Dr. Wasif Khan, Dr. Louise Rollins-Smith, and Dr. Guoqiang Gu. Their
iii

helpful suggestions, exciting discussions, and most of all their relentless pursuit for
scientific discovery have contributed significantly to my solid development as a scientist.
I would like to also thank Dr. Derya Unutmaz, the former chair of my thesis committee,
whose help and advices were greatly helpful. I would also like to thank our chairman, Dr.
Jacek Hawiger, for his energy and dedication to the development of budding scientists. I
greatly appreciate the year of support by the Vanderbilt Medical Scientist Training
Program, particularly the leadership by our Director Dr. Terence Dermody. I would like
to thank Dr. Eric Neilson, my MSTP advisor, whose advices and mentoring inspired me
to achieve great goals.
I would like to thank friends for their love and support. I am fortunate to have developed
friendships with several wonderful people during graduate school. These include Roy
Barco, Atuhani Burnett, Alex Stanic, and Kevin Maas for whose friendships I am truly
grateful.
I would like to also thank all my family. Words cannot express my gratitude to my
parents for their love, dedication, encouragement, prayers, and their confidence in me. I
thank them for nurturing me to become who I am. I would like to thank my brother for all
the emotional support he has given me. I would also like to thank members of my wife’s
family for their love and support. Finally, I would like to share this important milestone
in my life and my career with my wife Grace. I have infinite gratitude for her
unconditional love and for sharing good and bad times with me. Without her support,
what I have achieved would not have been possible.
My success in graduate school is an accomplishment in which many people have played a
part and my gratitude extends beyond those whose names are mentioned here.
iv

TABLE OF CONTENTS
Page DEDICATION.................................................................................................................... ii ACKNOWLEDGEMENTS............................................................................................... iii LIST OF TABLES............................................................................................................. ix LIST OF FIGURES .............................................................................................................x LIST OF ABBREVIATIONS.......................................................................................... xiv Chapter I. BACKGROUND AND SIGNIFICANCE..................................................................1
Innate and adaptive immunity..................................................................................1 Natural killer T (iNKT) cells ...................................................................................2 The phenotype of iNKT cells...................................................................................2 iNKT cell responses are restricted by CD1d molecules ..........................................3 Glycolipid antigens for iNKT cells..........................................................................4 iNKT cell response to glycolipid antigens...............................................................6 iNKT cell response to α-GalCer ..............................................................................8 iNKT cells and cancer..............................................................................................9 iNKT cells and autoimmunity.................................................................................10 iNKT cells and infection.........................................................................................10 iNKT cell activation by microbes ...........................................................................12 T cell anergy...........................................................................................................13 Purpose of this thesis work ....................................................................................14 Significance of this thesis work..............................................................................16
II. INDUCTION OF INKT CELL HYPORESPONSIVENESS BY MULTIPLE BACTERIA...............................................................................................................21
v

Abstract ..................................................................................................................21 Introduction............................................................................................................22 Results....................................................................................................................26
Mouse iNKT cells become activated in vivo by diverse bacterial species ......26 Impact of bacteria-induced iNKT cell activation in vivo on the response of splenocytes to subsequent α-GalCer stimulation ex vivo ...........................27 Kinetics of iNKT cell responses in mice treated with heat-killed E. coli or live L. monocytogenes .....................................................................28 Bacteria induce long-term iNKT cell hyporesponsiveness in vivo .................30 Impact of bacteria-induced iNKT cell hyporesponsiveness on ConA-induced hepatitis ...................................................................................31 Impact of E. coli-induced iNKT cell hyporesponsiveness on the therapeutic activities of α-GalCer ......................................................................................31
Discussion..............................................................................................................33 Materials and Methods...........................................................................................37
Mice..................................................................................................................37 Reagents ...........................................................................................................37 Treatment of mice with heat-killed or live bacteria.........................................37 Flow cytometry.................................................................................................38 Measurement of in vivo and in vitro responses to α-GalCer ..........................39 ELISA ...............................................................................................................39 CFSE dilution analysis ....................................................................................39 Assessment of ConA-induced hepatitis ............................................................40 Determination of lung metastases of B16 melanoma ......................................40 Induction and evaluation of EAE .....................................................................40 Statistical analysis ...........................................................................................41
III. THE MECHANISM OF INKT CELL HYPORESPONSIVENESS INDUCED BY BACTERIA...............................................................................................................59
Abstract ..................................................................................................................59
vi
Introduction............................................................................................................60 Results....................................................................................................................63
Role for TLR ligands in bacteria-induced iNKT cell hyporesponsiveness ......63 Role for IL-12 in bacteria-induced iNKT cell hyporesponsiveness ET ...........63 Costimulatory molecules are not required for bacteria-induced iNKT cell hyporesponsiveness .........................................................................64 Bacteria-induced iNKT cell hyporesponsiveness is thymus-independent........64 Bacteria-induced iNKT cell hyporesponsiveness is predominantly cell autonomous ...............................................................................................65 PMA plus ionomycin, or α-GalCer and IL-2, can overcome bacteria-induced iNKT cell hyporesponsiveness .............................................66 Activating receptors are downregulated on hyporesponsive iNKT cells.........67 Nitric oxide is not required for bacteria-induced iNKT cell hyporesponsiveness..........................................................................................67 Programmed Death-1 (PD-1) is upregulated on hyporesponsive iNKT cells induced by α-GalCer or bacteria ..................................................68
Discussion..............................................................................................................69 Materials and Methods...........................................................................................74
Mice..................................................................................................................74 Reagents ...........................................................................................................74 Treatment of mice with heat-killed or live bacteria.........................................74 Flow cytometry.................................................................................................74 Measurement of in vivo and in vitro responses to α-GalCer ..........................74 ELISA ...............................................................................................................74 Isolation of splenic DCs...................................................................................75 Enrichment of iNKT cells.................................................................................75 CFSE dilution analysis ....................................................................................75 Statistical analysis ...........................................................................................76
IV. CONCLUSIONS AND PERSPECTIVES................................................................92 Appendix. CELL-FATE MAPPING OF BONE MARROW STEM CELLS .................107
vii

Abstract ................................................................................................................107 Background and significance...............................................................................109
Role Stem cells ...............................................................................................109 Hematopoietic stem cell (HSC)......................................................................109 Bone marrow multipotent adult progenitor cells (MAPC) copurifying with mesenchymal stem cells (MSC) are pluripotent stem cells ....................110 HSC tissue plasticity ......................................................................................112 Significance....................................................................................................113
Results..................................................................................................................116
Overall strategy .............................................................................................116 C-kit.CreER.ires.eGFP construct...................................................................117 Cell line transfection of c-kit.CreER.ires.eGFP construct.............................119 Pronuclear injection of c-kit.CreER.ires.eGFP construct and pups carrying the transgene ...................................................................................119 CreER expression on bone marrow hematopoietic stem cells .......................119 Adoptively transferred bone marrow stem cells do not contribute to germline parasitism .......................................................................................120
Discussion............................................................................................................122 Materials and Methods.........................................................................................126
Mice................................................................................................................126 Reagents .........................................................................................................126 Cloning of of c-kit.CreER.ires.eGFP construct .............................................126 Genotyping of the transgenic mouse expressing c-kit.CreER.ires.eGFP construct ...................................................................126 Flow cytometry...............................................................................................127 Fluorescent microscopy .................................................................................127
References........................................................................................................................134
viii

LIST OF TABLES
Table Page 1. The role of NKT cells in host defense against bacterial infection............................18
ix

LIST OF FIGURES Figure Page 1. Glycolipid ligands for iNKT cells.............................................................................19 2. Activation of iNKT cells by microbes. .....................................................................20 3. Multiple bacterial microorganisms activate murine iNKT cells...............................42 4. Some bacterial microorganisms induce sustained changes in the prevalence
and surface phenotype of iNKT cells........................................................................43 5. Some bacterial microorganisms induce suppressed response of splenocytes to α-
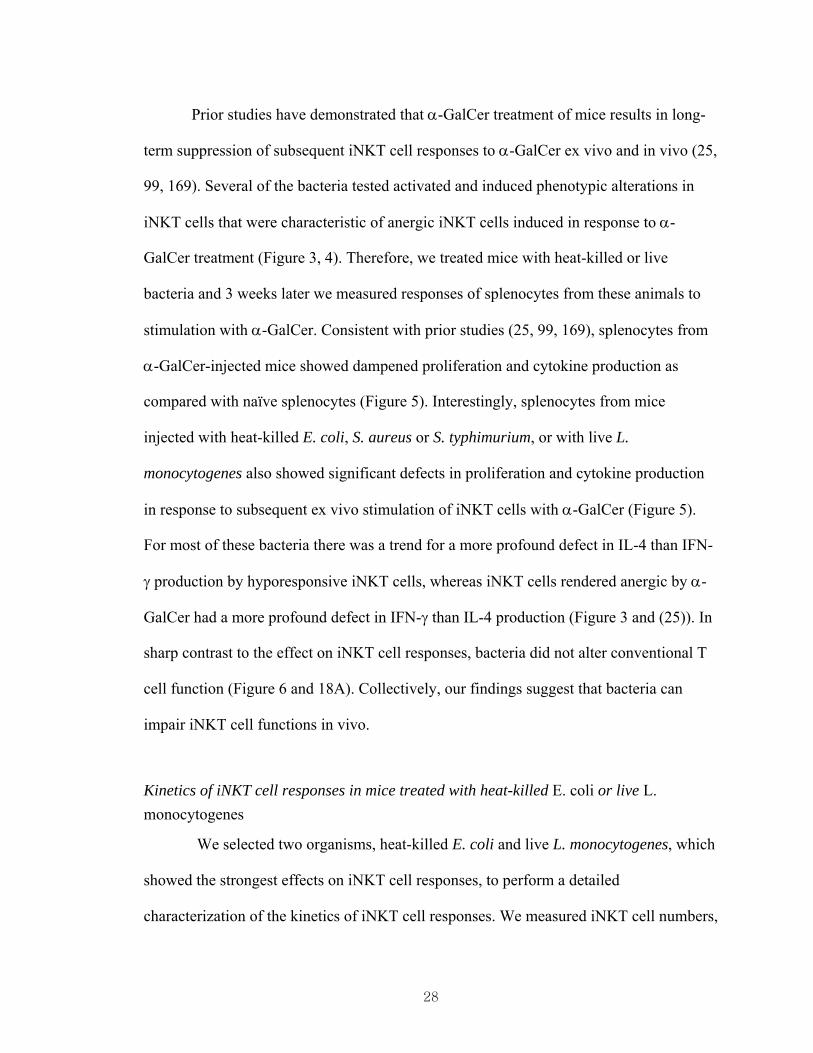
GalCer rechallenge....................................................................................................44 6. The memory response of conventional T cells following L. monocytogenes
infection. ...................................................................................................................45 7. In vivo dynamics of the iNKT cell population in response to heat-killed E. coli.....46 8. In vivo dynamics of NK1.1 expression by iNKT cells in response to
heat-killed E. coli. .....................................................................................................47 9. Heat-killed E. coli induces hyporesponsiveness of iNKT cells to α-GalCer
rechallenge ex vivo. ..................................................................................................48 10. In vivo dynamics of the iNKT cell population in response to L. monocytogenes
infection. ...................................................................................................................50 11. In vivo dynamics of NK1.1 expression by iNKT cells in response to live
L. monocytogenes......................................................................................................51 12. Live L. monocytogenes infection induces hyporesponsiveness of iNKT cells
to α-GalCer rechallenge ex vivo...............................................................................52
x

13. Bacteria can induce iNKT cell hyporesponsiveness to α-GalCer rechallenge
in vivo. ......................................................................................................................53 14. Hyporesponsive iNKT cells are defective in transactivating B cells, DCs and
NK cells in vivo. .......................................................................................................54 15. Both heat-killed and live bacteria induce iNKT cell hyporesponsiveness. ..............55 16. Impact of bacteria-induced iNKT cell hyporesponsiveness on ConA-induced
hepatitis. ....................................................................................................................56 17. Impact of E. coli-induced iNKT cell hyporesponsiveness on the anti-tumor
activities of α-GalCer against B16 tumor lung metastasis formation. .....................57 18. Impact of E. coli-induced iNKT cell hyporesponsiveness on the therapeutic
activities of α-GalCer against EAE. .........................................................................58 19. Role of bacterial TLR ligands in the induction of iNKT cell
hyporesponsiveness...................................................................................................77 20. Role of flagellin in the induction of iNKT cell hyporesponsiveness........................78 21. Role of IL-12 in the induction of iNKT cell hyporesponsiveness. ...........................79 22. Role of IL-12 in bacteria-induced iNKT cell activation.. .........................................80 23. Costimulation is not required for the induction of iNKT cell
hyporesponsiveness...................................................................................................81 24. Bacteria-induced iNKT cell hyporesponsiveness is thymus-independent................82 25. Expression of NK1.1 in euthymic and athymic mice treated with bacteria..............83 26. Surface expression of Ly49 on iNKT cells and NK cells.........................................84
xi

27. Bacteria-induced iNKT cell hyporesponsiveness is predominantly iNKT cell autonomous.. .............................................................................................................85
28. Bacteria-induced iNKT cell hyporesponsiveness is predominantly iNKT cell
autonomous.. .............................................................................................................86 29. Bacteria-induced iNKT cell hyporesponsiveness can be overcome by
treatment with PMA plus ionomycin........................................................................87 30. Bacteria-induced iNKT cell hyporesponsiveness correlates with reduced IL-2
secretion and can be overcome by treatment with α-GalCer plus IL-2....................88 31. Surface expression of NK1.1, NKG2D and CD94 on iNKT cells............................89 32. Nitric oxide does not contribute to the bacteria-induced hyporesponsive
phenotype of iNKT cells. ..........................................................................................90 33. Expression of PD-1 in mice treated with bacteria. ...................................................91 34. The primary and secondary responses of the innate immune system, the
adaptive immune system, and iNKT cells. .............................................................105 35. The model of α-GalCer- or bacteria-induced iNKT cell hyporesponsiveness. ......106 36. The lineage relationship among bone marrow stem cells and progenitor cells. .....128 37. The overall experimental strategy for the cell-fate mapping of
hematopoietic stem cells.. .......................................................................................129 38. The schematic diagram for determining presence or absence of a precursor
population to HSC...................................................................................................130 39. Generation of the transgenic mouse model for the cell-fate mapping of HSC.......131 40. Expression of CreER by the transgenic mouse model............................................132
xii

41. Adoptive transfer of bone marrow stem cells does not result in germline parasitism of the recipient mice.. .............................................................133
xiii

LIST OF ABBREVIATIONS
α-GalCer alpha-galactosylceramide
ALT alanine aminotransferase
APC antigen presenting cell
β2m beta-2-microglobulin
B6 C57BL/6
CD cluster of differentiation
CFA complete Freund’s adjuvant
CFU colony forming unit
CFSE carboxyfluorescein succinimidyl ester
CLP common lymphoid progenitor
CMP common myeloid progenitor
ConA concanavalin A
CTLA-4 cytotoxic T lymphocyte antigen-4
DC dendritic cell
DGK diacylglycerol kinases
EAE experimental autoimmune encephalomyelitis
Egr early growth response
ETP early thymic progenitor
FACS fluorescent-activated cell sorting
FITC fluoresceine isothiocyanate
xiv

HSC hematopoietic stem cell
GAP GTP activating protein
GFP green fluorescent protein
GM-CSF granulocyte-macrophage colony stimulating factor
GMP granulocyte monocyte progenitor
GPI glycophosphatidylinositol
GSC germline stem cell
IFA incomplete Freund’s adjuvant
IFN interferon
iGb3 isoglobotrihexosylceramide
IL interleukin
i.p. intraperitoneal
i.v. intravenous
iNKT invariant natural killer T
KO knockout
LCMV lymphocytic choriomeningitis virus
LIF leukemia inhibitory factor
LPS lipopolysaccharide
MAPC multipotent adult progenitor cell
MCA methylcholanthrene
MHC major histocompatibility complex
MOG myelin oligodendrocyte glycoprotein
MS multiple sclerosis
xv
MSC mesenchymal stem cell
NFAT nuclear factor of activated T cells
NK natural killer
NKT natural killer T
OVA ovalbumin
PAMP pathogen associated molecular pattern
PBS phosphate buffered saline
PD-1 programmed death-1
PD-L1/2 programmed death-ligand 1/2
PE phycoerythrin
PerCP peridinin chlorophyll protein
PMA phorbol 12-myristate 13-acetate
SCF stem cell factor
SEB staphylococcal enterotoxin B
SSEA-1 stage-specific antigen-1
TCR T cell receptor
TGF transforming growth factor
Th1 T helper type 1
Th2 T helper type 2
TLR toll-like receptor
TNF tumor necrosis factor
xvi

CHAPTER I
BACKGROUND AND SIGNIFICANCE
Innate and adaptive immunity
The mammalian immune system is a composite that the innate and adaptive
immune responses work together to protect the host from invading pathogens. The innate
immune system is the first-line defense, and depends on humoral and cellular
components including the complement system, neutrophils, macrophages, dendritic cells
(DCs), mast cells, basophils, eosinophils, and natural killer (NK) cells. The innate
immune system responds non-specifically to conserved molecular patterns present on
pathogens and eliminates them through contact or phagocytocis. As the initial line of
defense against pathogens, the innate immune response is immediate upon exposure to
foreign pathogens. In addition to their direct role in elimination of pathogens, some of the
cells involved in innate immunity also act as antigen presenting cells (APCs) that present
specific antigens to T cells of the adaptive immune system. The adaptive immune system
is maintained through the cooperation of humoral and cellular components as well.
Specific antibodies against invading pathogens are produced by B cells, while direct
killing of pathogens expressing specific antigens is mediated by cytotoxic CD8 T cells.
CD4 T cells orchestrate the immune response of the adaptive immune system through
secretion of various cytokines. The hallmark of the adaptive immune response is the
pathogen- and antigen-specific response and the immunological memory characterized by
1

a delayed weaker primary response and more rapid and robust secondary response (1).
Natural killer T (iNKT) cells
NKT cells are a unique subset of T lineage cells co-expressing T cell receptors
(TCRs) and NK lineage receptors. Although these cells express TCRs and share common
developmental pathways with T cells, many functional characteristics of these cells
categorize them as a component of the innate immune system. Most NKT cells express a
semi-invariant TCR, Vα14-Jα18/Vβ8,Vβ7, or Vβ2 in mouse (2-4), and Vα24-
Jα18/Vβ11 in human (5, 6). Consequently, these cells have a limited ligand repertoire,
and they are referred to as invariant NKT cells (iNKT cells) or Type I NKT cells. The
remaining NKT cells express non-invariant T cell receptors, and have different ligand
specificities (7-11). These cells are referred as Type II NKT cells (12). Both types of NKT
cells are specific for glycolipid antigens presented by the major histocompatibility
(MHC) class I-related protein CD1d, in contrast with conventional T cells that recognize
peptides presented by MHC class I or class II proteins. Although there is growing
evidence for an important immune function of Type II NKT cells (13-16), the focus of
this thesis work is on iNKT cells.
The phenotype of iNKT cells
The phenotype of iNKT cells shows interesting features. Several receptors
commonly found on NK cells are also expressed on iNKT cells, most notably the C-type
lectin NK1.1 (Nkrp1c or CD161) expressed in mouse strains such as C57BL/6.
Engagement of this activation receptor has been shown to bias iNKT cells towards IFN-γ
secretion (17). A significant subset of iNKT cells also expresses NKG2D (18, 19).
2

NKG2D is a highly conserved C-type lectin-like membrane glycoprotein expressed on
most NK cells and on certain T cell subsets. NKG2D acts as an activation receptor for
enhancing cytolytic activity and cytokine secretion, and it has been implicated in T and
NK cell responses against viruses and tumors as well as autoimmunity (20-24). In
addition, some iNKT cells, particularly thymic iNKT cells, express various Ly49
receptors, most of which are inhibitory receptors (25). iNKT cells also express CD94, a
component of the inhibitory receptor CD94/NKG2A or the activating receptor
CD94/NKG2C (25). Approximately 60% of iNKT cells also express CD4, which
enhances TCR signaling in T cells (26-28), and there has been some evidence for distinct
functions of CD4+ and CD4- iNKT cells (29). Also, in comparison to conventional T cells,
the expression level of TCR on iNKT cells is lower, and iNKT cells exhibit an activated
phenotype with high expression level of CD69 and CD44, and low level of CD62L (30,
31).
iNKT cell responses are restricted by CD1d molecules
Reactivity of the semi-invariant TCR of iNKT cells is restricted by CD1d
molecules. The mouse CD1d molecule is encoded by two genes, CD1d1 and CD1d2, on
chromosome 3 (32-35). They exhibit close homology with the human CD1d gene found
on chromosome 1 along with other CD1 family genes, CD1a, b, c, and e (36-40). CD1d
molecules consist of a heterodimer of a glycosylated heavy chain and β2-microglobulin
(41). While related to MHC molecules, CD1d is structurally quite distinct with a binding
pocket well-adapted to bind microbial and endogenous glycolipid antigens (42-44). CD1d
is constitutively expressed on APCs such as DCs, macrophages, and B cells that mediate
activation of iNKT cells in the periphery, and it is particularly abundant on marginal zone
3

B cells in the spleen (45-47). CD1d is also conspicuously present on cortical thymocytes,
and it is required for development of iNKT cells during the selection process. In addition,
high levels of CD1d are found on Kupffer cells, liver sinusoidal endothelial cells, and
hepatocytes of liver where the frequency of iNKT cells reaches 30-50% of total T cells in
mice (48). CD1d is expressed in the intestine (49) and is also upregulated on microglial
cells during inflammation in the brain (50).
Glycolipid antigens for iNKT cells
All iNKT cells react with the glycolipid α-galactosylceramide (α-GalCer)
presented by CD1d. This was the first iNKT cell ligand described, and was originally
isolated from Agelas mauritianus, a marine sponge (51). α-GalCer is a glycosphingolipid,
an uncommon antigen for T cells that usually recognize peptides, and its discovery lent
strong support for the glycolipid reactivity of iNKT cells (52). Although the physiologic
relevance of α-GalCer was doubted early on as the α-anomeric form of glycolipids is
largely absent in mammals, this molecule was crucial in studying iNKT cells. α-GalCer
bound on CD1d elicits extremely strong interaction with murine iNKT cell receptor with
a Kd in the neighborhood of 100 nM (53, 54). The interaction is somewhat weaker with
human iNKT cell receptor, but remains robust. Such conservation of antigen specificity
of iNKT cells is also observed in rats and primates as well (Figure 1A).
More recently, it has become apparent that several microbial glycolipids can act
as ligands for iNKT cells. In particular, iNKT cells react with the α-anomeric
glycosphingolipid derived from the cell wall of Sphingomonas bacteria, a Gram-negative,
LPS-negative α-proteobacterium ubiquitously present in marine and soil environment
(55-57). These glycosphingolipids are strong stimulators of iNKT cells and seem to be
4
important in the host defense against Sphingomonas. Interestingly, Agelas mauritianus is
colonized by Sphingomonas, and it is possible that α-GalCer may actually derive from
this bacterium (58). Also, α-galactosyl-diacylglycerols from the spirochete Borrelia
burgdorferi (59), the etiologic agent of Lyme disease that also lacks LPS, has been shown
to activate iNKT cells and plays an important role in the clearance of infection (Figure
1B).
In addition to relevant roles of microbial iNKT cell ligands during infection,
much attention has been given to identification of endogenous ligands, which were
postulated to mediate autoreactivity of human iNKT cells exhibit to CD1d-expressing
cells both in mice and in humans (60-62). It has been shown that activation of iNKT cells
by certain toll-like receptor (TLR) ligands requires autoreactivity towards CD1d (63, 64).
Autoreactivity is also thought to mediate iNKT cell development in the thymus during
positive and negative selection of iNKT cells as well as their subsequent maturation in
the periphery (65-67). Recent findings have demonstrated that the glycosphingolipid
isoglobotrihexosylceramide (iGb3) can activate a majority of mouse and human iNKT
cells, and Hexb deficient mice lacking lysosomal enzymatic activity to degrade a
precursor lipid to iGb3 also lacked iNKT cells (68-70). However, CD1d tetramer loaded
with iGb3 is unable to stain iNKT cells probably due to weak binding of this molecule to
CD1d. Indeed, it appears a 100-fold higher concentration of iGb3 is required to stimulate
comparable levels of activation of iNKT cells than α-GalCer. A recent detection of iGb3
in thymus has further lent support for the physiological relevance of this molecule (71),
although its detection in the peripheral tissues such as spleen and liver remains to be
demonstrated. A contradictory report also demonstrated that the deficiency in iGb3
synthase, a putative enzyme essential for iGb3 production, did not affect iNKT cell
5

ontogeny and function (72). Nevertheless, it is possible that an alternate synthesis
pathway to iGb3 exists in vivo (Figure 1C).
iNKT cell response to glycolipid antigens
Although a subset of the T cell lineage, iNKT cells seem to play a pivotal
function in bridging innate and adaptive immunity. As the identity of physiological ligand
has remained elusive, the function of these cells has been studied employing α-GalCer
and its derivatives. While iNKT cells are capable of cytotoxic activity through expression
of perforins and granzymes as well as membrane bound tumor necrosis factor (TNF)
family including Fas ligand, their primary immune response seems to involve cytokine
secretion (73-76). The hallmark of iNKT cell activation is rapid secretion of a variety of
cytokines such as interferon (IFN)-γ, interleukin (IL)-4, IL-2, IL-5, IL-10, IL-13, IL-21,
granulocyte-macrophage colony stimulating factor (GM-CSF), TNF-α, and TNF-β
immediately following TCR engagement. Among these cytokines are T helper (Th) 1
cytokines such as IFN-γ that drives cellular immunity against viruses and other
intracellular pathogens as well as cancer, and Th2 cytokines such as IL-4 drives humoral
immunity to upregulate antibody production against extracellular organisms. This is in
direct contrast with naïve conventional T cells that require prolonged primary stimulation
prior to secretion of cytokines, which are also biased to either Th1 or Th2 cytokines,
unlike iNKT cells that can secrete Th1 and Th2 cytokines simultaneously. iNKT cells
initiate IFN-γ and IL-4 transcription during thymic development and abundant mRNA
transcripts are detectable in naïve iNKT cells allowing rapid production of these
cytokines (77). These cytokines secreted by activated iNKT cells amplify the immune
response initiated by iNKT cells through transactivation of other immune cell types,
6

including DCs, NK cells, B cells, conventional T cells, and macrophages (78, 79). iNKT
cells also upregulate CD40 ligand upon activation and crosslink CD40 on DCs inducing
upregulation of CD40 and CD80/CD86, and secretion of IL-12 by DCs, which results in
potentiation of the immune response that begins from DCs (80, 81). Maturation of DCs
also reciprocally affects iNKT cell activation and cytokine production (82-86).
While iNKT cells can produce explosive amounts of Th1 and Th2 cytokines, the
balance between Th1 vs. Th2 cytokines can be variable according to the glycolipid
antigen employed to stimulate iNKT cells. α-GalCer shows equally potent secretion of
Th1 and Th2 cytokines (79). The C-glycoside analogue of α-GalCer, α-C-GalCer
exhibits Th1 bias (79, 87). However, glycolipids with shorter or less saturated lipid chains
such as OCH exhibit a Th2 bias in cytokine production (79, 88-90). The mechanism by
which different glycolipids induce variable cytokine secretion is unclear. One hypothesis
is that the duration and strength of T cell receptor engagement by different glycolipids
might explain differences in cytokine production (91), but TCR on and off rates
determined by plasmon resonance or crystal structures of CD1d have shown minor
differences among various glycolipids (43). Alternatively, it is possible that glycolipid
trafficking and uptake might depend on lipid solubility and differences in lipid solubility
owing to modifications of lipid chains that might result in increased or decreased uptake
by APCs such as DCs that in turn secrete the Th1-inducing cytokine IL-12 (43, 92). Also,
differences in tissue distribution of glycolipids might result in variable cytokine
production as tissues may offer different cytokine milieu in which iNKT cells are
activated.
7
iNKT cell response to α-GalCer
During the primary response of naïve conventional peptide-reactive T cells, a
strong antigenic stimulation in conjunction with adequate costimulation is followed by a
prolonged period of maturation of these naïve cells into mature effector cells, which can
take several days. After clearance of the particular antigen, a population of memory T
cells with the same antigen specificity emerges to mount a more rapid and effective
resolution of the secondary challenge (1).
The response of lipid-reactive iNKT cells is quite distinct from that of
conventional T cells. A detailed analysis of the in vivo response of murine iNKT cells to
α-GalCer has been reported by our laboratory and others. The response of iNKT cells has
been assessed using the CD1d-tetramer loaded with α-GalCer (93, 94), which specifically
binds to the invariant TCR of iNKT cells. With appropriate fluorochromes linked to the
tetramer, iNKT cells can be identified by flow cytometry. Consistent with the activated
phenotype exhibited by naïve iNKT cells, these cells downregulate their TCR and NK1.1
immediately following the primary α-GalCer challenge (95-97), which renders these cells
undetectable to staining by CD1d tetramer loaded with α-GalCer. As early as 24 hours
after injection their TCR is re-expressed, but NK1.1 remains downregulated for several
months. During this time, iNKT cells undergo an extensive in vivo expansion reaching
maximal levels by day 3 with 10- to 15-fold increase in cellularity in spleen. In vivo
expansion of iNKT cells is also observed in other organs such as lymph nodes, peripheral
blood, liver and bone marrow, but no expansion is observed in thymus. Following the
peak response, iNKT cells gradually decrease in number to levels slightly lower than
before α-GalCer treatment.
The secondary response by iNKT cells following rechallenge with α-GalCer is
8

characterized by a hyporesponsive phenotype (25, 98, 99). For at least 1 month after the
initial challenge, iNKT cells show significantly suppressed capacity to proliferate and
secrete cytokines in response to rechallenge with α-GalCer. This decrease in cytokine
production is associated with inability of iNKT cells to transactivate DC, B cells and NK
cells. The hyporesponsive phenotype of iNKT cells induced by the initial α-GalCer
challenge was shown to be cell autonomous indicating that these iNKT cells are in an
anergic state. These anergic iNKT cells are unable to show anti-tumor activities in B16
melanoma metastasis model, and thus α-GalCer-induced anergy may limit the utility of
iNKT cell-based therapies.
iNKT cells and cancer
iNKT cells may function in immune surveillance against cancer even in the
absence of exogenous stimulation of iNKT cells by α-GalCer (100). In patients with
many forms of cancer, such as myelodysplastic syndromes, iNKT cell function was found
to be severely compromised. Also, studies of a fibrosarcoma carcinogenesis model
induced by methylcholanthrene (MCA), a chemical carcinogen, revealed the protective
effects of iNKT cells against cancer. This protection was found to be mediated by IL-12
and cytolytic activity of iNKT cells. A subsequent study has shown that the NKT-NK axis
of activation was also critical for suppression of MCA-induced carcinogenesis (101).
However, this tumor model is the only example providing evidence for physiological
tumor surveillance by iNKT cells in the absence of exogenous stimulation of these cells.
α-GalCer was first identified while screening for the molecule responsible for
anti-tumor activity against B16 melanoma in marine sponge, and as such, the role of
iNKT cells in protection against cancer has been carefully studied. Results have shown
9

promising anti-tumor effects in various types of metastatic malignancy by α-GalCer and
its analogs as well as DC pulsed with α-GalCer (102).
More importantly, a number of clinical studies on iNKT cell-based therapy
employing α-GalCer or α-GalCer-pulsed DC are underway (103-107). A phase I study of
α-GalCer carried out in the Netherlands has shown no significant dose-limiting side
effects or toxicity, and α-GalCer was well tolerated by patients (106). However, no
significant anti-tumor effect with clinical improvement was observed with this initial
study. Because α-GalCer-pulsed DC exhibit more potent effects against B16 melanoma
metastasis (108, 109), Nakayama and colleagues carried out a phase I clinical trial using
α-GalCer-pulsed DC on advanced non-small cell lung cancer patients and have seen
some clinical improvements (105). Nicol and colleagues have also reported some success
during phase I clinical trial of α-GalCer-pulsed DC involving patients with metastatic
malignancy (110).
iNKT cells and autoimmunity
Potent immunomodulatory function of iNKT cells has been exploited to impart
protection against a number of autoimmune disorders including type I diabetes,
experimental autoimmune encephalomyelitis (EAE), rheumatoid arthritis, systemic lupus
erythematosus, and inflammatory bowel disease (111-125). Successful protection or
amelioration against certain autoimmune disease models, in particular, Type I diabetes,
EAE, and rheumatoid arthritis, have been observed employing α-GalCer and its
derivatives to impart Th2 bias as pathogenic cells have been indicated to be Th1 biased
cells destroying the tissue of interest. However, treatment efficacy depended on the dose,
route and timing of administration as well as the number of injections and the strain of
10
mice used in the particular study. Such results reflect the complexity of iNKT cell
functions in the modulation of the immune system. The delicate balance between Th1 and
Th2 cytokines seems to be crucially regulated by iNKT cells, and further understanding
of their normal functions as well as their responses to pharmacologic ligands is necessary
to fully cultivate their therapeutic potential in treatment of autoimmune diseases.
iNKT cells and infection
Most of the known iNKT cell antigens have the α-anomeric form that is not
found in mammals. Few exceptions include β-GalCer and iGb3 with relatively weak
activity compared to α-anomeric ligands. It has therefore been speculated that these cells
might have originally arisen in defense against foreign microbes. Because iNKT cells
have the capacity to rapidly produce cytokines that can enhance immune responses by
DCs, NK cells, and conventional T and B cells, these cells were thought to bridge and
amplify the host immune response during early phases of the immune response. A whole
body of literature now exists revealing the importance of these immunomodulatory cells
during infection with bacteria, viruses, fungi and parasites (126). The role of iNKT cells
during infection was assessed by using Jα18 deficient mice that specifically lack iNKT
cells, or CD1d deficient mice that lack iNKT cells as well as non-invariant CD1d
restricted T cells, or neutralizing antibody against CD1d. As iNKT cells function
primarily as immunomodulators, outcome of infection was in some cases ameliorated in
the absence of iNKT cell function. Moreover, iNKT cell contribution to host defense was
sometimes variable according to the bacterial strain, route of administration, and strain of
mice used. For instance, intranasal infection with the D4 strain of Pseudomonas
aeruginosa exacerbated infection in CD1d deficient mice (127), whereas intratracheal
11

infection of PAO1 strain of Pseudomonas aeruginosa showed no significant difference in
the severity of disease in Jα18 deficient mice (128). Interestingly, bacteria that are known
to express microbial glycolipid antigens for iNKT cells, Sphingomonas and Borrelia
burgdorferi, have been found to depend on iNKT cell function for efficient clearance (55,
56, 59, 129, 130). More examples of the role for iNKT cells during bacterial infection are
summarized in Table 1.
iNKT cell activation by microbes
Activation of conventional T cells requires recognition by the TCR of specific
peptide antigen derived from microbial proteins. Activation of iNKT cells by microbes is
unique in that even in the absence of direct recognition of cognate glycolipid antigen
derived from microbes by the TCR, iNKT cells have been shown to be involved in the
clearance of diverse species of microbes. This non-specific activation of iNKT cells,
putting them in the category of the innate immune system, can be explained by two
modes iNKT cell activation, the direct mechanism and the indirect mechanism.
The direct mechanism of iNKT cell activation relies on the presence of microbial
glycolipid antigen that is presented by CD1d molecules on APC and directly engages the
semi-invariant TCR (Figure 2A). Early studies have shown that
glycophosphatidylinositol anchor purified from Plasmodium and Trypanosoma species
(131), lipophosphoglycan extract from Leishmania donovani (132), and phosphatidyl
inositol tetramannosides enriched from Mycobacterium can activate a minor subset of
iNKT cells (133), although some of these results remain controversial. Subsequently,
variants of glycosphingolipids in Sphingomonas capsulata (55, 130, 134) and galactosyl
diacylglycerol antigens from Borrelia burgdorferi (59) have been found to strongly
12

activate most iNKT cells.
However, the vast majority of pathogens are not considered to express microbial
antigens specific for iNKT cells. These pathogens activate iNKT cells through an indirect
mechanism of activation that does not rely on specific recognition of microbial glycolipid
antigens and instead is mediated by activation of DCs by pathogen-associated molecular
patterns (PAMPs), which in turn leads to non-specific activation of iNKT cells (Figure
2B). In response to LPS from Salmonella typhimurium, TLR signaling in DCs induces
IL-12 secretion, which in conjunction with CD1d presentation of hypothetical
endogenous ligand activates iNKT cells (55, 63). However, variations on this theme of
iNKT cell activation have been noted. For instance, iNKT cell activation by DCs
sensitized with Schistosoma mansoni eggs has been shown to dependent on endogenous
antigen alone (135). In the case of Escherichia coli LPS, release of proinflammatory
cytokines such as IL-12 and IL-18 by DCs is sufficient for iNKT cell activation, and
autoreactive TCR engagement by endogenous ligand is not required (136).
T cell anergy
Anergy is defined as a tolerance mechanism involving the intrinsic functional
inactivation of lymphocytes in response to antigen encounter (137). Anergy is often
evoked, either in vivo or ex vivo, by the unbalanced stimulation of lymphocytes through
antigen receptors, in the absence of co-stimulatory signals, by chronic antigen stimulation,
or by stimulation with weak agonist antigens in the presence of full co-stimulation (137).
The precise molecular and biochemical events responsible for the development and
maintenance of the anergic state remain to be fully characterized, and might differ for the
particular tolerance model studied (138). Studies with multiple anergy models have
13

demonstrated a critical role for the mobilization of intracellular free Ca2+ (139), resulting
in activation of the Ca2+-sensitive protein phosphatase calcineurin and the nuclear factor
of activated T cells (NFAT) (140). NFAT (most notably NFAT1), activated in the absence
of its transcriptional partner AP-1 (Fos/Jun), then enters the nucleus and induces the
transcription of a variety of anergy-associated genes, including the early growth response
gene 2 (Egr2) and Egr3 (141), the E3 ubiquitin ligases GRAIL, Cbl-b, and Itch (142, 143),
and diacylglycerol kinases (DGK)-α and -ζ (144-146). Egr2 and Egr3 are transcription
factors that are thought to be important for the induction of anergic factors, possibly
including several of the E3 ubiquitin ligases (141). The anergy-associated ubiquitin
ligases are thought to promote the monoubiquitination of a variety of receptors and
signaling components (147, 148). It has been suggested that these events, together with
the termination of diacylglycerol-dependent signaling mediated by activated DGKs, lead
to uncoupling of the TCR from downstream signaling events, most notably Ras activation.
As a consequence of these abnormalities in proximal signal transduction, defective IL-2
gene transcription is a common characteristic of T cell anergy (137). In many cases, the
anergic phenotype can be reversed by withdrawal of the anergy-inducing stimulus, by
exposure to signals (e.g., ionomycin plus phorbol myristate acetate) that bypass proximal
TCR signaling events and/or by exposure to exogenous IL-2 (137).
Purpose of this thesis work
Past studies in our laboratory have found that, unlike conventional T cells that
exhibit memory responses, iNKT cells undergo a long period of anergy following a single
injection of α-GalCer, a potent synthetic ligand for iNKT cells. This result might have
biological significance in that the primary response of iNKT cells is already extremely
14
strong with an explosive secretion of various cytokines and extensive transactivation of
other immune cells. Furthermore, iNKT cells mount non-specific responses to multiple
pathogens. Repeated responses of iNKT cells at high magnitude might do more harm
than good as the tissue damage during infection is often a result of the excessive immune
responses. In this light, limiting the subsequent activity of iNKT cells following the initial
activation might be beneficial.
Recently, with identification of various microbial glycolipid antigens for iNKT
cells, there is growing evidence that iNKT cells have important functions during host
defense against pathogenic microbes in addition to their crucial roles in autoimmunity
and tumor surveillance. In fact, iNKT cells have been found to play an important role
during immune responses against pathogenic bacteria, viruses, fungi and parasites; and
this iNKT cell activity during infection may be the original function for this relatively
small subset of T cells when viewed from an evolutionary perspective. It has been found
that these cells with a limited TCR repertoire can mount a response to a wide array of
pathogens in the presence of specific microbial glycolipid antigens for iNKT cells, or
even in the absence of a cognate antigen indirectly through combination of
proinflammatory cytokines from APC in conjunction with presentation of endogenous
autoantigens. Although the role of iNKT cells in defense against invading pathogens has
been well documented, the impact of pathogens on iNKT cells remains incompletely
understood.
In this context, I tested the hypothesis that bacteria induce long-term
hyporesponsiveness of iNKT cells. This hypothesis was tested in two integrated Specific
Aims. In Aim 1, I tried to determine whether bacteria induce long-term phenotypic
changes in iNKT cells accompanied by induction of a hyporesponsive state, and how this
15

relates to iNKT cell function in disease models. The results from this aim are reported in
Chapter II. In Aim 2, the mechanism of iNKT cell hyporesponsiveness induced by
bacteria was explored, and the results are reported in Chapter III.
Significance of this thesis work
Since identification of iNKT cells, their immunomodulatory functions have
attracted significant attention throughout the scientific community for their therapeutic
potential. In the past several years, significant advances were made in the field of iNKT
cell biology aided by development of important tools to study iNKT cells including CD1d
deficient mice, generated in our own laboratory and others, CD1d tetramers, and other
reagents, providing novel insights into the importance of this relatively small subset of T
cells that have key immunomodulatory functions during various immune responses. A
wide variety of glycolipid antigens for invariant TCRs of iNKT cells have been identified
and the response of iNKT cells to these antigens has been carefully tested and
documented. The therapeutic potential of iNKT cells has been explored and expansive
amounts of research have been performed to delineate the role of iNKT cells against
various types of cancer, autoimmune disorders, and infection. Recently, several clinical
trials have been initiated, using α-GalCer or α-GalCer-pulsed DCs to treat cancer. During
these clinical trials, it has become apparent that iNKT cell number and function has wide
individual variability in humans, which likely is contributed by genetic factors as well as
environmental factors. In this thesis work, I present evidence that infection by pathogenic
bacteria, which is a regular occurrence in the human population, and more so in cancer
patients or patients with autoimmune disorders who are often immunocompromised due
to the disease itself or due to the treatment, impacts iNKT cell function with long-term
16

effects on therapeutic activity of these cells. This result might in part explain some of the
difficulties encountered during clinical application of iNKT cell-based immunotherapy
and an may provide insight into the design of clinical protocols to optimize efficacy of
treatment.
17

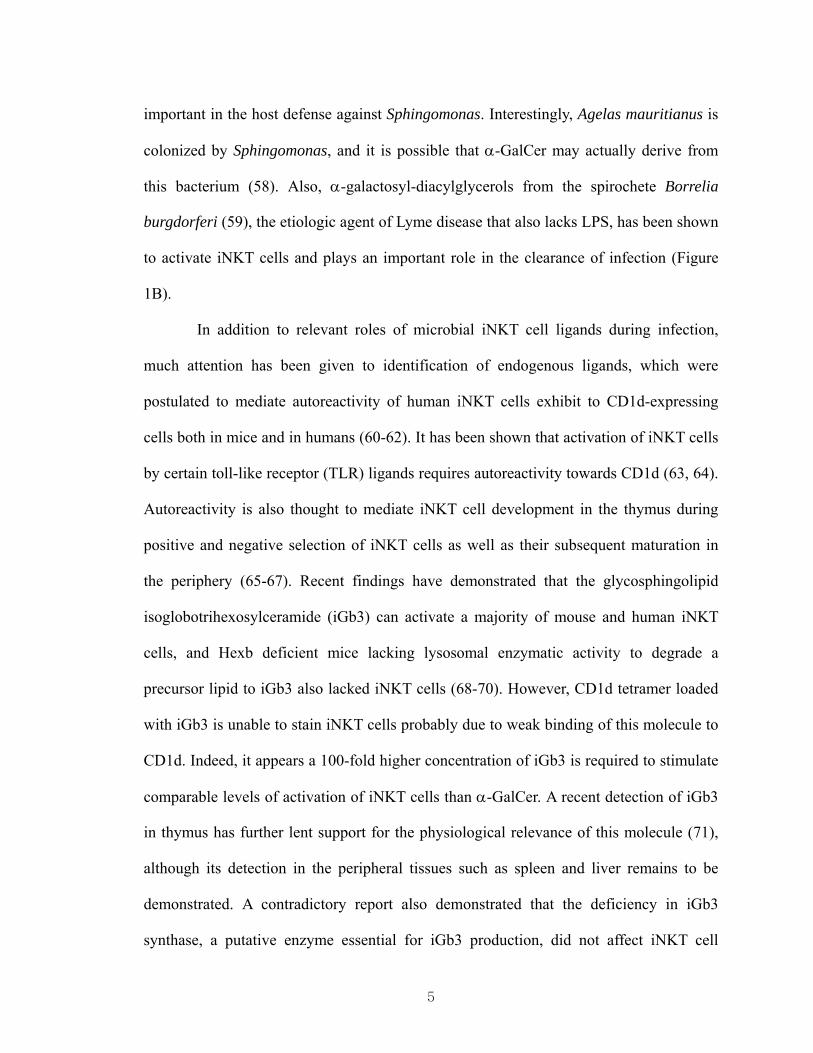
Table 1. The role of NKT cells in host defense against bacterial infection. The table summarizes results from an extensive collection of articles on the role of NKT cells during bacterial infection. Various strains of bacteria were introduced into mice of the indicated strain, with NKT cells deficient or neutralized by disruption of CD1d or Ja18, or injection of blocking antibody against CD1d. CFU: colony forming unit.
18

NH OH
OH
(CH2) 12CH3
(CH2) 23CH3
OOH
HO
HO OH
OO
NH OH
OH
(CH2) 12CH3
(CH2) 23CH3
OHHO
HO OH
OO
NH OH
OH
(CH2) 3CH3
(CH2) 21CH3
OOH
HO
HO OH
OO
A
α-GalCer
OCH
α-C-GalCer
NH OH
OH
(CH2) 12-14CH3
(CH2) 11-16CH3
OOH
HO
HO OH
OO
OOH
NH OH
OH
(CH2) 12-14CH3
(CH2) 11-16CH3
OOH
HO
HO OH
OO
OOH
B
α-GlcA-Cer
α-GalA-Cer
O
O (CH2)7
(CH2) 13CH3
OOH
HO
HO OH
OO
(CH2) 7CH3
BbGL-IIc
C NH
OH
(CH2) 12CH3
(CH2) 23CH3O
OH
O
OHHO
O
OH
OO
HO OH
OOH
HO
HO OH
O iGb3 OH
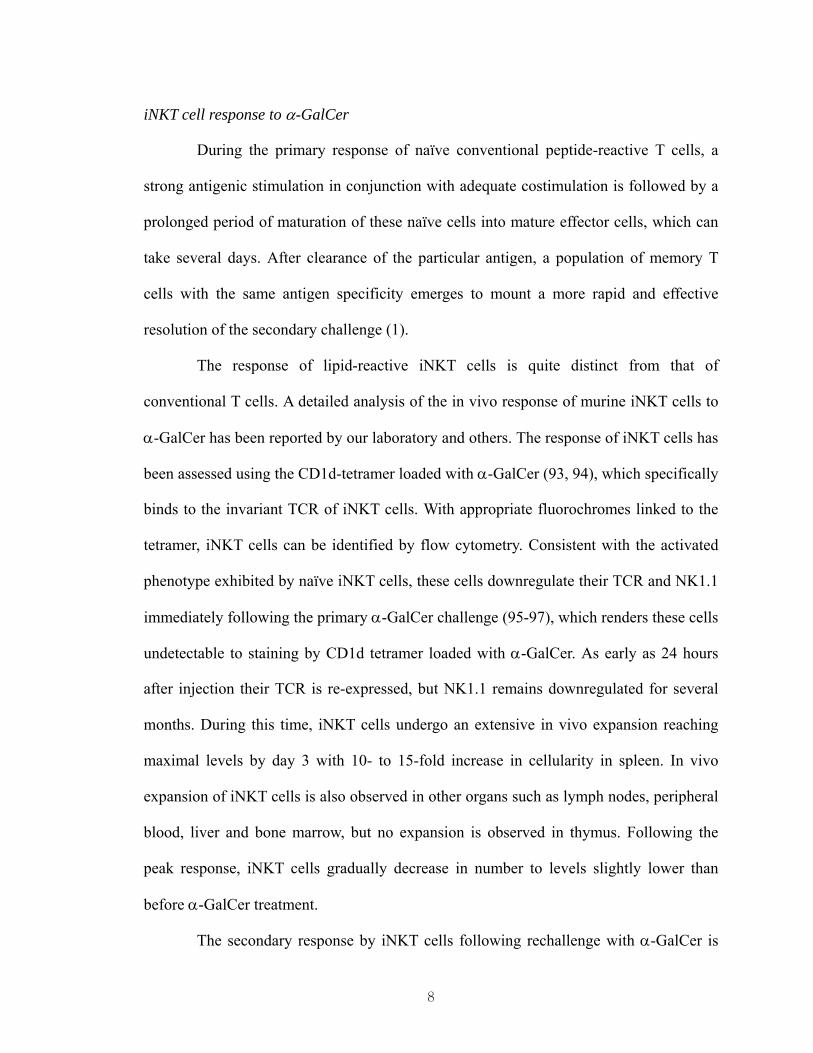
Figure 1. Glycolipid ligands for iNKT cells. (A) Synthetic glycolipid ligands for iNKT cells. α-GalCer is the synthetic derivative of a potent iNKT cell antigen purified from a marine sponge. OCH is a variant of α-GalCer with a shortened sphingosine chain. α-C-GalCer is a C-glycoside analogue of α-GalCer. (B) Microbial glycolipid ligands for iNKT cells. α-GlcA-Cer and α-GalA-Cer are microbial glycolipid ligands present in Sphingomonas capsulata. BbGL-IIc is a microbial glycolipid ligand in Borrelia Burgdorferi. (C) Endogenous glycolipid ligand for iNKT cells. Isoglobotrihexosylceramide (iGb3) is an endogenous glycolipid antigen that appears to mediate autoreactivity of iNKT cells in the absence of an exogenous ligand.
19

IFN-γ/IL-4
DC iNKT
Microbial glycolipid antigen
IL-12
IL-12RIFN-γ
SalmonellaLPS
IL-12
DC iNKT
Endogenous ligand
TCRCD1d
TCRCD1d
IL-4
S. manonieggs
DC iNKTTCRCD1d
IL-12RIFN-γ
E. coli LPS
IL-12
DC iNKT
TCR
Endogenous ligand
A
B
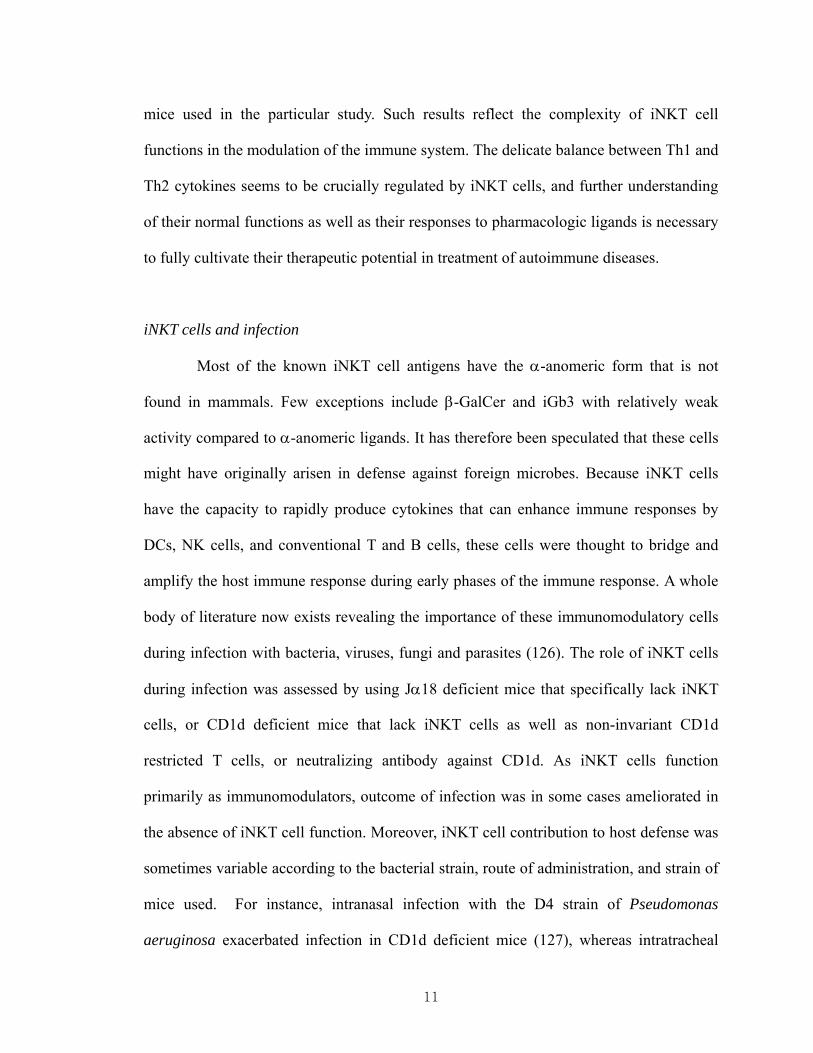
Figure 2. Activation of iNKT cells by microbes. (A) Direct activation of iNKT cells by microbial glycolipid ligands. Certain microbes such as Sphingomonas capsulata or Borrelia burgdorferi express microbial glycolipid ligands that can be presented by CD1d on APC and engage with TCR of iNKT cells. (B) Indirect activation of iNKT cells by microbial products. Salmonella LPS activates DCs which present the endogenous ligand and secrete IL-12 to activate iNKT cells to secrete IFN-γ. Activation of iNKT cells and the resultant secretion of IFN-γ by E. coli LPS is solely dependent on cytokine secretion by DCs such as IL-12 or IL-18. S. mansoni eggs sensitize DCs to present an endogenous ligand to iNKT cells, and this activation results in IL-4 secretion by iNKT cells.
20

CHAPTER II
INDUCTION OF INKT CELL HYPORESPONSIVENESS BY
MULTIPLE BACTERIA
Abstract
Invariant natural killer T (iNKT) cells are innate-like lymphocytes that recognize
glycolipid antigens in the context of the MHC class I-like antigen-presenting molecule
CD1d. Our laboratory has previously demonstrated that in vivo activation of iNKT cells
with the glycolipid α-galactosylceramide (α-GalCer) in mice results in the acquisition of
a hyporesponsive or anergic phenotype by these cells. Because iNKT cells can become
activated in the context of infectious agents, we have evaluated whether iNKT cell
activation by microorganisms can influence subsequent responses of these cells to
glycolipid antigen stimulation. We found that murine iNKT cells activated in vivo by
multiple bacterial microorganisms became unresponsive to subsequent activation with α-
GalCer. This hyporesponsive phenotype of iNKT cells was associated with changes in
the surface phenotype of these cells, reduced severity of Concanavalin A-induced
hepatitis, and alterations in the therapeutic activities of α-GalCer. These findings have
important implications for the development of iNKT cell-based therapies.
21

Introduction
Conventional T cells respond to invading pathogens through recognition of
specific antigenic peptides derived from the pathogens and presented by MHC Class I or
Class II molecules on APCs. Conventional T cells are able to amount a response to a
wide range of non-self peptides through a diverse TCR repertoire achieved through
somatic recombination and the positive and negative selection process during
development in the thymus. The primary response of naïve conventional T cells towards
pathogen-derived peptides is characterized by a delayed and moderate response, which
requires time to generate mature effector cells to adequately control infection. Once the
pathogen is cleared however, a population of memory T cells emerges that can rapidly
and effectively resolve subsequent infection by the same pathogen. Conventional T cells
therefore exhibit classic features of the adaptive immune system (1).
Unlike conventional T cells, iNKT cells have a severely restricted TCR
repertoire. These cells express a semi-invariant T cell receptor, Vα14-Jα18/Vβ8,Vβ7, or
Vβ2 in mouse (2-4), and Vα24-Jα18/Vβ11 in human (5, 6). Interestingly, the TCRs of
iNKT cells are reactive to glycolipid ligands. The most well-documented glycolipid
ligand for iNKT cells is α-GalCer, a potent synthetic derivative of a marine sponge
product that elicits a strong response by iNKT cells.
The iNKT cell response was originally studied using antibodies against TCRβ
and NK1.1 to identify iNKT cells. In vivo administration of anti-CD3, IL-12, or α-
GalCer in mice resulted in rapid disappearance of these cells in all organs except thymus
and bone marrow (163). It was initially proposed that in vivo administration of iNKT cell
antigens resulted in activation-induced cell death of iNKT cells. However, apoptotic
22

disappearance of iNKT cells following activation was unable to explain extensive
proliferation of iNKT cells observed in vitro (164, 165). This original hypothesis was
revised when CD1d tetramers that can specifically stain for the semi-invariant TCR of
iNKT cells became available (95-97). It was determined that the apparent loss of iNKT
cells during early phases of iNKT cell responses to antigens was due to profound
downregulation of NK1.1 and the TCR by iNKT cells rendering these cells undetectable
by conventional methods of identification using anti-TCRβ and anti-NK1.1 antibodies.
Additional studies revealed that this TCR downregulation was transient and the cells
could be detected as early as 24 hours following initial activation using CD1d tetramer
staining once TCR levels returned to normal levels even though NK1.1 downregulation
was sustained and persisted even 6 months after initial activation (95-97).
During the primary response naïve iNKT cells have been shown to undergo
extensive in vivo expansion following α-GalCer treatment (95, 96). Maximal expansion
was observed around 3 days after the treatment reaching 10 to 15 fold increase in the
number of iNKT cells in spleen. Once iNKT cell numbers reached their peak, they
gradually declined to untreated levels by 10-14 days and continued to decline over the
period of several months. In summary, during the primary response of iNKT cells to in
vivo α-GalCer stimulation, iNKT cells undergo transient downregulation of TCR
followed by rapid clonal expansion and homeostatic contraction accompanied by
downregulation of NK1.1.
Adaptive immunity is characterized by initially latent and weaker primary
responses, and rapid and explosive memory responses, and T cells are an integral part of
the adaptive immune system critical for clearance of foreign pathogens (1). Although
iNKT cells are a subset of T cells, these cells do not show memory responses during the
23

recall response to α-GalCer, and instead exhibit an anergic response characterized by
absence of clonal expansion and cytokine production. Studies from our laboratory and
others provided a detailed documentation of the secondary response shown by iNKT cells
following rechallenge with α-GalCer in mice previously treated with α-GalCer (25, 98,
99). When splenocytes were rechallenged ex vivo following different time points after a
single dose of α-GalCer, iNKT cells no longer exhibited extensive proliferation and
cytokine production in response to α-GalCer normally observed in naïve animals. This
blockade in iNKT cell response was prolonged and was observed for at least 1 month.
Among various cytokines normally produced by iNKT cells, blockade in IFN-γ was more
pronounced than IL-4. Loss of cytokine secretion during secondary challenge was also
accompanied by absence of transactivation of DC, B and NK cells. This suppressed
iNKT cell activity during the recall response was associated with loss of anti-tumor
activities of these cells in the B16 melanoma metastasis model, but interestingly the
protective effect for EAE was retained. As a result, this anergic phenotype of iNKT cells
induced by α-GalCer has been implied as a limiting factor for therapeutic application of
iNKT cell-based therapies using α-GalCer and its analogues.
The role of iNKT cells during immune defense against microbial pathogens is
well documented. Since Brenner and colleagues have postulated a model of physiological
iNKT cell activation during infection dependent on autoreactive CD1d presented
endogenous ligand and IL-12 during Salmonella typhimurium infection (63), it has
become apparent that even with a limited repertoire of the semi-invariant T cell receptor,
iNKT cells are able to be activated and respond to a broad spectrum of pathogens.
Additionally, several specific microbial lipid antigens that bind to CD1d and activate
iNKT cells have been identified in Sphingomonas capsulata (55, 130, 134) and Borrelia
24

burgdorferi (59).
During the primary response of iNKT cells to S. typhimurium, which is now
thought to activate iNKT cells through toll-like receptor (TLR) ligands such as LPS and
flagellin, a similar disappearance of iNKT cells around 3 to 5 days after infection was
observed when these cells were identified based on the surface expression of TCRβ and
NK1.1 as was also observed with α-GalCer (166-168). Consistent with the α-GalCer
studies, iNKT cells remained detectable during those time periods when studied with α-
GalCer-loaded CD1d tetramer, and the initial result of iNKT cell disappearance was
attributed to profound downregulation of NK1.1 (96). As results from studies with α-
GalCer have shown that NK1.1 downregulation by iNKT cells coincided with long-term
periods of suppressed iNKT cell function following initial activation by α-GalCer (25, 98,
99), bacteria may also induce iNKT cell hyporesponsiveness. Based on these previous
studies, we hypothesized that iNKT cells can be activated by multiple bacterial organisms,
and we evaluated a large panel of bacteria for their impact on the phenotype, functions,
and therapeutic activities of iNKT cells.
25

Results
Mouse iNKT cells become activated in vivo by diverse bacterial species.
Prior studies have shown that iNKT cells can become activated in response to
various infectious agents, either through direct recognition of microbial glycolipid
antigen, or indirectly through cytokines secreted by DCs in conjunction with endogenous
antigens expressed by activated DCs (126). We tested the capacity of a wide variety of
bacteria, including the gram-positive organisms Listeria monocytogenes and
Staphylococcus aureus, and the gram-negative organisms Escherichia coli, Salmonella
typhimurium, and Sphingomonas capsulata to activate iNKT cells and to modulate the
functions of these cells. As we were primarily interested in the long-term effects of
bacterial microorganisms on iNKT cell functions, the choice of bacteria was not limited
to known pathogens that depend on iNKT cells for their clearance. Apart from L.
monocytogenes and S. capsulata, bacteria were heat-killed prior to challenge. Activation
of iNKT cells was assessed by their prevalence and numbers and by their surface
phenotype, such as expression of CD69, an early activation marker, and NK1.1, which
becomes downregulated on activated iNKT cells (95, 96) and remains expressed at low
levels on iNKT cells rendered anergic in α-GalCer-treated animals (25). Analyses were
performed 24 hrs after i.v. injection of bacteria. Naïve mice and mice injected with 5 μg
α-GalCer were used as controls.
Consistent with prior studies (95-97), 24 hrs after α-GalCer injection, TCR
downregulation rendered iNKT cells undetectable by tetramer staining (Figure 3). Minor
decreases in iNKT cell numbers were observed in the spleens of mice injected with L.
monocytogenes and S. aureus, and in livers of mice injected with L. monocytogenes, S.
26

aureus, S. capsulata and S. typhimurium. Differences in iNKT cell numbers in the liver
reached statistical significance only after L. monocytogenes and S. capsulata injections.
Each of the bacterial organisms tested induced upregulation of CD69 on iNKT
cells, suggesting activation of these cells. However, the extent of CD69 upregulation was
variable, reflecting potential differences in the degree or kinetics of iNKT cell activation
induced by distinct organisms. NK1.1 downregulation by spleen iNKT cells was
observed for heat-killed S. aureus, S. typhimurium, and live L. monocytogenes, but was
less evident for heat-killed E. coli and live S. capsulata. The changes observed in hepatic
iNKT cells mirrored changes in splenic iNKT cells, except for downregulation of NK1.1,
which was only evident for S. aureus and S. typhimurium (Figure 3).
Next, we examined the prevalence, cell number and surface phenotype of iNKT
cells 3 weeks after injection of α-GalCer or bacteria. Consistent with prior studies (25),
α-GalCer injection resulted in a modest decrease in the frequency of iNKT cells in the
spleen and liver accompanied by sustained NK1.1 downregulation in spleen (Figure 4).
Similar changes were observed in mice that received heat-killed E. coli, S. aureus or S.
typhimurium. Notably, inoculation of live L. monocytogenes resulted in a substantial loss
of iNKT cells and sustained downregulation of NK1.1. By contrast, S. capsulata did not
induce sustained changes in the surface phenotype of iNKT cells.
In summary, all bacteria tested were able to induce early activation of iNKT cells,
but the changes in surface phenotype of these cells induced by different bacteria were
distinct, and were different from the phenotype of iNKT cells induced by α-GalCer.
Impact of bacteria-induced iNKT cell activation in vivo on the response of splenocytes to subsequent α-GalCer stimulation ex vivo
27
Prior studies have demonstrated that α-GalCer treatment of mice results in long-
term suppression of subsequent iNKT cell responses to α-GalCer ex vivo and in vivo (25,
99, 169). Several of the bacteria tested activated and induced phenotypic alterations in
iNKT cells that were characteristic of anergic iNKT cells induced in response to α-
GalCer treatment (Figure 3, 4). Therefore, we treated mice with heat-killed or live
bacteria and 3 weeks later we measured responses of splenocytes from these animals to
stimulation with α-GalCer. Consistent with prior studies (25, 99, 169), splenocytes from
α-GalCer-injected mice showed dampened proliferation and cytokine production as
compared with naïve splenocytes (Figure 5). Interestingly, splenocytes from mice
injected with heat-killed E. coli, S. aureus or S. typhimurium, or with live L.
monocytogenes also showed significant defects in proliferation and cytokine production
in response to subsequent ex vivo stimulation of iNKT cells with α-GalCer (Figure 5).
For most of these bacteria there was a trend for a more profound defect in IL-4 than IFN-
γ production by hyporesponsive iNKT cells, whereas iNKT cells rendered anergic by α-
GalCer had a more profound defect in IFN-γ than IL-4 production (Figure 3 and (25)). In
sharp contrast to the effect on iNKT cell responses, bacteria did not alter conventional T
cell function (Figure 6 and 18A). Collectively, our findings suggest that bacteria can
impair iNKT cell functions in vivo.
Kinetics of iNKT cell responses in mice treated with heat-killed E. coli or live L. monocytogenes
We selected two organisms, heat-killed E. coli and live L. monocytogenes, which
showed the strongest effects on iNKT cell responses, to perform a detailed
characterization of the kinetics of iNKT cell responses. We measured iNKT cell numbers,
28

expansion, surface phenotype and functions at different time points after treatment.
After treatment with heat-killed E. coli there was a modest decrease in total
numbers of splenic iNKT cells over time (Figure 7A, B), but this did not reach statistical
significance. The frequency of liver iNKT cells on the other hand dropped between 3 and
4 weeks, which was due to an influx of conventional T cells into the liver (data not
shown), but the prevalence of iNKT cells returned to relatively normal levels around 6
weeks. NK1.1 surface levels became downregulated in the spleen and liver around 2-3
weeks, returned to normal levels in the liver by week 6, but remained suppressed in the
spleen until week 6 (Figure 8). Analysis of iNKT cell responses revealed suppressed
capacity of splenocytes to proliferate and produce IFN-γ and IL-4 upon in vitro
stimulation with α-GalCer at 3 and 4 weeks after treatment with heat-killed E. coli
(Figure 9A). In contrast with α-GalCer-injected controls, the blockade in IL-4 production
induced by E. coli appeared to be more profound than that for IFN-γ production. Despite
sustained NK1.1 downregulation on iNKT cells, splenocytes generated relatively normal
responses to E. coli by week 6. To assess effects on iNKT cell proliferation and cytokine
production more directly, we performed carboxyfluorescein succinimidyl ester (CFSE)
dilution and intracellular staining experiments. Results demonstrated reduced capacity of
iNKT cells from E. coli-treated animals to proliferate (Figure 9B) and to produce
cytokines (Figure 9C) in response to α-GalCer stimulation ex vivo.
In contrast to heat-killed E. coli and α-GalCer, treatment of mice with live L.
monocytogenes resulted in a dramatic reduction in iNKT cell frequency and numbers in
both spleen and liver (Figure 10A, B). By week 4, numbers of iNKT cells had recovered
in the liver but not spleen. The NK1.1 expression pattern following infection with L.
monocytogenes closely mimicked that seen after α-GalCer treatment (Figure 11). NK1.1
29

downregulation was evident by day 1 and persisted until week 4. These alterations in
iNKT cell numbers were accompanied by profound changes in the response of
splenocytes to α-GalCer stimulation (Figure 12A). In addition, intracellular staining
revealed reduced capacity of iNKT cells from L. monocytogenes-infected animals to
produce cytokines in response to α-GalCer stimulation ex vivo (Figure 12B).
Bacteria induce long-term iNKT cell hyporesponsiveness in vivo
To determine whether bacteria can modulate iNKT cell responses in vivo, we
injected mice with heat-killed E. coli, S. aureus or S. typhimurium, or with live L.
monocytogenes and treated these animals at different time points thereafter with α-
GalCer to observe iNKT cell expansion in vivo. Consistent with prior results (25, 98), α-
GalCer injection (1 μg/mouse, i.p.) into naïve mice induced dramatic iNKT cell
expansion, whereas iNKT cells failed to expand in mice treated 3 weeks earlier with a
single dose of α-GalCer (Figure 13A-H). In mice treated with each of the bacteria tested,
α-GalCer failed to induce substantial iNKT cell expansion. This inhibition of iNKT cell
expansion persisted for at least 3 weeks for heat-killed S. aureus (Figure 13E, F) and S.
typhimurium (Figure 13G, H), and 4 weeks for heat-killed E. coli (Figure 13A, B) and
live L. monocytogenes (Figure 13C, D). Additional data revealed that these iNKT cells
were defective in inducing CD86 expression on B cells and DCs, as well as CD69
expression and IFN-γ production by NK cells (Figure 14). These findings indicate that
bacteria can induce iNKT cell hyporesponsiveness in vivo.
To investigate whether heat-killing of bacteria influences their capacity to induce
iNKT cell hyporesponsiveness, we compared the impact of heat-killed vs. live E. coli or
L. monocytogenes on iNKT cell responses. Results showed that both heat-killed and live
30

bacteria induced iNKT cell hyporesponsiveness (Figure 15).
Impact of bacteria-induced iNKT cell hyporesponsiveness on ConA-induced hepatitis
To determine whether bacteria can influence iNKT cell-mediated effector
functions in a disease setting, we evaluated iNKT cell function in a model of hepatitis
induced by Concanavalin A (ConA). ConA-induced hepatitis is a well-characterized
mouse model for human autoimmune hepatitis that is dependent on iNKT cell function
(170). Consistent with prior studies (170), CD1d-deficient mice, compared with wild-
type mice, showed significantly reduced liver damage following ConA injection (Figure
16A). Likewise, mice treated with heat-killed E. coli or S. aureus, or with live L.
monocytogenes, as compared with naïve mice, experienced significantly less liver
damage, as assessed by serum alanine aminotransferase (ALT) levels (Figure 16B, C).
Interestingly, bacteria conferred better protection from ConA-induced liver injury than α-
GalCer (Figure 16C).
Impact of E. coli-induced iNKT cell hyporesponsiveness on the therapeutic activities of α-GalCer
The immunomodulatory properties of iNKT cells have been exploited for the
development of immunotherapy for cancer and for preventing autoimmunity (36, 171,
172). We therefore tested whether exposure to bacteria can influence the therapeutic
activities of α-GalCer, using a model for lung metastasis induced by B16 melanoma cells
and the EAE model of multiple sclerosis. Mice were treated with heat-killed E. coli or
live L. monocytogenes and three weeks later these animals were injected with B16 cells
for induction of tumor metastases or treated with myelin oligodendrocyte glycoprotein
31

(MOG)35-55 peptide in complete Freund’s adjuvant (CFA) for induction of EAE. Mice
were then treated with a series of vehicle or α-GalCer injections. Results showed that,
even in the absence of α-GalCer treatment, tumor burden in E. coli-treated animals, but
not L. monocytogenes-treated animals, was substantially lower when compared with the
tumor burden in naïve animals (Figure 17). This may be due to primed innate immune
responses in E. coli-treated animals. However, α-GalCer was unable to enhance the
clearance of B16 tumors from E. coli-treated mice, and instead slightly enhanced tumor
burden in these animals (although differences were not statistically significant). Likewise
α-GalCer was unable to promote tumor clearance in mice treated with L. monocytogenes.
In contrast, however, iNKT cells in E. coli-treated animals retained their capacity to
prevent the development of EAE (Figure 18A). A prior report similarly demonstrated the
capability of α-GalCer-experienced iNKT cells to suppress EAE (25). This ability of
hyporesponsive iNKT cells to provide protection against EAE might be due to increased
secretion of IL-10 by DC in E. coli- or α-GalCer-treated animals compensating for the
hyporesponsive iNKT cells (Figure 18B).
32

Discussion
Immune responses mediated by peptide-reactive, MHC-restricted T cells are
characterized by a period of T cell activation, followed by proliferation and
differentiation, elaboration of effector functions, a decline phase in which the pool of
antigen-specific T cells contracts, and the development of immunological memory. In
sharp contrast, little is known regarding the immune response mediated by glycolipid-
reactive, CD1d-restricted iNKT cells. We and others have shown that treatment of mice
with the potent iNKT cell agonist α-GalCer results in the rapid activation and
proliferation of these cells, followed by homeostatic contraction of the iNKT cell
population and acquisition of an anergic phenotype (25, 95, 99). Here, we have
demonstrated that iNKT cells activated in response to multiple bacterial microorganisms
acquire a similar hyporesponsive phenotype, which can significantly impact subsequent
iNKT cell-mediated immune responses and the efficacy of iNKT cell-based
immunotherapy.
We tested the impact of bacteria on the phenotype and functional responses of
iNKT cells. While each of the bacteria tested, as evidenced by CD69 induction and
NK1.1 downregulation (Figure 3 and data not shown), was able to activate iNKT cells,
we observed long-term effects on iNKT cell function for E. coli, S. aureus, S.
typhimurium and L. monocytogenes (Figure 5), but not S. capsulata (Figure 5), E. faecalis
(data not shown) and S. pyogenes (data not shown). Whether bacteria were heat-killed or
live did not impact the outcome on iNKT cell responses (Figure 15).
Each of the bacterial organisms investigated in this study likely has multiple
mechanisms to induce the production of pro-inflammatory cytokines by APC and, thus,
33

to activate iNKT cells. As such, induction of iNKT cell hyporesponsiveness might be
influenced by a variety of factors, including the mechanism and extent of iNKT cell
activation. In this regard, we noticed that the capacity of bacteria to induce iNKT cell
hyporesponsiveness correlated with sustained NK1.1 downregulation in the spleen
(Figure 4A) and with transient iNKT cell depletion in the liver (Figure 4B), both of which
are also observed after α-GalCer treatment (25, 98). In the case of L. monocytogenes, we
also observed transient iNKT cell depletion in the spleen (Figure 10A, B), which likely
reflects strong iNKT cell activation. A similar but more sustained depletion of iNKT cells
has been observed in mice following an acute infection with lymphocytic
choriomeningitis virus (LCMV) (173).
iNKT cell hyporesponsiveness induced by bacteria exhibited a number of
similarities with iNKT cell anergy induced by α-GalCer (25). First, as already discussed,
iNKT cell hyporesponsiveness correlated with sustained NK1.1 downregulation by
splenic iNKT cells (Figure 4A). Second, iNKT cell hyporesponsiveness correlated with a
transient decrease in liver iNKT cell numbers (Figure 4, 7A, B, 10A, B). Third, iNKT
cell hyporesponsiveness was maintained for at least 4 weeks (Figure 5, 9, 12). These
similarities between bacteria- and α-GalCer-induced iNKT cell hyporesponsiveness
suggest similar mechanisms.
iNKT cell activation can have a number of detrimental effects in mice, including
the induction of liver injury (174), abortions (175), and exacerbation of atherosclerosis
(176) and allergic reactions (177). As such, it is likely that bacteria-induced iNKT cell
hyporesponsiveness serves to avoid such deleterious outcomes of iNKT cell activation. In
addition to inducing iNKT cell hyporesponsiveness, some pathogens, such as L.
monocytogenes (the present study) and LCMV (173), induce significant iNKT cell
34

apoptosis, which likely represents an additional mechanism to avoid the deleterious
effects of sustained iNKT cell activation. Our finding that treatment of mice with E. coli,
S. aureus, or L. monocytogenes suppressed ConA-induced hepatitis (Figure 16) supports
this hypothesis.
In humans, it has been well-documented that iNKT cell numbers and functions
differ widely among individuals (178, 179). Our finding that many bacteria can induce
iNKT cell hyporesponsiveness, together with the observation that certain pathogens can
induce short-term (e.g., L. monocytogenes; this study) or long-term (e.g., LCMV (173))
depletion of the iNKT cell population, provides a potential explanation for this
observation. A role for microbial pathogens in the variability of human iNKT cell
numbers and functions is also consistent with the finding that iNKT cell numbers in
humans are suppressed during certain chronic infections, including infections with HIV
(164) and Mycobacterium tuberculosis (179).
iNKT cells are promising targets for immunotherapy of a variety of diseases,
including cancer and autoimmunity (171, 172, 180, 181). Our studies revealed that
bacteria-induced iNKT cell hyporesponsiveness impacts the efficacy of iNKT cell-based
immunotherapies. We demonstrated that heat-killed E. coli and live L. monocytogenes
abrogated the capacity of α-GalCer to protect mice against the development of B16
tumors, but we did not observe any effects of E. coli on the capacity of α-GalCer to
protect mice against the induction of EAE (Figure 18A). These effects of bacteria on the
therapeutic activities of α-GalCer are very similar to those mediated by α-GalCer-
induced iNKT cell anergy (25). Although the precise mechanisms remain unclear, IFN-γ
and iNKT-cell mediated transactivation of DCs and NK cells likely play important roles
in the therapeutic effects of α-GalCer against B16 tumor cells (182), whereas IL-4, IL-10
35
and IFN-γ all have been implicated in the therapeutic efficacy of α-GalCer against EAE
(116, 117, 119). Our finding that α-GalCer-activated, hyporesponsive iNKT cells are
defective in transactivating DCs and NK cells (Figure 14) provides a potential
explanation for loss of the beneficial effect of iNKT cells against B16 metastases. In the
case of EAE, it is possible that the levels of cytokines produced by hyporesponsive iNKT
cells are sufficient to promote the tolerogenic activities of these cells and prevent EAE
disease. Indeed, we found that DCs from mice treated with α-GalCer three weeks after
initial challenge with α-GalCer or heat-killed E. coli exhibited a profound increase in IL-
10 secretion in response to in vitro stimulation with LPS or CpG (Figure 18B).
In conclusion, multiple bacteria have been shown to induce phenotypic and
functional changes in iNKT cells rendering these cells hyporesponsive during the
secondary response. These changes impacted the physiological function of iNKT cells in
ConA-induced hepatitis model and also affected the therapeutic activities of these cells.
These findings argue that infections and vaccination might limit the utility of α-GalCer
therapy. In order to apply our findings to the development of novel strategies targeting
iNKT-cell based therapies, it is crucial to gain mechanistic understanding of iNKT cell
hyporesponsiveness induced by bacteria. In the next chapter, we tried to provide insight
into the mechanism by which bacteria induce and maintain the hyporesponsive phenotype
of iNKT cells.
36

Materials and Methods
Mice. Female C57BL/6 (B6) mice were purchased from the Jackson Laboratory. All
animal studies were approved by the Institutional Animal Care and Use Committee of
Vanderbilt University (Nashville, TN).
Reagents. α-GalCer (KRN7000) was kindly provided from Kirin Brewery Co., Ltd.
(Gunma, Japan) and was reconstituted in PBS containing 0.5% polysorbate-20 (Sigma-
Aldrich). CD1d monomers were obtained from the National Institutes of Health.
Fluorescently labeled tetrameric CD1d molecules loaded with α-GalCer (CD1d
tetramers) were prepared as described previously (183). Anti–TCR-β–fluorescein
isothiocyanate (FITC) and -allophycocyanin, anti-NK1.1-phycoerythrin (PE) and -
allophycocyanin, anti-B220-peridinin chlorophyll protein (PerCP), anti-CD3–PerCP,
anti-CD80-PE, anti-CD86-PE, anti–IL-4–allophycocyanin, anti–IFN-γ–FITC, anti-
CD69–FITC, anti-CD11c–allophycocyanin, and streptavidin–PE–cyanide dye 5 were
obtained from BD Biosciences-Pharmingen, complete and incomplete Freund’s adjuvant
from BD Biosciences-Pharmingen, CFSE from Invitrogen Corp., Salmonella LPS from
Sigma, and CpG from Invivogen.
Treatment of mice with heat-killed or live bacteria. E. faecalis (ATCC 29212), E. coli
(ATCC 25922), S. aureus (ATCC 25923), and S. pyogenes (ATCC 19615) were obtained
from Dr. Yi-Wei Tang (Vanderbilt Medical Center), S. typhimurium (χ4550) was
obtained from Dr. Roy Curtiss (Arizona State University, Tempe, AZ), and L.
monocytogenes was obtained from Dr. Hao Shen (University of Pennsylvania School of
37
Medicine, Philadelphia, PA). Each of these organisms was grown on Brain Heart
Infusion agar (BD Difco) plates and individual colonies were cultured overnight in Brain
Heart Infusion broth, diluted in fresh broth and grown for 8 hr at 37oC to stationary phase,
washed and resuspended in PBS. S. capsulata (ATCC 14666) was obtained from the
ATCC and grown in Mueller-Hinton broth, washed and diluted in PBS buffer. Heat-
killed bacteria were prepared by 2 hr exposure to 75oC except for S. typhimurium, which
was incubated in boiling water for 45 min. Heat-killed bacteria were subsequently stored
at -80oC. Heat-killed bacteria (0.75-1×10⁹ CFU in 200 μl PBS) were intravenously
injected into mice. Live bacteria were administered intravenously in 200 μl PBS, at a
dose of 5×10⁴ colony forming unit (CFU) for L. monocytogenes, 1-2 × 10⁸ CFU for S.
capsulata, or 5×10⁵ CFU for E. coli. Mice were sacrificed and analyzed at various time
points after injection.
Flow cytometry. Single-cell suspensions of the spleen and liver were prepared and stained
with fluorescently-labeled mAbs as described previously (79). In all experiments, dead
cells were excluded from the analysis by electronic gating. The iNKT cell population was
identified as B220-TCR-β+tetramer+ cells. For intracellular cytokine staining, cells were
permeabilized with Cytofix/Cytoperm reagents (BD Biosciences-Pharmingen) according
to the manufacturer’s protocol. For staining of DCs, Fc receptors were first blocked by
addition of anti-CD16/32 antibodies (BD Biosciences-Pharmingen) and DCs were
identified on the basis of high CD11c expression. Flow cytometry was performed using a
FACSCalibur instrument with CellQuest software (BD Immunocytometry Systems) and
the acquired data were analyzed using FlowJo software (Tree Star Inc.).
38

Measurement of in vivo and in vitro responses to α-GalCer. For evaluation of in vivo
iNKT cell responses to α-GalCer, mice were injected i.p. with 1 μg α-GalCer in 200 μl
PBS containing 0.025% polysorbate-20 (vehicle). At different time points, splenocytes
and liver mononuclear cells were stained with fluorescently labeled mAbs and analyzed
by flow cytometry. For evaluation of in vitro iNKT cell responses, splenocytes were
plated in U-bottomed 96-well plates at 2 × 10⁵ cells per well in RPMI medium containing
10% FCS (R-10) in the presence of titrated doses of α-GalCer or vehicle. For
proliferation assays, 1 μCi of [3H]thymidine (MP Biomedicals, Inc.) was added to the
wells after 60 hrs of culture, and cells were cultured for an additional 12 hrs. Cells were
then harvested, and uptake of radioactivity was measured in β-counter. For measurement
of cytokine secretion in vitro, supernatants were harvested after 60 hrs of culture, and
cytokine levels were measured by ELISA.
ELISA. A standard sandwich ELISA was performed to measure mouse IFN-γ, IL-4, IL-
10, IL-12 and IL-2. IFN-γ– and IL-4–paired antibodies were obtained from R&D
Systems Inc., and IL-10, IL-12 and IL-2–paired antibodies were obtained from BD
Biosciences-Pharmingen. Cytokine standards were obtained from BD Biosciences-
Pharmingen. For detection, streptavidin-HRP conjugate (Zymed Laboratories Inc.) was
used, and the color was developed with the substrate 3,3′,5,5′-tetramethylbenzidine (Dako
Corp.) in the presence of H2O2.
CFSE dilution analysis. Total splenocytes or enriched iNKT cells were labeled with 1
μM CFSE for 15 min at 37°C in PBS containing 5% FCS, and washed twice with R-10
medium. Labeled splenocytes (2 × 10⁵ cells per well) were then stimulated with α-
39

GalCer (100 ng/ml) with or without addition of IL-2 (10 ng/ml) in the culture media.
Cells were washed 3 times with R-10 medium and cultured for an additional 96 hrs in R-
10 medium without α-GalCer. At the end of the culture, cells were harvested, stained
with PE-labeled CD1d tetramer and anti-B220–PerCP, and analyzed by flow cytometry.
Dead cells were excluded from the analysis by electronic gating. CFSE dilution analysis
was performed on B220–tetramer+ iNKT cells.
Assessment of ConA-induced hepatitis. ConA (350 μg in 200 μl PBS) was injected
intravenously into mice. Mice were sacrificed 24 hrs later and serum was collected and
analyzed for alanine aminotransferase (ALT) levels using Prochem-V (Drew Scientific)
according to the manufacturer’s protocol.
Determination of lung metastases of B16 melanoma. B6 mice were injected i.v. with 3 ×
105 syngeneic B16 melanoma cells suspended in PBS. Mice were treated with α-GalCer
(5 μg per injection) or vehicle at 0, 4, and 8 days. Fifteen days after challenge, mice were
sacrificed, lungs were removed, and the number of metastatic nodules was counted as
described (184).
Induction and evaluation of EAE. Mice were immunized s.c. with 200 μg of MOG35-55
peptide (Bio-Synthesis, Inc.) emulsified in CFA (BD Biosciences) on day 0 and in
incomplete Freund’s adjuvant (IFA) on day 7, as described (116). Mice also received 250
ng of pertussis toxin (Invitrogen Corp.) i.p. on days 0 and 2. Mice were treated with 5 μg
of α-GalCer or vehicle on days 0, 4, and 7 by i.p. injection. Clinical symptoms were
monitored daily after the first immunization. The clinical score was graded as follows: 0,
40

no disease; 1, tail limpness; 2, hind-limb weakness; 3, hind-limb paralysis; 4, forelimb
weakness; 5, quadriplegia; and 6, moribund. Mice were sacrificed at grade 6.
Statistical analysis. Statistical significance between two groups was determined by
application of an unpaired 2-tailed Mann-Whitney U test. A P value less than 0.05 was
considered significant. Statistical significance between multiple groups was determined
by application of ANOVA followed by Bonferroni post-hoc test for samples determined
to approximate normal distribution by Kolmogorov-Smirnov normality test with Dallal-
Wilkinson-Lilliefor p value. When samples were determined not to approximate normal
distribution, Kruskal-Wallis followed by Dunns post-hoc test was used instead. A P value
less than 0.05 was considered significant for the multiple comparison tests as well.
41

Figure 3. Multiple bacterial microorganisms activate murine iNKT cells. (A) and (B) The in vivo response of mice to treatment with heat-killed or live bacteria at day 1 in spleen (A) or liver (B). Mice were injected with α-GalCer (5 μg/mouse, i.p.) or with the indicated heat-killed or live bacteria (i.v.), sacrificed at day 1, and spleen or liver mononuclear cells were prepared and stained with anti-TCRβ-FITC, anti-CD69-FITC, anti-NK1.1-PE, anti-B220-PerCP, and CD1d-tetramer-APC and analyzed by flow cytometry. Numbers indicate the percentage of TCRβ+tetramer+ cells among B220- cells, or the percentage of NK1.1- cells among iNKT cells. The shaded area represents the staining of naïve iNKT cells and the solid line represents the staining of iNKT cells from mice treated with α-GalCer or bacteria. Representative plots from 4-8 mice per group are shown.
42

Figure 4. Some bacterial microorganisms induce sustained changes in the prevalence and surface phenotype of iNKT cells. (A) and (B) The in vivo response of mice to treatment with heat-killed or live bacteria at week 3 in spleen (A) or liver (B). Mice were injected with α-GalCer (5 μg/mouse, i.p.) or with the indicated heat-killed or live bacteria (i.v.), sacrificed at week 3, and spleen or liver mononuclear cells were prepared and stained with anti-TCRβ-FITC, anti-CD69-FITC, anti-NK1.1-PE, anti-B220-PerCP, and CD1d-tetramer-APC and analyzed by flow cytometry. Numbers indicate the percentage of TCRβ+tetramer+ cells among B220- cells, or the percentage of NK1.1- cells among iNKT cells. The shaded area represents the staining of naïve iNKT cells and the solid line represents the staining of iNKT cells from mice treated with α-GalCer or bacteria. Representative plots from 4-8 mice per group are shown.
43

Figure 5. Some bacterial microorganisms induce suppressed response of splenocytes to α-GalCer rechallenge. Mice were injected with α-GalCer (5 μg/mouse, i.p.) or the indicated bacteria, sacrificed 3 weeks later, and splenocytes (2 × 10⁵ per well) were cultured with graded doses of α-GalCer. After 3 days, proliferation was assessed by [3H]thymidine incorporation and culture supernatants were evaluated for IL-4 and IFN-γ levels by ELISA. Proliferation and cytokine results represent the mean ± SEM of 6-11 mice per group, pooled from 3 experiments. *, p<0.05 as compared with naïve splenocytes cultured with the same dose of α-GalCer.
44
Figure 6. The memory response of conventional T cells following L. monocytogenes infection. Mice were infected with 5×10⁴ CFU of L. monocytogenes, sacrificed 3 weeks later, and splenocytes (2 × 10⁵ per well) were cultured with graded doses of heat-killed L. monocytogenes. After 3 days, proliferation was assessed by [3H]thymidine incorporation and culture supernatants were evaluated for IL-2 by ELISA. Proliferation and cytokine results represent the mean ± SEM of 4 mice. *, p<0.05 as compared with naïve splenocytes cultured with the same dose of heat-killed L. monocytogenes.
45

Figure 7. In vivo dynamics of the iNKT cell population in response to heat-killed E. coli. (A) Mice were injected with α-GalCer (5 μg/mouse, i.p.) or heat-killed E. coli, sacrificed at the indicated time points, and spleen and liver mononuclear cells were prepared and stained for the identification of iNKT cells with anti-TCRβ-FITC, anti-NK1.1 PE, anti-B220-PerCP, and tetramer-APC. The percentage of TCRβ+tetramer+ cells among B220- cells is shown. Representative plots from 5-10 mice per group are shown. (B) Graphical representation of the total spleen iNKT cell counts and the percentage of liver iNKT cells at the indicated time points, for a total of 5-10 mice per group, pooled from 2 separate experiments. *, p<0.05 as compared with naïve animals.
46

Figure 8. In vivo dynamics of NK1.1 expression by iNKT cells in response to heat-killed E. coli. Mice were injected with α-GalCer (5 μg/mouse, i.p.) or heat-killed E. coli, sacrificed at the indicated time points, and spleen and liver mononuclear cells were prepared and stained for the identification of iNKT cells with anti-TCRβ-FITC, anti-NK1.1-PE, anti-B220-PerCP, and tetramer-APC. The percentage of NK1.1- cells among iNKT cells is shown. The shaded area represents the NK1.1 staining of naïve iNKT cells, and the solid line represents the staining of iNKT cells from mice treated with α-GalCer or bacteria. Representative plots from 4-10 mice per group are shown.
47

Figure 9. Heat-killed E. coli induces hyporesponsiveness of iNKT cells to α-GalCer rechallenge ex vivo. (A) α-GalCer recall response of mice at the indicated time points after treatment with heat-killed E. coli. Mice were injected with α-GalCer or heat-killed E. coli, sacrificed 3, 4, or 6 weeks later, and splenocytes (2 × 10⁵ per well) were cultured with graded doses of α-GalCer. After 3 days, proliferation was assessed by [3H]thymidine incorporation and culture supernatants were evaluated for IL-4 and IFN- levels by ELISA. Proliferation and cytokine results represent the mean ± SEM of 6-9 mice, pooled from 2 experiments. *, p<0.05 as compared with naïve splenocytes cultured with the same dose of α-GalCer. (B) Proliferative defect in iNKT cells from mice treated with heat-killed E. coli. Spleen cells from naive mice or from mice injected 4 or 6 weeks earlier with α-GalCer or heat-killed E. coli were labeled with CFSE. Cells (2 × 10⁵ per well) were then cultured with α-GalCer (100 ng/ml) for 24 hrs, then washed and cultured for an additional 96 hrs without α-GalCer. At the end of the culture period cells were harvested, stained with anti-TCRβ-PE, anti-B220-PerCP, and tetramer-APC, and analyzed by flow cytometry. Numbers indicate the percentage of the TCRβ+tetramer+ cells among B220- cells. CFSE dilution was analyzed on B220-TCRβ+tetramer+ cells. The data shown are representative of 3 separate experiments with 2 mice per group. (C) iNKT cell cytokine production. Spleen cells were prepared at the indicated time point and 2 × 10⁵ cells were cultured for 6 hrs in plain medium (alone) or 100 ng/ml α-GalCer (αGC) in the presence of GolgiPlug. Cells were then harvested and surface-stained with tetramer-PE and anti-B220-PerCP, followed by intracellular staining with anti-IFN-γ-FITC and anti-IL-4-APC. Data are shown for B220-tetramer+ cells. Numbers indicate the percentage of cells within each quadrant. Results shown are representative of 4 independent experiments.
48

49

Figure 10. In vivo dynamics of the iNKT cell population in response to L. monocytogenes infection. (A) Mice were injected with α-GalCer (5μg/mouse, i.p.) or infected with L. monocytogenes, sacrificed at the indicated time points, and spleen and liver mononuclear cells were prepared and stained with anti-TCRβ-FITC, anti-NK1.1 PE, anti-B220-PerCP, and tetramer-APC. Numbers indicate the percentage of TCRβ+tetramer+ cells among B220- cells. Representative plots from 4-7 mice per group are shown. (B) Graphical representation of the total spleen iNKT cell counts and the percentage of liver iNKT cells at the indicated time points, for a total of 4-7 mice per group, pooled from 2 separate experiments. *, p<0.05 as compared with naïve animals.
50

Figure 11. In vivo dynamics of NK1.1 expression by iNKT cells in response to live L. monocytogenes. Mice were injected with α-GalCer (5 μg/mouse, i.p.), live L. monocytogenes, sacrificed at the indicated time points, and spleen and liver mononuclear cells were prepared and stained for the identification of iNKT cells with anti-TCRβ-FITC, anti-NK1.1-PE, anti-B220-PerCP, and tetramer-APC. The percentage of NK1.1-
cells among iNKT cells is shown. The shaded area represents the NK1.1 staining of naïve iNKT cells, and the solid line represents the staining of iNKT cells from mice treated with α-GalCer or bacteria. Representative plots from 4-10 mice per group are shown.
51

Figure 12. Live L. monocytogenes infection induces hyporesponsiveness of iNKT cells to α-GalCer rechallenge ex vivo. (A) The in vitro α-GalCer recall response of mice at the indicated time points after infection. Mice were infected with L. monocytogenes, sacrificed 3 days or 1, 2, or 4 weeks later, and splenocytes (2 × 10⁵ per well) were cultured with graded doses of α-GalCer. After 3 days, proliferation was assessed by [3H]thymidine incorporation and culture supernatants were evaluated for IL-4 and IFN-γ levels by ELISA. Proliferation and cytokine results represent the mean ± SEM of 4-8 mice pooled from 2 separate experiments. *, p<0.05 as compared with naïve splenocytes cultured with the same dose of α-GalCer. (B) iNKT cell cytokine production. Spleen cells were prepared at the indicated time point and 2 × 10⁵ cells were cultured for 6 hrs in plain medium (alone) or 100 ng/ml α-GalCer (αGC) in the presence of GolgiPlug. Cells were then harvested and surface-stained with tetramer-PE and anti-B220-PerCP, followed by intracellular staining with anti-IFN-γ-FITC and anti-IL-4-APC. Data are shown for B220-tetramer+ cells. Numbers indicate the percentage of cells within each quadrant. Results shown are representative of 2 independent experiments.
52

Figure 13. Bacteria can induce iNKT cell hyporesponsiveness to α-GalCer rechallenge in
vivo. (A), (C), (E) and (G) At the indicated time points after injection with heat-killed E.
coli (A), live L. monocytogenes (C), heat-killed S. aureus (E), or heat-killed S.
typhimurium (G) mice were rechallenged in vivo with vehicle or α-GalCer (1 μg/mouse,
i.p.). Mice were sacrificed 3 days later and spleen cells were stained with anti-TCRβ-
FITC, anti-B220-PerCP, and tetramer-APC, and analyzed by flow cytometry. Numbers
indicate the percentage of TCRβ+tetramer+ cells among B220- cells for representative
data from 5-7 mice per group in at least 2 separate experiments. (B), (D), (F) and (H)
Graphical representation of the total spleen iNKT cells calculated from the experiments
shown in (A), (C), (E), and (G) respectively. *, p<0.05 as compared with naive mice
rechallenged with α-GalCer.
53
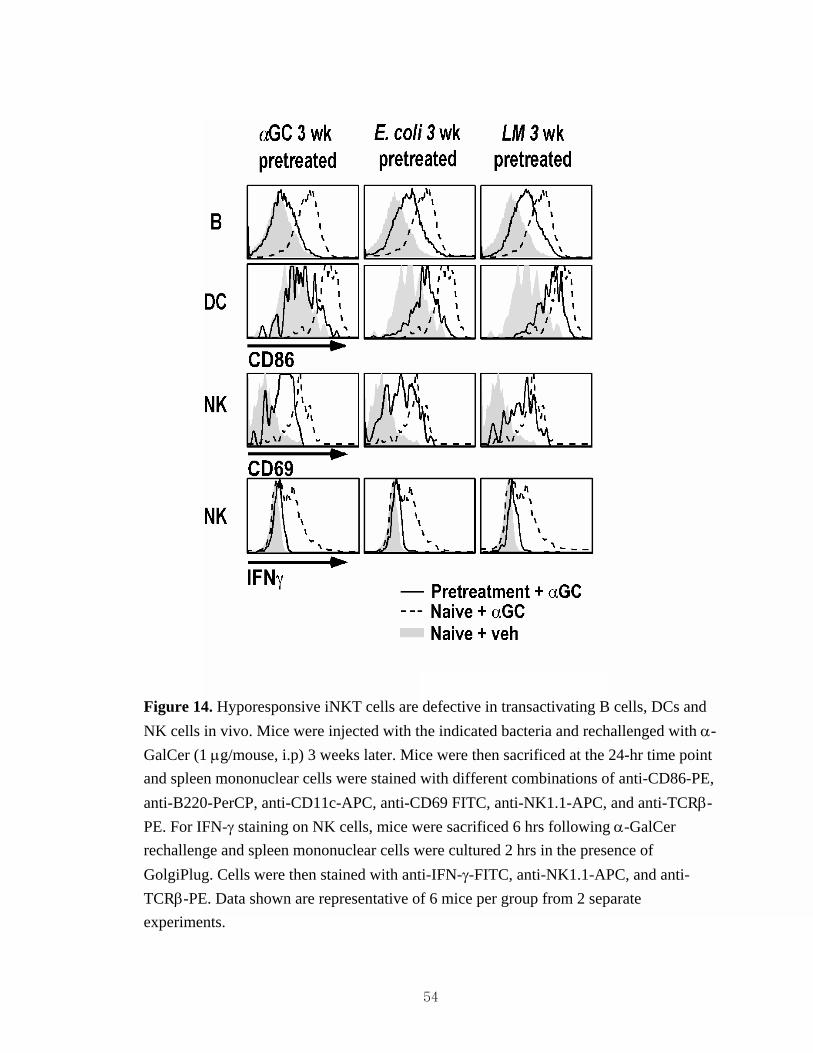
Figure 14. Hyporesponsive iNKT cells are defective in transactivating B cells, DCs and NK cells in vivo. Mice were injected with the indicated bacteria and rechallenged with α-GalCer (1 μg/mouse, i.p) 3 weeks later. Mice were then sacrificed at the 24-hr time point and spleen mononuclear cells were stained with different combinations of anti-CD86-PE, anti-B220-PerCP, anti-CD11c-APC, anti-CD69 FITC, anti-NK1.1-APC, and anti-TCRβ-PE. For IFN-γ staining on NK cells, mice were sacrificed 6 hrs following α-GalCer rechallenge and spleen mononuclear cells were cultured 2 hrs in the presence of GolgiPlug. Cells were then stained with anti-IFN-γ-FITC, anti-NK1.1-APC, and anti-TCRβ-PE. Data shown are representative of 6 mice per group from 2 separate experiments.
54

Figure 15. Both heat-killed and live bacteria induce iNKT cell hyporesponsiveness. (A) Mice were injected with heat-killed or live E. coli or L. monocytogenes and, 3 weeks later, rechallenged in vivo with vehicle or α-GalCer (1 μg/mouse, i.p.). Mice were sacrificed 3 days later and spleen cells were stained with anti-TCRβ-FITC, anti-B220-PerCP, and tetramer-APC, and analyzed by flow cytometry. Numbers indicate the percentage of TCRβ+tetramer+ cells among B220- cells from representative plots of 5-6 mice per group from 2 experiments. (B) Graphical representation of the total spleen iNKT cells calculated from the experiments shown in (A). *, p<0.05 as compared with naive mice rechallenged with α-GalCer.
55

Figure 16. Impact of bacteria-induced iNKT cell hyporesponsiveness on ConA-induced hepatitis. Wild-type or CD1d-deficient mice were injected with α-GalCer (A), live L. monocytogenes (B), or heat-killed E. coli or S. aureus (C), and, 3-4 weeks later, mice were challenged with PBS or ConA (350 μg/mouse in PBS). Mice were bled 24 hrs later and serum ALT levels were measured. Results represent the mean ± SEM of 8 mice per group in ConA-treated groups or 2 mice per group in PBS-treated groups. *, p<0.05 as compared with naïve mice treated with ConA.
56

Figure 17. Impact of E. coli-induced iNKT cell hyporesponsiveness on the anti-tumor activities of α-GalCer against B16 tumor lung metastasis formation. B6 mice were left untreated or injected with bacteria and, 4 weeks later, mice were challenged i.v. with 3 × 10⁵ syngeneic B16 melanoma cells and treated with α-GalCer (5 μg/injection) or vehicle at 0, 4, and 8 days after tumor challenge. Mice were sacrificed after 15 days and the number of metastatic nodules in the lungs counted. Results shown are the average of 2 experiments with 4 mice in each group per experiment. *, p<0.05; NS, not significant.
57

Figure 18. Impact of E. coli-induced iNKT cell hyporesponsiveness on the therapeutic activities of α-GalCer against EAE. (A) B6 mice were treated with heat-killed E. coli and, 3 weeks later, mice were immunized with MOG35-55 peptide for induction of EAE,
treated with α-GalCer (5 μg/injection) or vehicle on days 0, 4, and 7, and followed for clinical signs of EAE. Results shown are one representative experiment of 2 with 5-6 mice in each group. (B) Development of tolerogenic DCs following α-GalCer or heat-killed E. coli treatment. Mice were injected with α-GalCer (5 μg/mouse, i.p.) or heat-killed E. coli (indicated as 1°) and, 3 weeks later, rechallenged with vehicle or α-GalCer (5 μg/mouse, i.p.) (indicated as 2°). Mice were sacrificed 24 hrs following α-GalCer rechallenge and DCs were MACS-purified from spleens. Purified DCs were then cultured for 48 hours in the presence of vehicle, 10 μg/ml Salmonella LPS or 1 μΜ CpG ODN. Supernatants were analyzed for IL-12 and IL-10 by sandwich ELISA. Data shown represents mean ± SD from 3 wells per group.
58
CHAPTER III
THE MECHANISM OF INKT CELL HYPORESPONSIVENESS
INDUCED BY BACTERIA
Abstract
Invariant natural killer T (iNKT) cells are innate-like lymphocytes that recognize
glycolipid antigens in the context of the MHC class I-like antigen-presenting molecule
CD1d. Unlike conventional T cells, iNKT cells can be activated directly through
recognition of a cognate antigen such as α-GalCer as well as indirectly through cytokine
and/or endogenous lipid antigen presentation by DC during bacterial infection. We have
previously shown that multiple bacterial organisms can induce iNKT cell
hyporesponsiveness, and therefore we have investigated the mechanism by which
bacteria induce this hyporesponsive phenotype in iNKT cells. We have found that murine
iNKT cells activated in vivo by bacterial LPS or flagellin, became unresponsive to
subsequent activation with α-GalCer suggesting TLR ligands as causative agents of
bacteria-induced hyporesponsiveness. Furthermore, while a distinct mechanism of
activation resulted in a requirement for IL-12 in bacteria- but not in α-GalCer-induced
anergy, both share several common anergic phenotypes, implying similar underlying
mechanisms of anergy. These findings provide insights into understanding iNKT cell
function and may result in novel strategies for therapeutic application of iNKT cells.
59

Introduction
T cell anergy is defined as an extended period of functional inactivation and
hyporesponsiveness of T cells following an antigenic stimulation. Functional inactivation
may refer to combinations of suppressed cell division, differentiation/maturation, and/or
cytokine production. Most importantly, this hyporesponsive state should be cell
autonomous and distinct from bystander tolerance mediated by other immunoregulatory
cells. Also, the period of the hyporesponsive state should last at least 24 hours and is
distinguished from an apoptotic process characterized by caspase activation (185, 186).
T cell anergy falls into two main categories, clonal anergy and adaptive tolerance
(137). Clonal anergy arises from incomplete T cell activation of previously activated T
cells and usually is not associated with loss of effector functions. Adaptive tolerance, also
termed in vivo anergy, often ensues from in vivo activation of naïve T cells in the
absence of adequate costimulation or in the presence of strong coinhibition, for instance
mediated by cytotoxic T lymphocyte antigen-4 (CTLA-4) (187).
Several features distinguish these two distinct forms of T cell anergy. While a
block in IL-2 production and therefore proliferation is observed in both forms of anergy,
only adaptive tolerance typically results in blockade of all cytokines with the exception of
IL-10. Clonal anergy often retains effector functions. Also, unlike clonal anergy, adaptive
tolerance also requires persistent presence of antigenic stimulation in order to maintain
the anergic phenotype. In addition, in most adaptive tolerance models, the proliferative
block cannot be reversed by exogenous IL-2 due to defective IL-2 receptor signaling
which seems to involve CTLA-4 signaling (188).
Previous reports on α-GalCer-induced iNKT cell anergy provided important
60

perspectives for understanding the mechanism of iNKT cell hyporesponsiveness induced
by bacteria with a number of shared characteristics observed in conventional T cell
anergy (98, 189). The hyporesponsive phenotype exhibited by iNKT cells following
initial α-GalCer injection was cell autonomous, and was not indirectly dependent on the
activity of regulatory T cells, tolerogenic dendritic cells, or other cell types. Also, α-
GalCer was able to induce anergy in thymectomized mice indicating peripheral rather
than central tolerance mechanisms. With regard to roles for costimulation during anergy
induction, α-GalCer pulsed B cells with low levels of costimulatory molecules but not α-
GalCer pulsed DCs induced iNKT cell anergy. Additionally, α-GalCer was shown to
induce iNKT cell anergy in IL-4, IL-10, or IFN-γ deficient mice excluding involvement
of these cytokines during induction of iNKT cell anergy. Also, the surface phenotype of
iNKT cells during anergy induced by α-GalCer correlated with sustained downregulation
of NK1.1, but no change in Ly49 receptor expression was observed. α-GalCer-induced
anergy was also rescued by phorbol myristate acetate and ionomycin, and the
proliferative defect of anergic iNKT cells was corrected by the administration of
exogenous IL-2.
Activation of iNKT cells by bacteria is however distinct from α-GalCer. As a
potent specific antigen for semi-invariant TCR of iNKT cells, α-GalCer presented by
CD1d on APCs activates iNKT cells by strong prolonged TCR engagement. In sharp
contrast, despite extremely limited substrate specificity of their semi-invariant TCR,
iNKT cells have been shown to be involved in the clearance of diverse species of
microbes implying activation of iNKT cells in the absence of iNKT cell antigen. This is
explained by two modes iNKT cell activation, the direct mechanism and the indirect
mechanism. The direct mechanism of iNKT cell activation relies on the presence of
61

microbial glycolipid antigen that is presented by CD1d molecules on APC and directly
engages the semi-invariant TCR. Glycosphingolipids in Sphingomonas capsulata (55,
130, 134) and galactosyl diacylglycerol antigens from Borrelia burgdorferi (59) are good
examples of microbial glycolipid antigens strongly activating most iNKT cells. The
indirect mechanism of activation does not rely on specific recognition of microbial
glycolipid antigens. This non-specific activation is mediated by activated DCs in
response to microbial products, most notably TLR ligands. For instance, TLR signaling
in response to LPS from S. typhimurium results in IL-12 secretion by DCs, which in
conjunction with endogenous ligands activates (55, 63). In the case of E. coli LPS,
release of proinflammatory cytokines such as IL-12 and IL-18 by DCs without
presentation of autoreactive antigen is sufficient for iNKT cell activation (136).
In this chapter, we have dissected the mechanism of bacteria-induced iNKT cell
hyporesponsiveness, and we show that bacteria-induced and α-GalCer-induced iNKT cell
anergy share a number of features, yet exhibit a number of striking differences as well.
The findings from this research will provide novel insights into our understanding of
iNKT cell biology and for developing improved iNKT cell-based therapies.
62

Results
Role for TLR ligands in bacteria-induced iNKT cell hyporesponsiveness
Bacteria that lack cognate iNKT cell antigens can activate iNKT cells in a manner
that depends on the activation of DCs by TLR ligands (63, 126, 190). We therefore
investigated whether TLR ligands can induce iNKT cell hyporesponsiveness. Our results
showed that LPS and flagellin from E. coli and Salmonella were able to induce
hyporesponsiveness in iNKT cells (Figure 19A-C). Interestingly, while a single dose of
flagellin was sufficient to induce hyporesponsiveness, a repeated injection of LPS was
required implying flagellin as a more potent inducer of hyporesponsiveness. Ex vivo
assay of splenocytes prepared from mice previously treated with LPS or flagellin also
showed relatively less iNKT cell impairment by LPS than flagellin (Figure 19C).
Furthermore, DH5α, a flagellin deficient strain of E. coli, while inducing relative
hyporesponsiveness with respect to naïve animals, was much less efficient in the
induction of iNKT cell hyporesponsiveness (Figure 20).
Role for IL-12 in bacteria-induced iNKT cell hyporesponsiveness
Because IL-12 has been implicated as a critical cytokine in the capacity of
bacteria and bacterial products to activate iNKT cells (63, 126, 190), and because both
LPS and flagellin induce IL-12 production by APCs (191), we investigated the role of
this cytokine in bacteria-induced iNKT cell hyporesponsiveness using IL-12-deficient
mice. Consistent with previous studies indicating an important role for IL-12 in the
reciprocal interactions of iNKT cells and DCs (80), splenocytes from IL-12-deficient
mice showed a suppressed response to α-GalCer as compared with wild-type
63

splenocytes, regardless of prior in vivo treatment. Results (Figure 21A, B) showed that
the capacity of heat-killed E. coli to induce iNKT cell hyporesponsiveness required IL-12
expression, whereas induction of iNKT cell anergy mediated by α-GalCer was
independent of IL-12 expression. Also, NK1.1 downregulation by iNKT cells
consistently observed following bacteria treatment was absent in IL-12-deficient mice
(Figure 22). Furthermore, we found an important role of IL-12 for iNKT cell
hyporesponsiveness induced by LPS and flagellin (data not shown). These findings
indicate a critical role of TLR ligands and IL-12 in the capacity of bacteria to induce
iNKT cell hyporesponsiveness.
Costimulatory molecules are not required for bacteria-induced iNKT cell hyporesponsiveness
For bacteria-induced iNKT cell hyporesponsiveness, a strong stimulation of iNKT
cells during the early response to bacteria might be required to impart the subsequent
hyporesponsive phenotype. As costimulation amplifies the T cell response to TCR
engagement in general, we investigated the role for CD86 in bacteria-induced iNKT cell
hyporesponsiveness. Results showed that E. coli treatment in CD86 deficient mice
induced long-term iNKT cell hyporesponsiveness in vivo (Figure 23) indicating
costimulation is dispensable for bacteria to induce iNKT cell hyporesponsiveness.
Bacteria-induced iNKT cell hyporesponsiveness is thymus-independent
iNKT cell hyporesponsiveness induced by bacteria might involve central or
peripheral tolerance mechanisms. We therefore tested whether iNKT cell
hyporesponsiveness required an intact thymus. No differences were observed in the iNKT
64
cell response of euthymic vs. thymectomized animals pretreated with heat-killed E. coli,
heat-killed S. aureus, or live L. monocytogenes (Figure 24). In addition, we observed a
similar pattern of NK1.1 downregulation in bacteria-treated euthymic and athymic mice
(Figure 25). Moreover, Ly49 upregulation observed in iNKT cells generated de novo
during central tolerance was not observed following bacteria treatment (Figure 26). We
therefore concluded that central tolerance mechanisms do not play a significant role in
the induction of iNKT cell hyporesponsiveness by bacteria.
Bacteria-induced iNKT cell hyporesponsiveness is predominantly cell autonomous
iNKT cell tolerance induced by bacteria might be intrinsic to these cells or
mediated by extrinsic factors such as tolerogenic APC. We tested this issue for mice
treated with heat-killed E. coli. We cultured splenic DCs, purified from naive or E. coli-
treated mice, with liver iNKT cells purified from naive or E. coli-treated animals, in the
presence of α-GalCer. Results showed that iNKT cells derived from naive mice
proliferated and secreted cytokines at normal or slightly reduced levels in the presence of
DCs derived from all mice (Figure 27A). In sharp contrast, liver iNKT cells from mice
treated with heat-killed E. coli showed dampened proliferation and cytokine secretion in
response to DCs from both naive and E. coli-treated animals. To confirm these findings,
we labeled splenic iNKT cells enriched from naïve or bacteria-treated animals with CFSE,
cultured these cells in vitro with α-GalCer-loaded, splenic DCs enriched from naïve or
bacteria-treated animals, and analyzed CFSE dilution among iNKT cells (Figure 27B).
Results showed that iNKT cells enriched from naïve animals exhibited significant CFSE
dilution, regardless of the source of DCs used for stimulation. Further, naïve DCs were
unable to rescue hypoproliferation of iNKT cells purified from α-GalCer- or E. coli-
65

treated mice. These findings suggested that DC alterations have only a minor impact on
the development of iNKT cell unresponsiveness.
To confirm these findings, we enriched DCs from naïve mice, loaded these cells
ex vivo with α-GalCer, and injected the cells into naïve or bacteria-treated animals for
evaluation of iNKT cell expansion in the spleen. Results showed that naïve DCs loaded
with α-GalCer were unable to rescue the hyporesponsive phenotype of splenic iNKT
cells from bacteria-treated animals (Figure 28). These findings indicate that iNKT cell
hyporesponsiveness induced by heat-killed E. coli and live L. monocytogenes is not due
to alterations in DC function and is most likely intrinsic to these cells.
PMA plus ionomycin, or α-GalCer and IL-2, can overcome bacteria-induced iNKT cell hyporesponsiveness
Next, we tested whether a combination of PMA and ionomycin, which bypasses
proximal TCR signaling events, can overcome the hyporesponsive phenotype of iNKT
cells induced by bacteria. Results showed that this treatment was able to overcome iNKT
cell hyporesponsiveness induced by heat-killed E. coli and live L. monocytogenes (Figure
29). However, in most experiments, rescue of iNKT cell function in bacteria-treated
animals was not as complete as in α-GalCer-treated animals.
We also investigated the role of IL-2 in iNKT cell hyporesponsiveness. Correlated
with decreased proliferation by splenocytes from mice previously treated with α-GalCer,
E. coli, S. aureus or L. monocytogenes, IL-2 secretion was observed to be decreased
(Figure 30A). Next we tested whether exogenous administration of IL-2, which can
overcome the proliferative defect of iNKT cells rendered anergic in response to α-GalCer
treatment (25, 98), can rescue iNKT cell proliferation in mice treated three weeks earlier
66

with heat-killed E. coli. We found that IL-2 was able to restore proliferative function of
hyporesponsive iNKT cells (Figure 30B), suggesting similarities between α-GalCer and
bacteria-induced iNKT cell hyporesponsiveness.
Activating receptors are downregulated on hyporesponsive iNKT cells
Downregulation of NK1.1 has been shown to correlate with hyporesponsive
phenotype of iNKT cells. We tested whether other activating receptors were also
downregulated on hyporesponsive iNKT cells. We found that, in addition to NK1.1,
NKG2D, an important activating receptor in NK cells and certain T cell subsets, was
significantly reduced on α-GalCer- or bacteria-induced hyporesponsive iNKT cells
(Figure 31). Interestingly, CD94, which is a component of both the activating receptor
NKG2C/CD94 and the inhibitory receptor NKG2A/CD94, was also downregulated
(Figure 31). These findings suggest activating receptor downregulation may contribute to
the hyporesponsive phenotype of iNKT cells induced by bacteria.
Nitric oxide is not required for bacteria-induced iNKT cell hyporesponsiveness
A previous report has suggested a role for nitric oxide produced by CD11b+Gr-
1+ myeloid cells in cancer-bearing animals in mediating iNKT cell hyporesponsiveness
(192). We investigated whether similar mechanism might be active during bacterial
infection to modulate iNKT cell function. Results showed that treatment with an iNOS
inhibitor that interferes with nitric oxide production did not alter relative
hyporesponsiveness of α-GalCer- or bacteria-pretreated animals compared to naïve
animals (Figure 32). However, iNOS inhibitor treatment resulted in profound suppression
of iNKT cell response in naïve animals suggesting that nitric oxide might be important
67

for the generation of effective iNKT cell responses.
Programmed Death-1 (PD-1) is upregulated on hyporesponsive iNKT cells induced by α-GalCer or bacteria
PD-1 has been implicated in T cell exhaustion or anergy during chronic infection
(193-197). Prior studies have shown that PD-1 plays an important role in the induction of
iNKT cell anergy by α-GalCer (Parekh et al, unpublished data). We investigated whether
this molecule might also play a role in bacteria-induced iNKT cell hyporesponsiveness.
Results have shown early upregulation of PD-1 on iNKT cells following bacteria
treatment, although the levels were relatively lower than those seen after α-GalCer
treatment (Figure 33A). Interestingly, this upregulation of PD-1 following E. coli
treatment was absent in IL-12-deficient animals (Figure 33B), in which iNKT cell
hyporesponsiveness is not induced by E. coli. These findings suggest a potential role for
PD-1 in the induction of iNKT cell hyporesponsiveness by bacteria.
68

Discussion
In Chapter II, we tested the impact of bacteria on the phenotype and functional
responses of iNKT cells and found that E. coli, S. aureus, S. typhimurium and L.
monocytogenes, but not S. capsulata, E. faecalis and S. pyogenes, induced a
hyporesponsive phenotype in iNKT cells characterized by downregulation of NK1.1 and
functional unresponsiveness to subsequent challenge with α-GalCer which was used as
surrogate antigen studying recall response. These divergent effects of distinct bacteria on
iNKT cell function may be due, in part, to differences in the mechanisms by which iNKT
cells become activated.
Although the precise mechanisms by which iNKT cells become activated in
response to bacteria remain incompletely understood, two general mechanisms have been
proposed (126, 190). Some bacteria, such as Sphingomonas and Borrelia species, contain
glycolipids in their cell walls that can bind CD1d and directly activate iNKT cells. In this
context, it was surprising that live S. capsulata, despite its capacity to active iNKT cells,
failed to induce iNKT cell hyporesponsiveness, even when used at a sublethal dose.
Bacteria that lack cognate iNKT cell antigens can activate iNKT cells by stimulating the
production of pro-inflammatory cytokines by activating TLRs on APC (63, 126). In this
regard, we found that the TLR4 agonist LPS and the TLR5 agonist flagellin (Figure 19A-
C, 20), but not the TLR9 agonist CpG, the TLR7 agonist imiquimod, the TLR2 agonist
lipoteichoic acid, or the TLR3 agonist polyinosinic acid-polycytidylic acid (data not
shown), induced iNKT cell hyporesponsiveness. Prior studies have indicated a key role of
IL-12 for activation of iNKT cells by bacteria and bacterial LPS (55, 63, 126, 136). We
confirmed that IL-12 plays an important role in activating iNKT cells in response to heat-
69

killed E. coli (data not shown), and studies with IL-12-deficient mice revealed a critical
role of this cytokine for inducing iNKT cell hyporesponsiveness to heat-killed E. coli
(Figure 21A, B, 33B).
These findings suggest that the mechanism by which certain bacteria are able to
induce hyporesponsiveness of iNKT cells but not others likely depend on the specific
combination of pathogen-associated molecular patterns (PAMPs) or TLR ligands present
in distinct bacteria. Indeed, we have identified likely causative molecules responsible for
iNKT cell hyporesponsiveness in E. coli and S. typhimurium, namely LPS and flagellin,
while ruling out molecules that do not induce iNKT cell hyporesponsiveness. Moreover,
consistent with whole bacteria-induced iNKT cell hyporesponsiveness, we found that
LPS and flagellin also depend on IL-12 to induce iNKT cell hyporesponsiveness,
reinforcing the idea that specific PAMPs in bacteria are responsible for iNKT cell
hyporesponsiveness. Therefore, a differential array of PAMPs in distinct bacteria may
result in different effects of these bacteria on iNKT cells.
iNKT cell hyporesponsiveness induced by bacteria shares a number of key
mechanistic similarities with α-GalCer-induced anergy (78). First, although NK1.1 has
been shown to be dispensable in the induction and maintenance of anergy, iNKT cell
hyporesponsiveness is correlated with sustained NK1.1 downregulation by splenic iNKT
cells following bacterial injection as well as α-GalCer injection. Indeed, NK1.1
downregulation was correlated with a hyporesponsive phenotype in experiments
performed with thymectomized mice as well as IL-12-deficient mice. We also observed a
similar downregulation of the activating NK cell receptor NKG2D and the CD94 subunit
of the NKG2/CD94 family of NK cell receptors (Figure 31). These alterations in NK cell
receptor expression might contribute to the hyporesponsive phenotype of iNKT cells.
70

Second, iNKT cell hyporesponsiveness was induced independently of a functional
thymus (Figure 24), with absence of characteristic Ly49 expressing iNKT cells observed
during central tolerance (Figure 26), implying peripheral rather than central tolerance
mechanisms. Third, hyporesponsiveness was predominantly iNKT cell autonomous
(Figure 27, 28). Fourth, iNKT cell hyporesponsiveness could be overcome by treatment
of these cells with reagents (i.e., phorbol 12-myristate 13-acetate (PMA) + ionomycin)
that can bypass early TCR signaling events (Figure 29). Fifth, hyporesponsive iNKT cells
produced and secreted reduced levels of IL-2, and the proliferative capacity of these cells
could be rescued by treatment with α-GalCer in the presence of IL-2 (Figure 30). Sixth,
iNKT cell hyporesponsiveness was not rescued by iNOS inhibitor that prevents
production of nitric oxide (Figure 32). Finally, iNKT cells upregulated PD-1 expression,
a molecule that is responsible for certain forms of conventional T cell exhaustion or
anergy, during early phases of iNKT cell activation both by bacteria and α-GalCer, and
this upregulation was dependent on IL-12 for bacteria but not for α-GalCer (Figure 33).
Collectively, these similarities between bacteria- and α-GalCer-induced iNKT cell
hyporesponsiveness suggest similar mechanisms.
On the other hand, there was one striking difference in the capacity of bacteria
and α-GalCer to induce iNKT cell hyporesponsiveness. E. coli-induced
hyporesponsiveness of iNKT cells required IL-12 expression, but IL-12 was dispensable
for α-GalCer-induced iNKT cell hyporesponsiveness (Figure 21A, B). Consistently,
NK1.1 downregulation and PD-1 upregulation was absent in IL-12-deficient animals
treated with bacteria but not α-GalCer (Figure 22, 33). Such difference may be attributed
to distinct mechanisms of iNKT cell activation by α-GalCer and bacteria. Previous
studies have indicated an important role for IL-12 in the reciprocal interactions of iNKT
71

cells and DCs (80), and accordingly splenocytes from IL-12-deficient mice showed a
suppressed response to α-GalCer as compared with wild-type splenocytes. Regardless, as
a potent ligand for the invariant TCR of iNKT cells, α-GalCer can activate these cells
directly through TCR ligation and likely does not depend as heavily on IL-12 secretion
by DC. On the other hand, a previous report showed that indirect activation of iNKT cells
by E. coli LPS requires proinflammatory cytokine secretion such as IL-12 by DC while
TCR ligation was dispensable. It should be noted that among various TLR ligands, LPS
along with flagellin seems to be the causative agent for iNKT cell hyporesponsiveness by
E. coli.
Interestingly, a recent study has shown that sulfatide, a ligand for a subset of
CD1d-restricted NKT cells expressing diverse TCRs, can also induce hyporesponsiveness
in iNKT cells (198). Unlike the anergy induced by α-GalCer, but similar to bacteria-
induced hyporesponsiveness, anergy induced in iNKT cells by sulfatide required IL-12
expression (198). These findings suggest that multiple stimuli and pathways can result in
iNKT cell hyporesponsiveness with overlapping but distinct mechanisms of induction
and, possibly, maintenance.
Anergy or hyporesponsiveness in conventional T cells is categorized as clonal
anergy or adaptive tolerance (137). Clonal anergy ensues following incomplete T cell
activation of previously activated T cells resulting in growth arrest but usually with intact
effector function. Adaptive tolerance is induced by T cell stimulation in the absence of
adequate costimulation, or in the presence of strong coinhibition such as CTLA-4. This
form of anergy cannot be reversed by exogenous IL-2 in most cases due to defects in IL-
2R signaling (188), whereas clonal anergy is typically rescued by exogenous IL-2. From
the observation that naïve iNKT cells show an intermediate activated T cell phenotype, as
72

exemplified by CD69 and CD44 expression (30, 31), and that TCR ligation may be weak
or absent during initial activation by bacteria, bacteria-induced hyporesponsiveness
exhibits features of clonal anergy. Furthermore, adaptive tolerance usually requires
persistent presence of cognate antigen, which is unlikely to occur during bacteria-induced
hyporesponsiveness. Indeed, there is no known microbial antigen for iNKT cell present in
bacteria shown to induce iNKT cell hyporesponsiveness. However, prolonged
presentation of endogenous ligand or persistence of TLR ligands responsible for iNKT
cell hyporesponsiveness remains possible following bacterial infection. Indeed, reported
upregulation of CD1d in the context of bacterial infection suggests such a possibility (156,
199, 200). Recovery of proliferation with exogenous IL-2 is also more typical of clonal
anergy. On the other hand, severely compromised effector function such as IFN-γ and IL-
4 production is often found with adaptive tolerance. Collectively, bacteria-induced
hyporesponsiveness exhibits features of both categories of anergy and further
investigation of the underlying molecular mechanisms is required to better understand
this hyporesponsive phenotype induced by bacteria.
In summary, the mechanism of iNKT cell hyporesponsiveness induced by
bacteria shares several common features with α-GalCer-induced iNKT cell anergy.
Further understanding of the mechanism will provide insight into the development of
novel strategies to manipulate iNKT cells for therapeutic applications.
73

Materials and Methods
Mice. Female C57BL/6 (B6) mice, thymectomized adult B6 mice, and IL-12p40-
deficient mice were purchased from the Jackson Laboratory. All animal studies were
approved by the Institutional Animal Care and Use Committee of Vanderbilt University
(Nashville, TN).
Reagents. In addition to reagents described in Chapter II, mouse recombinant IL-2 was
obtained from BD Biosciences-Pharmingen, PMA and ionomycin from MP Biomedicals,
Inc., complete and incomplete Freund’s adjuvant from BD Biosciences-Pharmingen, NG-
monomethyl-L-arginine, lipoteichoic acid, E. coli LPS from Sigma, and imiquimod and
Salmonella flagellin from Invivogen, and polyinosinic acid-polycytidylic acid from
Amersham Pharmacia. E. coli flagellin was purified from cultures as described (201).
Treatment of mice with heat-killed or live bacteria. Bacteria were grown and prepared as
described in Chapter II.
Flow cytometry. Flow cytometry was performed as described in Chapter II.
Measurement of in vivo and in vitro responses to α-GalCer. Evaluation of in vivo and in
vitro iNKT cell responses to α-GalCer were performed as described in Chapter II.
ELISA. A standard sandwich ELISA was performed as described in Chapter II.
74

Isolation of splenic DCs. Spleens were cut into small pieces and digested with 0.2 mg/ml
collagenase D (Roche Diagnostics Corp.) in FCS-free RPMI medium for 45 min. The
digestion was terminated by addition of cold R-10 medium. Red blood cells were lysed
using ACK lysing buffer (Lonza). DCs were enriched based on expression of the CD11c
marker by magnetic sorting (Miltenyi Biotec) according to the manufacturer’s protocol.
Purity of enriched cell populations was 80–85% for DCs (data not shown). Purified DCs
were pulsed for 3 hrs with 200 ng/ml α-GalCer at 37oC. Cells were then washed 3 times
in R-10 medium to remove excess α-GalCer and injected i.v. into B6 mice (2 × 10⁵ DCs
per mouse). Mice were sacrificed 3 days later for analysis of iNKT cell function.
Enrichment of iNKT cells. For enrichment of liver iNKT cells, livers were perfused with
cold PBS and then pressed through a 70-μm cell strainer. Cells were suspended in 40 ml
RPMI medium in a 50-ml conical tube and allowed to stand on ice for 45 min. The
supernatant was then centrifuged, resuspended in cold 40% Percoll (GE Healthcare), and
underlaid with 60% Percoll. Cells were centrifuged at 1,500 g for 20 min at 4°C.
Mononuclear cells at the interphase of the 40% and 60% Percoll solutions were collected
and washed twice with R-10 medium. Two rounds of panning, 2 hrs each, were then
carried out to remove plastic-adherent APCs. The frequency of liver iNKT cells was then
analyzed by flow cytometry in order to normalize numbers of iNKT cells in the
subsequent culture with isolated splenic DCs. For splenic iNKT cells, single-cell
suspensions of splenocytes were prepared and iNKT cells were enriched based on
negative selection of B220-, CD11c-, CD62L-, Gr-1-, and CD11b-expressing cells by
magnetic sorting (Miltenyi Biotec) according to the manufacturer’s protocol. The
enriched cells were then labeled with CFSE and cocultured with α-GalCer-loaded DCs
75
described above.
CFSE dilution analysis. Total splenocytes or enriched iNKT cells were labeled with 1
μM CFSE for 15 min at 37°C in PBS containing 5% FCS, and washed twice with R-10
medium. Labeled splenocytes (2 × 10⁵ cells per well) were then stimulated with α-
GalCer (100 ng/ml) with or without addition of IL-2 (10 ng/ml) in the culture media, or
stimulated with purified α-GalCer-loaded DCs for 24 hrs in R-10 medium. Cells were
washed 3 times with R-10 medium and cultured for an additional 96 hrs in R-10 medium
without α-GalCer. At the end of the culture, cells were harvested, stained with PE-labeled
CD1d tetramer and anti-B220–PerCP, and analyzed by flow cytometry. Dead cells were
excluded from the analysis by electronic gating. CFSE dilution analysis was performed
on B220–tetramer+ iNKT cells.
Statistical analysis. Statistical analysis was performed as described in Chapter II.
76

Figure 19. Role of bacterial TLR ligands in the induction of iNKT cell hyporesponsiveness. (A) Mice were injected with E. coli flagellin (20 μg) or LPS (3 doses of 10 μg every 3 days), and 3 weeks later mice were rechallenged in vivo with vehicle or α-GalCer (1 μg/mouse, i.p.). Mice were then sacrificed 3 days later and spleen cells were stained with anti-TCRβ-FITC, anti-B220-PerCP, and tetramer-APC, and analyzed by flow cytometry. Numbers indicate the percentage of TCRβ+tetramer+ cells among B220- cells for representative data of 6-9 mice per group from 2 experiments. (B) Graphical representation of the total spleen iNKT cells calculated from the experiments shown in (A). *, p<0.05 as compared with naive mice rechallenged with α-GalCer. (C) The in vitro response of splenocytes to α-GalCer from mice treated 3 weeks earlier with α-GalCer, E. coli flagellin, or E. coli LPS. Mice were injected with α-GalCer or the indicated TLR ligands, sacrificed 3 weeks later, and splenocytes (2 × 10⁵ per well) were cultured with graded doses of α-GalCer. After 3 days, proliferation was assessed by [3H]thymidine incorporation and culture supernatants were evaluated for IL-4 and IFN-γ levels by ELISA. Proliferation and cytokine results represent the mean ± SEM of 4 mice. *, p<0.05 as compared with naive splenocytes.
77

Figure 20. Role of flagellin in the induction of iNKT cell hyporesponsiveness. Mice were injected with flagellin+ E. coli or flagellin- DH5α, and 3 weeks later mice were rechallenged in vivo with vehicle or α-GalCer (1 μg/mouse, i.p.). Mice were then sacrificed 3 days later and spleen cells were stained with anti-TCRβ-FITC, anti-B220-PerCP, and tetramer-APC, and analyzed by flow cytometry. Numbers indicate the percentage of TCRβ+tetramer+ cells among B220- cells for representative data of 4-6 mice per group from 2 experiments.
78

Figure 21. Role of IL-12 in the induction of iNKT cell hyporesponsiveness. (A) Wild type mice and IL-12p40-deficient mice were treated with α-GalCer or heat-killed E. coli. Three weeks later, mice were sacrificed and splenocytes (2 × 10⁵ per well) were cultured with graded doses of α-GalCer, proliferation was assessed 3 days later by [3H]thymidine incorporation and culture supernatants were evaluated for IL-4 and IFN-γ levels by ELISA. Proliferation and cytokine results represent the mean ± SEM of 4-9 mice pooled from 2 separate experiments. *, p<0.05 as compared with naïve splenocytes cultured with the same dose of α-GalCer. Wild type mice pretreated with α-GalCer or heat-killed E. coli was compared with wild type naïve mice whereas IL-12p40-deficient mice pretreated with α-GalCer or heat-killed E. coli were compared with IL-12p40-deficient naïve mice. NS, not significant. (B) Spleen cells were prepared at the indicated time points and 2 × 10⁵ cells were cultured for 6 hrs in plain medium (alone) or 100 ng/ml α-GalCer (αGC) in the presence of GolgiPlug. Cells were then harvested and surface-stained with tetramer-PE and anti-B220-PerCP, followed by intracellular staining with anti-IFN-γ-FITC and anti-IL-4-APC. Data are shown for B220-tetramer+ cells. Numbers indicate the percentage of cells within each quadrant. Data shown are representative of 3-4 mice per group.
79

Figure 22. Role of IL-12 in bacteria-induced iNKT cell activation. Wild type mice and IL-12p40-deficient mice were treated with α-GalCer or heat-killed E. coli and at day 1, mice were sacrificed and splenocytes were stained for the identification of iNKT cells with anti-TCRβ-FITC, anti-NK1.1-PE, anti-B220-PerCP, and tetramer-APC. The percentage of NK1.1- cells among iNKT cells is shown. Data shown are representative of 4 mice per group.
80

Figure 23. Costimulation is not required for the induction of iNKT cell hyporesponsiveness. Wild type mice and CD86-deficient mice were treated with heat-killed E. coli and 3 weeks later, mice were rechallenged with vehicle or α-GalCer (1 μg/mouse, i.p) in vivo. Mice were sacrificed 3 days later and splenocytes were stained for the identification of iNKT cells with anti-TCRβ-FITC, anti-B220-PerCP, and tetramer-APC and analyzed by flow cytometry. Numbers indicate the percentage of TCRβ
+tetramer+ cells among B220- cells for representative data of 2 mice per group.
81

Figure 24. Bacteria-induced iNKT cell hyporesponsiveness is thymus-independent. Thymectomized and non-thymectomized B6 mice were treated with α-GalCer (5 μg/mouse, i.p) or the indicated bacteria. Three weeks later, mice were rechallenged with vehicle or α-GalCer (1 μg/mouse, i.p) in vivo. Mice were sacrificed at day 3 and spleen cells were stained with anti-TCRβ-FITC, anti-B220-PerCP, and tetramer-APC, and analyzed by flow cytometry. Numbers indicate the percentage of TCRβ+tetramer+ cells among B220- cells for representative data of 2 mice per group.
82

Figure 25. Expression of NK1.1 in euthymic and athymic mice treated with bacteria. Euthymic and athymic B6 mice were treated with α-GalCer (5 μg/mouse, i.p.) or the indicated bacteria. Three weeks later, mice were sacrificed and spleen mononuclear cells were stained with anti-TCRβ-FITC, anti-NK1.1-PE, anti-B220-PerCP, and tetramer-APC and analyzed by flow cytometry. Histograms were gated on B220-TCRβ+tetramer+ cells. Numbers indicate the percentage of NK1.1- cells. Shaded area indicates NK1.1 staining on naïve animals. Data shown are representative of 2 mice per group.
83
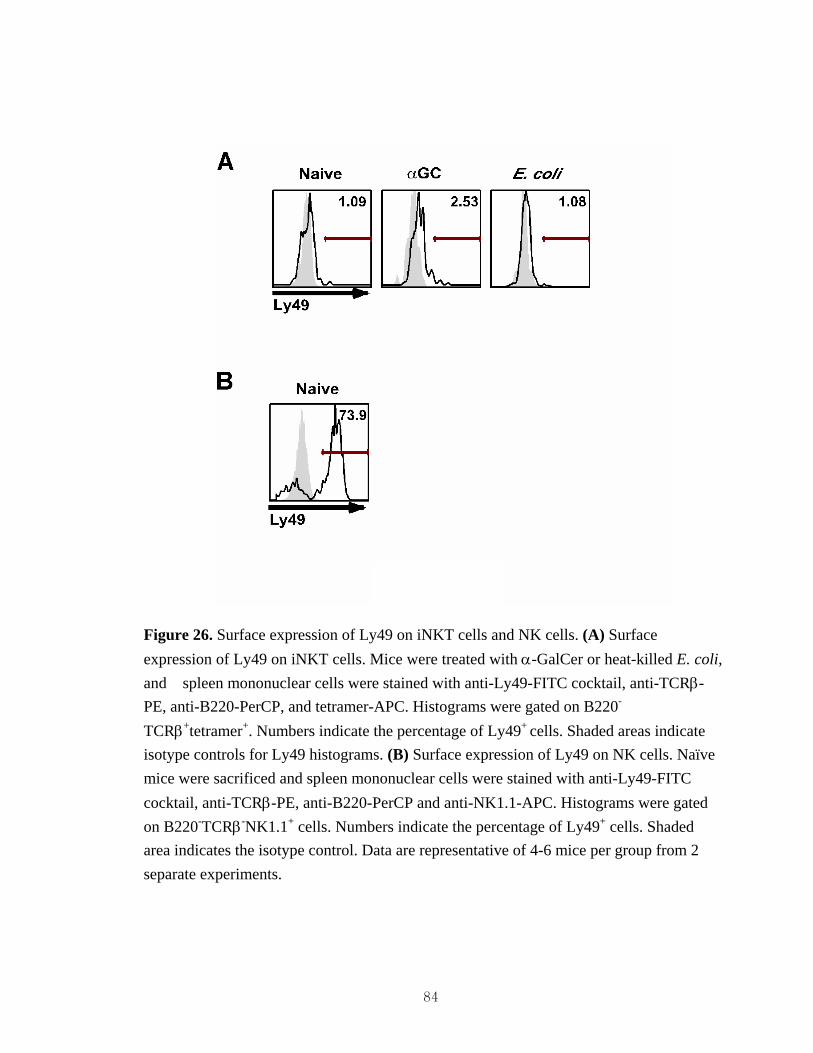
Figure 26. Surface expression of Ly49 on iNKT cells and NK cells. (A) Surface expression of Ly49 on iNKT cells. Mice were treated with α-GalCer or heat-killed E. coli, and spleen mononuclear cells were stained with anti-Ly49-FITC cocktail, anti-TCRβ-PE, anti-B220-PerCP, and tetramer-APC. Histograms were gated on B220-
TCRβ+tetramer+. Numbers indicate the percentage of Ly49+ cells. Shaded areas indicate isotype controls for Ly49 histograms. (B) Surface expression of Ly49 on NK cells. Naïve mice were sacrificed and spleen mononuclear cells were stained with anti-Ly49-FITC cocktail, anti-TCRβ-PE, anti-B220-PerCP and anti-NK1.1-APC. Histograms were gated on B220-TCRβ-NK1.1+ cells. Numbers indicate the percentage of Ly49+ cells. Shaded area indicates the isotype control. Data are representative of 4-6 mice per group from 2 separate experiments.
84

wells per group and representative of 2 independent experiments. (B) Mice were injected with α-GalCer or heat-killed E. coli and sacrificed at 3 weeks. DCs and iNKT cells were then MACS-purified as described in Methods. DCs (2 × 10⁴ per well). were loaded with α-GalCer and cultured with splenic CFSE-labeled iNKT cells (1 × 10⁵ per well). Cells were harvested 3 days later and stained with anti-B220-PerCP, tetramer-APC and analyzed by flow cytometry. Data shown are CFSE staining on iNKT cells. Numbers indicate the percentage of CFSE- iNKT cells. Three mice per group were pooled for the experiment.
Figure 27. Bacteria-induced iNKT cell hyporesponsiveness is predominantly iNKT cell autonomous. (A) Mice were injected with α-GalCer or heat-killed E. coli and sacrificed at 3 weeks. DCs from the spleen and iNKT cells from the liver were then enriched as described in Methods. iNKT cells (1 × 10⁵ per well) and DCs (5 × 10⁴ per well) were then cultured in different combinations in the presence or absence of α-GalCer. Proliferation was assessed by [3H]thymidine incorporation, and IFN-γ and IL-4 levels in the supernatant were evaluated by ELISA. Data shown are the mean ± SD of
85

Figure 28. Bacteria-induced iNKT cell hyporesponsiveness is predominantly iNKT cell autonomous. Mice were left untreated or injected with heat-killed E. coli (A) or live L. monocytogenes (B). DCs were MACS-purified from naïve mice, pulsed with α-GalCer, washed and then injected i.v. (2 × 10⁵ DCs per mouse) into naive mice, or mice treated three weeks earlier with the indicated bacteria. As a control, mice were also treated without DC (no DC). Mice were sacrificed 3 days later, splenocytes were stained with anti-TCRβ-FITC, anti-B220-PerCP, and tetramer-APC, and analyzed by flow cytometry. Numbers indicate the percentage of TCRβ+tetramer+ cells among B220- cells. Data shown are representative of 2 mice per group.
86
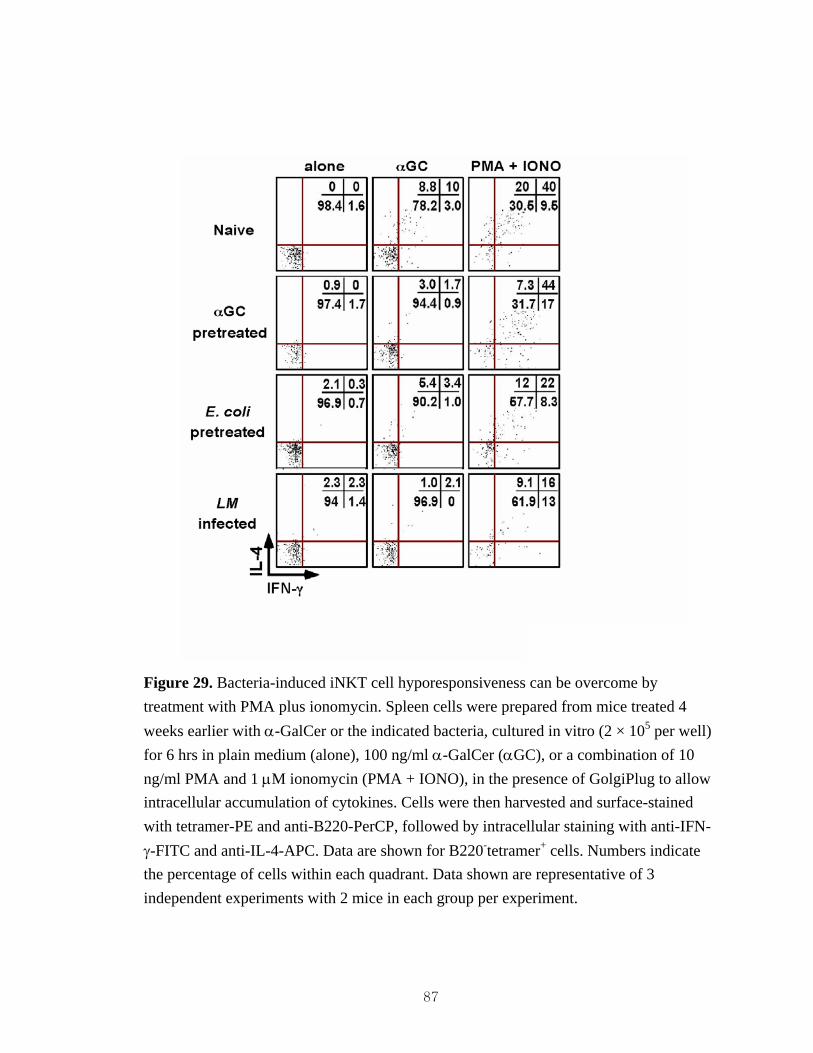
Figure 29. Bacteria-induced iNKT cell hyporesponsiveness can be overcome by treatment with PMA plus ionomycin. Spleen cells were prepared from mice treated 4 weeks earlier with α-GalCer or the indicated bacteria, cultured in vitro (2 × 10⁵ per well) for 6 hrs in plain medium (alone), 100 ng/ml α-GalCer (αGC), or a combination of 10 ng/ml PMA and 1 μM ionomycin (PMA + IONO), in the presence of GolgiPlug to allow intracellular accumulation of cytokines. Cells were then harvested and surface-stained with tetramer-PE and anti-B220-PerCP, followed by intracellular staining with anti-IFN-γ-FITC and anti-IL-4-APC. Data are shown for B220-tetramer+ cells. Numbers indicate the percentage of cells within each quadrant. Data shown are representative of 3 independent experiments with 2 mice in each group per experiment.
87

Figure 30. Bacteria-induced iNKT cell hyporesponsiveness correlates with reduced IL-2 secretion and can be overcome by treatment with α-GalCer plus IL-2. (A) Spleen cells were prepared from mice treated 4 weeks earlier with α-GalCer or the indicated bacteria, cultured in vitro (2 × 10⁵ per well) with graded doses of α-GalCer. After 3 days, proliferation was assessed by [3H]thymidine incorporation and culture supernatants were evaluated for IL-2 levels by ELISA. Results represent the mean ± SEM. *, p<0.05 as compared with naïve splenocytes cultured with the same dose of α-GalCer. (B) IL-2 overcomes the proliferative defect of hyporesponsive iNKT cells in vitro. Spleen cells from naive mice or from mice injected 1 month earlier with α-GalCer or heat-killed E. coli were labeled with CFSE. Cells (2 × 10⁵ per well) were then cultured with α-GalCer (100 ng/ml) for 24 hrs in the presence or absence of IL-2 (10 ng/ml). Cells were then washed and cultured for an additional 96 hrs without α-GalCer in the presence or absence IL-2. At the end of the culture period, cells were analyzed by flow cytometry. CFSE dilution was analyzed on B220-tetramer+ cells. Numbers indicate the percentage of CFSE- cells among B220-tetramer+ cells. Representative data from 2 independent experiments are shown.
88

Figure 31. Surface expression of NK1.1, NKG2D and CD94 on iNKT cells. Mice were treated with α-GalCer or heat-killed E. coli and spleen mononuclear cells were stained with different combinations of anti-NK1.1, anti-NKG2D-biotin, anti-CD94-biotin, streptavidin-FITC, anti-TCRβ-PE, anti-B220-PerCP, and tetramer-APC. Histograms were gated on B220-TCRβ+tetramer+. Shaded areas indicate isotype controls for NKG2D, CD94 and Ly49 histograms, and NK1.1 expression on naïve iNKT cells for NK1.1 histograms. Numbers indicate the percentage of NK1.1-, NG2D+, or CD94+ cells among iNKT cells. Data are representative of 5-6 mice per group from 2 independent experiments.
89

Figure 32. Nitric oxide does not contribute to the bacteria-induced hyporesponsive phenotype of iNKT cells. Spleen cells from naive mice or from mice injected 1 month earlier with α-GalCer, heat-killed E. coli, or live L. monocytogenes were cultured in vitro (2 × 10⁵ per well) with graded doses of α-GalCer in the presence or absence of inducible nitric oxide synthase (iNOS) inhibitor, NG-monomethyl-L-arginine. After 3 days, proliferation was assessed by [3H]thymidine incorporation. Proliferation results represent the mean ± SEM.
90

Figure 33. Expression of PD-1 in mice treated with bacteria. (A) Mice were treated with α-GalCer (5 μg/mouse, i.p.) or the indicated bacteria and mice were sacrificed at day 1, and spleen mononuclear cells were stained with anti-TCRβ-FITC, anti-PD-1-PE, anti-B220-PerCP, and tetramer-APC and analyzed by flow cytometry. Data shown are gated on B220-TCRβ+tetramer+ cells. The shaded area represents the PD-1 staining of naïve iNKT cells, and the solid line represents the staining of iNKT cells from mice treated with α-GalCer or bacteria. (B) Wild type or IL12-deficient mice were treated with α-GalCer (5 μg/mouse, i.p.) or heat-killed E. coli and spleen mononuclear cells were stained as above for PD-1. The shaded area represents the PD-1 staining of naïve iNKT cells, dotted line α-GalCer, and the solid line heat-killed E. coli. Data shown are representative of 2-4 mice per group.
91

CHAPTER IV
CONCLUSIONS AND PERSPECTIVES
Natural killer T (NKT) cells are unique T lymphocytes that co-express T cell
receptors (TCRs) and natural killer (NK) cell markers (36, 171, 172, 202-204). Most
NKT cells, referred to as invariant NKT (iNKT) cells, express a semi-invariant TCR
consisting of a Vα14-Jα18 chain paired predominantly with a Vβ8.2 chain in mice (94).
Unlike conventional T cells, which recognize peptides presented by MHC class I or class
II proteins, iNKT cells are specific for glycolipid antigens presented by the MHC class I-
related protein CD1d. In response to TCR engagement, iNKT cells can rapidly produce a
variety of cytokines and, hence, these cells can impart potent immunoregulatory
properties. As such, iNKT cells can promote protective immune responses against
infectious agents, suppress autoimmunity, promote natural tumor immunity and regulate
allergic airway inflammation, atherosclerosis, colitis and contact hypersensitivity in mice.
The physiological antigens that are recognized by iNKT cells remain
incompletely understood (205). All iNKT cells react with the glycosphingolipid α-
galactosylceramide (α-GalCer), which was originally isolated from a marine sponge.
More recently, it has been demonstrated that iNKT cells can react with α-anomeric
glycosphingolipids derived from the cell wall of gram-negative Sphingomonas bacteria
(55, 56, 130) and with α-galactosyl-diacylglycerols from the spirochete Borrelia
burgdorferi (56), the etiologic agent of Lyme disease. However, the endogenous ligands
92

for iNKT cells remain to be fully characterized (206).
The immunomodulatory properties of iNKT cells have been exploited for the
development of immunotherapies (36, 171, 172, 204, 207). In most of these studies,
derivatives of α-GalCer have been employed. α-GalCer potently activates iNKT cells to
secrete a mixture of T helper (Th) 1 and Th2 cytokines. iNKT cells activated in this
manner transactivate a variety of other cell types, including antigen presenting cells
(APCs), NK cells and conventional T and B cells (78). The potent immunostimulatory
activities of α-GalCer on APCs, in particular dendritic cells (DCs), have been exploited
for the development of vaccine adjuvants. In addition, repeated injection of α-GalCer can
prevent development of tumor metastases and Th1-dominant autoimmunity in mice (36,
171, 172, 204, 207).
A thorough understanding of iNKT cell responses to various stimuli is important
in order to develop effective iNKT cell-based adjuvants and immunotherapies for human
disease. Prior studies have shown that a single injection of α-GalCer to mice results in
rapid iNKT cell activation and cytokine production. This activation also results in
transient downregulation of the invariant TCR and sustained downregulation of the NK
cell marker NK1.1 on iNKT cells (95-97). In vivo-activated iNKT cells rapidly
proliferate, leading to profound expansion of this cell population in multiple organs,
which peaks around three days after α-GalCer treatment. This period of rapid iNKT cell
expansion is followed by a contraction phase mediated by homeostatic mechanisms.
Importantly, restimulation of these α-GalCer-experienced iNKT cells with α-GalCer
results in a suppressed response because the iNKT cells acquire an anergic phenotype
(25, 92, 98, 99). iNKT cell anergy induced in this manner is maintained for at least one
month. Additional studies showed that iNKT cell anergy has a profound impact on iNKT
93

cell-mediated functions and the therapeutic properties of α-GalCer (25).
iNKT cell activation has been observed in the context of glycolipid antigens,
cytokines, multiple microorganisms and inflammatory stimuli (36, 126, 171, 172, 208).
In the case of certain microorganisms, such as Sphingomonas and Borrelia, iNKT cell
activation involves specific, pathogen-derived glycolipid antigens. For many other
microorganisms, however, there is no evidence for direct iNKT cell activation by
microbial glycolipid antigens. Instead, many microorganisms might activate iNKT cells
in a non-specific manner, by stimulating the production of pro-inflammatory cytokines by
DCs that can activate iNKT cells by themselves, in concert with endogenous glycolipid
antigens, or by inducing CD1d expression on APCs (55, 63, 190, 209). Whether iNKT
cell activation by microorganisms influences subsequent responses of these cells to
antigenic stimulation remains unclear.
In this dissertation, I report results demonstrating that bacteria have a profound
impact on the functional status of iNKT cells with long-term effects on the therapeutic
activities of these cells.
In chapter II, I tested the capacity of a wide variety of bacteria, including the
gram-positive organisms L. monocytogenes and S. aureus, and the gram-negative
organisms E. coli, S. typhimurium, and S. capsulata to activate iNKT cells and to
modulate the functions of these cells. While activation of iNKT cells was observed
immediately following infection by all the organisms, sustained long-term phenotypic
changes characterized by NK1.1 downregulation, generally associated with iNKT cell
hyporesponsiveness in studies with α-GalCer (25), were only observed with E. coli, S.
aureus, S. typhimurium, and L. monocytogenes. Notably, L. monocytogenes induced
94

drastic loss of cellularity. Interestingly, S. capsulata did not induce sustained changes in
the surface phenotype of iNKT cells.
In accordance with results from phenotypic analysis, ex vivo and in vivo
assessment of iNKT cell function in mice previously infected E. coli, S. aureus, S.
typhimurium, or L. monocytogenes but not other bacteria showed significant suppression
of iNKT cell functions during recall response using α-GalCer as a surrogate secondary
antigen. Specifically, when splenocytes from naïve and infected mice were cultured ex
vivo in the presence of graded concentrations of α-GalCer, the iNKT cell response
represented by proliferation, or IFN-γ and IL-4 secretion was defective in infected mice.
Further, in vivo expansion of iNKT cells and transactivation of DC, B and NK cells
normally observed following α-GalCer administration was also absent in bacteria
infected mice.
iNKT cells are thought to be involved in various disease processes including
autoimmune diseases and cancer. In particular, iNKT cells have been shown to play a
detrimental role in ConA-induced hepatitis (170), a mouse model for human autoimmune
hepatitis. As expected from hyporesponsiveness of iNKT cells, infected mice exhibited
significantly reduced hepatitis as documented by decrease in ALT levels that correlates
the extent of liver injury. The therapeutic activity of iNKT cells were also evaluated
using B16 melanoma metastasis model and EAE, a mouse model for multiple sclerosis.
Whereas loss of therapeutic efficacy of α-GalCer against melanoma metastasis was
observed in infected mice, protective effect of α-GalCer in preventing EAE was retained.
In Chapter III, the mechanism of bacteria-induced iNKT cell hyporesponsiveness
was explored guided by previous reports on α-GalCer-induced iNKT cell anergy. Known
microbial glycolipid antigens specific for iNKT cells were absent in all the organisms
95

found to induce iNKT cell hyporesponsiveness in Chapter II. However, in the absence of
cognate antigen, iNKT cells can be activated in a manner that depends on IL-12 secretion
and endogenous ligand presentation by DCs activated by toll-like receptor (TLR) ligands
(126). We therefore investigated whether TLR ligands can induce iNKT cell
hyporesponsiveness. Our results showed that TLR4 and TLR7 ligands LPS and flagellin
from E. coli and Salmonella were able to induce hyporesponsiveness in iNKT cells, but
not with other TLR ligands. Further, IL-12 secretion by DCs induced by LPS and
flagellin was required for the induction of iNKT cell hyporesponsiveness by bacteria.
Consistent with mechanisms observed with α-GalCer-induced iNKT cell anergy
(25), bacteria-induced iNKT cell hyporesponsiveness was thymus-independent, which
was indicated by suppressed iNKT cell response in infected thymectomized mice.
Bacteria-induced hyporesponsiveness was also predominantly cell autonomous ruling out
extrinsic factors such as tolerogenic APC to be responsible for the hyporesponsive
phenotype. Likewise, a combination of PMA and ionomycin, which bypasses proximal
TCR signaling events, could overcome the hyporesponsive phenotype of iNKT cells
induced by bacteria, and exogenous addition of IL-2 also rescued hypoproliferation of
iNKT cells probably due to defective IL-2 secretion in bacteria-infected mice.
Downregulation of activating receptors, including NK1.1, NKG2D, and possibly
NKG2C/CD94 was observed in mice treated with bacteria, which might contribute to
iNKT cell hyporesponsiveness in these animals. Notably, PD-1 molecule currently
implicated in T cell exhaustion or anergy during chronic infection (195, 197, 210), was
upregulated on hyporesponsive iNKT cells, at least during early phases of iNKT cell
activation by bacteria, providing insight into possible molecular mechanisms of bacteria-
induced hyporesponsiveness. Additionally, iNOS inhibitor, which rescues
96

hyporesponsive phenotype of iNKT cells in a cancer-bearing state (192), did not affect
iNKT cell hyporesponsiveness. Absence of CD86 also did not affect iNKT cell
hyporesponsiveness.
Collectively, results from Chapters II and III have shown that certain bacterial
organisms can activate iNKT cells and render these cells functionally suppressed for a
sustained time period, which was accompanied by sustained phenotypic changes
indicative of anergic cells, and this hyporesponsiveness phenotype of iNKT cells was
associated with decreased therapeutic activities.
A simple classic model of host defense against invading pathogens begins with
phagocytosis of pathogens by APCs such as DCs and macrophages that are activated by
recognition of pathogen associated molecular patterns including but not limited to various
TLR ligands expressed by microbes, which is termed the danger signal (211-213). These
APCs present microbial peptide antigens to CD4 T cells in conjunction with
costimulation through CD80/CD86, CD40, CD70 and other molecules upregulated by the
presence of the danger signal. The naïve helper CD4 T cells then differentiate into Th1 or
Th2 cells to provide cytokine help for the other arms of the adaptive immune system
including CD8 T cells and B cells that respond specifically to microbial antigens
presented by DCs, or augment functions of macrophages, neutrophils and other cells of
the innate immune system. iNKT cells function as the amplifier during early phases of
the immune response by rapidly producing Th1 and/or Th2 cytokines in response to
either direct stimulation of their TCRs by microbial glycolipid antigens in the case of S.
capsulata (55, 130, 134) or B. burgdorferi (59), or indirect stimulation by activated DCs
that present endogenous antigens along with proinflammatory cytokines in response to
TLR activating signals (55, 63, 136, 190, 209). The explosive secretion of Th1 and/or
97

Th2 cytokines by iNKT cells transactivates DCs reciprocally as well as NK cells, T cells
and B cells thereby modulating the rapidity of immune response against invading
microbes (78).
When the same pathogen invades, a similar response is exhibited by the immune
system with one key difference. While the cells of the innate immune system recapitulate
the initial response, T and B cells, the two arms of adaptive immunity, exhibit a typical
memory response, characterized by rapid clonal expansion and differentiation of the
pathogen-specific memory cells to mediate immediate effector function against the
pathogen (1). This rapid and strong immune response usually clears the pathogen even
before development of symptoms and signs of infection.
Although iNKT cells are a subset of T cells expressing receptors that are
characteristic of the adaptive immune system, their primary function is to bridge the
innate and adaptive immunity. As a result, it was unclear whether iNKT cells would
exhibit the features of innate or adaptive immunity. Surprisingly, it was neither, as the
primary response of iNKT cells towards α-GalCer or certain species of bacteria resulted
in functional inactivation of these cells for an extended period of time (Figure 34).
The induction of iNKT cell anergy by a pharmacological dose of α-GalCer, a
potent purified synthetic ligand for iNKT cells, could be rationalized by excessive
stimulation of TCR of iNKT cells in the absence of the danger signal, which in
conventional T cells often results in anergy as well. However, a similar induction of
iNKT cell hyporesponsiveness by bacteria that activates iNKT cells only indirectly
through DCs that present autoreactive antigen and cytokines in the absence of specific
microbial antigen may be a physiologically important reflection of in vivo response of
iNKT cells. iNKT cells have the capacity to secrete explosive levels of both Th1 and Th2
98

cytokines, and repeated activation and functional response of these cells may result in a
state of cytokine storm which may sometimes do more harm than good as tissue damage
that occurs during infection is attributed to the toxicity of invading pathogens as well as
excessive immune response. An uncontrolled response of iNKT cells will ensue without a
mechanism to limit the function of these cells particularly because, unlike conventional T
cells with restricted specificity, iNKT cells can respond to a wide variety of pathogens
non-specifically. This functional promiscuity is critical for iNKT cells to bridge the
innate and adaptive immune system with a severely restricted TCR repertoire in response
to diverse pathogens, but these same beneficial characteristics can also have a detrimental
effect. Furthermore, iNKT cells also have important immunomodulatory roles in cancer,
autoimmunity, atherosclerosis and various other disease processes, and uncontrolled
response by iNKT cells may have an adverse impact on the host health.
However, among multiple bacteria tested, a select few induced iNKT cell
hyporesponsiveness. The apparent lack of iNKT cell hyporesponsiveness observed with S.
capsulata, E. faecalis, and S. pyogenes may simply be attributed to the dose of treated
bacteria. As it may be possible that the entire compartment of iNKT cells must acquire
the hyporesponsive phenotype in order to exhibit an overall functional deficit, we cannot
rule out that individual iNKT cells that were activated during treatment with these
bacteria acquired the hyporesponsive phenotype while the remainder of iNKT cell
population compensated to show normal response.
Otherwise, the variability in the capacity of bacteria to induce iNKT cell
hyporesponsiveness is an actual physiological phenomenon and likely reflects the
differences in the expression profile of PAMPs or TLR ligands of the particular species
of bacteria. We have tested a wide variety of TLR ligands and have shown that LPS and
99

flagellin isolated from E. coli or S. typhimurium can induce iNKT cell
hyporesponsiveness, but not CpG, imiquimod, lipoteichoic acid, polyinosinic acid-
polycytidylic acid, indicating that the combination of PAMPs expressed on bacteria may
determine their capacity to render iNKT cells hyporesponsive.
Interestingly, the induction of iNKT cell hyporesponsiveness by TLR ligands and
whole bacteria required IL-12 secretion by DCs. It is certain that IL-12 is not the sole
causative molecule for iNKT cell hyporesponsiveness as exogenous IL-12 administration
does not induce iNKT cell hyporesponsiveness (data not shown). Further, other TLR
ligands that were unable to induce hyporesponsiveness, in particular CpG, induce
secretion of high levels of IL-12 by DCs (214). Other factors are therefore thought to be
required in order to facilitate the induction of hyporesponsiveness. One example might be
IL-18, another proinflammatory cytokine induced by LPS (136). An alternative
mechanism that has not been explored thoroughly is that iNKT cells can be directly
stimulated by TLR ligands. Prior reports of TLR-4 and TLR-9 expression by iNKT cells
opens up this possibility (215, 216), although expression of TLR-4 has since been refuted
(136) and TLR-9 seems to be dispensable in the induction of iNKT cell
hyporesponsiveness (data not shown). The prominent candidate is TLR-5, and it is
unknown whether this molecule has a direct role in iNKT cells. In addition to TLR
ligands, some bacterial products may stimulate Type II NKT cells with diverse TCR
repertoire. Sulfatide, one of the ligands specific for a subset of Type II NKT cells has
been shown to induce iNKT cell anergy through indirect stimulation by DCs (198).
Interestingly, this process was also dependent on IL-12. Involvement of DCs and IL-12 in
the induction of iNKT cell anergy by sulfatide is reminiscent of bacteria-induced iNKT
cell hyporesponsiveness. Also, downregulation of activating receptors, in particular
100

NKG2D, was observed in mice treated with bacteria. In humans, NKG2D ligands MICa
and MICb have been shown to be upregulated in activated DCs in response to TLR
ligands (217). Likewise, murine NKG2D ligands Rae-1 and H-60 might be upregulated in
DC activated by bacterial products including TLR ligands. Therefore, downregulation of
activating receptors might contribute to iNKT cell hyporesponsiveness in these animals.
The exact mechanism by which the hyporesponsive phenotype of iNKT cells is
induced remains incompletely understood, but our current model of the bacteria- or α-
GalCer-induced iNKT cell hyporesponsiveness is summarized in Figure 35. It should be
noted that further understanding of the signaling pathways and outcome of TLR signaling
in DCs and potentially in iNKT cells may provide a profound insight.
Several features of bacteria- and α-GalCer-induced iNKT cell
hyporesponsiveness are reminiscent of features of T cell anergy from which we can draw
insights into the molecular mechanism. T cell anergy is broadly categorized into clonal
anergy and adaptive tolerance with distinct features (137), but interestingly, iNKT cell
anergy seems to exhibit features of both types of T cell anergy. The activated phenotype
of naïve iNKT cells characterized by CD69 and CD44 expression, the hypothesized
absence of persistent antigen unless continuous DCs present the endogenous ligand for an
extended period, and rescue of hypoproliferation by IL-2 are characteristics of clonal
anergy, while anergy induction in naïve iNKT cells and suppression of IFN-γ and IL-4
production closely resemble adaptive tolerance.
It has long been known that calcium/calmodulin/calcineurin pathways are
involved in the induction of clonal anergy as cyclosporine was able to block the induction
(218). Specifically, it has recently been shown that NFAT1 activation is responsible for
the induction of clonal anergy (142). On the other hand, during maintenance of clonal
101

anergy, activation of the calcium/calcineurin pathway in the cell is intact. The blockade
instead appears to be in activation of the Ras/MAP kinase pathway and caused by
constitutive activation of a GTP activating protein (GAP) (219, 220). Downstream ERK
and JNK pathways are inhibited as a result of inactive Ras. The biochemical block in
adaptive tolerance seems to be more proximal. It was shown in the staphylococcal
enterotoxin B (SEB) model that adaptive tolerance inhibited activation-induced TCR zeta
chain (p23) and ZAP-70 phosphorylation (221), and consequently intracellular calcium
mobilization (222, 223). In cytochrome c double transgenic mice this effect was
correlated with a block in phospholipase C-γ1 phosphorylation, required for the
generation of the IP3 that mediates calcium release from intracellular stores (137). In
contrast, activation of the Ras/MAP kinase pathway does not seem to be involved.
Additionally, biochemical block in signal transduction through the IL-2 receptor is also
found in adaptive tolerance preventing exogenous IL-2 from restoring the proliferative
capacity.
These findings in T cell anergy provide important insights into iNKT cell
hyporesponsiveness. It would be extremely interesting to see whether Ras/MAP kinase
pathway or proximal tyrosine kinase phosphorylation/PLC-γ1 phosphorylation is affected
in our model of bacteria- and α-GalCer-induced iNKT cell hyporesponsiveness. The
possible involvement of NFAT1 would be also an interesting area of future research. In
addition, we have preliminary findings suggesting the involvement of PD-1 in the
induction of iNKT cell anergy. The molecular mechanism of T cell exhaustion during
chronic infection mediated by PD-1 is unclear and further investigation into PD-1 signal
transduction might be important.
Our results reporting iNKT cell hyporesponsiveness induced by bacteria have a
102
number of important implications for the therapeutic application of iNKT cell biology in
disease models. It should be noted that infection by bacteria is a frequent occurrence in
the human population, particularly in patients afflicted with various autoimmune diseases
or cancer that are targets of iNKT-cell based therapies. In this setting, bacteria-induced
hyporesponsiveness is extremely relevant. Indeed, during clinical trials, it has become
apparent that iNKT cell prevalence and function in the human population is extremely
variable (164, 178), which may be due to both genetic factors as well as environmental
factors such as infection.
These findings may impose certain limitations on iNKT cell based therapies. In
particular, significant progress has been made in utilizing α-GalCer or α-GalCer-pulsed
DC for treatment of non-small cell lung cancer and various other metastatic malignancies
(103-107). As efficacy of treatment will heavily depend on the function of iNKT cells,
further investigation of the impact of infection on iNKT cell functions in human is
warranted. If our murine studies indeed extend to human subjects, it may be critical to
either modify treatment regimens to avoid use of α-GalCer therapy in patients previously
exposed to anergy-inducing pathogens, or develop adjuvants that can break or overcome
iNKT cell hyporesponsiveness.
In contrast, bacteria-induced hyporesponsiveness might actually benefit some
patients suffering from diseases exacerbated by iNKT cell function such as human
autoimmune hepatitis, atherosclerosis, and others. Indeed, as prior exposure to bacteria
reduced disease severity during the ConA-induced hepatitis model, human autoimmune
hepatitis might likewise be alleviated by infection. There has been growing scientific
consensus that the exponential increase in the incidence of autoimmunity in developed
countries may be a result of excessive hygiene and absence of beneficial infections that
103

may limit development of autoimmunity. While it may be absurd to deliberately infect
people with pathogens to prevent autoimmune diseases, administration of certain
microbial products such as flagellin with minimal toxicity that can induce iNKT cell
hyporesponsiveness may prove useful in alleviating these diseases.
104

Adaptive ImmunityInnate ImmunityiNKT cells
Ef
105
fect
or R
espo
nse
Primary Challenge
Secondary Challenge
Time
Figure 34. The primary and secondary responses of the innate immune system, the adaptive immune system, and iNKT cells. Innate immunity is characterized by an immediate response to the challenge. The primary and secondary responses are similar. Adaptive immunity is characterized by the latency during the primary response and a more rapid and stronger secondary response, which is termed a memory response. iNKT cells exhibit a rapid response during the primary response followed by hyporesponsiveness during the secondary response.

Rae-1 or H-60 NK1.1
NKG2D
TCR
IL-12R
IL-12
PD-1PD-L1/2
CD1d
autoantigen
TLR ligands (LPS, flagellin)
TLR
IFN-γ
IL-2
IL-2R
APCiNKT
NK1.1
NKG2D
TCR
IL-12R
IL-12
PD-1PD-L1/2
CD1d
αGalCerTLR
IFN-γ/IL-4
IL-2
IL-2R
APCiNKT
TCR
IL-12R
IL-12 CD1d
αGalCer
IFN-γ/IL-4↓IL-2↓
IL-2R
APCiNKT
Exogenous IL-2 rescues proliferative defects
A B
C
Figure 35. The model of α-GalCer- or bacteria-induced iNKT cell hyporesponsiveness. (A) α-GalCer is presented by CD1d expressed on APCs, which ligates the TCR of iNKT cells. In response iNKT cells produce IFN-γ and IL-4 which reciprocally activate APCs to secrete IL-12 that in turn further activates iNKT cells. Additionally, PD-L1/2 expressed on APCs engage PD-1 upregulated on iNKT cells. (B) Bacterial products including TLR ligands, for example LPS or flagellin, signal through TLR on APCs, likely DCs activating these cells. Activated DCs produce IL-12 and present an endogenous glycolipid ligand to iNKT cells. Activation of iNKT cells results in IFN-γ secretion. Expression of PD-L1/2 and induced expression of Rae-1 or H-60 engage with PD-1 or NKG2D expressed on iNKT cells possibly providing additional signals important for the induction of iNKT cell hyporesponsiveness. (C) During rechallenge with α-GalCer, iNKT cells from mice previously activated with a primary challenge with α-GalCer or bacteria show defects in TCR signaling pathway as well as secretion of IL-2, although IL-2 receptor signaling pathway is intact. This results in a suppressed response of iNKT cells to the rechallenge with α-GalCer.
106

APPENDIX
CELL-FATE MAPPING OF BONE MARROW STEM CELLS
Abstract
The hematopoietic stem cell (HSC) is defined as a self-renewing and multipotent
cell that continuously repopulates the hematopoietic system throughout adult life.
Among various tissue-derived stem cells, the HSC is one of the best characterized stem
cells. It is also the only stem cell that is clinically applied in the treatment of diseases
such as breast cancer, leukemia, and congenital immunodeficiency. At present, the
scope of clinical application of these cells is largely limited to the hematopoietic system.
However, recent developments in stem cell biology are opening up new possibilities. The
prevailing concept has been that the self-renewal activity of HSCs maintains the HSC
pool, and differentiation of HSCs provides a fresh supply of blood cells. By contrast,
recently described bone marrow-derived multipotent adult progenitor cells (MAPC),
which retain pluripotency, including the ability to repopulate the hematopoietic system,
challenge the established idea that tissue-specific HSCs are maintained only through self-
renewal activity. Furthermore, it is now thought that HSCs may be able to
transdifferentiate into other tissue types such as neural, cardiac, or skeletal muscle tissue,
although this capacity to transdifferentiate remains controversial. The use of adult stem
cells has gained in popularity as the best means to bypass the ethical complication of
107

embryonic stem cell research. We hypothesized that HSCs derive from a precursor
population, and can transdifferentiate into non-hematopoietic tissues as well as
hematopoietic tissue in vivo. To test this hypothesis, I attempted to develop a transgenic
mouse model that can be used for genetic tracing of the hematopoietic lineages. This
mouse model system is designed to provide a definitive answer to the question of the
origin of HSCs using an approach that mimics the natural in vivo system more closely
than prior studies.
108

Background and Significance
Stem cells
Stem cells are a subset of cells in the body that maintain self-renewal activity and
have the capacity to differentiate into multiple cell types. Stem cells may be categorized
into two different types. One is pluripotent stem cells that differentiate into all three germ
layers of endoderm, ectoderm and mesoderm. This cell type includes embryonic stem
cells, embryonic germ cells, and multipotent adult progenitor cells (MAPC) (224). For
instance, embryonic stem cells derived from the inner cell mass of the murine blastocyst
in vitro have the ability to contribute to somatic and germline tissues when injected into
the blastocyst of another mouse, which is exploited for generation of gene-targeted mice.
Their use in humans is limited due to ethical, political and legal reasons. On the other
hand, another type of stem cells is multipotent stem cells isolated from various tissues in
fetal and adult animals. These cells differentiate into a limited number of lineages,
usually restricted to the tissue these cells derive from. Somatic tissue-specific stem cells
such as bone marrow hematopoietic stem cells (HSC), neuronal stem cells, hepatic stem
cells and epidermal stem cells are in this category of cells. A number of different types of
putative stem cells are found in the mouse bone marrow: HSC, MAPC, mesenchymal
stem cell (MSC) and germline stem cell (GSC). However, the exact relationship among
these stem cells as well as their true function in vivo remains elusive (Figure 36).
Hematopoietic stem cell (HSC)
HSCs are functionally defined by their unique capacity to self-renew and to give
rise to all blood cell types. HSCs are the best characterized adult stem cells at present and
109
can be identified through surface staining. HSCs do not express mature blood lineage
markers and express sca-1, c-kit and a low level of thy-1.1. Following the initial
observation of stem cell activity in the sca-1+ fraction of the mouse bone marrow (225,
226), identification of c-kit expression allowed researchers to identify a highly enriched
population of cells with hematopoietic stem cell activity within the mouse bone marrow
(227-230). These cells are subdivided into long-term HSCs that have an extensive self-
renewal activity and short-term HSCs that arise from long-term HSCs and have limited
capacity to self-renew while retaining multipotency (231-233). These subsets of HSCs
are distinguished by markers such as tie-2 and flt-3 (234, 235). It has been shown that a
single HSC can give rise to long-term multilineage reconstitution and self-renewal in
irradiated mice (236, 237). In addition, HSCs can be enriched based on the fact that they
exclude Hoechst dye, a phenotype that represents an alternative description of HSCs
(238).
The downstream progeny of HSCs that are lineage restricted oligopotent progenitor
cells have also been identified (Figure 36). Common lymphoid progenitor (CLP),
common myeloid progenitor (CMP), granulocyte-monocyte progenitor (GMP), and early
thymic precursor (ETP) are examples of progenitor cells (239-244).
Bone marrow multipotent adult progenitor cells (MAPC) copurifying with mesenchymal
stem cells (MSC) are pluripotent stem cells.
Recent studies in stem cell research have revealed that bone marrow is a complex
organ harboring a wide variety of stem cells aside from hematopoietic stem cells. MSCs
and MAPCs are such examples. MSCs represent stromal cell precursors responsible for
maintaining the structural integrity of bone marrow by generation of mesenchymal
110
tissues. Jiang et al. (224) reported the discovery of a putative pluripotent stem cell
population in the bone marrow copurifying with MSCs. These cells were termed
mulltipotent adult progenitor cells (MAPC) and are the focus of this research work. These
cells were identified by limiting dilution of non-hematopoietic bone marrow cells and
subsequent in vitro culture. FACS analysis of these cells indicate lack of CD34, CD44,
CD45, c-kit, and major histocompatibility complex (MHC) class I and II expression, low
levels of flk-1, sca-1 and thy-1 expression, and significant levels of CD13 and stage-
specific antigen 1 (SSEA-1). It should be noted that MAPCs do not express any markers
of the hematopoietic lineage, including the markers for HSCs (e.g. CD34, c-kit). A single
MAPC is found to differentiate into cells of visceral mesoderm, neuroectoderm and
endoderm in vitro and, when injected into an early blastocyst, a single MAPC contributes
to most somatic cell types. Upon transplantation into a non-irradiated host, MAPCs
engraft and differentiate to the hematopoietic lineage, in addition to the epithelium of
liver, lung and gut. As MAPCs proliferate extensively without obvious senescence or loss
of differentiation potential, these cells may substitute embryonic stem cells or cord blood
cells as the cell source for therapy of inherited or degenerative diseases through
autologous transplantation without complications from graft rejection (245-247).
Pluripotency of MAPCs is demonstrated by in vitro culture, by blastocyst
injection, and by adoptive transfer experiments. In particular, MAPCs have been shown
to give rise to hematopoietic tissue, suggesting that these cells may indeed be a precursor
population that generates HSCs in vivo. On the other hand, the self-renewal activity of
hematopoietic stem cells is considered the primary mechanism of maintaining the pool of
HSCs at present, whereas the function and phenotype of MAPCs in vivo still remains
elusive.
111

HSC tissue plasticity
Traditionally, adult stem cells have been viewed as cells restricted to the
particular tissue of origin unable to differentiate into other tissues. Various reports in
recent years challenge this idea by demonstrating that adult stem cells, under certain
microenvironmental conditions, give rise to cell types in non-related tissues, possibly
indicating that they can switch cell fate. In particular, HSCs, besides forming blood cells,
have been reported to give rise to liver cells (248), skeletal muscle cells (249-255),
pancreatic islet cells (256), and other cell types.
For instance, skeletal muscle is a site where significant tissue transdifferentation
has been observed. Bone marrow mononuclear cells transplanted into immunodeficient
mice migrate to areas of muscle degeneration where they play a role in the regeneration
of the damaged fibers (249). Subsequent studies showed that transplantation of enriched
HSCs into irradiated mdx mice, a mouse model with increased muscle cell turnover, leads
to a low level contribution to muscle and partial restoration of dystrophin expression
(250). Whether this occurs via simple fusion of HSCs with the muscle fiber, or via
transdifferentiation of HSCs into muscle satellite cells followed by fusion with muscle
fibers is currently uncertain. One study provides evidence for a stepwise progression of
bone marrow cells – which may be different from HSC as the cells were not purified – to
satellite cells, mononucleated muscle stem cells, and then to multinucleated myofibers
(252), whereas such a progression could not be reproduced in another study (255).
Bone marrow derived mononuclear cells have also been described to contribute
to pancreatic islet cell regeneration. Following transplantation of bone marrow cells from
mice that express green fluorescent protein (GFP) when the insulin gene is actively
112

transcribed, 1.7–3% donor derived insulin expressing cells could be detected in the
pancreas of recipient mice (256). An appropriate control experiment ruled out cell
fusion between bone marrow donor cells and recipient islet cells. Yet other studies
suggested that, although donor cells can be detected in the pancreas, they might be
endothelial and not endocrine cells. For instance, bone marrow transplantation led to
normalization of glucose and insulin levels in streptozotocin-induced diabetic mice even
before appearance of donor-derived cells in the pancreas thereby suggesting an indirect
effect of bone marrow cells in insulin production of these mice (257).
The reports of tissue transdifferentiation have generated much confusion in the
stem cell field amid excitement since the concept of tissue plasticity denies the principles
in developmental biology that lineage restriction coincides with morphogenesis (258-
262). Nevertheless, stem cell plasticity is an important phenomenon that deserves further
attention as it can expand the scope of application for various tissue-specific stem cells.
Previous reports on tissue transdifferentiation heavily relied on adoptive transfer
experiments that have limitations in replicating the in vivo state of normal physiology.
Significance
The field of stem cell research is evolving rapidly and is currently receiving a
strong focus in the scientific and political community. A wide spectrum of therapeutic
applications in diseases such as neurodegenerative diseases, leukemia, myocardial
infarction and diabetes await advancement in the stem cell field for a possible cure.
Adult stem cells have a number of advantages to embryonic stem cells. Critical issues in
ethics can be bypassed by using adult stem cells, and moreover, adult stem cells will
continue to be a better source for histocompatible donor cells until human embryonic
113

cloning becomes a standard procedure and an extensive library of embryonic stem cell
lines is available from which to choose histocompatible donors.
How various stem cell populations in the body are maintained, and what the
relationships between the stem cells are, represent important questions that are not fully
understood. Bone marrow harbors a heterogeneous set of stem cells that constitutes blood,
bone, blood endothelium, and even germ tissues. Further, the possibility exists that a
pluripotent stem cell population, MAPC, may be sustaining these tissue specific stem
cells present in murine bone marrow as well as other stem cells localized in different
tissues. Our understanding of bone marrow stem cells is still too primitive to provide a
definite picture of lineage relationships, partly due to relative rarity of the stem cells as
well as the extreme complexity and heterogeneity of cell types in the bone marrow unlike
other tissues with limited types of parenchymal and stromal cells. The outcome of our
proposed research will provide important clues to determine how various stem cell
populations are maintained in vivo, and may help uncover unidentified stem cells in
murine bone marrow that can be cultivated in stem cell research and therapy.
In addition, identification of GSCs brings new possibilities to the stem cell field
and reproductive biology. Our investigation of the mechanism of menopause will include
the complex interplay between bone marrow GSCs and the ovarian microenvironment
and move away from a rather simplified model of declining number of oocytes in the
female ovary. We may find that autologous transplantation of in vitro activated GSCs
may prolong reproductive cycles in humans. In vitro development of oocytes from
GSCs may become a less invasive source of human ova for in vitro fertilization compared
to current ova extraction protocols.
It should be noted that the results obtained from our research proposal will be
114

applicable to human systems, as all the stem cell populations including HSCs described
in mice have counterparts in human bone marrow with minor disparities in terms of
surface phenotypes. Interestingly, MAPCs have also been isolated from rats and humans.
Aside from the additional requirement of leukaemia inhibitory factor (LIF) by murine
MAPCs for expansion, human and murine MAPCs share common features (224). There
are striking similarities in the stem cell activity among different species due to highly
conserved growth factors, cytokines and signaling pathways, which is speculated to be
the natural consequence of the critical dependence of an organism on the activity of stem
cells for survival throughout life.
The results from this research will help to resolve current scientific controversies
regarding the fate of various stem cells and provide a way to expand the therapeutic
applications of bone marrow stem cells to the treatment of cancer, diabetes, degenerative
diseases, and congenital diseases.
115
Results
Overall strategy
The aim of this research work was to test the hypothesis that HSCs derive from a
precursor population, and can transdifferentiate into non-hematopoietic tissues as well as
hematopoietic tissues in vivo. To this endeavor, we have generated a transgenic mouse
model to track bone marrow hematopoietic stem cells. The transgenic mouse model was
meant to allow us to pulse-label HSCs in vivo, and to track the progeny from these cells.
By determining whether the HSC pool is only comprised of HSCs derived from the
previously pulse labeled HSCs, or is also comprised of unlabeled HSCs, we can infer the
presence or absence of a precursor population (Figure 37). Specifically, MAPC represents
the most likely candidate for this precursor population in light of its pluripotency. In
addition, by tracking pulse labeled HSCs in other somatic tissues, we can study
transdifferentiation of HSCs in vivo.
In detail, the bigenic transgenic system for cell-fate mapping of bone marrow
stem cells that we proposed to develop consists of CreER, a fusion protein of cre
recombinase and estrogen receptor, whose expression is driven by the c-kit promoter, and
a reporter gene for CreER activity, LacZ/YFP (Figure 38). The c-kit promoter restricts
CreER expression to c-kit+ stem cells, HSCs in particular (227, 230, 263), and avoids
CreER expression in the putative precursor cells lacking c-kit expression (224). The c-kit
promoter was deliberately chosen for the cell fate mapping of HSCs, as c-kit expression
is currently the most reliable surface marker for identification of HSCs and pluripotent
MAPCs are thought not to express c-kit. More importantly, an extensive promoter study
confirms that the c-kit promoter used in our system with six Dnase hypersensitivity sites,
116

including important regulatory elements, is fully functional (264). The reporter gene
driven by the β-actin promoter is actively transcribed ubiquitously throughout mouse
development allowing us to track the stem cells differentiating into any cell types.
CreER is a fusion protein of Cre and a modified estrogen receptor that responds
only to tamoxifen, an estrogen receptor agonist, and not to endogenous estrogen. In the
absence of tamoxifen, CreER protein is normally excluded from the nucleus without
access to floxed genes in the nucleus. In the presence of tamoxifen, however, CreER
bound to tamoxifen translocalizes into the nucleus and its recombinase activity provided
by the cre component of the fusion protein deletes the sequences encompassed by two
loxP sites (265, 266). As the expression of CreER is restricted to c-kit+ stem cells, the
recombination event will take place only in these stem cells and not any other cells.
The recombinase activity by CreER initiated by tamoxifen will result in the rapid
deletion of the LacZ gene followed by de novo expression of yellow fluorescent protein
(YFP) in the bigenic mice containing the LacZ/YFP construct. This genetic change is
irreversible and permanent for the rest of the life of the cell that was expressing CreER at
the time of tamoxifen injection. All future progeny of this cell will continue to express
YFP, even in mature differentiated cell types that have lost c-kit expression, as the YFP
gene is driven by the ubiquitously active β-actin promoter and not by the c-kit promoter.
The ubiquitously active LacZ/YFP reporter gene, together with the stem cell-restricted
CreER gene, allows us to pulse label stem cells and monitor self-renewal of these cells
and/or differentiation of the cells into various lineages.
C-kit.CreER.ires.eGFP construct
C-kit is the tyrosine kinase surface receptor for stem cell factor (SCF). C-kit is
117

currently the single most important and functionally relevant surface marker for
identification of HSCs and a number of other tissue-specific stem cells. The interaction
between SCF and c-kit has been found critical for the maintenance of the HSC
compartment by promoting self-renewal activity. Recently identified GSCs are also
thought to be enriched among the c-kit+ population in murine bone marrow. GSCs are
distinguished from HSCs by lack of sca1 expression. GSCs also express germline
markers including mvh, Oct4, Dazl, Stella, Fragilis, and Nobox (263).
On the other hand, the putative precursor population to HSCs, MAPC, does not
express c-kit. While the phenotype of MAPC in fresh bone marrow is unknown,
MAPCs in culture do not display c-kit expression. This morphology and phenotype of
MAPCs does not change after 30 to more than 120 population doublings (224).
The success of this research depends heavily on the quality of the promoter
driving CreER expression. Mouse c-kit gene is over 80-kb long and includes at least 21
exons; the first 2 exons are separated by a large (about 20 kb) intron (267). Inherited c-kit
expression defects due to distant upstream deletions suggest the existence of long-range-
acting regulatory sequences (267-270). More importantly, the 5kb 5’UTR fragment of the
c-kit gene is unable to drive the expression of a reporter gene in murine bone marrow
(264, 271). In order to identify additional proximal regulatory elements Cairns et al.
(264) cloned about 10 kb of 5' flanking sequences and the whole first exon and intron,
and explored DNase I sensitivity of this DNA region in chromatin from c-kit-expressing
hematopoietic, melanocytic, and embryonic stem (ES) cells as well as hematopoietic cells
that do not express c-kit. Six DNase hypersensitivity regions were identified and a
promoter construct including all the DNase hypersensitivity regions was generated and
subsequently injected to study its function in the transgenic mouse system. The promoter
118

was able to drive GFP expression, the readout in this promoter study, in immature bone
marrow cells and downregulate GFP expression upon maturation (264).
The construct was cloned using standard cloning techniques and the overall
schematic of the construct is shown in Figure 39A.
Cell line transfection of c-kit.CreER.ires.eGFP construct
The P815 cell line was selected for testing the integrity of the construct, as P815
is a mastocytoma cell line expressing c-kit in which the construct should be active.
Following transient transfection with Fugene lipofectamine, the expression of CreER was
examined by staining with the primary rat-anti-Cre-Ab and the secondary rabbit-anti-
ratIgG-PE-Ab 48 hours post transfection. CreER expression was observed in the
transfected P815, but not in untransfected cells. Neither transfected nor untransfected
cells showed staining with an isotype control for the anti-Cre-Ab (Figure 39B). The
transfection result was reproducible in an independent experiment with P815 cells.
Pronuclear injection of c-kit.CreER.ires.eGFP construct and pups carrying the transgene
The construct was linearized by AatII and SalI sequential digestion and was
provided to the Vanderbilt transgenic core facility for pronuclear injection. Two separate
injections were performed and 26 pups were born. Two pups died soon after birth. 26
pups including the dead pups were genotyped by performing 300 bp PCR for detection of
the CreER sequence. Four pups carried the transgene (Figure 39C).
CreER expression on bone marrow hematopoietic stem cells
The pups carrying the transgene were initially bred with C57BL/6 wild type mice.
119

The resulting pups carrying transgenes from founder 12, 20, and 22 were analyzed for
expression of CreER using anti-cre antibody we received from Dr. Guoqiang Gu. When
gated on large cells, a slight shfit in cre staining was observed in pups from founder 12
whereas pups from 20 and 22 showed no staining with this antibody (Figure 40A). We
also used anti-cre antibody obtained from Dr. Polk’s laboratory, but non-specific staining
prevented further evaluation of cre expression (data not shown).
Next, we tested the reporter activity of cre instead of relying on cre staining to
analyze cre expression profile. The founder transgenic mice were bred with LacZ/YFP
reporter mice. These mice express YFP protein upon recombination by cre. The double
transgenic pups were genotyped and the first batch of pups from founder 18 was treated
with tamoxifen-infused food for three weeks. Each mouse was fed with 2g of food that
contained 2mg of tamoxifen on a daily basis. Following tamoxifen administration, we
waited one month for mature hematopoietic cells to develop from YFP labeled
hematopoietic stem cells and analyzed YFP expression with LSRII. These double
transgenics showed no sign of YFP expression (Figure 40B).
Adoptively transferred bone marrow stem cells do not contribute to germline parasitism.
Germline parasitism by donor bone marrow cells in the recipient mice was
examined by generating bone marrow chimeras of Ly5.1 and Ly5.2 male mice where the
bone marrows of Ly5.2 recipient mice are replaced by the Ly5.1 bone marrow. The male
recipient mouse was immediately bred with an Ly5.2 wild type female mouse and the
progeny was analyzed for the expression of Ly5.1 and Ly5.2 with flow cytometry. The
recipient mice were unable to reproduce for three months following lethal irradiation.
These mice showed accelerated aging and started exhibiting white and gray coat color.
120

However, the mice regained reproductive capacity and began to breed. 13 pups were born
from the chimeric male mice and wild type female mice. Surprisingly, all 13 pups from
the breeding showed no expression of donor derived Ly5.1 indicating that germline
parasitism did not occur (Figure 41). This result is in line with a recent publication by
Eggan et al refuting extragonadal source of germline stem cells using a parabiotic system
(272).
121

Discussion
Four transgenic founders were obtained from the pronuclear injection of the
completed construct containing CreER gene under the control of the c-kit promoter.
Progeny from three of the founders did not stain with cre antibodies obtained from
various sources, but progeny from one of the founders showed minor staining. As cre
antibodies in general have problems for use in fluorescent-activated cell sorting (FACS)
and immunohistochemistry, we have decided to test the reporter activity of cre, instead of
relying on cre staining to analyze cre expression profile. The founder transgenic mice
were bred with LacZ/YFP reporter mice, which express YFP protein upon recombination
by cre. The resulting double transgenic pups were genotyped and treated with tamoxifen-
infused food for three weeks. However, these double transgenics showed no sign of YFP
expression (Fig 40B).
One possibility was that p.o. administration of tamoxifen is not optimal for
CreER activation of HSCs. We have subsequently administered tamoxifen i.p. when
testing other founders, but have seen no recombination event. It was also a possibility that
the YFP signal was not strong enough for detection. LSRII at the flow cytometry core
facility did not have an excitation laser at 514nm that induces maximal excitation of YFP
and used 532nm laser. While YFP does have a range of excitation wavelengths, the
possibility remained that suboptimal excitation of YFP paired with low expression of the
protein might have adversely affected the outcome of this experiment. Unfortunately, the
antibodies available for YFP that can boost the signal are not optimal for FACS.
Therefore, another cre reporter strain that expresses LacZ upon recombination that shows
better sensitivity to cre activity was one alternative. We have however decided to pursue
122

another alternative, which was to use fluorescent microscopy using a specific filter for
YFP. However, none of the progeny treated with tamoxifen showed YFP expression on
fluorescent microscopy. As a result, we have decided that even the founder showing
minor staining with anti-cre antibody is expressing CreER at levels too low to achieve
optimum levels for efficient recombination of the reporter gene and decided another
round of pronuclear injection of the construct might be necessary.
The transgenic mouse system that we generated was also to be used to test the
hypothesis that the bone marrow stem cells may contribute to the generation of
reproductive cells. The central dogma of reproductive biology has been that females of
most mammalian species lose the capacity for oocyte production during fetal
development, and only a finite number of oocytes present postnatally are responsible for
the lifetime reproductive activity (273-277). For instance, in humans it has been
estimated that, of 106 oocytes present at birth, less than 3ⅹ105 survive through puberty.
The number of surviving oocytes decreases over time until menopause hits females as the
remaining oocytes are unable to sustain the menstrual cycle. Similar observations have
been made in female mice, which exhaust their pool of oocytes with age. A series of
recent studies have, however, challenged this dogma by showing rapid turnover of murine
oocytes during juvenile and adult life of mice (278). This high turnover rate of oocytes
observed in adult mice was originally attributed to the non-follicle-enclosed germ cells
present on the ovarian surface, but their number dropped precipitously following puberty
and another source of oocytes was suspected. A landmark paper by Johnson et al.
subsequently identified a putative germline stem cell (GSC) population in murine bone
marrow and in peripheral blood that migrates to mouse ovary and generates bona fide
oocytes (263). Germline contribution of these bone marrow stem cells, distinct from
123
hematopoietic stem cells by their lack of sca-1 expression but sharing c-kit expression,
was shown by adoptive transfer of whole murine bone marrow into recipient mice whose
ovaries were chemically ablated. Adoptive transfer of peripheral blood into recipient
mice also supported oogenesis, implying continuous seeding of GSCs into ovary via
blood circulation.
The question remains whether the oocytes developing from these transplanted
GSCs are able to fully mature functionally and undergo fertilization with male sperms, or
turn out to be an artificial non-functional development of stem cells misplaced from their
original niche space. Therefore, while the transgenic mouse system was being optimized,
I have also tested whether bone marrow stem cells can differentiate into ovarian follicles
in an alternative method using the adoptive transfer system. As female mice subjected to
lethal dose of irradiation undergo ovarian atresia which likely does not recover over time,
germline parasitism by donor bone marrow cells in the recipient male mice was examined
instead. The result showed that 13 pups were born from the chimeric male mice and wild
type female mice showed no expression of donor derived Ly5.1 indicating that germline
parasitism did not occur (Figure 41). This result is in line with a recent publication by
Eggan et al refuting extragonadal source of germline stem cells using a parabiotic system
(ref).
Once the transgenic mouse model system for cell-fate mapping of hematopoietic
stem cells becomes available, we will test the hypothesis that HSCs derive from a
precursor population, and can transdifferentiate into non-hematopoietic tissues as well as
hematopoietic tissue in vivo. We will also address the contribution of bone marrow stem
cells in gametogenesis. More specifically, we will test our hypothesis in two specific aims.
In aim 1, we will determine the presence or absence of a precursor population to HSCs.
124

HSCs will be pulse-labeled with YFP and followed over time. A decreased number of
YFP+ cells over time would demonstrate the presence of a precursor population to HSCs.
Additionally, YFP-labeled HSCs will be examined with or without irradiation to
determine the effect of bone marrow injury on the putative precursor population. We
hypothesize that injury will activate a normally dormant precursor population, namely
MAPC, to become activated and differentiate into HSCs. In aim 2, we will examine
transdifferentiation of HSCs into non-hematopoietic tissues. Cell-fate mapping of HSCs
will provide a definitive answer to the question of whether transdifferentiation occurs in
vivo. The progeny of pulse-labeled HSCs will be followed in various tissues including
pancreatic islets, heart, and skeletal muscle, to search for transdifferentiated HSCs. The
putative bone marrow GSC that expresses c-kit will also be pulse-labeled using the same
cell-fate mapping system in female mice. The contribution of GSCs in ovarian oogenesis
will be observed in the presence or absence of injury in vivo.
These studies will enhance our understanding of the critical cellular events
involved in the development of the hematopoietic system. The results from this research
are designed to provide insight into the fate of stem cells and expand the therapeutic
applications of stem cell biology.
125

Materials and Methods
Mice. C57BL/6 (B6) mice and Ly5.1 (B6SJL) mice were purchased from the Jackson
Laboratory. LacZ/YFP mice were obtained from Dr. Mark Decaesteker’s laboratory. All
animal studies were approved by the Institutional Animal Care and Use Committee of
Vanderbilt University (Nashville, TN).
Reagents. Restriction enzymes and DNA ligase were purchased from NEB. Anti-cre
antibodies and rabbit-anti-rat-IgG-PE were kindly provided from Dr. Guoqiang Gu and
Dr. Brent Polk. Anti-Ly5.2-FITC and anti-Ly5.1-PE were purchased from BD
Biosciences-Pharmingen.
Cloning of of c-kit.CreER.ires.eGFP construct. The construct was cloned with standard
cloning techniques. The c-kit promoter construct with eGFP was a kind donation from Dr.
Sergio Ottolenghi at Universita Milano-Bicocca-Piazza delle Scienze, and CreER from
Dr. Andrew Mcmahon at Harvard University. Ires sequence came from Stratagene.
PBR322 was utilized as the plasmid backbone, to circumvent plasmid toxicity observed
in initial cloning steps. GBE180, a pcnb deficient strain of DH5α E.coli was used in the
final steps of ligation in which ColE1-dependent plasmids such as pBR322 replicate in as
low as one plasmid copy number per cell.
Genotyping of the transgenic mouse expressing c-kit.CreER.ires.eGFP construct. Mice
were genotyped using standard PCR technique with tail DNA. The primers used to target
the cre region of the construct were 5’-TGGAAGGCATGGTGGAGATCTTTG-3’, and
126

5’-ATGAGAAGGAGCTGAGCTAGGCGG-3’.
Flow cytometry. Single-cell suspensions of P815 cells or primary bone marrow cells were
prepared and stained with fluorescently-labeled mAbs as described previously (183). In
all experiments, dead cells were excluded from the analysis by electronic gating. Flow
cytometry was performed using a FACSCalibur instrument with CellQuest software (BD
Immunocytometry Systems), or an LSRII instrument, and the acquired data were
analyzed using FlowJo software (Tree Star Inc.).
Fluorescent microscopy. Single-cell suspensions of bone marrow cells were prepared and
visualized with fluorescent microscopy using YFP filter. The cells were either fixed with
1% paraformaldehyde or not fixed prior to microscopy.
127

Other tissues
myeloid lineage B lineage T lineage
CMP CLP ETP
MPP
HSC
MAPC
Oocyte
GSC
Figure 36. The lineage relationship among bone marrow stem cells and progenitor cells. Arrows indicate established relationship in vivo whereas dotted arrows indicate the capacity to differentiate but in vivo significance is uncertain. MAPC: multipotent adult progenitor cell, HSC: hematopoietic stem cell, GSC: germline stem cell, MPP: multipotent progenitor population, ETP: early thymic progenitor, CLP: common lymphoid progenitor, CMP: common myeloid progenitor.
128

BM
Pulse Label
BM
HSCTamoxifen
Wait
BM
BM
1 2
A
C
B
Figure 37. The overall experimental strategy for the cell-fate mapping of hematopoietic stem cells. (A) HSCs express CreER and GFP. (B) Tamoxifen treatment of HSCs results in RFP labeled HSCs. (C) Over time, labeled HSCs maintain the HSC compartment by themselves ① or a precursor population (MAPC) contributes to the HSC compartment ②.
129

Tamoxifen
CreER
C-kit promoter CreER ires GFP
β-actin promoter LacZ Stop YFP
LoxP
GFP
HSC/GSC
A
β-actin promoter YFP
C-kit promoter CreER ires GFP
RFP
Pulse Label
LabeledHSC/GSC
B
β-actin promoter YFP
Differentiation
Labeled cellsDifferentiated
C
Figure 38. The schematic diagram for determining presence or absence of a precursor population to HSC. (A) HSCs express CreER and GFP. When tamoxifen is injected, CreER binds to tamoxifen, translocalizes into the nucleus, and recombines LoxP sites. (B) Upon recombination, the β-actin promoter begins to drive YFP expression in HSCs. (C) The progeny of these labeled stem cells will retain YFP expression following differentiation.
130

Figure 39. Generation of the transgenic mouse model for the cell-fate mapping of HSC. (A) Schematic representation of C-kit.CreER.ires.eGFP construct in pBR322 plasmid backbone. The plasmid was linearized by serial digestion with SalI and AatII and 19kb fragment containing 5’UTR of Kit promoter, CreER, ires, eGFP, polyadenylation signal, and Kit intron 1, was purified by gel electrophoresis in LMP agarose for pronuclear injection. (B) A fraction of purified construct from (A) was used for lipofectamine transfection of P815 mastocytoma cell line. The red peak represents untransfected cells with isotype control staining, the green peak untransfected cells with anti-CreER staining, the blue peak transfected cells with isotype control staining, and the orange peak transfected cells with anti-CreER staining. Data shown is representative of two independent experiments. (C) PCR analysis of pups from pronuclear injection of the purified construct into BDF1 background. 81 and 90 are dead pups. Plasmid is the positive control using the construct plasmid from (A). 1-24 are live pups that survived into adulthood. 12, 18, 20, and 22 are the pups carrying the transgene.
131

AThymus
BMGFP
PE
YFP
B
Red: Tg
Green: non-Tg
Figure 40. Expression of CreER by the transgenic mouse model. (A) Founder 12 stained with anti-cre IgG followed by secondary staining with anti-Ms-IgG-PE and gated on large cells from FSC and SSC profile. The upper plot shows the histogram on PE channel and the lower plot shows GFP channel. A minor shift is seen on founder 12. (B) Thymic and bone marrow cells were collected from three Founder 18 double transgenic pups treated with tamoxifen p.o. for three weeks and then sacrificed one month later and two LacZ/YFP transgenic without CreER. The cells were analyzed for YFP expression on LSRII. None of the mice showed YFP expression.
132

Figure 41. Adoptive transfer of bone marrow stem cells does not result in germline parasitism of the recipient mice. Germline parasitism by donor bone marrow cells in the recipient mice was examined by generating bone marrow chimeras of Ly5.1 and Ly5.2 male mice where the bone marrows of Ly5.2 recipient mice are replaced by the Ly5.1 bone marrow. The male recipient mice was immediately bred with Ly5.2 wild type female mice and the progeny was analyzed for the expression of Ly5.1 and Ly5.2 with flow cytometry. Twelve plots shown are Ly5.1 and Ly5.2 staining of the individual pupsprogeny. Transplanted Ly5.2 bone marrow did not contribute to reproduction of the recipient mice.
133

REFERENCES
1. Janeway C, T.P., Walport M, Shlomchik M, Shlomchik MJ. 2004. Immunobiology: The Immune System in Health and Disease. 823 pages pp.
2. Bendelac, A., Matzinger, P., Seder, R.A., Paul, W.E., and Schwartz, R.H. 1992.
Activation events during thymic selection. J. Exp. Med 175:731. 3. Bendelac, A., and Schwartz, R.H. 1991. CD4+ and CD8+ T cells acquire specific
lymphokine secretion potentials during thymic maturation. Nature 353:68. 4. Hayakawa, K., Lin, B.T., and Hardy, R.R. 1992. Murine thymic CD4+ T cell
subsets: a subset (Thy0) that secretes diverse cytokines and overexpresses the Vbeta8 T cell receptor gene family. J. Exp. Med. 176:269.
5. Dellabona, P., Padovan, E., Casorati, G., Brockhaus, M., and Lanzavecchia, A.
1994. An invariant Valpha24-JalphaQ/Vbeta11 T cell receptor is expressed in all individuals by clonally expanded CD48 T cells. J. Exp. Med. 180:1171.
6. Porcelli, S., Yockey, C.E., Brenner, M.B., and Balk, S.P. 1993. Analysis of T cell
antigen receptor (TCR) expression by human peripheral blood CD48 alpha/beta T cells demonstrates preferential use of several Vbeta genes and an invariant TCR alpha chain. J. Exp. Med 178:1.
7. Behar, S.M., Podrebarac, T.A., Roy, C.J., Wang, C.R., and Brenner, M.B. 1999.
Diverse TCRs recognize murine CD1. J Immunol 162:161-167. 8. Cardell, S., Tangri, S., Chan, S., Kronenberg, M., Benoist, C., and Mathis, D.
1995. CD1-restricted CD4+ T cells in major histocompatibility complex class II-deficient mice. J Exp Med 182:993-1004.
9. Chiu, Y.H., Jayawardena, J., Weiss, A., Lee, D., Park, S.H., Dautry-Varsat, A., and
Bendelac, A. 1999. Distinct subsets of CD1d-restricted T cells recognize self-antigens loaded in different cellular compartments. J Exp Med 189:103-110.
134

10. Park, S.H., Weiss, A., Benlagha, K., Kyin, T., Teyton, L., and Bendelac, A. 2001. The mouse CD1d-restricted repertoire is dominated by a few autoreactive T cell receptor families. J Exp Med 193:893-904.
11. Skold, M., Faizunnessa, N.N., Wang, C.R., and Cardell, S. 2000. CD1d-specific
NK1.1+ T cells with a transgenic variant TCR. J Immunol 165:168-174. 12. Godfrey, D.I., MacDonald, H.R., Kronenberg, M., Smyth, M.J., and Van Kaer, L.
2004. NKT cells: what's in a name? Nat Rev Immunol 4:231-237. 13. Baron, J.L., Gardiner, L., Nishimura, S., Shinkai, K., Locksley, R., and Ganem, D.
2002. Activation of a nonclassical NKT cell subset in a transgenic mouse model of hepatitis B virus infection. Immunity 16:583-594.
14. Terabe, M., Swann, J., Ambrosino, E., Sinha, P., Takaku, S., Hayakawa, Y.,
Godfrey, D.I., Ostrand-Rosenberg, S., Smyth, M.J., and Berzofsky, J.A. 2005. A nonclassical non-Valpha14Jalpha18 CD1d-restricted (type II) NKT cell is sufficient for down-regulation of tumor immunosurveillance. J Exp Med 202:1627-1633.
15. Duthie, M.S., Kahn, M., White, M., Kapur, R.P., and Kahn, S.J. 2005. Critical
proinflammatory and anti-inflammatory functions of different subsets of CD1d-restricted natural killer T cells during Trypanosoma cruzi infection. Infect Immun 73:181-192.
16. Zajonc, D.M., Maricic, I., Wu, D., Halder, R., Roy, K., Wong, C.H., Kumar, V.,
and Wilson, I.A. 2005. Structural basis for CD1d presentation of a sulfatide derived from myelin and its implications for autoimmunity. J Exp Med 202:1517-1526.
17. Arase, H., Arase, N., and Saito, T. 1996. Interferon gamma production by natural
killer (NK) cells and NK1.1+ T cells upon NKR-P1 cross-linking. J Exp Med 183:2391-2396.
18. Vilarinho, S., Ogasawara, K., Nishimura, S., Lanier, L.L., and Baron, J.L. 2007.
Blockade of NKG2D on NKT cells prevents hepatitis and the acute immune
135

response to hepatitis B virus. Proc Natl Acad Sci U S A 104:18187-18192. 19. Gumperz, J.E., Miyake, S., Yamamura, T., and Brenner, M.B. 2002. Functionally
distinct subsets of CD1d-restricted natural killer T cells revealed by CD1d tetramer staining. J Exp Med 195:625-636.
20. Raulet, D.H. 2003. Roles of the NKG2D immunoreceptor and its ligands. Nat Rev
Immunol 3:781-790. 21. Ho, E.L., Carayannopoulos, L.N., Poursine-Laurent, J., Kinder, J., Plougastel, B.,
Smith, H.R., and Yokoyama, W.M. 2002. Costimulation of multiple NK cell activation receptors by NKG2D. J Immunol 169:3667-3675.
22. Guerra, N., Tan, Y.X., Joncker, N.T., Choy, A., Gallardo, F., Xiong, N., Knoblaugh,
S., Cado, D., Greenberg, N.R., and Raulet, D.H. 2008. NKG2D-deficient mice are defective in tumor surveillance in models of spontaneous malignancy. Immunity 28:571-580.
23. Pinto, A.K., Jamieson, A.M., Raulet, D.H., and Hill, A.B. 2007. The role of
NKG2D signaling in inhibition of cytotoxic T-lymphocyte lysis by the Murine cytomegalovirus immunoevasin m152/gp40. J Virol 81:12564-12571.
24. Jamieson, A.M., Diefenbach, A., McMahon, C.W., Xiong, N., Carlyle, J.R., and
Raulet, D.H. 2002. The role of the NKG2D immunoreceptor in immune cell activation and natural killing. Immunity 17:19-29.
25. Parekh, V.V., Wilson, M.T., Olivares-Villagomez, D., Singh, A.K., Wu, L., Wang,
C.R., Joyce, S., and Van Kaer, L. 2005. Glycolipid antigen induces long-term natural killer T cell anergy in mice. J Clin Invest 115:2572-2583.
26. Hammond, K.J., Pelikan, S.B., Crowe, N.Y., Randle-Barrett, E., Nakayama, T.,
Taniguchi, M., Smyth, M.J., van Driel, I.R., Scollay, R., Baxter, A.G., et al. 1999. NKT cells are phenotypically and functionally diverse. Eur J Immunol 29:3768-3781.
27. Hammond, K.J., Pellicci, D.G., Poulton, L.D., Naidenko, O.V., Scalzo, A.A.,
136

Baxter, A.G., and Godfrey, D.I. 2001. CD1d-restricted NKT cells: an interstrain comparison. J Immunol 167:1164-1173.
28. Eberl, G., Lees, R., Smiley, S.T., Taniguchi, M., Grusby, M.J., and MacDonald,
H.R. 1999. Tissue-specific segregation of CD1d-dependent and CD1d-independent NK T cells. J Immunol 162:6410-6419.
29. Terabe, M., Matsui, S., Noben-Trauth, N., Chen, H., Watson, C., Donaldson, D.D.,
Carbone, D.P., Paul, W.E., and Berzofsky, J.A. 2000. NKT cell-mediated repression of tumor immunosurveillance by IL-13 and the IL-4R-STAT6 pathway. Nat Immunol 1:515-520.
30. Zhou, D., Mattner, J., Cantu, C., 3rd, Schrantz, N., Yin, N., Gao, Y., Sagiv, Y.,
Hudspeth, K., Wu, Y.P., Yamashita, T., et al. 2004. Lysosomal glycosphingolipid recognition by NKT cells. Science 306:1786-1789.
31. Vincent, M.S., Gumperz, J.E., and Brenner, M.B. 2003. Understanding the
function of CD1-restricted T cells. Nat Immunol 4:517-523. 32. Bradbury, A., Milstein, C., and Kozak, C.A. 1991. Chromosomal localization of
Cd1d genes in the mouse. Somat Cell Mol Genet 17:93-96. 33. Bradbury, A., Calabi, F., and Milstein, C. 1990. Expression of CD1 in the mouse
thymus. Eur J Immunol 20:1831-1836. 34. Bradbury, A., Belt, K.T., Neri, T.M., Milstein, C., and Calabi, F. 1988. Mouse
CD1 is distinct from and co-exists with TL in the same thymus. Embo J 7:3081-3086.
35. Balk, S.P., Bleicher, P.A., and Terhorst, C. 1991. Isolation and expression of
cDNA encoding the murine homologues of CD1. J Immunol 146:768-774. 36. Brigl, M., and Brenner, M.B. 2004. CD1: antigen presentation and T cell function.
Annu Rev Immunol 22:817-890. 37. Calabi, F., Jarvis, J.M., Martin, L., and Milstein, C. 1989. Two classes of CD1
137

genes. Eur J Immunol 19:285-292. 38. Martin, L.H., Calabi, F., Lefebvre, F.A., Bilsland, C.A., and Milstein, C. 1987.
Structure and expression of the human thymocyte antigens CD1a, CD1b, and CD1c. Proc Natl Acad Sci U S A 84:9189-9193.
39. Martin, L.H., Calabi, F., and Milstein, C. 1986. Isolation of CD1 genes: a family
of major histocompatibility complex-related differentiation antigens. Proc Natl Acad Sci U S A 83:9154-9158.
40. Calabi, F., and Milstein, C. 1986. A novel family of human major
histocompatibility complex-related genes not mapping to chromosome 6. Nature 323:540-543.
41. Brutkiewicz, R.R., Bennink, J.R., Yewdell, J.W., and Bendelac, A. 1995. TAP-
independent, beta 2-microglobulin-dependent surface expression of functional mouse CD1.1. J Exp Med 182:1913-1919.
42. Wu, D., Zajonc, D.M., Fujio, M., Sullivan, B.A., and Kinjo, Y. 2006. Design of
natural killer T cell activators: structure and function of a microbial glycosphingolipid bound to mouse CD1d. Proc. Natl. Acad. Sci. USA 103:3972.
43. Zajonc, D.M., Cantu, C., Mattner, J., Zhou, D., and Savage, P.B. 2005. Structure
and function of a potent agonist for the semi-invariant NKT cell receptor. Nat. Immunol. 6:810.
44. Zajonc, D.M., Maricic, I., Wu, D., Halder, R., and Roy, K. 2005. Structural basis
for CD1d presentation of a sulfatide derived from myelin and its implications for autoimmunity. J. Exp. Med. 202:1517.
45. Mandal, M., Chen, X.R., Alegre, M.L., Chiu, N.M., Chen, Y.H., Castano, A.R.,
and Wang, C.R. 1998. Tissue distribution, regulation and intracellular localization of murine CD1 molecules. Mol Immunol 35:525-536.
46. Brossay, L., Jullien, D., Cardell, S., Sydora, B.C., Burdin, N., Modlin, R.L., and
Kronenberg, M. 1997. Mouse CD1 is mainly expressed on hemopoietic-derived
138

cells. J Immunol 159:1216-1224. 47. Roark, J.H., Park, S.H., Jayawardena, J., Kavita, U., Shannon, M., and Bendelac,
A. 1998. CD1.1 expression by mouse antigen-presenting cells and marginal zone B cells. J Immunol 160:3121-3127.
48. Geissmann, F., Cameron, T.O., Sidobre, S., Manlongat, N., Kronenberg, M.,
Briskin, M.J., Dustin, M.L., and Littman, D.R. 2005. Intravascular immune surveillance by CXCR6+ NKT cells patrolling liver sinusoids. PLoS Biol 3:e113.
49. Bleicher, P.A., Balk, S.P., Hagen, S.J., Blumberg, R.S., Flotte, T.J., and Terhorst,
C. 1990. Expression of murine CD1 on gastrointestinal epithelium. Science 250:679-682.
50. Larsson, L.C., Anderson, P., Widner, H., and Korsgrent, O. 2001. Enhanced
survival of porcine neural xenografts in mice lacking CD1d1, but no effect of NK1.1 depletion. Cell Transplant 10:295-304.
51. Kobayashi, E., Motoki, K., Uchida, T., Fukushima, H., and Koezuka, Y. 1995.
KRN7000, a novel immunomodulator, and its antitumor activities. Oncol Res 7:529-534.
52. Kawano, T., Cui, J., Koezuka, Y., Toura, I., Kaneko, Y., Motoki, K., Ueno, H.,
Nakagawa, R., Sato, H., Kondo, E., et al. 1997. CD1d-restricted and TCR-mediated activation of valpha14 NKT cells by glycosylceramides. Science 278:1626-1629.
53. Sidobre, S., Naidenko, O.V., Sim, B.C., Gascoigne, N.R., Garcia, K.C., and
Kronenberg, M. 2002. The V alpha 14 NKT cell TCR exhibits high-affinity binding to a glycolipid/CD1d complex. J Immunol 169:1340-1348.
54. Cantu, C., 3rd, Benlagha, K., Savage, P.B., Bendelac, A., and Teyton, L. 2003.
The paradox of immune molecular recognition of alpha-galactosylceramide: low affinity, low specificity for CD1d, high affinity for alpha beta TCRs. J Immunol 170:4673-4682.
139

55. Mattner, J., Debord, K.L., Ismail, N., Goff, R.D., Cantu, C., 3rd, Zhou, D., Saint-Mezard, P., Wang, V., Gao, Y., Yin, N., et al. 2005. Exogenous and endogenous glycolipid antigens activate NKT cells during microbial infections. Nature 434:525-529.
56. Kinjo, Y., Wu, D., Kim, G., Xing, G.W., Poles, M.A., Ho, D.D., Tsuji, M.,
Kawahara, K., Wong, C.H., and Kronenberg, M. 2005. Recognition of bacterial glycosphingolipids by natural killer T cells. Nature 434:520-525.
57. Sriram, V., Du, W., Gervay-Hague, J., and Brutkiewicz, R.R. 2005. Cell wall
glycosphingolipids of Sphingomonas paucimobilis are CD1d-specific ligands for NKT cells. Eur J Immunol 35:1692-1701.
58. Dieckmann, R., Graeber, I., Kaesler, I., Szewzyk, U., and von Dohren, H. 2005.
Rapid screening and dereplication of bacterial isolates from marine sponges of the sula ridge by intact-cell-MALDI-TOF mass spectrometry (ICM-MS). Appl Microbiol Biotechnol 67:539-548.
59. Kinjo, Y., Tupin, E., Wu, D., Fujio, M., Garcia-Navarro, R., Benhnia, M.R.,
Zajonc, D.M., Ben-Menachem, G., Ainge, G.D., Painter, G.F., et al. 2006. Natural killer T cells recognize diacylglycerol antigens from pathogenic bacteria. Nat Immunol 7:978-986.
60. Bendelac, A., Lantz, O., Quimby, M.E., Yewdell, J.W., Bennink, J.R., and
Brutkiewicz, R.R. 1995. CD1 recognition by mouse NK1+ T lymphocytes. Science 268:863.
61. Exley, M., Garcia, J., Balk, S.P., and Porcelli, S. 1997. Requirements for CD1d
recognition by human invariant Valpha24+CD4CD8 T cells. J. Exp. Med 186:109. 62. Park, S.H., Roark, J.H., and Bendelac, A. 1998. Tissue specific recognition of
mouse CD1 molecules. J. Immunol 160:3128. 63. Brigl, M., Bry, L., Kent, S.C., Gumperz, J.E., and Brenner, M.B. 2003.
Mechanism of CD1d-restricted natural killer T cell activation during microbial infection. Nat. Immunol 4:1230.
140

64. Mattner, J., DeBord, K.L., Ismail, N., Goff, R.D., and Cantu, C. 2005. Both exogenous and endogenous glycolipid antigens activate NKT cells during microbial infections. Nature 434:525.
65. Bendelac, A. 1995. Positive selection of mouse NK1+ T cells by CD1-expressing
cortical thymocytes. J. Exp. Med 182:2091. 66. Benlagha, K., Kyin, T., Beavis, A., Teyton, L., and Bendelac, A. 2002. A thymic
precursor to the NKT cell lineage. Science 296:553. 67. Park, S.H., Benlagha, K., Lee, D., Balish, E., and Bendelac, A. 2000. Unaltered
phenotype, tissue distribution and function of Valpha14+ NKT cells in germ-free mice. Eur. J. Immunol 30:620.
68. Schumann, J., Mycko, M.P., Dellabona, P., Casorati, G., and MacDonald, H.R.
2006. Cutting edge: influence of the TCR Vbeta domain on the selection of semi-invariant NKT cells by endogenous ligands. J. Immunol 176:2064.
69. Xia, C., Yao, Q., Schumann, J., Rossy, E., and Chen, W. 2006. Synthesis and
biological evaluation of alpha-galactosylceramide (KRN7000) and isoglobotrihexosylceramide (iGb3). Bioorg. Med. Chem. Lett. 16:2195.
70. Zhou, D., Mattner, J., Cantu, C., Schrantz, N., and Yin, N. 2004. Lysosomal
glycosphingolipid recognition by NKT cells. Science 306:1786. 71. Li, Y., Teneberg, S., Thapa, P., Bendelac, A., Levery, S.B., and Zhou, D. 2008.
Sensitive detection of isoglobo and globo series tetraglycosylceramides in human thymus by ion trap mass spectrometry. Glycobiology 18:158-165.
72. Porubsky, S., Speak, A.O., Luckow, B., Cerundolo, V., Platt, F.M., and Grone, H.J.
2007. Normal development and function of invariant natural killer T cells in mice with isoglobotrihexosylceramide (iGb3) deficiency. Proc Natl Acad Sci U S A 104:5977-5982.
73. Nakashima, H., Inui, T., Habu, Y., Kinoshita, M., Nagao, S., Kawaguchi, A.,
Miura, S., Shinomiya, N., Yagita, H., and Seki, S. 2006. Activation of mouse
141
natural killer T cells accelerates liver regeneration after partial hepatectomy. Gastroenterology 131:1573-1583.
74. Takehara, T., Hayashi, N., Mita, E., Kanto, T., Tatsumi, T., Sasaki, Y., Kasahara,
A., and Hori, M. 1998. Delayed Fas-mediated hepatocyte apoptosis during liver regeneration in mice: hepatoprotective role of TNF alpha. Hepatology 27:1643-1651.
75. Desbarats, J., and Newell, M.K. 2000. Fas engagement accelerates liver
regeneration after partial hepatectomy. Nat Med 6:920-923. 76. Akerman, P., Cote, P., Yang, S.Q., McClain, C., Nelson, S., Bagby, G.J., and Diehl,
A.M. 1992. Antibodies to tumor necrosis factor-alpha inhibit liver regeneration after partial hepatectomy. Am J Physiol 263:G579-585.
77. Stetson, D.B., Mohrs, M., Reinhardt, R.L., Baron, J.L., Wang, Z.E., Gapin, L.,
Kronenberg, M., and Locksley, R.M. 2003. Constitutive cytokine mRNAs mark natural killer (NK) and NK T cells poised for rapid effector function. J Exp Med 198:1069-1076.
78. Parekh, V.V., Lalani, S., and Van Kaer, L. 2007. The in vivo response of invariant
natural killer T cells to glycolipid antigens. Int Rev Immunol 26:31-48. 79. Parekh, V.V., Singh, A.K., Wilson, M.T., Olivares-Villagomez, D., Bezbradica,
J.S., Inazawa, H., Ehara, H., Sakai, T., Serizawa, I., Wu, L., et al. 2004. Quantitative and qualitative differences in the in vivo response of NKT cells to distinct alpha- and beta-anomeric glycolipids. J Immunol 173:3693-3706.
80. Kitamura, H., Iwakabe, K., Yahata, T., Nishimura, S., Ohta, A., Ohmi, Y., Sato, M.,
Takeda, K., Okumura, K., Van Kaer, L., et al. 1999. The natural killer T (NKT) cell ligand alpha-galactosylceramide demonstrates its immunopotentiating effect by inducing interleukin (IL)-12 production by dendritic cells and IL-12 receptor expression on NKT cells. J Exp Med 189:1121-1128.
81. Tomura, M., Yu, W.G., Ahn, H.J., Yamashita, M., and Yang, Y.F. 1999. A novel
function of Valpha14+CD4+NKT cells: stimulation of IL-12 production by
142

antigen-presenting cells in the innate immune system. J. Immunol. 163:93. 82. Fujii, S., Shimizu, K., Hemmi, H., and Steinman, R.M. 2007. Innate Valpha14(+)
natural killer T cells mature dendritic cells, leading to strong adaptive immunity. Immunol Rev 220:183-198.
83. Fujii, S., Shimizu, K., Hemmi, H., Fukui, M., Bonito, A.J., Chen, G., Franck, R.W.,
Tsuji, M., and Steinman, R.M. 2006. Glycolipid alpha-C-galactosylceramide is a distinct inducer of dendritic cell function during innate and adaptive immune responses of mice. Proc Natl Acad Sci U S A 103:11252-11257.
84. Liu, K., Idoyaga, J., Charalambous, A., Fujii, S., Bonito, A., Mordoh, J., Wainstok,
R., Bai, X.F., Liu, Y., and Steinman, R.M. 2005. Innate NKT lymphocytes confer superior adaptive immunity via tumor-capturing dendritic cells. J Exp Med 202:1507-1516.
85. Andrews, D.M., Andoniou, C.E., Scalzo, A.A., van Dommelen, S.L., Wallace,
M.E., Smyth, M.J., and Degli-Esposti, M.A. 2005. Cross-talk between dendritic cells and natural killer cells in viral infection. Mol Immunol 42:547-555.
86. Fujii, S., Shimizu, K., Smith, C., Bonifaz, L., and Steinman, R.M. 2003.
Activation of natural killer T cells by alpha-galactosylceramide rapidly induces the full maturation of dendritic cells in vivo and thereby acts as an adjuvant for combined CD4 and CD8 T cell immunity to a coadministered protein. J Exp Med 198:267-279.
87. Yang, G., Schmieg, J., Tsuji, M., and Franck, R.W. 2004. The C-glycoside
analogue of the immunostimulant alpha-galactosylceramide (KRN7000): synthesis and striking enhancement of activity. Angew Chem Int Ed Engl 43:3818-3822.
88. Goff, R.D., Gao, Y., Mattner, J., Zhou, D., and Yin, N. 2004. Effects of lipid chain
lengths in alpha-galactosylceramides on cytokine release by natural killer T cells. J. Am. Chem. Soc. 126:13602.
89. Miyamoto, K., Miyake, S., and Yamamura, T. 2001. A synthetic glycolipid
143

prevents autoimmune encephalomyelitis by inducing TH2 bias of natural killer T cells. Nature 413:531.
90. Yu, K.O., Im, J.S., Molano, A., Dutronc, Y., and Illarionov, P.A. 2005. Modulation
of CD1d-restricted NKT cell responses by using N-acyl variants of alpha-galactosylceramides. Proc. Natl. Acad. Sci. USA 102:3383.
91. Oki, S., Chiba, A., Yamamura, T., and Miyake, S. 2004. The clinical implication
and molecular mechanism of preferential IL-4 production by modified glycolipid-stimulated NKT cells. J. Clin. Invest 113:1631.
92. Bezbradica, J.S., Stanic, A.K., Matsuki, N., Bour-Jordan, H., and Bluestone, J.A.
2005. Distinct roles of dendritic cells and B cells in Valpha14Jalpha18 natural T cell activation in vivo. J. Immunol. 174:4696.
93. Berzins, S.P., Smyth, M.J., and Godfrey, D.I. 2005. Working with NKT cells--
pitfalls and practicalities. Curr Opin Immunol 17:448-454. 94. Godfrey, D.I., MacDonald, H.R., Kronenberg, M., Smyth, M.J., and Van Kaer, L.
2004. NKT cells: What's in a name. Nat. Rev. Immunol 4:231. 95. Crowe, N.Y., Uldrich, A.P., Kyparissoudis, K., Hammond, K.J., Hayakawa, Y.,
Sidobre, S., Keating, R., Kronenberg, M., Smyth, M.J., and Godfrey, D.I. 2003. Glycolipid antigen drives rapid expansion and sustained cytokine production by NK T cells. J Immunol 171:4020-4027.
96. Wilson, M.T., Johansson, C., Olivares-Villagomez, D., Singh, A.K., Stanic, A.K.,
Wang, C.R., Joyce, S., Wick, M.J., and Van Kaer, L. 2003. The response of natural killer T cells to glycolipid antigens is characterized by surface receptor down-modulation and expansion. Proc Natl Acad Sci U S A 100:10913-10918.
97. Harada, M., Seino, K., Wakao, H., Sakata, S., Ishizuka, Y., Ito, T., Kojo, S.,
Nakayama, T., and Taniguchi, M. 2004. Down-regulation of the invariant Valpha14 antigen receptor in NKT cells upon activation. Int Immunol 16:241-247.
98. Uldrich, A.P., Crowe, N.Y., Kyparissoudis, K., Pellicci, D.G., Zhan, Y., Lew, A.M.,
144

Bouillet, P., Strasser, A., Smyth, M.J., and Godfrey, D.I. 2005. NKT cell stimulation with glycolipid antigen in vivo: costimulation-dependent expansion, Bim-dependent contraction, and hyporesponsiveness to further antigenic challenge. J Immunol 175:3092-3101.
99. Ikarashi, Y., Iizuka, A., Koshidaka, Y., Heike, Y., Takaue, Y., Yoshida, M.,
Kronenberg, M., and Wakasugi, H. 2005. Phenotypical and functional alterations during the expansion phase of invariant Valpha14 natural killer T (Valpha14i NKT) cells in mice primed with alpha-galactosylceramide. Immunology 116:30-37.
100. Smyth, M.J., Thia, K.Y., Street, S.E., Cretney, E., Trapani, J.A., Taniguchi, M.,
Kawano, T., Pelikan, S.B., Crowe, N.Y., and Godfrey, D.I. 2000. Differential tumor surveillance by natural killer (NK) and NKT cells. J Exp Med 191:661-668.
101. Smyth, M.J., Crowe, N.Y., and Godfrey, D.I. 2001. NK cells and NKT cells
collaborate in host protection from methylcholanthrene-induced fibrosarcoma. Int Immunol 13:459-463.
102. Seino, K., Motohashi, S., Fujisawa, T., Nakayama, T., and Taniguchi, M. 2006.
Natural killer T cell-mediated antitumor immune responses and their clinical applications. Cancer Sci 97:807-812.
103. Uchida, T., Horiguchi, S., Tanaka, Y., Yamamoto, H., Kunii, N., Motohashi, S.,
Taniguchi, M., Nakayama, T., and Okamoto, Y. 2008. Phase I study of alpha-galactosylceramide-pulsed antigen presenting cells administration to the nasal submucosa in unresectable or recurrent head and neck cancer. Cancer Immunol Immunother 57:337-345.
104. Motohashi, S. 2007. [Translational research in patients with lung cancer--clinical
application of NKT cell immunotherapy]. Gan To Kagaku Ryoho 34:550-553. 105. Ishikawa, A., Motohashi, S., Ishikawa, E., Fuchida, H., Higashino, K., Otsuji, M.,
Iizasa, T., Nakayama, T., Taniguchi, M., and Fujisawa, T. 2005. A phase I study of alpha-galactosylceramide (KRN7000)-pulsed dendritic cells in patients with advanced and recurrent non-small cell lung cancer. Clin Cancer Res 11:1910-
145

1917. 106. Giaccone, G., Punt, C.J., Ando, Y., Ruijter, R., Nishi, N., Peters, M., von
Blomberg, B.M., Scheper, R.J., van der Vliet, H.J., van den Eertwegh, A.J., et al. 2002. A phase I study of the natural killer T-cell ligand alpha-galactosylceramide (KRN7000) in patients with solid tumors. Clin Cancer Res 8:3702-3709.
107. Motohashi, S., Ishikawa, A., Ishikawa, E., Otsuji, M., Iizasa, T., Hanaoka, H.,
Shimizu, N., Horiguchi, S., Okamoto, Y., Fujii, S., et al. 2006. A phase I study of in vitro expanded natural killer T cells in patients with advanced and recurrent non-small cell lung cancer. Clin Cancer Res 12:6079-6086.
108. Fujii, S., Shimizu, K., Kronenberg, M., and Steinman, R.M. 2002. Prolonged IFN-
gamma-producing NKT response induced with alpha-galactosylceramide-loaded DCs. Nat Immunol 3:867-874.
109. Toura, I., Kawano, T., Akutsu, Y., Nakayama, T., Ochiai, T., and Taniguchi, M.
1999. Cutting edge: inhibition of experimental tumor metastasis by dendritic cells pulsed with alpha-galactosylceramide. J Immunol 163:2387-2391.
110. Nieda, M., Okai, M., Tazbirkova, A., Lin, H., Yamaura, A., Ide, K., Abraham, R.,
Juji, T., Macfarlane, D.J., and Nicol, A.J. 2004. Therapeutic activation of Valpha24+Vbeta11+ NKT cells in human subjects results in highly coordinated secondary activation of acquired and innate immunity. Blood 103:383-389.
111. Wang, B., Geng, Y.B., and Wang, C.R. 2001. CD1-restricted NK T cells protect
nonobese diabetic mice from developing diabetes. J Exp Med 194:313-320. 112. Hong, S., Wilson, M.T., Serizawa, I., Wu, L., Singh, N., Naidenko, O.V., Miura, T.,
Haba, T., Scherer, D.C., Wei, J., et al. 2001. The natural killer T-cell ligand alpha-galactosylceramide prevents autoimmune diabetes in non-obese diabetic mice. Nat Med 7:1052-1056.
113. Sharif, S., Arreaza, G.A., Zucker, P., Mi, Q.S., Sondhi, J., Naidenko, O.V.,
Kronenberg, M., Koezuka, Y., Delovitch, T.L., Gombert, J.M., et al. 2001. Activation of natural killer T cells by alpha-galactosylceramide treatment prevents
146

the onset and recurrence of autoimmune Type 1 diabetes. Nat Med 7:1057-1062. 114. Naumov, Y.N., Bahjat, K.S., Gausling, R., Abraham, R., Exley, M.A., Koezuka, Y.,
Balk, S.B., Strominger, J.L., Clare-Salzer, M., and Wilson, S.B. 2001. Activation of CD1d-restricted T cells protects NOD mice from developing diabetes by regulating dendritic cell subsets. Proc Natl Acad Sci U S A 98:13838-13843.
115. Major, A.S., Singh, R.R., Joyce, S., and Van Kaer, L. 2006. The role of invariant
natural killer T cells in lupus and atherogenesis. Immunol Res 34:49-66. 116. Singh, A.K., Wilson, M.T., Hong, S., Olivares-Villagomez, D., Du, C., Stanic,
A.K., Joyce, S., Sriram, S., Koezuka, Y., and Van Kaer, L. 2001. Natural killer T cell activation protects mice against experimental autoimmune encephalomyelitis. J Exp Med 194:1801-1811.
117. Jahng, A.W., Maricic, I., Pedersen, B., Burdin, N., Naidenko, O., Kronenberg, M.,
Koezuka, Y., and Kumar, V. 2001. Activation of natural killer T cells potentiates or prevents experimental autoimmune encephalomyelitis. J Exp Med 194:1789-1799.
118. Pal, E., Tabira, T., Kawano, T., Taniguchi, M., Miyake, S., and Yamamura, T.
2001. Costimulation-dependent modulation of experimental autoimmune encephalomyelitis by ligand stimulation of V alpha 14 NK T cells. J Immunol 166:662-668.
119. Furlan, R., Bergami, A., Cantarella, D., Brambilla, E., Taniguchi, M., Dellabona,
P., Casorati, G., and Martino, G. 2003. Activation of invariant NKT cells by alphaGalCer administration protects mice from MOG35-55-induced EAE: critical roles for administration route and IFN-gamma. Eur J Immunol 33:1830-1838.
120. Chiba, A., Kaieda, S., Oki, S., Yamamura, T., and Miyake, S. 2005. The
involvement of V(alpha)14 natural killer T cells in the pathogenesis of arthritis in murine models. Arthritis Rheum 52:1941-1948.
121. Chiba, A., Oki, S., Miyamoto, K., Hashimoto, H., Yamamura, T., and Miyake, S.
2004. Suppression of collagen-induced arthritis by natural killer T cell activation
147

with OCH, a sphingosine-truncated analog of alpha-galactosylceramide. Arthritis Rheum 50:305-313.
122. Zeng, D., Liu, Y., Sidobre, S., Kronenberg, M., and Strober, S. 2003. Activation of
natural killer T cells in NZB/W mice induces Th1-type immune responses exacerbating lupus. J Clin Invest 112:1211-1222.
123. Yang, J.Q., Saxena, V., Xu, H., Van Kaer, L., Wang, C.R., and Singh, R.R. 2003.
Repeated alpha-galactosylceramide administration results in expansion of NK T cells and alleviates inflammatory dermatitis in MRL-lpr/lpr mice. J Immunol 171:4439-4446.
124. Saubermann, L.J., Beck, P., De Jong, Y.P., Pitman, R.S., Ryan, M.S., Kim, H.S.,
Exley, M., Snapper, S., Balk, S.P., Hagen, S.J., et al. 2000. Activation of natural killer T cells by alpha-galactosylceramide in the presence of CD1d provides protection against colitis in mice. Gastroenterology 119:119-128.
125. Tupin, E., Nicoletti, A., Elhage, R., Rudling, M., Ljunggren, H.G., Hansson, G.K.,
and Berne, G.P. 2004. CD1d-dependent activation of NKT cells aggravates atherosclerosis. J Exp Med 199:417-422.
126. Tupin, E., Kinjo, Y., and Kronenberg, M. 2007. The unique role of natural killer T
cells in the response to microorganisms. Nat Rev Microbiol 5:405-417. 127. Nieuwenhuis, E.E., Matsumoto, T., Exley, M., Schleipman, R.A., Glickman, J.,
Bailey, D.T., Corazza, N., Colgan, S.P., Onderdonk, A.B., and Blumberg, R.S. 2002. CD1d-dependent macrophage-mediated clearance of Pseudomonas aeruginosa from lung. Nat Med 8:588-593.
128. Kinjo, T., Nakamatsu, M., Nakasone, C., Yamamoto, N., Kinjo, Y., Miyagi, K.,
Uezu, K., Nakamura, K., Higa, F., Tateyama, M., et al. 2006. NKT cells play a limited role in the neutrophilic inflammatory responses and host defense to pulmonary infection with Pseudomonas aeruginosa. Microbes Infect 8:2679-2685.
129. Kumar, H., Belperron, A., Barthold, S.W., and Bockenstedt, L.K. 2000. Cutting
edge: CD1d deficiency impairs murine host defense against the spirochete,
148

Borrelia burgdorferi. J Immunol 165:4797-4801. 130. Sriram, V., Du, W., Gervay-Hague, J., and Brutkiewicz, R.R. 2005. Cell wall
glycosphingolipids of Sphingomonas paucimobilis are CD1d-specific ligands for NKT cells. Eur. J. Immunol 35:1692.
131. Schofield, L., McConville, M.J., Hansen, D., Campbell, A.S., Fraser-Reid, B.,
Grusby, M.J., and Tachado, S.D. 1999. CD1d-restricted immunoglobulin G formation to GPI-anchored antigens mediated by NKT cells. Science 283:225-229.
132. Amprey, J.L., Im, J.S., Turco, S.J., Murray, H.W., Illarionov, P.A., Besra, G.S.,
Porcelli, S.A., and Spath, G.F. 2004. A subset of liver NK T cells is activated during Leishmania donovani infection by CD1d-bound lipophosphoglycan. J Exp Med 200:895-904.
133. Fischer, K., Scotet, E., Niemeyer, M., Koebernick, H., Zerrahn, J., Maillet, S.,
Hurwitz, R., Kursar, M., Bonneville, M., Kaufmann, S.H., et al. 2004. Mycobacterial phosphatidylinositol mannoside is a natural antigen for CD1d-restricted T cells. Proc Natl Acad Sci U S A 101:10685-10690.
134. Kinjo, Y., Wu, D., Kim, G., Xing, G.W., and Poles, M.A. 2005. Recognition of
bacterial glycosphingolipids by natural killer T cells. Nature 434:520. 135. Mallevaey, T., Zanetta, J.P., Faveeuw, C., Fontaine, J., Maes, E., Platt, F., Capron,
M., de-Moraes, M.L., and Trottein, F. 2006. Activation of invariant NKT cells by the helminth parasite schistosoma mansoni. J Immunol 176:2476-2485.
136. Nagarajan, N.A., and Kronenberg, M. 2007. Invariant NKT cells amplify the
innate immune response to lipopolysaccharide. J Immunol 178:2706-2713. 137. Schwartz, R.H. 2003. T cell anergy. Annu Rev Immunol 21:305-334. 138. Macian, F., Im, S.H., Garcia-Cozar, F.J., and Rao, A. 2004. T-cell anergy. Curr
Opin Immunol 16:209-216. 139. Jenkins, M.K., Pardoll, D.M., Mizuguchi, J., Chused, T.M., and Schwartz, R.H.
149

1987. Molecular events in the induction of a nonresponsive state in interleukin 2-producing helper T-lymphocyte clones. Proc Natl Acad Sci U S A 84:5409-5413.
140. Jain, J., McCaffrey, P.G., Miner, Z., Kerppola, T.K., Lambert, J.N., Verdine, G.L.,
Curran, T., and Rao, A. 1993. The T-cell transcription factor NFATp is a substrate for calcineurin and interacts with Fos and Jun. Nature 365:352-355.
141. Safford, M., Collins, S., Lutz, M.A., Allen, A., Huang, C.T., Kowalski, J.,
Blackford, A., Horton, M.R., Drake, C., Schwartz, R.H., et al. 2005. Egr-2 and Egr-3 are negative regulators of T cell activation. Nat Immunol 6:472-480.
142. Macian, F., Garcia-Cozar, F., Im, S.H., Horton, H.F., Byrne, M.C., and Rao, A.
2002. Transcriptional mechanisms underlying lymphocyte tolerance. Cell 109:719-731.
143. Heissmeyer, V., Macian, F., Im, S.H., Varma, R., Feske, S., Venuprasad, K., Gu,
H., Liu, Y.C., Dustin, M.L., and Rao, A. 2004. Calcineurin imposes T cell unresponsiveness through targeted proteolysis of signaling proteins. Nat Immunol 5:255-265.
144. Olenchock, B.A., Guo, R., Carpenter, J.H., Jordan, M., Topham, M.K., Koretzky,
G.A., and Zhong, X.P. 2006. Disruption of diacylglycerol metabolism impairs the induction of T cell anergy. Nat Immunol 7:1174-1181.
145. Zha, Y., Marks, R., Ho, A.W., Peterson, A.C., Janardhan, S., Brown, I., Praveen,
K., Stang, S., Stone, J.C., and Gajewski, T.F. 2006. T cell anergy is reversed by active Ras and is regulated by diacylglycerol kinase-alpha. Nat Immunol 7:1166-1173.
146. Mueller, D.L. 2006. Linking diacylglycerol kinase to T cell anergy. Nat Immunol
7:1132-1134. 147. Mueller, D.L. 2004. E3 ubiquitin ligases as T cell anergy factors. Nat Immunol
5:883-890. 148. Liu, Y.C. 2004. Ubiquitin ligases and the immune response. Annu Rev Immunol
150

22:81-127. 149. Behar, S.M., Dascher, C.C., Grusby, M.J., Wang, C.R., and Brenner, M.B. 1999.
Susceptibility of mice deficient in CD1D or TAP1 to infection with Mycobacterium tuberculosis. J. Exp. Med 189:1973.
150. Sousa, A.O., Mazzaccaro, R.J., Russell, R.G., Lee, F.K., Turner, O.C., Hong, S.,
Van Kaer, L., and Bloom, B.R. 2000. Relative contributions of distinct MHC class I-dependent cell populations in protection to tuberculosis infection in mice. Proc Natl Acad Sci U S A 97:4204-4208.
151. Sugawara, I., Yamada, H., Mizuno, S., Li, C.Y., Nakayama, T., and Taniguchi, M.
2002. Mycobacterial infection in natural killer T cell knockout mice. Tuberculosis (Edinb) 82:97-104.
152. Szalay, G., Zugel, U., Ladel, C.H., and Kaufmann, S.H. 1999. Participation of
group 2 CD1 molecules in the control of murine tuberculosis. Microbes Infect 1:1153-1157.
153. Dieli, F., Taniguchi, M., Kronenberg, M., Sidobre, S., Ivanyi, J., Fattorini, L., Iona,
E., Orefici, G., De Leo, G., Russo, D., et al. 2003. An anti-inflammatory role for V alpha 14 NK T cells in Mycobacterium bovis bacillus Calmette-Guerin-infected mice. J Immunol 171:1961-1968.
154. Kawakami, K., Kinjo, Y., Uezu, K., Yara, S., Miyagi, K., Koguchi, Y., Nakayama,
T., Taniguchi, M., and Saito, A. 2002. Minimal contribution of Valpha14 natural killer T cells to Th1 response and host resistance against mycobacterial infection in mice. Microbiol Immunol 46:207-210.
155. Ishigami, M., Nishimura, H., Naiki, Y., Yoshioka, K., Kawano, T., Tanaka, Y.,
Taniguchi, M., Kakumu, S., and Yoshikai, Y. 1999. The roles of intrahepatic Valpha14(+) NK1.1(+) T cells for liver injury induced by Salmonella infection in mice. Hepatology 29:1799-1808.
156. Berntman, E., Rolf, J., Johansson, C., Anderson, P., and Cardell, S.L. 2005. The
role of CD1d-restricted NK T lymphocytes in the immune response to oral
151

infection with Salmonella typhimurium. Eur J Immunol 35:2100-2109. 157. Szalay, G., Ladel, C.H., Blum, C., Brossay, L., Kronenberg, M., and Kaufmann,
S.H. 1999. Cutting edge: anti-CD1 monoclonal antibody treatment reverses the production patterns of TGF-beta 2 and Th1 cytokines and ameliorates listeriosis in mice. J Immunol 162:6955-6958.
158. Arrunategui-Correa, V., and Kim, H.S. 2004. The role of CD1d in the immune
response against Listeria infection. Cell Immunol 227:109-120. 159. Ranson, T., Bregenholt, S., Lehuen, A., Gaillot, O., Leite-de-Moraes, M.C.,
Herbelin, A., Berche, P., and Di Santo, J.P. 2005. Invariant V alpha 14+ NKT cells participate in the early response to enteric Listeria monocytogenes infection. J Immunol 175:1137-1144.
160. Joyee, A.G., Qiu, H., Wang, S., Fan, Y., Bilenki, L., and Yang, X. 2007. Distinct
NKT cell subsets are induced by different Chlamydia species leading to differential adaptive immunity and host resistance to the infections. J Immunol 178:1048-1058.
161. Bilenki, L., Wang, S., Yang, J., Fan, Y., Joyee, A.G., and Yang, X. 2005. NK T cell
activation promotes Chlamydia trachomatis infection in vivo. J Immunol 175:3197-3206.
162. Kawakami, K., Yamamoto, N., Kinjo, Y., Miyagi, K., Nakasone, C., Uezu, K.,
Kinjo, T., Nakayama, T., Taniguchi, M., and Saito, A. 2003. Critical role of Valpha14+ natural killer T cells in the innate phase of host protection against Streptococcus pneumoniae infection. Eur J Immunol 33:3322-3330.
163. Eberl, G., and MacDonald, H.R. 1998. Rapid death and regeneration of NKT cells
in anti-CD3epsilon- or IL-12-treated mice: a major role for bone marrow in NKT cell homeostasis. Immunity 9:345.
164. Motsinger, A., Haas, D.W., Stanic, A.K., Van Kaer, L., Joyce, S., and Unutmaz, D.
2002. CD1d-restricted human natural killer T cells are highly susceptible to human immunodeficiency virus 1 infection. J Exp Med 195:869-879.
152

165. Kawano, T., Cui, J., Koezuka, Y., Toura, I., and Kaneko, Y. 1997. CD1d-restricted
and TCR-mediated activation of valpha14 NKT cells by glycosylceramides. Science 278:1626.
166. Hobbs, J.A., Cho, S., Roberts, T.J., Sriram, V., Zhang, J., Xu, M., and Brutkiewicz,
R.R. 2001. Selective loss of natural killer T cells by apoptosis following infection with lymphocytic choriomeningitis virus. J Virol 75:10746-10754.
167. Daniels, K.A., Devora, G., Lai, W.C., O'Donnell, C.L., Bennett, M., and Welsh,
R.M. 2001. Murine cytomegalovirus is regulated by a discrete subset of natural killer cells reactive with monoclonal antibody to Ly49H. J Exp Med 194:29-44.
168. Kirby, A.C., Yrlid, U., and Wick, M.J. 2002. The innate immune response differs
in primary and secondary Salmonella infection. J Immunol 169:4450-4459. 169. Uldrich, A.P., Crowe, N.Y., Kyparissoudis, K., Pellicci, D.G., and Zhan, Y. 2005.
NKT cell stimulation with glycolipid antigen in vivo: costimulation-dependent expansion, Bim-dependent contraction, and hyporesponsiveness to further antigenic challenge. J. Immunol. 175:3092.
170. Takeda, K., Hayakawa, Y., Van Kaer, L., Matsuda, H., Yagita, H., and Okumura,
K. 2000. Critical contribution of liver natural killer T cells to a murine model of hepatitis. Proc Natl Acad Sci U S A 97:5498-5503.
171. Taniguchi, M., Harada, M., Kojo, S., Nakayama, T., and Wakao, H. 2003. The
regulatory role of Valpha14 NKT cells in innate and acquired immune response. Annu Rev Immunol 21:483-513.
172. Kronenberg, M. 2005. Toward an understanding of NKT cell biology: progress
and paradoxes. Annu Rev Immunol 23:877-900. 173. Lin, Y., Roberts, T.J., Wang, C.R., Cho, S., and Brutkiewicz, R.R. 2005. Long-
term loss of canonical NKT cells following an acute virus infection. Eur. J. Immunol. 35:879-889.
153

174. Osman, Y., Kawamura, T., Naito, T., Takeda, K., Van Kaer, L., Okumura, K., and Abo, T. 2000. Activation of hepatic NKT cells and subsequent liver injury following administration of alpha-galactosylceramide. Eur J Immunol 30:1919-1928.
175. Ito, K., Karasawa, M., Kawano, T., Akasaka, T., Koseki, H., Akutsu, Y., Kondo, E.,
Sekiya, S., Sekikawa, K., Harada, M., et al. 2000. Involvement of decidual Vα14 NKT cells in abortion. Proc. Natl. Acad. Sci. USA 97:740-744.
176. Major, A.S., Joyce, S., and Van Kaer, L. 2006. Lipid metabolism, atherogenesis
and CD1-restricted antigen presentation. Trends Mol. Med. 12:270-278. 177. Bilenki, L., Yang, J., Fan, Y., Wang, S., and Yang, X. 2004. Natural killer T cells
contribute to airway eosinophilic inflammation induced by ragweed through enhanced IL-4 and eotaxin production. Eur. J. Immunol. 34:345-354.
178. Sandberg, J.K., Bhardwaj, N., and Nixon, D.F. 2003. Dominant effector memory
characteristics, capacity for dynamic adaptive expansion, and sex bias in the innate Valpha24 NKT cell compartment. Eur J Immunol 33:588-596.
179. Snyder-Cappione, J.E., Nixon, D.F., Loo, C.P., Chapman, J.M., Meiklejohn, D.A.,
Melo, F.F., Costa, P.R., Sandberg, J.K., Rodrigues, D.S., and Kallas, E.G. 2007. Individuals with pulmonary tuberculosis have lower levels of circulating CD1d-restricted NKT cells. J Infect Dis 195:1361-1364.
180. Van Kaer, L. 2005. alpha-Galactosylceramide therapy for autoimmune diseases:
prospects and obstacles. Nat Rev Immunol 5:31-42. 181. Brigl, M., and Brenner, M.B. 2004. CD1: antigen presentation and T cell function.
Annu. Rev. Immunol 22:817. 182. Smyth, M.J., Crowe, N.Y., Pellicci, D.G., Kyparissoudis, K., Kelly, J.M., Takeda,
K., Yagita, H., and Godfrey, D.I. 2002. Sequential production of interferon-gamma by NK1.1(+) T cells and natural killer cells is essential for the antimetastatic effect of alpha-galactosylceramide. Blood 99:1259-1266.
154

183. Bezbradica, J.S., Stanic, A.K., and Joyce, S. 2006. Characterization and functional analysis of mouse invariant natural T (iNKT) cells. Curr Protoc Immunol Chapter 14:Unit 14 13.
184. Fujii, S., Shimizu, K., Kronenberg, M., and Steinman, R.M. 2002. Prolonged IFN-
γ-producing NKT response induced with α-galactosylceramide-loaded DCs. Nat. Immunol. 3:867-874.
185. Hargreaves, R.G., Borthwick, N.J., Gilardini Montani, M.S., Piccolella, E.,
Carmichael, P., Lechler, R.I., Akbar, A.N., and Lombardi, G. 1997. Dissociation of T cell anergy from apoptosis by blockade of Fas/Apo-1 (CD95) signaling. J Immunol 158:3099-3107.
186. Frauwirth, K.A., Alegre, M.L., and Thompson, C.B. 2000. Induction of T cell
anergy in the absence of CTLA-4/B7 interaction. J Immunol 164:2987-2993. 187. Perez, V.L., Van Parijs, L., Biuckians, A., Zheng, X.X., Strom, T.B., and Abbas,
A.K. 1997. Induction of peripheral T cell tolerance in vivo requires CTLA-4 engagement. Immunity 6:411-417.
188. Wells, A.D., Walsh, M.C., Bluestone, J.A., and Turka, L.A. 2001. Signaling
through CD28 and CTLA-4 controls two distinct forms of T cell anergy. J Clin Invest 108:895-903.
189. Parekh, V.V., Wilson, M.T., Olivares-Villagomez, D., Singh, A.K., and Wu, L.
2005. Glycolipid antigen induces long-term natural killer T cell anergy in mice. J. Clin. Invest. 115:2572.
190. Van Kaer, L., and Joyce, S. 2005. Innate immunity: NKT cells in the spotlight.
Curr Biol 15:R429-431. 191. Feuillet, V., Medjane, S., Mondor, I., Demaria, O., Pagni, P.P., Galan, J.E., Flavell,
R.A., and Alexopoulou, L. 2006. Involvement of Toll-like receptor 5 in the recognition of flagellated bacteria. Proc Natl Acad Sci U S A 103:12487-12492.
192. Yanagisawa, K., Exley, M.A., Jiang, X., Ohkochi, N., Taniguchi, M., and Seino, K.
155

2006. Hyporesponsiveness to natural killer T-cell ligand alpha-galactosylceramide in cancer-bearing state mediated by CD11b+ Gr-1+ cells producing nitric oxide. Cancer Res 66:11441-11446.
193. Yao, Z.Q., King, E., Prayther, D., Yin, D., and Moorman, J. 2007. T cell
dysfunction by hepatitis C virus core protein involves PD-1/PDL-1 signaling. Viral Immunol 20:276-287.
194. Zhang, J.Y., Zhang, Z., Wang, X., Fu, J.L., Yao, J., Jiao, Y., Chen, L., Zhang, H.,
Wei, J., Jin, L., et al. 2007. PD-1 up-regulation is correlated with HIV-specific memory CD8+ T-cell exhaustion in typical progressors but not in long-term nonprogressors. Blood 109:4671-4678.
195. Blank, C., and Mackensen, A. 2007. Contribution of the PD-L1/PD-1 pathway to
T-cell exhaustion: an update on implications for chronic infections and tumor evasion. Cancer Immunol Immunother 56:739-745.
196. Urbani, S., Amadei, B., Tola, D., Massari, M., Schivazappa, S., Missale, G., and
Ferrari, C. 2006. PD-1 expression in acute hepatitis C virus (HCV) infection is associated with HCV-specific CD8 exhaustion. J Virol 80:11398-11403.
197. Day, C.L., Kaufmann, D.E., Kiepiela, P., Brown, J.A., Moodley, E.S., Reddy, S.,
Mackey, E.W., Miller, J.D., Leslie, A.J., DePierres, C., et al. 2006. PD-1 expression on HIV-specific T cells is associated with T-cell exhaustion and disease progression. Nature 443:350-354.
198. Halder, R.C., Aguilera, C., Maricic, I., and Kumar, V. 2007. Type II NKT cell-
mediated anergy induction in type I NKT cells prevents inflammatory liver disease. J Clin Invest 117:2302-2312.
199. Skold, M., Xiong, X., Illarionov, P.A., Besra, G.S., and Behar, S.M. 2005.
Interplay of cytokines and microbial signals in regulation of CD1d expression and NKT cell activation. J. Immunol 175:3584.
200. Raghuraman, G., Geng, Y., and Wang, C.R. 2006. IFN-beta-mediated up-
regulation of CD1d in bacteria-infected APCs. J Immunol 177:7841-7848.
156

201. Andersen-Nissen, E., Smith, K.D., Bonneau, R., Strong, R.K., and Aderem, A.
2007. A conserved surface on Toll-like receptor 5 recognizes bacterial flagellin. J. Exp. Med. 204:393-403.
202. Bendelac, A., Savage, P.B., and Teyton, L. 2007. The Biology of NKT Cells.
Annual Review of Immunology 25:297-336. 203. Van Kaer, L. 2007. NKT cells: T lymphocytes with innate effector functions. Curr
Opin Immunol 19:354-364. 204. Bezbradica, J.S., Van Kaer, L., and Joyce, S. . 2007. Encyclopedia of life
sciences.: John Wiley & Sons, Ltd. 205. Brutkiewicz, R.R. 2006. CD1d ligands: the good, the bad, and the ugly. J
Immunol 177:769-775. 206. Kronenberg, M., and Gapin, L. 2007. Natural killer T cells: know thyself. Proc
Natl Acad Sci U S A 104:5713-5714. 207. Van Kaer, L. 2004. Natural killer T cells as targets for immunotherapy of
autoimmune diseases. Immunol Cell Biol 82:315-322. 208. Moody, D.B. 2006. TLR gateways to CD1 function. Nat Immunol 7:811-817. 209. Paget, C., Mallevaey, T., Speak, A.O., Torres, D., Fontaine, J., Sheehan, K.C.,
Capron, M., Ryffel, B., Faveeuw, C., Leite de Moraes, M., et al. 2007. Activation of invariant NKT cells by toll-like receptor 9-stimulated dendritic cells requires type I interferon and charged glycosphingolipids. Immunity 27:597-609.
210. Yamamoto, R., Nishikori, M., Kitawaki, T., Sakai, T., Hishizawa, M., Tashima, M.,
Kondo, T., Ohmori, K., Kurata, M., Hayashi, T., et al. 2008. PD-1-PD-1 ligand interaction contributes to immunosuppressive microenvironment of Hodgkin lymphoma. Blood 111:3220-3224.
211. Schijns, V.E., and Tangeras, A. 2005. Vaccine adjuvant technology: from
157
theoretical mechanisms to practical approaches. Dev Biol (Basel) 121:127-134. 212. Heine, H., and Lien, E. 2003. Toll-like receptors and their function in innate and
adaptive immunity. Int Arch Allergy Immunol 130:180-192. 213. Medzhitov, R., and Janeway, C., Jr. 2000. The Toll receptor family and microbial
recognition. Trends Microbiol 8:452-456. 214. Klinman, D.M., Yi, A.K., Beaucage, S.L., Conover, J., and Krieg, A.M. 1996.
CpG motifs present in bacteria DNA rapidly induce lymphocytes to secrete interleukin 6, interleukin 12, and interferon gamma. Proc Natl Acad Sci U S A 93:2879-2883.
215. Askenase, P.W., Itakura, A., Leite-de-Moraes, M.C., Lisbonne, M., Roongapinun,
S., Goldstein, D.R., and Szczepanik, M. 2005. TLR-dependent IL-4 production by invariant Valpha14+Jalpha18+ NKT cells to initiate contact sensitivity in vivo. J Immunol 175:6390-6401.
216. Tsujimoto, H., Ono, S., Matsumoto, A., Kawabata, T., Kinoshita, M., Majima, T.,
Hiraki, S., Seki, S., Moldawer, L.L., and Mochizuki, H. 2006. A critical role of CpG motifs in a murine peritonitis model by their binding to highly expressed toll-like receptor-9 on liver NKT cells. J Hepatol 45:836-843.
217. Ebihara, T., Masuda, H., Akazawa, T., Shingai, M., Kikuta, H., Ariga, T.,
Matsumoto, M., and Seya, T. 2007. Induction of NKG2D ligands on human dendritic cells by TLR ligand stimulation and RNA virus infection. Int Immunol 19:1145-1155.
218. Jenkins, M.K., Chen, C.A., Jung, G., Mueller, D.L., and Schwartz, R.H. 1990.
Inhibition of antigen-specific proliferation of type 1 murine T cell clones after stimulation with immobilized anti-CD3 monoclonal antibody. J Immunol 144:16-22.
219. Li, W., Whaley, C.D., Mondino, A., and Mueller, D.L. 1996. Blocked signal
transduction to the ERK and JNK protein kinases in anergic CD4+ T cells. Science 271:1272-1276.
158

220. Fields, P.E., Gajewski, T.F., and Fitch, F.W. 1996. Blocked Ras activation in
anergic CD4+ T cells. Science 271:1276-1278. 221. Migita, K., Eguchi, K., Kawabe, Y., Tsukada, T., Ichinose, Y., Nagataki, S., and
Ochi, A. 1995. Defective TCR-mediated signaling in anergic T cells. J Immunol 155:5083-5087.
222. Utting, O., Teh, S.J., and Teh, H.S. 2000. A population of in vivo anergized T cells
with a lower activation threshold for the induction of CD25 exhibit differential requirements in mobilization of intracellular calcium and mitogen-activated protein kinase activation. J Immunol 164:2881-2889.
223. Tanchot, C., Guillaume, S., Delon, J., Bourgeois, C., Franzke, A., Sarukhan, A.,
Trautmann, A., and Rocha, B. 1998. Modifications of CD8+ T cell function during in vivo memory or tolerance induction. Immunity 8:581-590.
224. Jiang, Y., Jahagirdar, B.N., Reinhardt, R.L., Schwartz, R.E., Keene, C.D., Ortiz-
Gonzalez, X.R., Reyes, M., Lenvik, T., Lund, T., Blackstad, M., et al. 2002. Pluripotency of mesenchymal stem cells derived from adult marrow. Nature 418:41-49.
225. Weissman, I.L., Heimfeld, S., and Spangrude, G. 1989. Haemopoietic stem cell
purification. Immunol Today 10:184-185. 226. van de Rijn, M., Heimfeld, S., Spangrude, G.J., and Weissman, I.L. 1989. Mouse
hematopoietic stem-cell antigen Sca-1 is a member of the Ly-6 antigen family. Proc Natl Acad Sci U S A 86:4634-4638.
227. Ogawa, M., Matsuzaki, Y., Nishikawa, S., Hayashi, S., Kunisada, T., Sudo, T.,
Kina, T., Nakauchi, H., and Nishikawa, S. 1991. Expression and function of c-kit in hemopoietic progenitor cells. J Exp Med 174:63-71.
228. Fleming, W.H., Alpern, E.J., Uchida, N., Ikuta, K., and Weissman, I.L. 1993. Steel
factor influences the distribution and activity of murine hematopoietic stem cells in vivo. Proc Natl Acad Sci U S A 90:3760-3764.
159

229. Ikuta, K., Ingolia, D.E., Friedman, J., Heimfeld, S., and Weissman, I.L. 1991.
Mouse hematopoietic stem cells and the interaction of c-kit receptor and steel factor. Int J Cell Cloning 9:451-460.
230. Ikuta, K., and Weissman, I.L. 1992. Evidence that hematopoietic stem cells
express mouse c-kit but do not depend on steel factor for their generation. Proc Natl Acad Sci U S A 89:1502-1506.
231. Morrison, S.J., Wandycz, A.M., Hemmati, H.D., Wright, D.E., and Weissman, I.L.
1997. Identification of a lineage of multipotent hematopoietic progenitors. Development 124:1929-1939.
232. Morrison, S.J., and Weissman, I.L. 1994. The long-term repopulating subset of
hematopoietic stem cells is deterministic and isolatable by phenotype. Immunity 1:661-673.
233. Uchida, N., and Weissman, I.L. 1992. Searching for hematopoietic stem cells:
evidence that Thy-1.1lo Lin- Sca-1+ cells are the only stem cells in C57BL/Ka-Thy-1.1 bone marrow. J Exp Med 175:175-184.
234. Christensen, J.L., and Weissman, I.L. 2001. Flk-2 is a marker in hematopoietic
stem cell differentiation: a simple method to isolate long-term stem cells. Proc Natl Acad Sci U S A 98:14541-14546.
235. Adolfsson, J., Borge, O.J., Bryder, D., Theilgaard-Monch, K., Astrand-
Grundstrom, I., Sitnicka, E., Sasaki, Y., and Jacobsen, S.E. 2001. Upregulation of Flt3 expression within the bone marrow Lin(-)Sca1(+)c-kit(+) stem cell compartment is accompanied by loss of self-renewal capacity. Immunity 15:659-669.
236. Smith, L.G., Weissman, I.L., and Heimfeld, S. 1991. Clonal analysis of
hematopoietic stem-cell differentiation in vivo. Proc Natl Acad Sci U S A 88:2788-2792.
237. Wagers, A.J., Sherwood, R.I., Christensen, J.L., and Weissman, I.L. 2002. Little
160

evidence for developmental plasticity of adult hematopoietic stem cells. Science 297:2256-2259.
238. Goodell, M.A., Brose, K., Paradis, G., Conner, A.S., and Mulligan, R.C. 1996.
Isolation and functional properties of murine hematopoietic stem cells that are replicating in vivo. J Exp Med 183:1797-1806.
239. Akashi, K., Kondo, M., Cheshier, S., Shizuru, J., Gandy, K., Domen, J., Mebius,
R., Traver, D., and Weissman, I.L. 1999. Lymphoid development from stem cells and the common lymphocyte progenitors. Cold Spring Harb Symp Quant Biol 64:1-12.
240. Akashi, K., Traver, D., Kondo, M., and Weissman, I.L. 1999. Lymphoid
development from hematopoietic stem cells. Int J Hematol 69:217-226. 241. Kondo, M., Weissman, I.L., and Akashi, K. 1997. Identification of clonogenic
common lymphoid progenitors in mouse bone marrow. Cell 91:661-672. 242. Aguila, H.L., Akashi, K., Domen, J., Gandy, K.L., Lagasse, E., Mebius, R.E.,
Morrison, S.J., Shizuru, J., Strober, S., Uchida, N., et al. 1997. From stem cells to lymphocytes: biology and transplantation. Immunol Rev 157:13-40.
243. Akashi, K., Traver, D., Miyamoto, T., and Weissman, I.L. 2000. A clonogenic
common myeloid progenitor that gives rise to all myeloid lineages. Nature 404:193-197.
244. Allman, D., Sambandam, A., Kim, S., Miller, J.P., Pagan, A., Well, D., Meraz, A.,
and Bhandoola, A. 2003. Thymopoiesis independent of common lymphoid progenitors. Nat Immunol 4:168-174.
245. Brazelton, T.R., Rossi, F.M., Keshet, G.I., and Blau, H.M. 2000. From marrow to
brain: expression of neuronal phenotypes in adult mice. Science 290:1775-1779. 246. Kopen, G.C., Prockop, D.J., and Phinney, D.G. 1999. Marrow stromal cells
migrate throughout forebrain and cerebellum, and they differentiate into astrocytes after injection into neonatal mouse brains. Proc Natl Acad Sci U S A
161
96:10711-10716. 247. Mezey, E., Chandross, K.J., Harta, G., Maki, R.A., and McKercher, S.R. 2000.
Turning blood into brain: cells bearing neuronal antigens generated in vivo from bone marrow. Science 290:1779-1782.
248. Petersen, B.E., Bowen, W.C., Patrene, K.D., Mars, W.M., Sullivan, A.K., Murase,
N., Boggs, S.S., Greenberger, J.S., and Goff, J.P. 1999. Bone marrow as a potential source of hepatic oval cells. Science 284:1168-1170.
249. Ferrari, G., Cusella-De Angelis, G., Coletta, M., Paolucci, E., Stornaiuolo, A.,
Cossu, G., and Mavilio, F. 1998. Muscle regeneration by bone marrow-derived myogenic progenitors. Science 279:1528-1530.
250. Gussoni, E., Soneoka, Y., Strickland, C.D., Buzney, E.A., Khan, M.K., Flint, A.F.,
Kunkel, L.M., and Mulligan, R.C. 1999. Dystrophin expression in the mdx mouse restored by stem cell transplantation. Nature 401:390-394.
251. Doyonnas, R., LaBarge, M.A., Sacco, A., Charlton, C., and Blau, H.M. 2004.
Hematopoietic contribution to skeletal muscle regeneration by myelomonocytic precursors. Proc Natl Acad Sci U S A 101:13507-13512.
252. LaBarge, M.A., and Blau, H.M. 2002. Biological progression from adult bone
marrow to mononucleate muscle stem cell to multinucleate muscle fiber in response to injury. Cell 111:589-601.
253. Palermo, A.T., Labarge, M.A., Doyonnas, R., Pomerantz, J., and Blau, H.M. 2005.
Bone marrow contribution to skeletal muscle: a physiological response to stress. Dev Biol 279:336-344.
254. Sacco, A., Doyonnas, R., LaBarge, M.A., Hammer, M.M., Kraft, P., and Blau,
H.M. 2005. IGF-I increases bone marrow contribution to adult skeletal muscle and enhances the fusion of myelomonocytic precursors. J Cell Biol 171:483-492.
255. Camargo, F.D., Green, R., Capetanaki, Y., Jackson, K.A., and Goodell, M.A. 2003. Single hematopoietic stem cells generate skeletal muscle through myeloid intermediates. Nat Med 9:1520-1527.
162
256. Ianus, A., Holz, G.G., Theise, N.D., and Hussain, M.A. 2003. In vivo derivation of
glucose-competent pancreatic endocrine cells from bone marrow without evidence of cell fusion. J Clin Invest 111:843-850.
257. Hess, D., Li, L., Martin, M., Sakano, S., Hill, D., Strutt, B., Thyssen, S., Gray,
D.A., and Bhatia, M. 2003. Bone marrow-derived stem cells initiate pancreatic regeneration. Nat Biotechnol 21:763-770.
258. Raff, M. 2003. Adult stem cell plasticity: fact or artifact? Annu Rev Cell Dev Biol
19:1-22. 259. Verfaillie, C.M., Pera, M.F., and Lansdorp, P.M. 2002. Stem cells: hype and reality.
Hematology (Am Soc Hematol Educ Program):369-391. 260. Joshi, C.V., and Enver, T. 2002. Plasticity revisited. Curr Opin Cell Biol 14:749-
755. 261. Holden, C., and Vogel, G. 2002. Stem cells. Plasticity: time for a reappraisal?
Science 296:2126-2129. 262. Hawley, R.G., and Sobieski, D.A. 2002. Somatic stem cell plasticity: to be or not
to be. Stem Cells 20:195-197. 263. Johnson, J., Bagley, J., Skaznik-Wikiel, M., Lee, H.J., Adams, G.B., Niikura, Y.,
Tschudy, K.S., Tilly, J.C., Cortes, M.L., Forkert, R., et al. 2005. Oocyte generation in adult mammalian ovaries by putative germ cells in bone marrow and peripheral blood. Cell 122:303-315.
264. Cairns, L.A., Moroni, E., Levantini, E., Giorgetti, A., Klinger, F.G., Ronzoni, S.,
Tatangelo, L., Tiveron, C., De Felici, M., Dolci, S., et al. 2003. Kit regulatory elements required for expression in developing hematopoietic and germ cell lineages. Blood 102:3954-3962.
265. Danielian, P.S., Muccino, D., Rowitch, D.H., Michael, S.K., and McMahon, A.P.
1998. Modification of gene activity in mouse embryos in utero by a tamoxifen-
163
inducible form of Cre recombinase. Curr Biol 8:1323-1326. 266. Hayashi, S., and McMahon, A.P. 2002. Efficient recombination in diverse tissues
by a tamoxifen-inducible form of Cre: a tool for temporally regulated gene activation/inactivation in the mouse. Dev Biol 244:305-318.
267. Gokkel, E., Grossman, Z., Ramot, B., Yarden, Y., Rechavi, G., and Givol, D. 1992.
Structural organization of the murine c-kit proto-oncogene. Oncogene 7:1423-1429.
268. Kluppel, M., Nagle, D.L., Bucan, M., and Bernstein, A. 1997. Long-range
genomic rearrangements upstream of Kit dysregulate the developmental pattern of Kit expression in W57 and Wbanded mice and interfere with distinct steps in melanocyte development. Development 124:65-77.
269. Berrozpe, G., Timokhina, I., Yukl, S., Tajima, Y., Ono, M., Zelenetz, A.D., and
Besmer, P. 1999. The W(sh), W(57), and Ph Kit expression mutations define tissue-specific control elements located between -23 and -154 kb upstream of Kit. Blood 94:2658-2666.
270. Duttlinger, R., Manova, K., Berrozpe, G., Chu, T.Y., DeLeon, V., Timokhina, I.,
Chaganti, R.S., Zelenetz, A.D., Bachvarova, R.F., and Besmer, P. 1995. The Wsh and Ph mutations affect the c-kit expression profile: c-kit misexpression in embryogenesis impairs melanogenesis in Wsh and Ph mutant mice. Proc Natl Acad Sci U S A 92:3754-3758.
271. Yasuda, H., Galli, S.J., and Geissler, E.N. 1993. Cloning and functional analysis
of the mouse c-kit promoter. Biochem Biophys Res Commun 191:893-901. 272. Eggan, K., Jurga, S., Gosden, R., Min, I.M., and Wagers, A.J. 2006. Ovulated
oocytes in adult mice derive from non-circulating germ cells. Nature 441:1109-1114.
273. Green, S.H., Mandl, A.M., and Zuckerman, S. 1951. The proportion of ovarian
follicles in different stages of development in rats and monkeys. J Anat 35:325-329.
164

274. Green, S.H., and Zuckerman, S. 1954. Further observations on oocyte numbers in
mature rhesus monkeys (Macaca mulatta). J Endocrinol 10:284-290. 275. Mandl, A.M., and Zuckerman, S. 1952. The growth of the oocyte and follicle in
the adult rat. J Endocrinol 8:126-132. 276. Mandl, A.M., Zuckerman, S., and Patterson, H.D. 1952. The number of oocytes in
ovarian fragments after compensatory hypertrophy. J Endocrinol 8:347-356. 277. Zuckerman, S. 1953. The law of follicular constancy. Acta Physiol Lat Am 3:198-
202. 278. Johnson, J., Canning, J., Kaneko, T., Pru, J.K., and Tilly, J.L. 2004. Germline
stem cells and follicular renewal in the postnatal mammalian ovary. Nature 428:145-150.
165