Immission measurements in the vicinity of LTE base stations · Spectral LTE measurement in “Level...
14
AN_HF_1064_E_LTE_measurement_methods 1 / 14 Subject to change Selective Radiation Meter SRM-3006 Application Note Immission measurements in the vicinity of LTE base stations Part 2: Measurement methods The SRM-3006 basically provides two different ways of measuring LTE base station signals followed by extrapolation to the maximum operational load of the installation: spectral measurement and code selective measurement. Both methods are based on filtering out the components of the LTE signal that are emitted with a defined and constant output power (i.e. independent of the actual traffic load). The two methods differ in that the spectral measurement is performed in the frequency domain with the signals to be captured being separated spectrally from the overall signal, whereas the code selective method extracts the signals to be measured from the coded signal. Both procedures are compared here and then described. Contents Comparison of measurement methods ............................................................. 2 Code selective measurement ................................................................................ 3 Spectral measurement .......................................................................10 Abbreviations .....................................................................................13 Bibliography .......................................................................................14 Author: Dr. Christian Bornkessel, IMST GmbH © 2013 Narda Safety Test Solutions GmbH Sandwiesenstr. 7 72793 Pfullingen, Deutschland Tel.: +49 7121 9732-0 Fax: +49 7121 9732-790 E-mail: [email protected] www.narda-sts.de
Transcript of Immission measurements in the vicinity of LTE base stations · Spectral LTE measurement in “Level...

AN_HF_1064_E_LTE_measurement_methods 1 / 14 Subject to change
Selective Radiation Meter SRM-3006
Application Note
Immission measurements in the vicinity of LTE base stations Part 2: Measurement methods The SRM-3006 basically provides two different ways of measuring LTE base station signals followed by extrapolation to the maximum operational load of the installation: spectral measurement and code selective measurement. Both methods are based on filtering out the components of the LTE signal that are emitted with a defined and constant output power (i.e. independent of the actual traffic load). The two methods differ in that the spectral measurement is performed in the frequency domain with the signals to be captured being separated spectrally from the overall signal, whereas the code selective method extracts the signals to be measured from the coded signal. Both procedures are compared here and then described.
Contents Comparison of measurement methods ............................................................. 2 Code selective measurement ................................................................................ 3 Spectral measurement ....................................................................... 10 Abbreviations ..................................................................................... 13 Bibliography ....................................................................................... 14
Author: Dr. Christian Bornkessel, IMST GmbH © 2013 Narda Safety Test Solutions GmbH Sandwiesenstr. 7 72793 Pfullingen, Deutschland Tel.: +49 7121 9732-0 Fax: +49 7121 9732-790 E-mail: [email protected] www.narda-sts.de
AN_HF_1064_E_LTE_measurement_methods 2 / 14 Subject to change
Comparison of measurement methods Spectral LTE measurement in “Level Recorder” mode of the SRM-3006 is one of two possible ways of measuring LTE signals. However, such measurements come up against the following limitations when the LTE network is at an advanced stage of development (i.e. with a station density comparable to that of GSM and UMTS). LTE is a single wavelength; that is all the base stations or base station sectors (called cells in this article) of an operator in a frequency band (e.g. LTE-800) transmit on the same frequency. The immission measured using the spectral method is therefore the total immission of all the cells of an operator, so it is not possible to separate different cells from one another. Although the overall immission is of primary concern when it comes to radiation protection, for many measurement tasks it is desirable to be able to investigate the immission of just one cell and to blank out all the others. This cannot be done satisfactorily using the spectral measurement method when the measurement is being made at a location where several cells contribute significantly to the total immission. Also, in the event that the different cells are differently configured according to their parameter settings, it is not possible to correctly determine the maximum immission because it is impossible to ascertain which proportion of the measured immission emanates from which cell. For this reason, the SRM-3006 offers a second measurement method as an option: Code selective measurement. The code selective method may be considered as the preferred procedure for measuring LTE immissions, due to its advantages compared to the spectral method, particularly the possibility of separating the immissions of individual base stations and sectors from each other. The method has a lower relative dynamic range than the spectral method; the influence of this limited relative dynamic range on the accuracy of the measurement at different LTE station traffic loads needs to be looked at more closely in practice. Initial studies have been made, e.g. in [BOR 13]. For quality control purposes it may therefore be sensible to perform the spectral measurement for some measurement points at the same time as the code selective measurement and to check the results of both methods for plausibility.

AN_HF_1064_E_LTE_measurement_methods 3 / 14 Subject to change
Figure 1: Resource grid of the LTE base station signal in one antenna layer of 2 antenna MIMO, according to [BOO]
Code selective measurement The code selective measurement makes use of the fact that the primary synchronization signals (P-SS), secondary synchronization signals (S-SS) and reference signals (RS) of LTE base stations are coded cell-specifically. This means that a different code is used for each base station and each sector of a base station (cell). By decoding the signal measured by the receiving antenna, it is possible to split the immissions up and match them to the corresponding cells. Capturing the RS takes on special significance with code selective measurement because they are transmitted permanently and simultaneously from both antennas (or in the +45° and -45° polarization layers for cross-polarized antennas) in contrast with the P-SS and S-SS. The RS for both antennas occupy different positions in the resource
00 01 02 03 04 05 06 07 08 09 10 11 12 13 14 15 16 17 18 19
Slotnummer
Num
mer
des
Unt
ertr
äger
s
20
25
30
35
-10
-5
5
-40
-45
-35
-25
P-SS Primary Synchronization Signal
S-SS Secondary Synchronization Signal
-30
40
45
0
-20
-15
10
15
PDCCH Physical Downlink Control Channel
PDSCH Physical Downlink Shared Channel
RS Reference Signal
PBCH Physical Broadcast Channel
Slot number
Sub
car
rier n
umbe
r
AN_HF_1064_E_LTE_measurement_methods 4 / 14 Subject to change
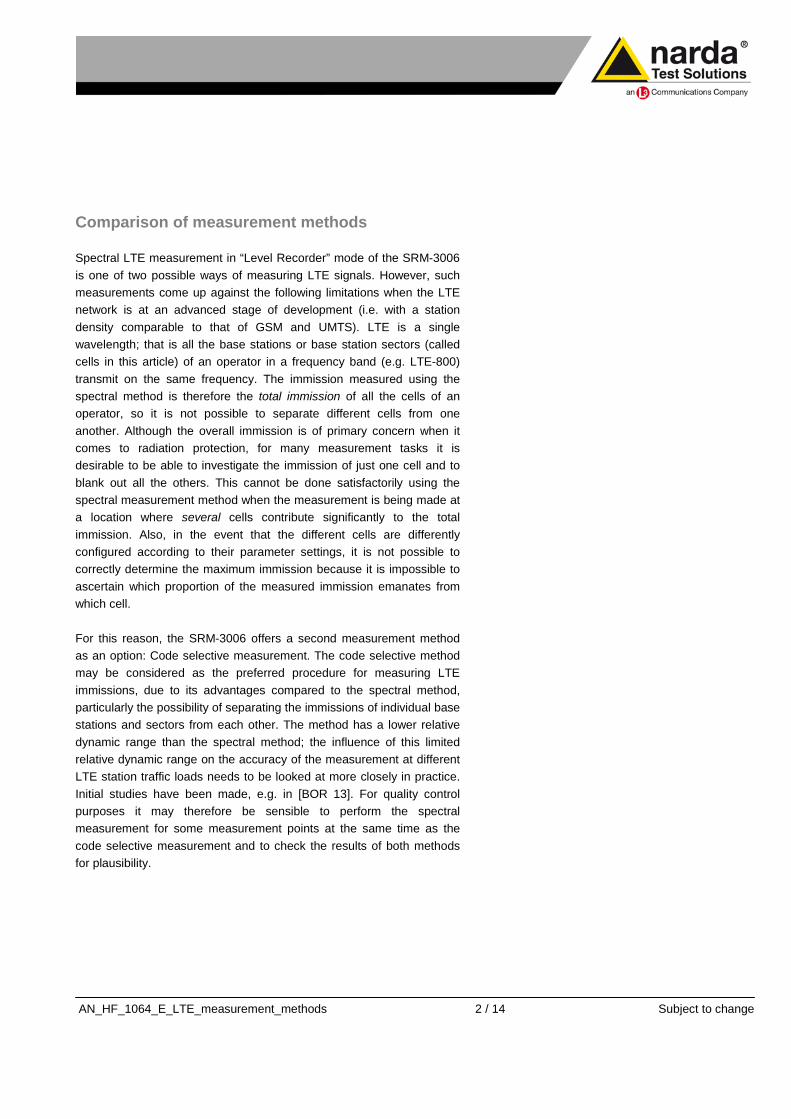
Figure 2: Reference signal (RS) distribution for antenna 0 (left) and antenna 1 (right) [ETSI 136.211]
Table 1: Center frequencies and bandwidths of the current LTE networks in Germany.
grid, see Figure 2 [ETSI 136.211]: The middle sub carrier between two RS in a symbol is blanked in each case, and the RS of the other antenna is located at exactly this position. This interlaced arrangement enables the LTE terminal (or in this case the code selective measuring instrument) to determine whether the received RS element is coming from antenna 0 or antenna 1.
The SRM-3006 can perform this decoding. The immissions of the RS (per resource element, averaged over all the recorded RS elements) are then output as “RS 0” and “RS 1”. According to the LTE specification, up to four antennas can be used in each base station; the immissions of the two additional antennas are decoded and output as “RS 2” and “RS 3”. As far as we know, however, this 4 antenna MIMO is not in use in normal operation anywhere in Germany at this time.
Operator LTE band Center frequency Channel bandwidth Signal bandwidth
Telefónica LTE-800 796 MHz 10 MHz 9 MHz
Vodafone LTE-800 806 MHz 10 MHz 9 MHz
Telekom LTE-800 816 MHz 10 MHz 9 MHz
Telekom LTE-1800 1815 MHz 20 MHz 18 MHz
Selecting “LTE” mode activates the code selective measurement. First of all, the center frequency of the LTE signal to be measured should be entered for “Fcent” in the right-hand menu bar (see Table 1 for examples). The (channel) bandwidth or the number of sub carriers from the resource grid via which the decoding of the RS is to take place is selected for “CBW”. If, for example, an LTE-800 signal with a channel bandwidth of 10 MHz is to be measured, the CBW setting must not be more than 10 MHz. Smaller values can be used; at the lowest setting of
AN_HF_1064_E_LTE_measurement_methods 5 / 14 Subject to change
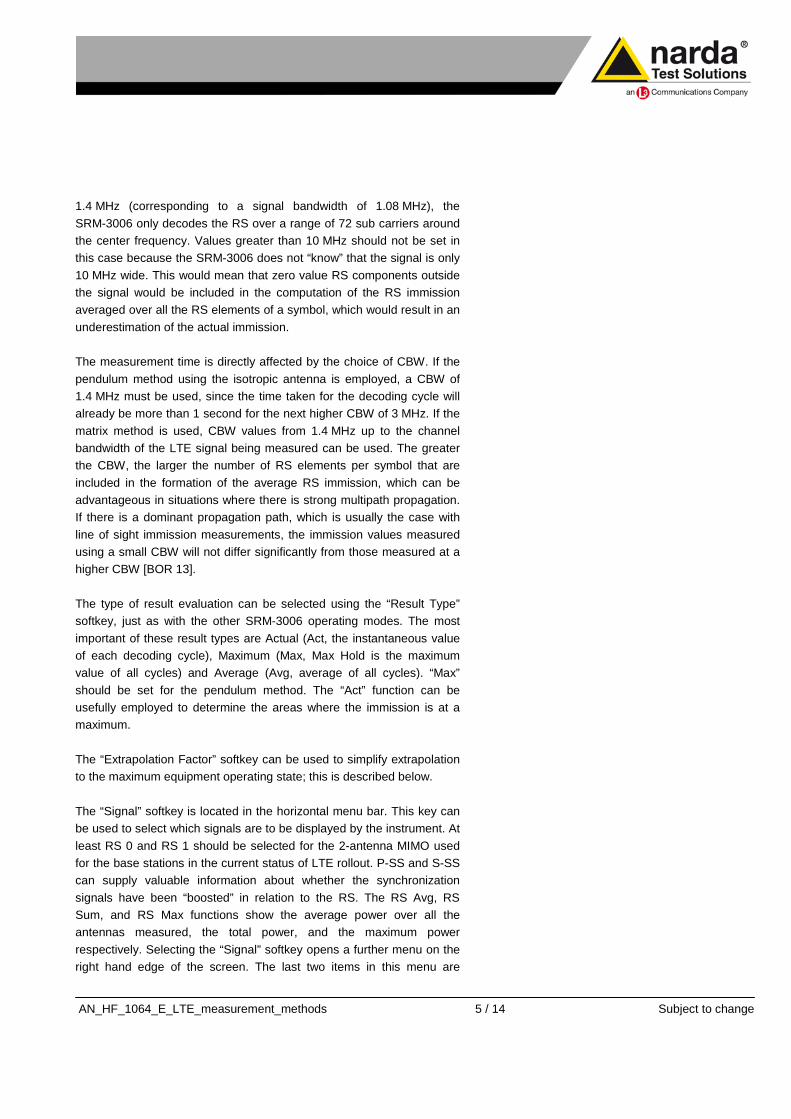
1.4 MHz (corresponding to a signal bandwidth of 1.08 MHz), the SRM-3006 only decodes the RS over a range of 72 sub carriers around the center frequency. Values greater than 10 MHz should not be set in this case because the SRM-3006 does not “know” that the signal is only 10 MHz wide. This would mean that zero value RS components outside the signal would be included in the computation of the RS immission averaged over all the RS elements of a symbol, which would result in an underestimation of the actual immission. The measurement time is directly affected by the choice of CBW. If the pendulum method using the isotropic antenna is employed, a CBW of 1.4 MHz must be used, since the time taken for the decoding cycle will already be more than 1 second for the next higher CBW of 3 MHz. If the matrix method is used, CBW values from 1.4 MHz up to the channel bandwidth of the LTE signal being measured can be used. The greater the CBW, the larger the number of RS elements per symbol that are included in the formation of the average RS immission, which can be advantageous in situations where there is strong multipath propagation. If there is a dominant propagation path, which is usually the case with line of sight immission measurements, the immission values measured using a small CBW will not differ significantly from those measured at a higher CBW [BOR 13]. The type of result evaluation can be selected using the “Result Type” softkey, just as with the other SRM-3006 operating modes. The most important of these result types are Actual (Act, the instantaneous value of each decoding cycle), Maximum (Max, Max Hold is the maximum value of all cycles) and Average (Avg, average of all cycles). “Max” should be set for the pendulum method. The “Act” function can be usefully employed to determine the areas where the immission is at a maximum. The “Extrapolation Factor” softkey can be used to simplify extrapolation to the maximum equipment operating state; this is described below. The “Signal” softkey is located in the horizontal menu bar. This key can be used to select which signals are to be displayed by the instrument. At least RS 0 and RS 1 should be selected for the 2-antenna MIMO used for the base stations in the current status of LTE rollout. P-SS and S-SS can supply valuable information about whether the synchronization signals have been “boosted” in relation to the RS. The RS Avg, RS Sum, and RS Max functions show the average power over all the antennas measured, the total power, and the maximum power respectively. Selecting the “Signal” softkey opens a further menu on the right hand edge of the screen. The last two items in this menu are
AN_HF_1064_E_LTE_measurement_methods 6 / 14 Subject to change
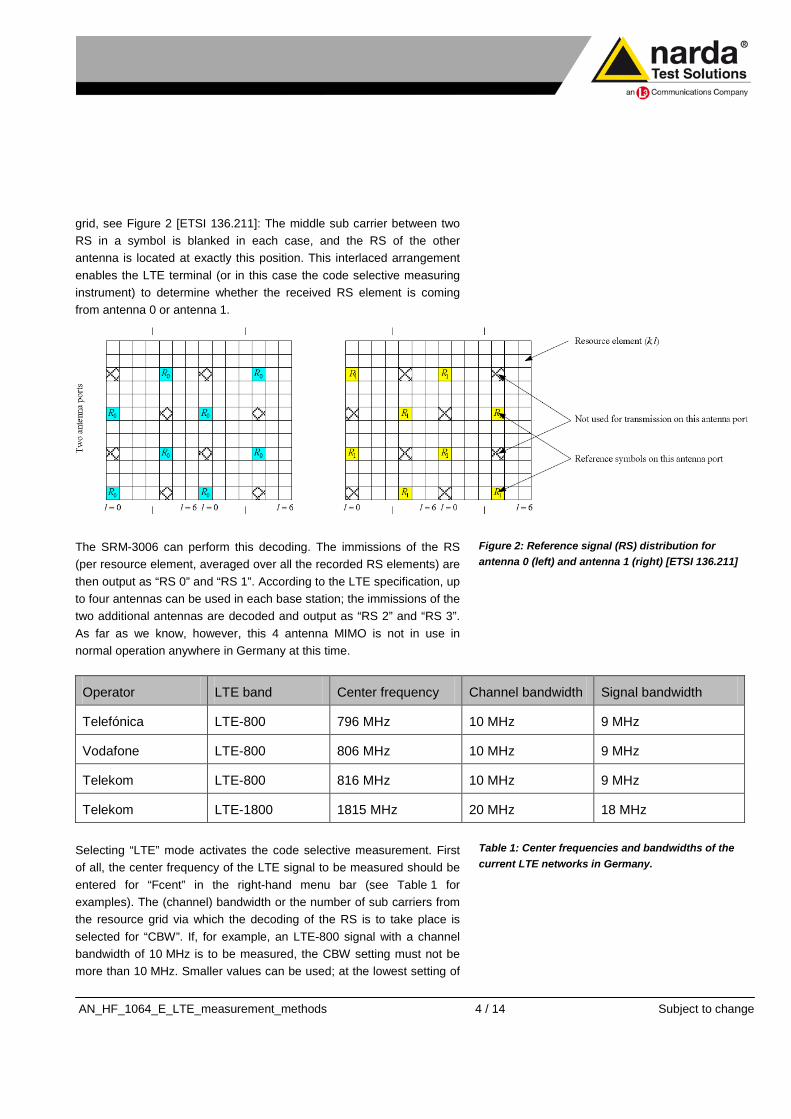
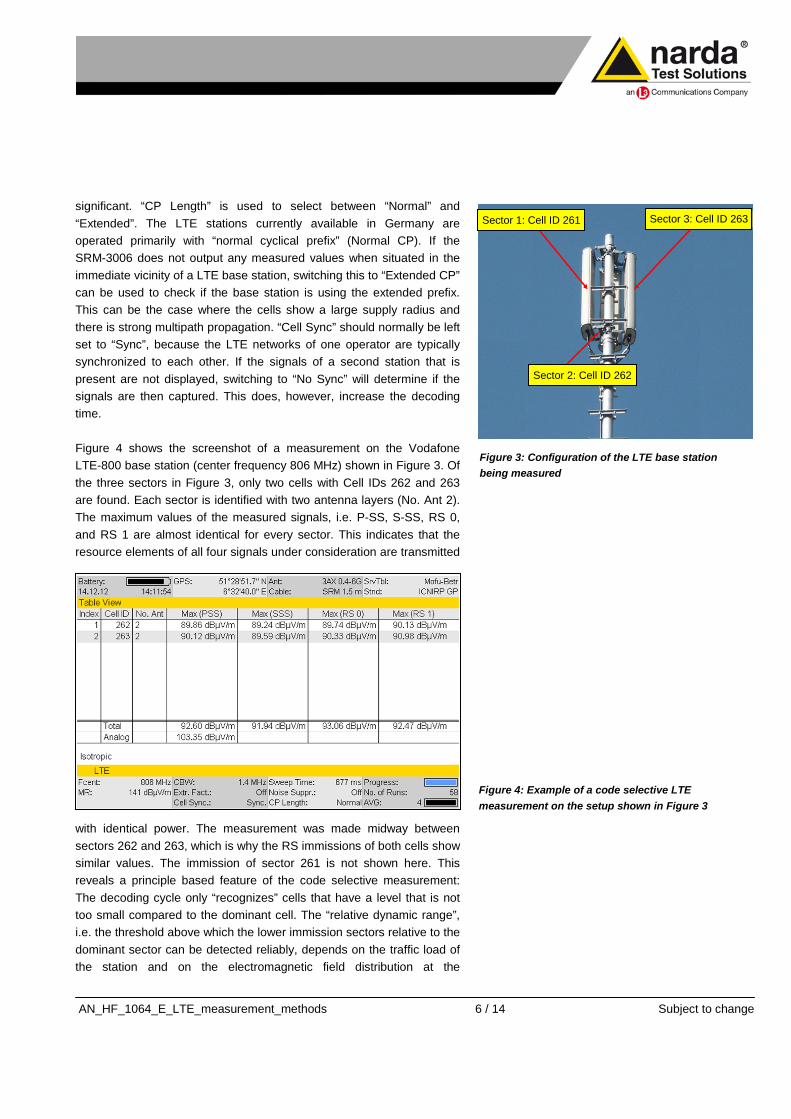
Figure 3: Configuration of the LTE base station being measured
Figure 4: Example of a code selective LTE measurement on the setup shown in Figure 3
significant. “CP Length” is used to select between “Normal” and “Extended”. The LTE stations currently available in Germany are operated primarily with “normal cyclical prefix” (Normal CP). If the SRM-3006 does not output any measured values when situated in the immediate vicinity of a LTE base station, switching this to “Extended CP” can be used to check if the base station is using the extended prefix. This can be the case where the cells show a large supply radius and there is strong multipath propagation. “Cell Sync” should normally be left set to “Sync”, because the LTE networks of one operator are typically synchronized to each other. If the signals of a second station that is present are not displayed, switching to “No Sync” will determine if the signals are then captured. This does, however, increase the decoding time. Figure 4 shows the screenshot of a measurement on the Vodafone LTE-800 base station (center frequency 806 MHz) shown in Figure 3. Of the three sectors in Figure 3, only two cells with Cell IDs 262 and 263 are found. Each sector is identified with two antenna layers (No. Ant 2). The maximum values of the measured signals, i.e. P-SS, S-SS, RS 0, and RS 1 are almost identical for every sector. This indicates that the resource elements of all four signals under consideration are transmitted
with identical power. The measurement was made midway between sectors 262 and 263, which is why the RS immissions of both cells show similar values. The immission of sector 261 is not shown here. This reveals a principle based feature of the code selective measurement: The decoding cycle only “recognizes” cells that have a level that is not too small compared to the dominant cell. The “relative dynamic range”, i.e. the threshold above which the lower immission sectors relative to the dominant sector can be detected reliably, depends on the traffic load of the station and on the electromagnetic field distribution at the
Sector 1: Cell ID 261 Sector 3: Cell ID 263
Sector 2: Cell ID 262

AN_HF_1064_E_LTE_measurement_methods 7 / 14 Subject to change
measurement point. This means that comparatively weak signals can be decoded if a spatial point where the actual dominant signal shows a local minimum due to interference or the radiation pattern of the base station antenna (e.g. in the side lobe region) is recorded. So, if a sector is not displayed by the SRM-3006, this usually does not mean that the sector was inactive at the time of the measurement. Since the code selective measurement only measures the power of one RS element averaged over the set CBW, the immission must be extrapolated to the highest operating load for the system. An extrapolation factor Ki is formed for each measured cell i, which takes the logarithmic power ratio between the maximum possible channel output power (or that requested from the regulatory authority) and the average power of a RS element into account:
Ki [dB] =10⋅ logPmax,i
PRS,i
(1)
The network operator must supply this information. In particular, the value PRS,i can be checked for plausibility relatively easily: If, for example, the maximum possible output power of a LTE-800 base station with 10 MHz channel bandwidth (9 MHz signal bandwidth) is 20 W, the power per resource element is 33.3 mW or 15.2 dBm assuming all resource elements of a symbol have the same power (9 MHz signal bandwidth corresponds to 600 RE or subcarriers per symbol at a carrier spacing of 15 kHz; 20 W / 600 = 33.3 mW). Some operators can configure the LTE stations so that the RS is “boosted” compared to the average power of the other RE, i.e. transmit at 18.2 dBm. This 3 dB increase is possible without reducing the power of the other RE, because the element between two RS is blanked (unoccupied) for 2-antenna MIMO, as shown in Figures 1 and 2. The “missing” power of this element can be used to increase the power of the transmitted RS. Thus it may be assumed for the purposes of a plausibility check that the RS level specified by the operator for a 10 MHz LTE signal with maximum channel output power of 20 Watt should be between 15.2 and 18.2 dBm. For example, the operator provided the following information for the measurement shown in Figure 4: “The maximum channel output power is 20 Watts, the power of a RS element is set to 15.2 dBm”. Equation 1 would give an extrapolation factor 20 W / 33.3 mW = 600 or 27.78 dB for the cells concerned. This factor is then linked with the measured RS immission of each cell (RS 0 und RS 1) according to equation 2:
Ei,max,antenna 0 [dBµV /m] = Ei,measured ,RS 0 [dBµV /m] + Ki [dB] (2a)
Ei,max,antenna 1 [dBµV /m] = Ei,measured ,RS1 [dBµV /m] + Ki [dB] (2b)

AN_HF_1064_E_LTE_measurement_methods 8 / 14 Subject to change
Figure 5: Example of automated evaluation of measurement data using Excel
As an example, for cell 262 this gives: Ei,max,antenna 0 = 117.52 dBµV/m and Ei,max,antenna 1 = 117.91 dBµV/m. The immission for cell i is the power sum of the immissions for antennas 0 and 1 for the relevant cell as given by equation 3:
Ei,max [V /m] = Ei,max,antenna 02 + Ei,max,antenna 1
2 (3)
In our example, the sum value is 1.09 V/m (the dBµV/m values must of course be converted to V/m values before summing the squares). Quadratic addition (equation 3) is not required if the “RS Sum” setting is selected with the “Signal” softkey rather than evaluating the immissions of RS 0 and RS 1 separately, as this calculates the total immission of antennas 0 and 1. Only this sum value then needs to be extrapolated using equation 2, taking the correction factor Ki into account. Next, the power sum of the immissions of all the cells found or measured is formed using equation 4.
Emax [V /m] = Ei,max2
i∑ (4)
This would give a total value of 1.61 V/m as the sum of the squares of 1.09 V/m for sector (cell) 262 and 1.18 V/m for sector 263 in this example. It is useful to use an Excel workbook that calculates the values automatically for this process. Calculation of the degree to which the limit values have been utilized according to the relevant immission protection regulations (26. BImSchV in this instance) can also be included in this workbook (see Figure 5).
1 2 3 4 5 6 7 8 9 10 Freq. in MHz / Cell_ID (LTE) /
RS
Operator Total LV in V/m
E (measured) in dBµV/m
Max immission factor (BNetzA)
Requested Emax in dBµV/m
Requested Emax in V/m
Requested Emax in %
of LV
Requested Smax in mW/m2
Requested Smax in % of
LV
MP 1 LTE
806/262/RS0 Vodafone 38.6 89.7 600 117.5 0.752 1.948 1.499 0.0379 806/262/RS1 Vodafone 38.6 90.1 600 117.9 0.786 2.037 1.640 0.0415 806/263/RS0 Vodafone 38.6 90.3 600 118.1 0.805 2.084 1.717 0.0434 806/263/RS1 Vodafone 38.6 91.0 600 118.8 0.867 2.246 1.994 0.0505
Total: 1.61 4.16 6.85 0.173

AN_HF_1064_E_LTE_measurement_methods 9 / 14 Subject to change
• Mode: LTE
• Fcent: Center frequency of LTE signal to be measured, see Table 1
• CBW Maximum setting equal to bandwidth of signal to be measured; CBW = 1.4 MHz for pendulum method
• Signal: Result display selection, at least RS 0/RS 1 or RS Sum
• Extrapolate to maximum state using information from the operator about the relationship between the maximum channel output power and the RS element output power
• Take the sum of the immissions of all cells measured
SRM-3006 settings and procedure for code selective LTE measurement
If the correction factors are the same for both cells, the extrapolation of equation 2 can be done internally by the SRM-3006. This is done by using the “Extrapolation Factor” softkey to enter the correction factor (without log transformation), i.e. 600 in the above example. All values (except “Analog”) are then displayed with the correction factor applied. If the immissions due to different LTE providers are measured in different frequency ranges, the total LTE immission can be determined by summing the squares of the separate immissions from each provider. The correct settings for the SRM-3006 for a code selective LTE measurement are shown opposite.

AN_HF_1064_E_LTE_measurement_methods 10 / 14 Subject to change
Spectral measurement Of all the signals contained in the resource grid (see Figure 1), the P-SS, S-SS, RS and PBCH signals or channels of LTE are radiated at a defined power level that is independent of the actual traffic load, making them suitable in principle for measuring the immission with subsequent extrapolation to the maximum operating state of the system. The simplest way to do this is to use the SRM-3006 to make a spectral immission measurement, which determines the immission within a frequency band defined by the resolution bandwidth RBW centered on the frequency defined by the center frequency setting. Since the Max-Hold function is activated during the pendulum procedure, the symbols with the greatest immissions will be displayed out of all symbols captured. These will not be the symbols with the RS where the traffic load is low, as these are not spread over all the sub carriers continuously, only occurring in every sixth sub carrier. If the RBW is limited to just the central part of the spectrum occupied by P-SS, S-SS (covering 62 RE per symbol, i.e. 930 kHz) or PBCH (72 RE per symbol, i.e. 1.08 MHz), then the result displayed will be the maximum of P-SS, S-SS and PBCH. Some systems currently in operation allow “boosting” of the power setting (EPRE, energy per resource element) for the REs of P-SS and S-SS, i.e. they have a higher EPRE than the other Res, so that the measurement then gives the maximum value of the immissions of P-SS / S-SS. The measurement is best made using “Level Recorder” mode of the SRM-3006. This mode is comparable to the “zero span” setting of conventional spectrum analyzers, where the analyzer does not sweep across a frequency range but is set to a fixed frequency and records all the immissions within the set bandwidth. The center frequency setting should correspond to the center frequency of the LTE signal to be measured (frequency data for the LTE networks currently operating in Germany is found in Table1). The values to be set for the resolution bandwidth (RBW) and video bandwidth (VBW) have been examined in detail in [KEL 11]. According to that work, a RBW value of 800 kHz is ideal, as this effects the best selection of the central part of the spectrum containing the constant power components P-SS, S-SS and PBCH. At the same time, a VBW of 2.5 kHz is recommended; this leads to the smallest measurement uncertainty but does require mathematical correction of the result. If a video bandwidth of 2 kHz is used, however, the measurement uncertainty is acceptable and the mathematical correction can be

AN_HF_1064_E_LTE_measurement_methods 11 / 14 Subject to change
Figure 6: Example of LTE measurement in “Level Recorder” mode
dispensed with. This apparently small value in comparison with conventional analyzers is due to the fact that the video filter in the SRM-3006 smoothes the signal, i.e. the brief power variations in the LTE signal caused by the modulation are smoothed out. This is necessary because an RMS (root mean square) evaluation of the signal has to be made according to the limit value regulations [ICNIRP 98]. The correct instrument settings for an example measurement of a Vodafone LTE-800 system are shown in Figure 6 highlighted by red circles. (Note: The measurement range MR should be selected according to the prevailing signal level conditions; the value of 141 dBµV/m in Figure 6 is not mandatory.)
The “Max” value shown under “Peak” is used for the further evaluation, this is 112.55 dBµV/m in the example above. The RMS display in contrast shows an average value of the power taken over a longer period of time (2.4 seconds in this case), which will always be less than the maximum value occurring in the observation period if the station is not operating at maximum traffic load. Since this measurement only measures the inner (traffic-independent) part of the spectrum, the next step is to extrapolate the measured value to the maximum operating load of the system, as it is possible in practice for all the resource elements in the resource grid to be occupied by data. This is done by applying a correction factor K, which results from the ratio of the signal bandwidth to the resolution bandwidth (or equivalent noise bandwidth). The bandwidth ratio for LTE can also be expressed as the ratio of the total number of frequency carriers to the number of carriers measured.

AN_HF_1064_E_LTE_measurement_methods 12 / 14 Subject to change
The equivalent noise bandwidth at a resolution bandwidth of 800 kHz is 768 kHz, i.e. the number n of carriers recorded if the carrier spacing is 15 kHz will be:
n = 768/15 – 1 = 50.2 (5)
The subtrahend (-1) takes into account the fact that carrier 0 is never used. The correction factor K can now be calculated simply from the number of carriers recorded, n, and the total number of carriers, N. For a LTE channel bandwidth of 10 MHz with 600 carriers, or 20 MHz with 1200 carriers, K is given by:
K = 10 log (N/n) = 10 log (600 / 50.2) = 10.8 dB (6a)
or
K = 10 log (N/n) = 10 log (1200 / 50.2) = 13,8 dB (6b)
The field strength at the maximum operating load is then:
Emax [dBµV /m] = Emeasured [dBµV /m] + K [dB] (7)
This would give a maximum immission value of 123.4 dBµV/m = 1.48 V/m for the measurement shown in Figure 6 (LTE-800 with 10 MHz channel bandwidth). However, this method of measurement and extrapolation can lead to an overestimation of the immission at maximum operational load if the measured signals are output by the base station at increased power compared with the average signal power; in other words: if they have been “boosted” by a corresponding factor. Using the procedure described above would assume that all the channels and signals are transmitted at the same boosted energy per resource element EPRE as the measured signal. Although this overestimation can be seen as an additional cushion in the risk when assessing the safety of LTE equipment by measurement, it can nevertheless be corrected by reducing the extrapolation factor described above by the boost factor of the measured signals. A correction may also be necessary if the measured signaling is not radiated in both antenna layers simultaneously. Information on whether and if so which signals or channels have been “boosted”, and to what degree, has to be obtained from the network operator. It should, however, be noted that the information about the EPRE values of the individual signals and channels can only be obtained from the operators under exceptional circumstances, if at all.
AN_HF_1064_E_LTE_measurement_methods 13 / 14 Subject to change
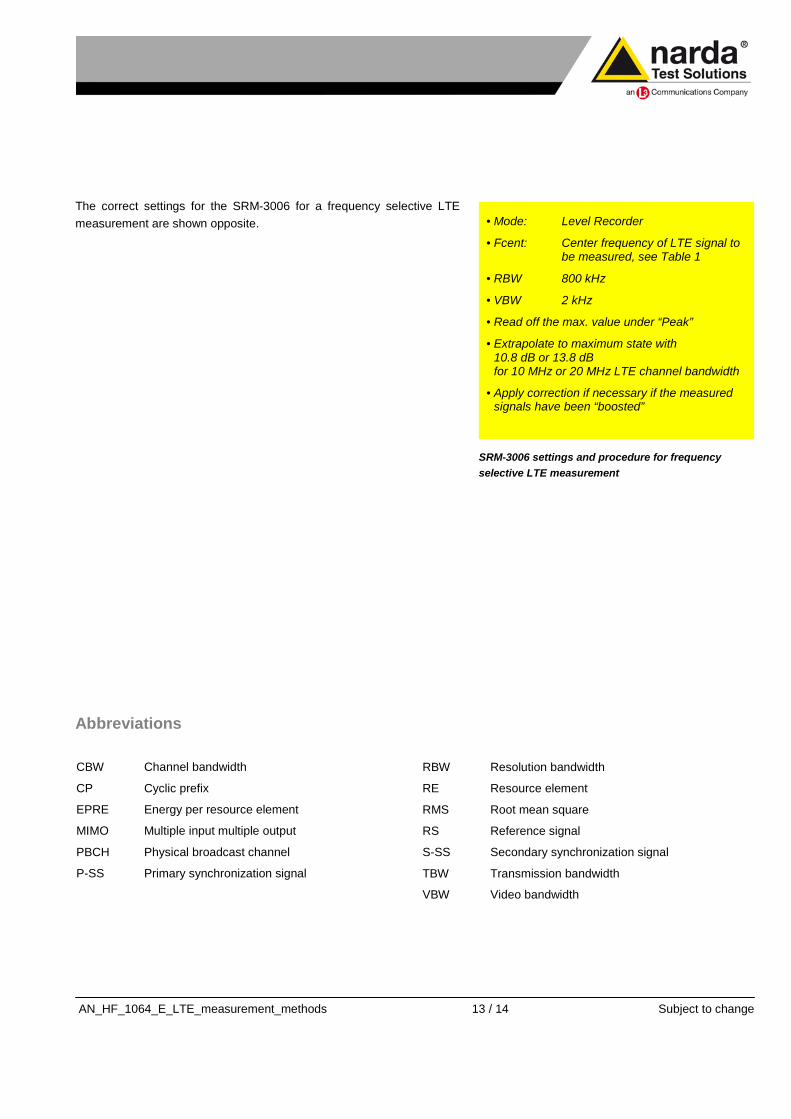
• Mode: Level Recorder
• Fcent: Center frequency of LTE signal to be measured, see Table 1
• RBW 800 kHz
• VBW 2 kHz
• Read off the max. value under “Peak”
• Extrapolate to maximum state with 10.8 dB or 13.8 dB for 10 MHz or 20 MHz LTE channel bandwidth
• Apply correction if necessary if the measured signals have been “boosted”
SRM-3006 settings and procedure for frequency selective LTE measurement
The correct settings for the SRM-3006 for a frequency selective LTE measurement are shown opposite. Abbreviations
CBW Channel bandwidth
CP Cyclic prefix
EPRE Energy per resource element
MIMO Multiple input multiple output
PBCH Physical broadcast channel
P-SS Primary synchronization signal
RBW Resolution bandwidth
RE Resource element
RMS Root mean square
RS Reference signal
S-SS Secondary synchronization signal
TBW Transmission bandwidth
VBW Video bandwidth
AN_HF_1064_E_LTE_Measurement_methods 14 / 14 Subject to change
Narda Safety Test Solutions GmbH Sandwiesenstrasse 7 72793 Pfullingen, Germany Phone: +49 7121-97 32-0 Fax: +49 7121-97 32-790 E-Mail: [email protected] www.narda-sts.de
Narda Safety Test Solutions 435 Moreland Road Hauppauge, NY 11788, USA Phone: +1 631 231-1700 Fax: +1 631 231-1711 E-Mail: [email protected] www.narda-sts.us
Narda Safety Test Solutions Srl Via Leonardo da Vinci, 21/23 20090 Segrate (Milano) - Italy Phone: +39 02 269987 1 Fax: +39 02 269987 00 E-mail: [email protected] www.narda-sts.it
® The name and logo are registered trademarks of Narda Safety Test Solutions GmbH and L-3 Communications Holdings, Inc. – Trade names are the trademarks of their respective owners.
Bibliography
[BOO] R. Booher, Modulation Fundamentals; Introduction to 3GPP LTE, RF Lecture Series, Verigy.
[BOR 13] Chr. Bornkessel, M. Schubert and M. Wuschek, Bestimmung der Exposition der allgemeinen
Bevölkerung durch neue Mobilfunktechniken, (Determining the radiation exposure of the general public
due to new mobile communications technology); Study commissioned by the Federal German Radiation
Protection Office, Final report, Kamp-Lintfort, (2013).
[ETSI 136.211] ETSI TS 136 211 V8.8.0, LTE; Evolved Universal Terrestrial Radio Access (E-UTRA);
Physical channels and modulation (3GPP TS 36.211 version 8.8.0 Release 8), 2009-10.
[ICNIRP 98] ICNIRP Guidelines, Guidelines for Limiting Exposure to Time-Varying Electric, Magnetic and
Electromagnetic Fields (up to 300 GHz), Health Physics, vol. 74 no. 4, S. 494-522, (1998).
[KEL 11] H. Keller, Bewertung rauschartiger Impulse moderner Kommunikationssysteme, NIR 2011 43
(Evaluating the noise-like impulses of modern communications systems). Annual meeting of the
Fachverband für Strahlenschutz e.V. (Radiation Protection Trade Association), 2011, S. 209-223.