IMEP-17 Trace and Minor Constituents · Dr G. Fortunato (EMPA) and Dr A. Uldall et al. (DEKS). 3...
39
EUROPEAN COMMISSION DIRECTORATE GENERAL JRC JOINT RESEARCH CENTRE IRMM Institute for Reference Materials and Measurements IRMM GE/R/IM/36/01 Isotope Measurements Unit September 2002 The International Measurement Evaluation Programme IMEP-17 Trace and Minor Constituents in Human Serum Certification Report U. Örnemark, * A. Uldall, † L. Van Nevel, Y. Aregbe, P.D.P. Taylor EUR 20243 EN European Commission - Joint Research Centre Institute for Reference Materials and Measurements (IRMM) Retieseweg, B-2440 GEEL (Belgium) * EQUALIS, Box 977, SE-751 09 Uppsala, Sweden † DEKS, 54M1, Herlev University Hospital, DK-2730 Herlev, Denmark
Transcript of IMEP-17 Trace and Minor Constituents · Dr G. Fortunato (EMPA) and Dr A. Uldall et al. (DEKS). 3...

EUROPEAN COMMISSION DIRECTORATE GENERAL JRC JOINT RESEARCH CENTRE IRMM Ins t i tu te fo r Re fe rence Mater ia ls and Measurements
IRMM GE/R/IM/36/01 Isotope Measurements Unit September 2002
The International Measurement Evaluation Programme
IMEP-17
Trace and Minor Constituents in Human Serum
Certification Report
U. Örnemark,* A. Uldall,† L. Van Nevel, Y. Aregbe, P.D.P. Taylor
EUR 20243 EN
European Commission - Joint Research Centre Institute for Reference Materials and Measurements (IRMM)
Retieseweg, B-2440 GEEL (Belgium)
* EQUALIS, Box 977, SE-751 09 Uppsala, Sweden † DEKS, 54M1, Herlev University Hospital, DK-2730 Herlev, Denmark

i
Introductory remarks concerning the terminology used in this report It has been the authors’ objective to use an internationally agreed terminology. This report, however, also contains some programme- and sector-specific terms. To simplify the running text, shorter forms of terms are used, e.g. ‘measurement uncertainty’ or ‘uncertainty’, rather than ‘uncertainty of measurement’. There is considerable confusion among many scientists on how the three terms ‘principle of measurement’, ‘method of measurement’, and ‘measurement procedure’ should be used. In this report we have chosen the following way of expressing the scientific work of the contributing institutes. Each institute has applied a ‘reference measurement procedure’. The outcome of that work is a ‘reference measurement procedure value’. From the information submitted, IRMM has established a certified ‘IMEP-17 reference value’, which serves as reference when the participants’ results in IMEP-17 are discussed. The term ‘principle’ is avoided and instead ‘method’ is used when the text refers to acronyms, such as IDMS and FAES. The term ’IMEP-17 reference value’ should not be confused with ‘reference value’ or ‘reference interval’ as used in laboratory medicine to describe biological variation. A ‘target value for uncertainty’ is a quantitative measure used to describe the quality of the reference measurement value that the institute is aiming for. It is based on fitness for purpose criteria. This term should not be mixed up with ‘target value’ often used in laboratory medicine to depict the ‘true value’. The term ‘component’ is synonymous to ‘analyte’ and ‘constituent’. The former term is recommended in laboratory medicine. It is used throughout the text for sake of consistency except in the project title, which was agreed on in 1999. A ‘measurand’ is the quantity subject to measurement. In the specification of the measurand, the quantity, the system and the unit must be described in detail’. α-amylase is designated amylase as the usual term used in laboratory medicine.

1
1. Introduction The Isotope Measurement (IM) unit of the Institute for Reference Materials and Measurements (IRMM) develops and performs reference measurements using primary methods, produces certified isotopic reference materials, and organises international measurement evaluation programmes in the nuclear and non-nuclear fields. The unit also provides training in these areas. The IRMM-International Measurement Evaluation Programme (IMEP) is a programme for interlaboratory comparisons (ILCs). The programme is open to all interested laboratories and full confidentiality is guaranteed with respect to the link between results and the participants’ identity. IMEP emphasises metrological aspects, such as traceability and measurement uncertainty [1]. Participating laboratories receive certified test samples (with undisclosed values), which are to be analysed using routine measurement procedures. The measurement results are displayed against “metrological’ reference values. The participants can assess the quality of their own results by comparing with the reference values and with results obtained by an international measurement community. The reference values should, whenever possible, be traceable to the SI. They are established by measurements at renowned and experienced institutes world-wide [2]. The programme supports quality assurance work at routine level and stresses, particularly, the educational aspect. In this way, IMEP complements the regular and sector-specific proficiency testing (PT) and external quality assessment (EQA) schemes. The test materials, the measurands and the participants vary. Detailed information on completed, on-going and scheduled comparisons can be found on the Internet [1].
1.1. IMEP-17 In July 1999, IRMM launched IMEP-17 as successor to IMEP-1, IMEP-4, IMEP-5 and IMEP-7 [1]. The initiative came from DEKS* that stressed the need for more reference measurement procedure values to support routine quality assurance (QA) work, e.g. in EQA schemes, in reference materials (RM) production, and in support of the EC directive 98/79/EC [3]. IRMM decided to finance the production of two serum materials. These were ready and approved end of 2000. Meanwhile, the ideas for the interlaboratory comparison were drawn up in collaboration with the C-AQ IFCC† and EQALM.‡ The increasing number of interlaboratory comparisons at higher metrological level during the 1990:s meant that it was now possible to include organic components in an IMEP comparison. Apart from the elements Ca, Cl, Cu, Fe, K, Li, Mg, Na, Se and Zn, also glucose, cholesterol, creatinine, urea, uric acid, thyroxine (T4), albumin, immunoglobuline G (IgG), amylase and γ-glutamyl transferase (γ-GT), were finally selected for IMEP-17. The
* Danish Institute for External Quality Assurance for Laboratories in the Health Sector. † Committee for Analytical Quality of the International Federation of Clinical Chemistry and Laboratory Medicine. ‡ European Committee for External Quality Assurance Programmes in Laboratory Medicine.
2
choice of the components was based on recommendations from the C-AQ IFCC, the needs of routine laboratories, and on the capability of National Metrology Institutes (NMIs) and Reference Measurement Laboratories (RMLs) to provide reference measurement procedure values. This report describes the IMEP-17 certification campaign.
1.2. Links between IMEP-17 and other metrological projects The serum materials produced for IMEP-17 have been used in several other international ILCs and studies. These include the pilot study CCQM-P14 on calcium [4], the key comparisons CCQM-K11 on glucose [5] and CCQM-K12 on creatinine [6], bilateral CCQM comparisons on cholesterol, and the Euromet Project 563 [7]. The outcome of these comparisons will be finally reported during 2002. The Nordic Committee for External Quality Assurance Programmes in Laboratory Medicine (NQLM) [8] has conducted a study where approximately 200 laboratories ran the IMEP-17 samples in parallel with three other serum calibrators and control materials. One objective is to transfer the accuracy of the IMEP-17 samples to the other materials.
2. Organisation of the certification work During the autumn of 2000, an inquiry was sent to sixteen institutes to obtain information about their existing methodology related to the IMEP-17 components, and to monitor their interest in contributing to the certification work. Twelve institutes in Europe, USA and Asia replied positively (Table 1). After evaluation, 69 assignments were distributed. The objective was to obtain two or three independent reference measurement procedure values for each component, from institutes with experience and a proven successful record in specific applications of primary or other internationally approved reference measurement procedures. One or more laboratories within the institutes in Table 1 have been involved in the certification work. The following staff are known to the authors to have contributed experimentally: Dr L. Siekmann, Dr G. Schumann and Dr W. Külpmann (DGKC), Dr J. Vogl et al. (BAM), Dr D. Schiel et al., and Dr A. Henrion et al. (PTB), Dr Z. Motian et al. (NRCCRM), Dr S.E. Long et al. and Dr M. Welch et al. (NIST), Dr P. Evans, Dr B. Fairman, Dr G. O'Connor, Mr P. Stokes and Mr J. Turner (LGC), Dr M. Berglund, Dr H. Ramebäck, Dr S. Kasemann, Dr J. Diemer, Mrs B. Sejerøe-Olsen and Dr P. Robouch (IRMM), Dr U. Örnemark (SP), Dr S.R. Park et al. (KRISS), Dr T. Walczyk et al. (ETH), Dr G. Fortunato (EMPA) and Dr A. Uldall et al. (DEKS).

3
Table 1. Institutes contributing to the certification work in IMEP-17. Acronym Name of institute and its location Contact
person(s) DGKC-
Bonn Deutsche Gesellschaft für Klinische Chemie e. V. Bonn, Germany
L. Siekmann
DGKC- Hannover
Deutsche Gesellschaft für Klinische Chemie e. V. Hannover, Germany
G. Schumann
W. Külpmann IRMM Institute for Reference Materials and Measurements
Geel, Belgium M. Berglund
P. Robouch
H. Schimmel NRCCRM National Research Centre for Certified Reference
Materials, Beijing, China Z. Motian
KRISS Korean Research Institute of Standards and Science Yusung Taejon, Korea
S.R. Park
PTB Physikalisch-Technische Bundesanstalt Braunschweig, Germany
D. Schiel
A. Henrion LGC Laboratory of the Government Chemist
Teddington, United Kingdom T. Catterick
ETH Eidgenössische Technische Hochschule, Zürich, Switzerland
T. Walczyk
BAM Bundesanstalt für Materialforschung und –Prüfung Berlin, Germany
J. Vogl
NIST National Institute of Standards and Technology Gaithersburg, USA
W. May
M. Welch EMPA Swiss Federal Laboratories for Materials Testing and
Research, St Gallen, Switzerland G. Fortunato
SP SP Swedish National Testing and Research Institute, Borås, Sweden§
U. Örnemark
§ Experimental work performed as visiting scientist at the IRMM.

4
3. Test materials
3.1. Production Two test materials (1 (DEKS identity FHK 004) and 2 (DEKS identity FHK 0012)) were prepared from pools (∼20 litres) of fresh human serum by DEKS Herlev University Hospital and Statens Seruminstitut (SSI), Copenhagen, Denmark under the responsibility of A. Uldall [9, 10, 11]. The original blood was collected from healthy patients following WHO recommendations. Each individual donor, as well as the final pools, were tested and found negative for HIV, Hepatitis B and Hepatitis C. The pool of Material 1 was left unmodified to resemble a normal patient serum. Material 2 was prepared by spiking the main pool of 20 litre of serum, and mixing it in a bottle with plenty of free space. In the spiking process, pure compounds and reagents were used (de-ionised water, hydrochloric acid, potassium hydroxide, creatinine, glucose, glycerol, lithium chloride, magnesium chloride hexa-hydrate, potassium chloride, urea, uric acid dissolved in 0.02M KOH, zinc chloride, amylase* and γ-GT) from bovine kidney.† The spiking was intended to achieve higher but still clinically relevant concentrations. Each pool was carefully mixed and sterile-filtered (0,22 µm) before transferring approximately 9,5 mL of serum into each of 2 200 polypropylene vials. The vials were closed with a Teflon-coated stopper and an outer metal seal, and stored at -80 °C.
3.2. Initial characterisation of the test materials
3.2.1. Homogeneity The homogeneity of the respective serum was assessed by determining the concentrations of seven components in 42 vials (Material 1) and 30 vials (Material 2). The precision was compared with that obtained from repeated analysis (n=12-20) of sera from pools of other materials with similar composition. Based on an F-test (P=0,01), no significant difference could be found in the case of Ca, Na, creatinine, glucose and Zn (Table 2).
Remark: The conclusion that the test material is sufficiently homogeneous for its intended use is mainly based on tests with routine clinical methods. These methods do not have the same high precision as most of the methods used in the certification work. However, results from this and other studies with, e.g. IDMS indicate that inhomogeneity does not constitute a significant source of uncertainty.
* EC number 3.2.1.1. from human saliva, 500 U (25 °C), cat. No. 10092 (“BioChemica” purity, 100 U/mg),
Sigma Aldrich. † γ-GT, EC number 2.3.2.2 from bovine kidney, 500 U (25 °C), cat. No., G4756 (grade 2 purity; 26 U/mg)
from Sigma-Aldrich.

5
Table 2. Summary of results from homogeneity study on the IMEP-17 serum materials.
Component Serum material 1 DEKS id. FHK 004
Serum material 2 DEKS id. FHK 0012
CV% CV% pool CV% CV% pool Ca 0,96 0,87 0,90 0,64 K 0,91 0,90 Li 0,68 0,70
Mg 0,70 0,63 Na 0,53 0,66 0,61 0,42 Zn 4,5 4,4 2,2 2,7
Glucose 2,0 1,2 1,2 1,1 Cholesterol 1,6 1,1 Creatinine 1,3 1,1 1,8 1,8
Urea 0,88 0,78 Uric acid 0,87 0,87
Thyroxine (T4) 0,87 0,56 Albumin 2,0 1,9
IgG 3,0 2,9 Amylase 2,8 3,2
γ-GT 1,5 1,4 Total protein 1,3 0,7 1,2 1,1
3.2.2. Stability Several previous studies by DEKS indicate that liquid sera in frozen state are stable for several months (at ≤ -20 °C) to many years (at ≤ -80 °C). The stability under higher temperature conditions was assessed by storing vials of Material 2 at 4 °C, room temperature, 30 °C and 37 °C. The concentrations of seventeen components were determined at five occasions over a period of one month and compared with those found in vials stored at -80 °C. All components, except amylase from 30 °C and glucose at 37 °C, were stable at all temperatures over the period. The two materials are also subject to an on-going long-term stability study (one year) at -80 °C and -135 °C.
3.2.3. Density The density at 22 °C for both materials was measured with a DA-110M density meter (Mettler-Toledo AG, Analytical, Schwerzenbach, Switzerland). Three vials of each material were examined. The density value 1,023(2) kg·L-1 is used in the conversion of reported results between amount contents (mol·kg-1) and amount concentrations (mol·L-1).
3.2.4. pH The pH of Material 1 is 7,52. The pH of Material 2 is 7,77, which is usual for serum where CO2 has escaped. This higher than normal pH occurred probably because a larger than usual mixing chamber was used in the production. The change of mixing chamber was due to indications of slight inhomogeneity when mixing spiked serum with the pool in a 22-litre

6
bottle.‡ An investigation by DEKS has shown that the higher than normal pH has an effect of +9 % on the albumin result in Vitros measuring systems [12]. The IMEP-17 participants are informed about this interference and can where possible, choose other methods.
4. Interactions with the institutes performing reference measurements
4.1. Sample distribution and deadline for reporting results The serum materials (Section 3) were available from the end of March 2001. They were distributed from IRMM on dry ice by courier or by airmail, together with instructions for storage. The deadline for reporting results was initially set to 15 July 2001. This was not possible to achieve mainly because of difficulties with shipping the serum materials to several countries. In addition, several institutes were conducting their measurements as part of CCQM projects with slightly different time schedules than for IMEP-17. The last participants received their samples in August and in December most results had been submitted. Three results were received and accepted after December 2001.
4.2. Instructions to the institutes Each institute received an information package that included: § An accompanying letter § Information about the measurands § Results from the initial characterisation of the test materials § Instructions and references concerning the evaluation of uncertainty § A material-specific form for reporting the results of the measurement assignment.
4.2.1. Accompanying letter The letter specified the assignment and pointed to its objectives. It also mentioned time-aspects and provided information about parallel studies on the test materials.
4.2.2. Information about the measurands in IMEP-17 A list of all components with indicative concentration levels and target values for the expanded (k=2) measurement uncertainty was given for each of the two materials. The target values were based mainly on proposed limits for “total analytical error’ [13].
‡ A first batch of serum (DEKS ID. FHK 007) of Material 2 was rejected due to indications of
inhomogeneity. Later studies, however, confirmed that the usually applied production procedure (vigorous mixing during 1 hour in a bottle of approximately 22 litre volume) was fit for purpose.

7
4.2.3. Results from the initial characterisation of the test materials The information on homogeneity, stability and density measurements, which was available at the time, was provided.
4.2.4. Instructions and references concerning the evaluation of uncertainty The instructions stressed the objective of the technical work and that the institutes were to use their primary or reference measurement procedures. The general approach in the guidelines from ISO et al. [14] and from Eurachem/CITAC [15] was summarised. The institutes were instructed to use this approach when evaluating the uncertainty.§ They were also asked to provide information about their measurement procedures [5]).
5. Reference measurements
5.1. Primary methods IMEP aims at establishing SI-traceable reference values through application of ‘primary methods of measurements’. The Consultative Committee for Amount of Substance (CCQM) of the International Committee for Weights and Measures (CIPM) defines these as methods having ‘the highest metrological qualities’ [5, 16]. The CCQM has recognised a handful of methods, including titrimetry, gravimetry, coulometry and isotope dilution mass spectrometry (IDMS), as having the potential to be primary. This recognition gives, by no means, automatically the ‘primary’ character to the results. It means that under specific circumstances, and when these methods are applied in the correct manner, they can lead to SI-traceable results with smallest combined uncertainties. For this reason, the IRMM always requests, apart from the uncertainty budget, a description of the measurement procedure in order to evaluate the quality of the reported data. IRMM collaborates with institutes that have developed expertise in the application of primary methods. Such methods cannot always be used and, therefore, other measurement procedures are also used when the IMEP reference values are established.
5.2. Applied measurements methods In Table 3 we have summarised the various measurement methods applied by the institutes for the respective component. The main features of some of the methods are given below.
5.2.1. Isotope dilution mass spectrometry (IDMS) IDMS is based on the measurement of isotope amount ratios. A known amount of sample with known isotopic composition of the element/compound is mixed with a material (spike) where the element/compound of interest is present in a different isotopic composition. Once isotopic homogeneity has been established for the mix (blend), minor losses in the subsequent sample preparation do not affect the result. The unknown concentration is evaluated from measurements of the induced blend ratio.
§ The CIPM guidelines for key comparisons (Appendix F to the Mutual recognition arrangement (MRA)
[5]) serves as another important source for institutes performing reference measurements

8
There are a number of different sample introduction and measuring systems available for IDMS. In this work, mass spectrometers equipped with thermal ionisation (TI) or inductively coupled plasma (ICP) sources were used for inorganic applications. Gas chromatography (GC) or liquid chromatography (LC) was used to separate organic components before the measurement.
5.2.2. Neutron activation analysis (NAA) NAA is based on gamma spectrometry measurements of samples irradiated with neutrons in a nuclear reactor. The capture of a neutron in a stable isotope may lead to the immediate emission of a γ-ray and the formation of a γ-emitter isotope to be monitored. Classical NAA is based on comparison of activities of the unknown sample and a known standard co-irradiated under similar conditions. This approach eliminates the need for accurate determination of neutron fluxes and detector calibration. The required measurements are the relative specific γ-emission of the activity products in the sample and in the standard, measured in the same counting position. The major drawback is the need of one standard per element concentration to be determined. The k0-standardisation NAA method allows the determination of elemental concentrations in the sample without the use of mono- or multi-element calibrators.
5.2.3. Radial immunodiffusion (RID) In radial immunodiffusion (RID), an antibody is added to a gel and poured into a plate. Wells are cut into the plate. Antigen (in sample or calibrator) is then added to the wells, and will diffuse out radially. If the antibody present is specific for the added antigen, a ring of precipitate is formed. The size of the ring is directly proportional to the concentration of the antigen. Samples and measurement standards are run at the same time and a calibration curve is created. Quantification according to ‘endpoint methods’ allows the reaction to go to completion. In kinetic methods, measurements are done before the zone of equivalence is reached. One institute applied RID to measurements of albumin and IgG. The experiments were performed on gel plates (Dade Behring, Marburg) with incorporated polyclonal antibodies. A certified reference material (BCR-470) was used for the calibration [17].
5.2.4. Gravimetry Gravimetric methods are based on the measurement of mass, and are grouped into two major types [18]. In ‘precipitation methods’, the component is converted to a sparingly soluble precipitate, which is then filtered, washed, and converted to a product of known composition by heat treatment. The product is finally weighed. In ‘volatilisation methods’, the component or its decomposition products are volatilised at a suitable temperature. The volatile product is collected and weighed, or alternatively the mass of the product is determined indirectly from the loss of mass of the sample.

9
The PTB has applied a gravimetric procedure described by NIST for the measurement of sodium [19]. In brief, the serum sample is first digested and then diluted before placed on a cation exchange resin. Sodium is isolated and precipitated as Na2SO4, which is heated at 900 °C to give a thermally stable product. Traces of sodium, eluting before (with lithium) and after (with potassium) the main fraction, were corrected for based on ICP-OES measurements.
5.2.5. Coulometry Coulometric methods are performed by measuring the quantity of electrical charge required to convert the component quantitatively to another oxidation state. Coulometric and gravimetric methods share the common advantage that the proportionality constant between the quantity measured and the component mass is derived from accurately known physical constants. This makes the use of measurement standard of the same quantity superfluous.
5.2.6. Titrimetry Titrimetry includes a group of methods that are based on measuring the amount of a reagent of known concentration that is consumed by the component. In ‘volumetric titrimetry’, the reagent is measured volumetrically. In ‘gravimetric titrimetry’, the mass of the reagent is measured. In coulometric titrimetry, the quantity of charge required to complete a reaction with the component is measured.
5.2.7. Enzymatic methods For the measurement of γ-GT and amylase, the DGKC applied standard operating procedures (SOPs) developed by the IFCC Committee for Reference Systems for Enzymes (CRSE).** The temperature in both cases was 37 °C. Both procedures are approved by the CRSE, and will undergo the IFCC ballot in 2002. Certified reference materials (CRMs) were used in connection with the measurements (IRMM/IFCC-452 for γ-GT and IRMM/IFCC-476) for amylase) [17]. In the case of amylase, the measurement is based on the following reaction:
lNitrophenoGlucosexOHxGPlNitropheny
xGPlNitrophenyGxGPEthylideneOHENMidaseGlua
amylase
−+− →+−−−−
−−−−+−− →+− 4)7()7(4
)7(46,4cos
2
2
ENM and GP correspond to 4,6-Ethylidene(G1)-4-nitrophenyl(G7)-α-(1->4)-D-maltoheptaoside (substrate) and α-(1->4)-D-glucopyranosyl respectively.
5.2.8. Flame atomic emission spectrometry (FAES) In FAES or ‘flame photometry’, a solution containing the component is converted to a mist and carried into a flame by a flow of gaseous oxidant or fuel. An emission spectrum is
** This committee recently changed name from “Calibration in Clinical Enzymology (CCCE).

10
generated in the hot gaseous medium. The concentration is directly proportional to the emitted intensity.
Table 3. Overview of methods applied by the institutes in the IMEP-17 certification campaign. Measured components are indicated with X for the respective material.
Component Material 1 Material 2 Measurement method(s) Ca X ID-ICP-MS, ID-TIMS Cl X IDMS, Coulometry Cu X X ID-ICP-MS, ID-TIMS Fe X ID-TIMS K X X ID-ICP-MS, FAES Li X ID-ICP-MS, ID-TIMS
Mg X X ID-ICP-MS Na X Gravimetry, FAES Se X NAA, ID-ICP-MS Zn X X ID-ICP-MS, ID-TIMS
Glucose X X ID-GCMS Cholesterol X ID-GCMS, ID-LCMS Creatinine X X ID-GCMS, ID-LCMS
Urea X X ID-GC-MS Uric acid X X ID-GC-MS
Thyroxine (T4) X ID-LC-MS Albumin X RID
IgG X RID Amylase X X IFCC reference method at 37 °C
γ-GT X X IFCC reference method at 37 °C
5.3. Assignment of property values – The certification process
5.3.1. Basic criteria Based on the reported reference measurement procedure values, the IRMM will assign an ‘IMEP-17 reference value’ to as many components as possible in the test materials. This is the actual certification process, which will lead to the issuing of a signed certificate. Each test material will then be referred to as a ‘certified test sample’. Because the materials have been produced for a specific purpose (an IMEP comparison) they are not labelled, provided or referred to as certified reference materials. The fact that an institute, which performs reference measurements for the IMEP, has a certain status or applies special methodology is, in itself, not sufficient. These institutes must provide detailed information about their experimental work (See Section 4.2). Such documentation is necessary in order to create confidence in the certified values. The institutes may also refer to other documents, e.g. publications, results from high-level interlaboratory comparisons, method validation studies to support their claims. Failure of providing sufficient information, entitles the IRMM to exclude data when calculating the certified value. In case the IRMM decides that there is not enough supportive information to establish a certified value for a specific component, this component may be excluded from
11
the certificate, or the certificate will clearly indicate that the numbers given are for information. Any queries related to the submitted results are handled through direct contacts between the institutes and IRMM. The institutes are informed about exclusion of results, and are able to check and comment on the report and certificates.
5.3.2. Discussion and re-examination of submitted data When two or more institutes have reported a reference measurement procedure value, the starting point for the evaluation has been that the values should agree within the respective stated expanded uncertainties. If this is not the case, the institutes have been notified about the situation and asked to check calculations and report back. Discrepancies are handled case by case, and any information about the measurement procedure and the uncertainty evaluation provided is taken into account.
5.3.3. Uncertainty of the IMEP-17 reference value Where two or more accepted reference measurement procedure values are available, the average is normally taken as the estimate of the value of the measurand. The associated uncertainty is calculated by combining the individually reported uncertainties. In case results do not agree within the stated uncertainties, an additional contribution is added that just covers the between-laboratory variation. All calculations are done using the software GUM Workbench [20]. To be fit for purpose, the uncertainty of the certified value must be significantly smaller (preferably by a factor of 5 to 10) than the range of data reported at routine level.

12
6. Results of the certification campaign
6.1. Overview of reported results The reference measurement procedure values obtained from measurements on the two test materials are grouped, and briefly commented on, component by component in tables below.†† In agreement with the institutes, the link between the result and the contributing institute is displayed. Each table contains the reported value(s) and uncertainty statement(s), the acronym for the measurement method, and the IMEP-17 reference value with its uncertainty. The uncertainties presented in the tables are expanded uncertainties (U=k·uc) with a coverage factor k equal to two. Results reported in volumetric units have been re-calculated based on the measured density at 22 °C. By December 2001, the twelve institutes had reported 64 results. A few results had first to be discussed in the frame of CCQM comparisons and were received later (Table 4). Only five out of 69 assignments could not be completed. Forty-eight uncertainty budgets from eleven institutes had been provided to support the measurements. Eight uncertainty budgets from two institutes did not contain a functional relationship. The majority of the reference measurement procedure values were obtained by applying IDMS in a primary way. Other international reference measurement procedures (IFCC methods), special techniques (NAA) and well validated clinical reference methods were also used.
Table 4. Overview of certification assignments in IMEP-17.
Institute Assignments Reported results
Uncertainty statements
DGKC-Bonn 5 5 5 DGKC-Hannover 10 10 10
IRMM 6 6 6 IRMM/SP 4 4 4 NRCCRM 3 3 3
KRISS 9 5 5 PTB 11 13 13 LGC 5 5 5 ETH 3 2 2 BAM 3 3 3 NIST 6 7 7
EMPA 4 4 4 Σ 69 67 67
†† Further details about the reference measurement procedures can be obtained from each contributing institute.

13
6.2. Inorganic components
6.2.1. Calcium Five IDMS results from four institutes are used. Two additional values exist. One is excluded since the reported uncertainty exceeds the set target value for uncertainty (2%). The result obtained by ICP-OES is suspected to be slightly biased (-2%) and omitted in the calculation of the reference value. The five IDMS results agree within the stated uncertainties. The results are linked to a CCQM pilot study on calcium [4].
Table 5. Reference measurement procedure values and IMEP-17 reference value for calcium in Material 1.
Institute Measurement method
Value (mol/kg)
Expanded uncertainty U, k=2 (mol/kg)
IRMM ID-TIMS 2,277 9·10-3 0,009 9·10-3
PTB ID-TIMS 2,285·10-3 0,015·10-3
LGC ICP-OES (2,226·10-3) (0,019·10-3)
BAM ID-TIMS 2,273·10-3 0,012·10-3
NIST-2 ID-TIMS 2,286 6·10-3 0,008 9·10-3
NIST-1 ID-ICP-MS 2,286 3·10-3 0,009 6·10-3
KRISS ID-ICP-MS (2,208·10-3) (0,088·10-3)
IMEP-17 reference value 2,281 8·10-3 0,005 0·10-3
Figure 1. Graphical display of reference measurement procedure values for calcium in Material 1.
6.2.2. Chloride Two institutes provided results for chloride in Material 1. At first, they did not agree within the stated uncertainties. The coulometric method was re-examined and new measurements
IMEP-17 certificationCa results, Material 1
PTB
NIST 2
NIST 1
IRMM
BAM
2,24
2,26
2,28
2,30
2,32
Laboratory
[Ca]
/(m
mo
l/kg
)

14
performed. The new results brought the two results closer by about 1%. The reason for the initial discrepancy has not been clarified but is believed to be associated with a certified reference material. The problem has been discussed among European EQA scheme organisers and some clinical reference measurement laboratories. The resulting uncertainty of the reference value is not entirely satisfactory. There seems to be a need to discuss, further, the various standards (matrix CRMs and pure compounds), which are available for this application. The PTB also applied a titrimetric procedure that gave results concordant with IDMS.
Table 6. Reference measurement procedure values and IMEP-17 reference value for chloride in Material 1
Institute Measurement method
Value (mol/kg)
Expanded uncertainty U, k=2 (mol/kg)
PTB ID-ICP-MS 0,101 20 0,000 80
DGKC-Hannover Coulometry 0,099 9 0,002 0 IMEP-17 reference value 0,100 6 0,001 1
Figure 2. Graphical display of reference measurement procedure values for chloride in Material 1.
6.2.3. Copper Four institutes measured copper in one or both materials resulting in three reference measurement procedure values for each material. One institute resubmitted its results after having discovered that an erroneous value for a molar mass had been used.
IMEP-17 certificationCl results, Material 1
PTB
DGKC
95
97
99
101
103
105
Laboratory
[Cl]
/(m
mo
l/kg
)

15
Table 7. Reference measurement procedure values and IMEP-17 reference value for copper in Material 1.
Institute Measurement method
Value (mol/kg)
Expanded uncertainty U, k=2 (mol/kg)
IRMM/SP ID-ICP-MS 17,18·10-6 0,11·10-6
NRCCRM ID-TIMS 17,02·10-6 0,16·10-6
EMPA ID-ICP-MS 17,33·10-6 0,20·10-6
IMEP-17 reference value 17,18·10-6 0,10·10-6
Figure 3. Graphical display of reference measurement procedure values for copper in Material 1.
IMEP-17 certificationCu results, Material 1
EMPAIRMM/SP
NRCCRM
16,6
16,8
17,0
17,2
17,4
17,6
17,8
Laboratory
[Cu
]/(µ
mo
l/kg
)

16
Table 8. Reference measurement procedure values and IMEP-17 reference value for copper in Material 2. Institute Measurement
method Value
(mol/kg) Expanded uncertainty
U, k=2 (mol/kg) IRMM/SP ID-ICP-MS 16,07·10-6 0,10·10-6
EMPA ID-ICP-MS 16,31·10-6 0,13·10-6
BAM ID-TIMS 15,95·10-6 0,28·10-6
IMEP-17 reference value 16,11·10-6 0,11·10-6
Figure 4. Graphical display of reference measurement procedure values for copper in Material 2.
6.2.4. Iron One institute has measured iron in Material 1. Some technical problems were observed during the measurements. Different spiking ratios gave slightly different results and the reason for the problem has not yet been fully explained.
Table 9. Reference measurement procedure value and IMEP-17 reference value for iron in Material 1.
Institute Measurement method
Value (mol/kg)
Expanded uncertainty U, k=2(mol/kg)
IRMM ID-TIMS 18,95·10-6 0,53·10-6
IMEP-17 reference value 18,95·10-6 0,53·10-6
IMEP-17 certificationCu results, Material 2
EMPA
IRMM/SP
BAM15,4
15,6
15,8
16,0
16,2
16,4
16,6
16,8
Laboratory
[Cu
]/(µ
mo
l/kg
)

17
6.2.5. Selenium Two institutes provided reference measurement procedure values for selenium in Material 1 with good agreement. Although the uncertainty is fairly large, the resulting IMEP-17 value is fit for purpose.
Table 10. Reference measurement procedure value and IMEP-17 reference value for selenium in Material 1.
Institute Measurement method
Value (mol/kg)
Expanded uncertainty U, k=2 (mol/kg)
IRMM NAA 0,997·10-6 0,050·10-6
LGC ID-ICP-MS 1,002·10-6 0,048·10-6
IMEP-17 reference value 1,000·10-6 0,034·10-6
Figure 5. Graphical display of reference measurement procedure values for selenium in Material 1.
IMEP-17 certificationSe results, Material 1
IRMM LGC
0,85
0,90
0,95
1,00
1,05
1,10
1,15
Laboratory
[Se]
/(µm
ol/k
g)

18
6.2.6. Zinc Three institutes measured zinc in one or both materials. The results from EMPA have been excluded in the calculation of the reference measurement procedure value due to a suspected positive bias larger than the reported uncertainty.
Table 11. Reference measurement procedure value and IMEP-17 reference value for zinc in Material 1.
Institute Measurement method
Value (mol/kg)
Expanded uncertainty U, k=2 (mol/kg)
NRCCRM ID-TIMS 15,65·10-6 0,13·10-6
BAM ID-TIMS 16,25·10-6 0,67·10-6
EMPA ID-ICP-MS (17,31·10-6) (0,36·10-6)
IMEP-17 reference value 15,95·10-6 0,34·10-6
Figure 6. Graphical display of reference measurement procedure values for zinc in Material 1.
IMEP-17 certificationZn results, Material 1
NRCCRM
BAM
15,0
15,5
16,0
16,5
17,0
17,5
18,0
Laboratory
[Zn
]/(µ
mo
l/kg
)

19
Table 12. Reference measurement procedure value and IMEP-17 reference value for zinc in Material 2.
Institute Measurement method
Value (mol/kg)
Expanded uncertainty U, k=2 (mol/kg)
BAM ID-TIMS 28,99·10-6 0,28·10-6
NRCCRM ID-TIMS 28,45·10-6 0,14·10-6
EMPA ID-ICP-MS (32,68·10-6) (0,91·10-6)
IMEP-17 reference value 28,72·10-6 0,28·10-6
Figure 7. Graphical display of reference measurement procedure values for zinc in Material 2.
IMEP-17 certificationZn results, Material 2
BAM
NRCCRM
27,8
28,2
28,6
29,0
29,4
29,8
Laboratory
[Zn
]/(µ
mo
l/kg
)

20
6.2.7. Potassium Two institutes measured potassium in the two materials with good agreement but with large differences in uncertainty. Since the routine interlaboratory variation of potassium results is only a few per cent, the IDMS value is chosen as the IMEP-17 reference value. The good agreement between IDMS and FAES is however satisfactory. The PTB also applied an ion chromatographic procedure with concordant results.
Table 13. Reference measurement procedure value and IMEP-17 reference value for potassium in Material 1.
Institute Measurement method
Value (mol/kg)
Expanded uncertainty U, k=2 (mol/kg)
PTB ID-ICP-MS 3,651·10-3 0,019·10-3 DGKC-
Hannover FAES 3,62·10-3 0,13·10-3
IMEP-17 reference value 3,651·10-3 0,019·10-3
Figure 8. Graphical display of reference measurement procedure values for potassium in Material 1.
IMEP-17 certificationK results, Material 1
PTB
DGKC3,40
3,50
3,60
3,70
3,80
3,90
Laboratory
[K]/
(mm
ol/k
g)

21
Table 14. Reference measurement procedure values and IMEP-17 reference value for potassium in Material 2.
Institute Measurement method
Value (mol/kg)
Expanded uncertainty U, k=2 (mol/kg)
PTB ID-ICP-MS 5,598·10-3 0,028·10-3 DGKC
Hannover FAES 5,57·10-3 0,13·10-3
IMEP-17 reference value 5,598·10-3 0,028·10-3
Figure 9. Graphical display of reference measurement procedure values for potassium in Material 2.
IMEP-17 certificationK results, Material 2
DGKC
PTB
5,30
5,40
5,50
5,60
5,70
5,80
5,90
Laboratory
[K]/
(mm
ol/k
g)

22
6.2.8. Magnesium Results from three institutes were provided for magnesium in the two materials. The results from ETH were excluded since they in both cases are suspected to have a negative bias larger than the reported uncertainty. The calibration material used by ETH, a commercial Mg solution, is not as well characterised as the materials used by IRMM/SP and PTB. The PTB also applied an ion chromatographic procedure with concordant results.
Table 15. Reference measurement procedure values and IMEP-17 reference value for magnesium in Material 1.
Institute Measurement method
Value (mol/kg)
Expanded uncertainty U, k=2 (mol/kg)
IRMM/SP ID-ICP-MS 0,790 0·10-3 0,006 8·10-3
PTB ID-ICP-MS 0,798 0·10-3 0,008 0·10-3
ETH ID-TIMS (0,757·10-3) (0,015·10-3)
IMEP-17 reference value 0,794 0·10-3 0,005 2·10-3
Figure 10. Graphical display of reference measurement procedure values for magnesium in Material 1.
IMEP-17 certificationMg results, Material 1
IRMM/SP
PTB
0,760
0,770
0,780
0,790
0,800
0,810
0,820
Laboratory
[Mg
]/(m
mo
l/kg
)
23
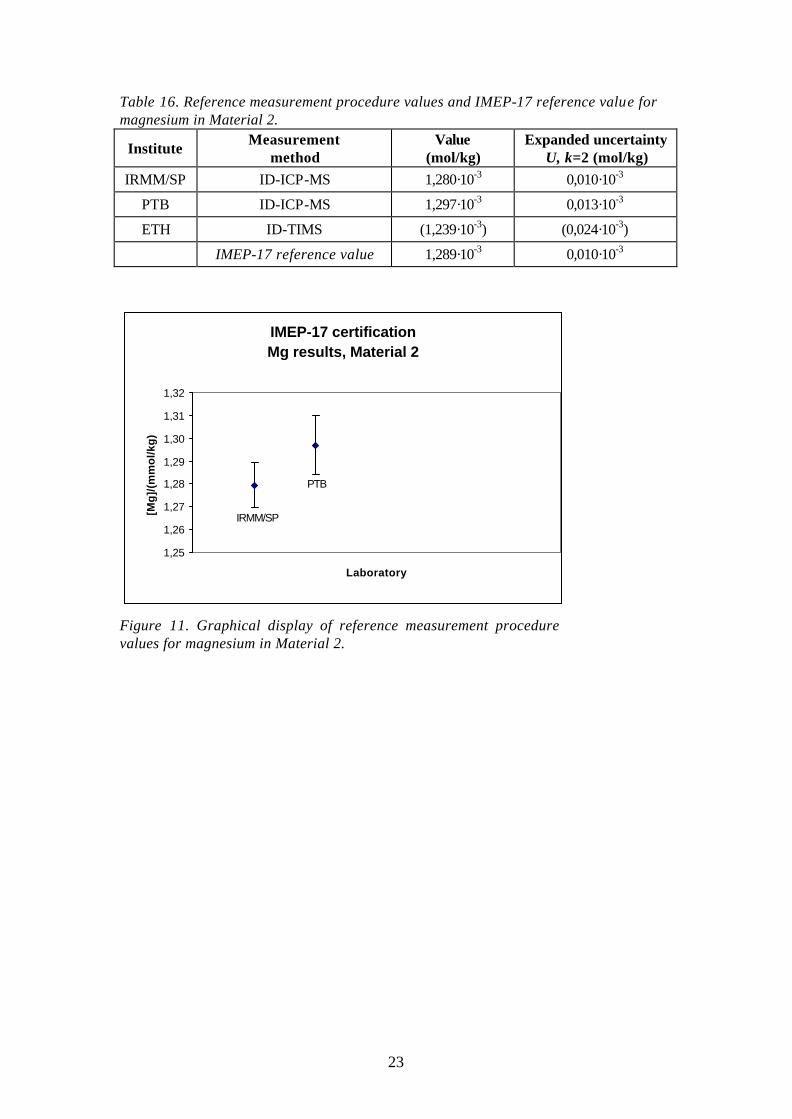
Table 16. Reference measurement procedure values and IMEP-17 reference value for magnesium in Material 2.
Institute Measurement method
Value (mol/kg)
Expanded uncertainty U, k=2 (mol/kg)
IRMM/SP ID-ICP-MS 1,280·10-3 0,010·10-3
PTB ID-ICP-MS 1,297·10-3 0,013·10-3
ETH ID-TIMS (1,239·10-3) (0,024·10-3)
IMEP-17 reference value 1,289·10-3 0,010·10-3
Figure 11. Graphical display of reference measurement procedure values for magnesium in Material 2.
IMEP-17 certificationMg results, Material 2
IRMM/SP
PTB
1,25
1,26
1,27
1,28
1,29
1,30
1,31
1,32
Laboratory
[Mg
]/(m
mo
l/kg
)

24
6.2.9. Lithium Lithium was measured only in Material 2. Results from two institutes, established with primary methods, were provided. The PTB also applied an ion chromatographic procedure with concordant results.
Table 17. Reference measurement procedure values and IMEP-17 reference value for lithium in Material 2.
Institute Measurement method
Value (mol/kg)
Expanded uncertainty U, k=2 (mol/kg)
IRMM ID-TIMS 0,882 1·10-3 0,007 4·10-3
PTB ID-ICP-MS 0,887·10-3 0,012·10-3
IMEP-17 reference value 0,884 6·10-3 0,007 0·10-3
Figure 12. Graphical display of reference measurement procedure values for lithium in Material 2.
IMEP-17 certificationLi results, Material 2
IRMM PTB
0,860
0,870
0,880
0,890
0,900
0,910
Laboratory
[Li]
/(m
mo
l/kg
)
25
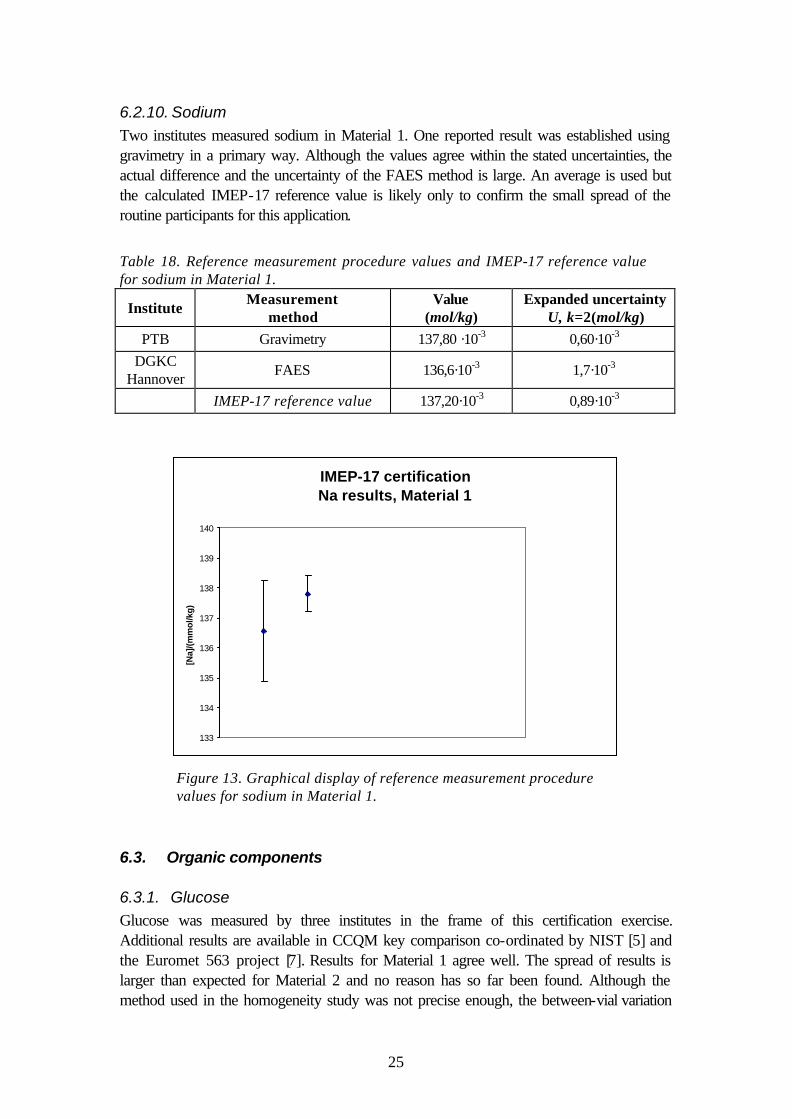
6.2.10. Sodium Two institutes measured sodium in Material 1. One reported result was established using gravimetry in a primary way. Although the values agree within the stated uncertainties, the actual difference and the uncertainty of the FAES method is large. An average is used but the calculated IMEP-17 reference value is likely only to confirm the small spread of the routine participants for this application.
Table 18. Reference measurement procedure values and IMEP-17 reference value for sodium in Material 1.
Institute Measurement method
Value (mol/kg)
Expanded uncertainty U, k=2(mol/kg)
PTB Gravimetry 137,80 ·10-3 0,60·10-3 DGKC
Hannover FAES 136,6·10-3 1,7·10-3
IMEP-17 reference value 137,20·10-3 0,89·10-3
IMEP-17 certificationNa results, Material 1
133
134
135
136
137
138
139
140
[Na]
/(mm
ol/k
g)
Figure 13. Graphical display of reference measurement procedure values for sodium in Material 1.
6.3. Organic components
6.3.1. Glucose Glucose was measured by three institutes in the frame of this certification exercise. Additional results are available in CCQM key comparison co-ordinated by NIST [5] and the Euromet 563 project [7]. Results for Material 1 agree well. The spread of results is larger than expected for Material 2 and no reason has so far been found. Although the method used in the homogeneity study was not precise enough, the between-vial variation

26
for measurements at the various institutes do not indicate that the homogeneity is larger for Material 2.
Table 19. Reference measurement procedure values and IMEP-17 reference value for glucose in Material 1.
Institute Measurement method
Value (mol/kg)
Expanded uncertainty U, k=2(mol/kg)
KRISS ID-GCMS 4,303·10-3 0,061·10-3
PTB ID-GCMS 4,304·10-3 0,054·10-3
NIST ID-GCMS 4,330·10-3 0,045·10-3
IMEP-17 reference value 4,312·10-3 0,031·10-3
Figure 14. Graphical display of reference measurement procedure values for glucose in Material 1.
IMEP-17 certificationGlucose results, Material 1
KRISS
NIST
PTB
4,15
4,20
4,25
4,30
4,35
4,40
4,45
Laboratory
[Glu
cose
]/(m
mo
l/kg
)

27
Table 20 Reference measurement procedure values and IMEP-17 reference value for glucose in Material 2.
Institute Measurement method
Value (mol/kg)
Expanded uncertainty U, k=2(mol/kg)
KRISS ID-GCMS 8,08·10-3 0,14·10-3
PTB ID-GCMS 8,404·10-3 0,085·10-3
NIST ID-GCMS 8,184·10-3 0,085·10-3
IMEP-17 reference value 8,22·10-3 0,17·10-3
Figure 15. Graphical display of reference measurement procedure values for glucose in Material 2.
IMEP-17 certificationGlucose results, Material 2
NIST
KRISS
PTB
7,8
7,9
8,0
8,1
8,2
8,3
8,4
8,5
8,6
Laboratory
[Glu
cose
]/(m
mo
l/kg
)

28
6.3.2. Cholesterol Measurements of cholesterol with primary methods are well established. The CCQM has already conducted a key comparison [5]. Recently other CCQM members took part in bilateral studies on cholesterol with the samples for IMEP-17. The three results obtained in the frame of this certification exercise agree well.
Table 21. Reference measurement procedure values and IMEP-17 reference value for cholesterol in Material 1.
Institute Measurement method
Value (mol/kg)
Expanded uncertainty U, k=2(mol/kg)
PTB ID-GCMS 4,968·10-3 0,050·10-3
LGC ID-LCMS 5,022·10-3 0,012·10-3
NIST ID-GCMS 4,997·10-3 0,017·10-3
IMEP-17 reference value 4,996·10-3 0,018·10-3
Figure 16. Graphical display of reference measurement procedure values for cholesterol in Material 1.
IMEP-17 certificationCholesterol results, Material 1
PTB
LGC
NIST
4,85
4,90
4,95
5,00
5,05
5,10
5,15
Laboratory
[Ch
ole
ster
ol]
/(m
mo
l/kg
)

29
6.3.3. Creatinine Measurements of creatinine with primary methods are well established. The CCQM has already conducted a successful pilot study, and the results reported here were part of the key comparison. The procedure applied by IRMM had been adapted from DGKC protocols, and this was the first time IRMM used it in a certification exercise.
Table 22. Reference measurement procedure values and IMEP-17 reference value for creatinine in Material 1.
Institute Measurement Method
Value (mol/kg)
Expanded uncertainty U, k=2(mol/kg)
KRISS ID-LCMS 72,4·10-6 1,4·10-6
LGC ID-LCMS 72,43·10-6 0,28·10-6
PTB ID-GCMS 72,62·10-6 0,88·10-6
NIST ID-GCMS 73,17·10-6 0,90·10-6
IRMM ID-GCMS 73,9·10-6 1,9·10-6
IMEP-17 reference value 72,90·10-6 0,53·10-6
Figure 17. Graphical display of reference measurement procedure values for creatinine in Material 1.
IMEP-17 certificationCreatinine results, Material 1
KRISS
LGC PTBNIST IRMM
70
71
72
73
74
75
76
77
Laboratory
[Cre
atin
ine]
/(µm
ol/k
g)
30
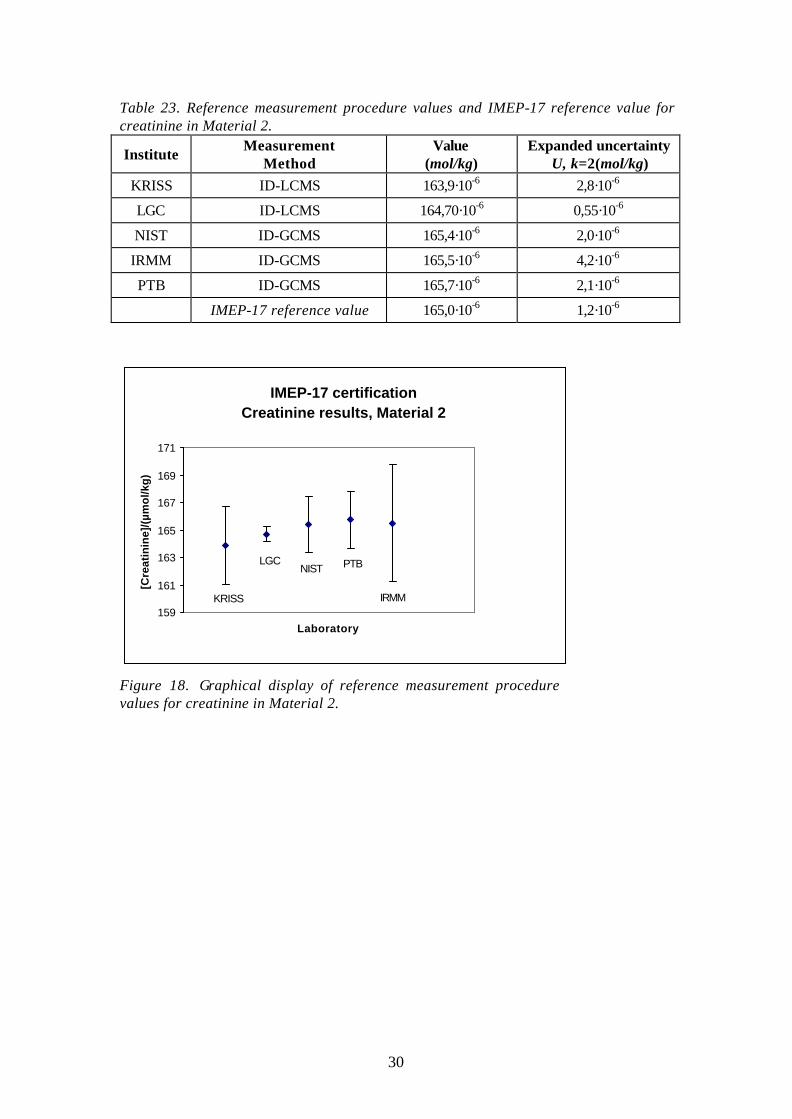
Table 23. Reference measurement procedure values and IMEP-17 reference value for creatinine in Material 2.
Institute Measurement Method
Value (mol/kg)
Expanded uncertainty U, k=2(mol/kg)
KRISS ID-LCMS 163,9·10-6 2,8·10-6
LGC ID-LCMS 164,70·10-6 0,55·10-6
NIST ID-GCMS 165,4·10-6 2,0·10-6
IRMM ID-GCMS 165,5·10-6 4,2·10-6
PTB ID-GCMS 165,7·10-6 2,1·10-6
IMEP-17 reference value 165,0·10-6 1,2·10-6
Figure 18. Graphical display of reference measurement procedure values for creatinine in Material 2.
IMEP-17 certificationCreatinine results, Material 2
KRISS
LGCNIST PTB
IRMM159
161
163
165
167
169
171
Laboratory
[Cre
atin
ine]
/(µm
ol/k
g)

31
6.3.4. Urea, uric acid, thyroxine (T4), albumin, amylase, IgG and γ-GT For these components only one reference measurement procedure value from either of the two DGKC laboratories is available (Table 24 and Table 25). ID-GC-MS was applied for urea and uric acid. ID-LC-MS was applied for thyroxine (T4). RID was used in the measurement of albumin and IgG, and enzymatic methods were applied in the determination of amylase and γ-GT according to Section 5.2.7. The values were reported in concentration units and have been recalculated in the two tables below.
Table 24. Reference measurement procedure values for urea, uric acid, thyroxine (T4), albumin, amylase, IgG and γ-GT in Material 1.
Institute Component
Reference measurement
procedure value
Expanded uncertainty
U, k=2 Unit
DGKC-Bonn Urea 4,665·10-3 0,048·10-3 mol/kg
DGKC-Bonn Thyroxine (T4) 95,4·10-9 1,3·10-9 mol/kg
DGKC-Bonn Uric acid 302,0·10-6 5,6·10-6 mol/kg DGKC-
Hannover γ-GT 33,92 0,91 U/kg
DGKC- Hannover Amylase 55,5 2,5 U/kg
DGKC- Hannover Albumin 40,6 2,7 g/kg
DGKC- Hannover IgG 10,23 0,47 g/kg
Table 25. Reference measurement procedure values for urea, uric acid, amylase and γ-GT in Material 2.
Institute Component
Reference measurement
procedure value
Expanded uncertainty
U, k=2 Unit
DGKC-Bonn Urea 9,85·10-3 0,13·10-3 mol/kg
DGKC-Bonn Uric acid 530·10-6 16·10-6 mol/kg DGKC
Hannover γ-GT 71,1 1,8 U/kg
DGKC Hannover Amylase 86,4 3,8 U/kg

32
7. Summary and conclusions The outcome of the certification campaign for IMEP-17 is summarised in Table 26 and Table 27. The IMEP-17 reference values are also reported in units commonly used in routine laboratory medicine (Table 28 and Table 29). These units will be used in the graphical display of IMEP-17 that will be included in the report to the participants. The choice of units is based on the method coding system developed by Labquality (Finland) [21]. The conversion from amount content or mass fractions is based on the measured density at 22 °C (Section 3.2.3). The conversion takes into account the uncertainty of the measured density except in the case where a single institute submitted results in volumetric units. The overall result for the twenty components is very satisfactory. It proves that NMIs and RMLs, in only a few years, have acquired sufficient competence with reference measurement procedures to support routine laboratories. In recent years, IRMM has offered the test materials from IMEP comparisons for use in parallel comparisons. This has been done in collaboration with regional and international metrology organisations (Euromet and CCQM) and accreditation bodies (EA). This is done also in IMEP-17 (Section 1.2) and has several advantages. It makes an efficient use of expensive test materials, and contributes to the establishment of an international measurement infrastructure. Where possible, future certification campaigns should also be linked to production of certified RMs. The idea was discussed in the beginning of this project but the production facilities did not allow larger serum volumes. A few hundred sets of samples do however remain. These will be used to support routine laboratories or institutes developing reference measurement procedures the next few years. Tables 26-29 constitute the basis for the certificates that will be issued by IRMM as a product of this work [22-23]. This report and the certificates will be distributed to all IMEP-17 co-ordinators and displayed on www.imep.ws.
Acknowledgement-We are very grateful to Mrs C. Harper, Mrs M. De Smet and Mrs P. Smeyers (IRMM) for their logistic and secretarial assistance throughout the certification campaign, and to all staff at the institutes who contributed to the reference measurements.

33
Table 26. IMEP-17 reference values for components in serum material 1, expressed as amount-of-substance content, mass fraction or catalytic activity content. For amylase and γ-GT, the coverage factor required to obtain a 95% confidence interval is 2,8.
Component Unit IMEP-17 reference value
Expanded uncertainty U, k=2
Ca mol/kg 2,281 8·10-3 0,005 0·10-3
Cl mol/kg 0,100 6 0,001 1
Cu mol/kg 17,18·10-6 0,10·10-6
Fe mol/kg 18,95·10-6 0,53·10-6
K mol/kg 3,651·10-3 0,019·10-3
Mg mol/kg 0,794 0·10-3 0,005 2·10-3
Na mol/kg 137,20·10-3 0,89·10-3
Se mol/kg 1,000·10-6 0,034·10-6
Zn mol/kg 15,95·10-6 0,34·10-6
Glucose mol/kg 4,312·10-3 0,031·10-3
Cholesterol mol/kg 4,996·10-3 0,018·10-3
Creatinine mol/kg 72,90·10-6 0,53·10-6
Urea mol/kg 4,665·10-3 0,048·10-3
Uric acid mol/kg 302,0·10-6 5,6·10-6
Thyroxine (T4) mol/kg 95,4·10-9 1,3·10-9
Albumin g/kg 40,6 2,7
IgG g/kg 10,23 0,47
Amylase U/kg 55,5 2,5
γ-GT U/kg 33,92 0,91
34
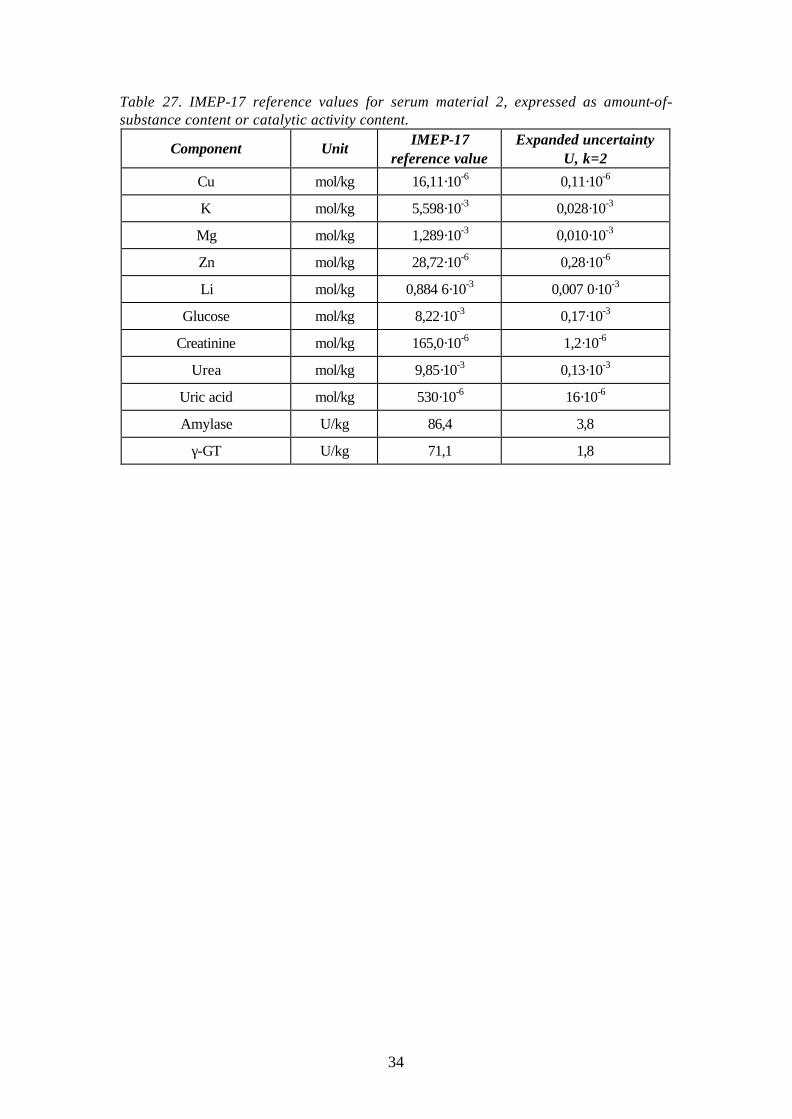
Table 27. IMEP-17 reference values for serum material 2, expressed as amount-of-substance content or catalytic activity content.
Component Unit IMEP-17 reference value
Expanded uncertainty U, k=2
Cu mol/kg 16,11·10-6 0,11·10-6
K mol/kg 5,598·10-3 0,028·10-3
Mg mol/kg 1,289·10-3 0,010·10-3
Zn mol/kg 28,72·10-6 0,28·10-6
Li mol/kg 0,884 6·10-3 0,007 0·10-3
Glucose mol/kg 8,22·10-3 0,17·10-3
Creatinine mol/kg 165,0·10-6 1,2·10-6
Urea mol/kg 9,85·10-3 0,13·10-3
Uric acid mol/kg 530·10-6 16·10-6
Amylase U/kg 86,4 3,8
γ-GT U/kg 71,1 1,8

35
Table 28. IMEP-17 reference values for serum material 1, expressed as amount-of-substance concentration, mass concentrations or catalytic activity concentration. For amylase and γ-GT, the coverage factor required to obtain a 95% confidence interval is 2,8.
Component Unit IMEP-17 reference value
Expanded uncertainty U, k=2
Ca mmol/L 2,334 2 0,006 9
Cl mmol/L 102,9 1,1
Cu µmol/L 17,57 0,10
Fe µmol/L 19,39 0,54
K mmol/L 3,735 0,021
Mg mmol/L 0,812 3 0,005 6
Na mmol/L 140,36 0,95
Se µmol/L 1,022 0,035
Zn µmol/L 16,32 0,35
Glucose mmol/L 4,412 0,033
Cholesterol mmol/L 5,111 0,021
Creatinine µmol/L 74,57 0,57
Urea mmol/L 4,772 0,049
Uric acid µmol/L 308,9 5,7
Thyroxine (T4) nmol/L 97,6 1,3
Albumin g/L 41,5 2,7
IgG g/L 10,47 0,48
Amylase U/L 56,8 2,6
γ-GT U/L 34,70 0,93

36
Table 29. IMEP-17 reference values for components in serum material 2, expressed as amount-of-substance concentration, mass concentration or catalytic activity concentration.
Component Unit IMEP-17 reference value
Expanded uncertainty U, k=2
Cu µmol/L 16,48 0,12
K mmol/L 5,727 0,031
Mg mmol/L 1,318 0,010
Zn µmol/L 29,38 0,29
Li mmol/L 0,904 9 0,007 4
Glucose mmol/L 8,41 0,18
Creatinine µmol/L 168,8 1,3
Urea mmol/L 10,08 0,13
Uric acid µmol/L 542 16
Amylase U/L 88,4 3,9
γ-GT U/L 72,7 1,9
37
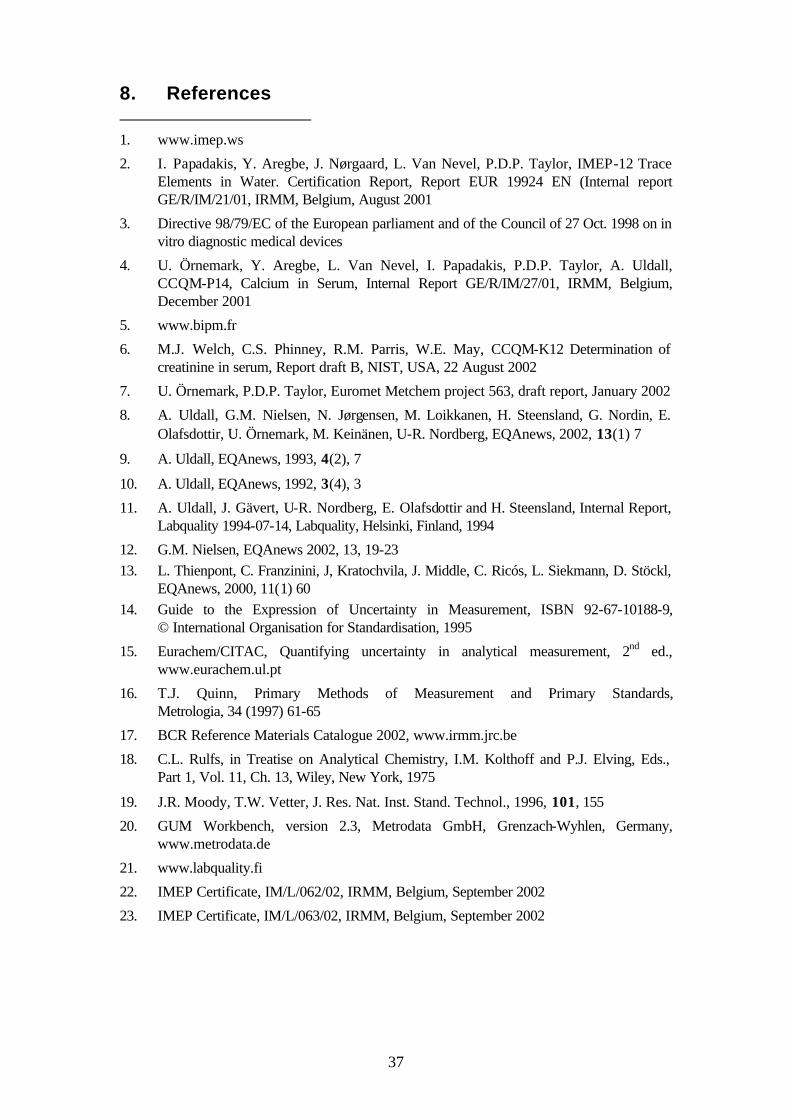
8. References 1. www.imep.ws
2. I. Papadakis, Y. Aregbe, J. Nørgaard, L. Van Nevel, P.D.P. Taylor, IMEP-12 Trace Elements in Water. Certification Report, Report EUR 19924 EN (Internal report GE/R/IM/21/01, IRMM, Belgium, August 2001
3. Directive 98/79/EC of the European parliament and of the Council of 27 Oct. 1998 on in vitro diagnostic medical devices
4. U. Örnemark, Y. Aregbe, L. Van Nevel, I. Papadakis, P.D.P. Taylor, A. Uldall, CCQM-P14, Calcium in Serum, Internal Report GE/R/IM/27/01, IRMM, Belgium, December 2001
5. www.bipm.fr
6. M.J. Welch, C.S. Phinney, R.M. Parris, W.E. May, CCQM-K12 Determination of creatinine in serum, Report draft B, NIST, USA, 22 August 2002
7. U. Örnemark, P.D.P. Taylor, Euromet Metchem project 563, draft report, January 2002
8. A. Uldall, G.M. Nielsen, N. Jørgensen, M. Loikkanen, H. Steensland, G. Nordin, E. Olafsdottir, U. Örnemark, M. Keinänen, U-R. Nordberg, EQAnews, 2002, 13(1) 7
9. A. Uldall, EQAnews, 1993, 4(2), 7
10. A. Uldall, EQAnews, 1992, 3(4), 3
11. A. Uldall, J. Gävert, U-R. Nordberg, E. Olafsdottir and H. Steensland, Internal Report, Labquality 1994-07-14, Labquality, Helsinki, Finland, 1994
12. G.M. Nielsen, EQAnews 2002, 13, 19-23 13. L. Thienpont, C. Franzinini, J, Kratochvila, J. Middle, C. Ricós, L. Siekmann, D. Stöckl,
EQAnews, 2000, 11(1) 60 14. Guide to the Expression of Uncertainty in Measurement, ISBN 92-67-10188-9,
© International Organisation for Standardisation, 1995
15. Eurachem/CITAC, Quantifying uncertainty in analytical measurement, 2nd ed., www.eurachem.ul.pt
16. T.J. Quinn, Primary Methods of Measurement and Primary Standards, Metrologia, 34 (1997) 61-65
17. BCR Reference Materials Catalogue 2002, www.irmm.jrc.be
18. C.L. Rulfs, in Treatise on Analytical Chemistry, I.M. Kolthoff and P.J. Elving, Eds., Part 1, Vol. 11, Ch. 13, Wiley, New York, 1975
19. J.R. Moody, T.W. Vetter, J. Res. Nat. Inst. Stand. Technol., 1996, 101, 155
20. GUM Workbench, version 2.3, Metrodata GmbH, Grenzach-Wyhlen, Germany, www.metrodata.de
21. www.labquality.fi
22. IMEP Certificate, IM/L/062/02, IRMM, Belgium, September 2002
23. IMEP Certificate, IM/L/063/02, IRMM, Belgium, September 2002