
Image watermarking based on the space/spatial-frequency ...
38
HAL Id: hal-01138544 https://hal.archives-ouvertes.fr/hal-01138544 Submitted on 2 Apr 2015 HAL is a multi-disciplinary open access archive for the deposit and dissemination of sci- entific research documents, whether they are pub- lished or not. The documents may come from teaching and research institutions in France or abroad, or from public or private research centers. L’archive ouverte pluridisciplinaire HAL, est destinée au dépôt et à la diffusion de documents scientifiques de niveau recherche, publiés ou non, émanant des établissements d’enseignement et de recherche français ou étrangers, des laboratoires publics ou privés. Image watermarking based on the space/spatial-frequency analysis and Hermite functions expansion Srdjan Stankovic, Irena Orovic, Marie Chabert, Bijan Mobasseri To cite this version: Srdjan Stankovic, Irena Orovic, Marie Chabert, Bijan Mobasseri. Image watermarking based on the space/spatial-frequency analysis and Hermite functions expansion. Journal of Electronic Imaging, SPIE and IS&T, 2013, vol. 22 (n° 1), pp. 1-36. 10.1117/1.JEI.22.1.013014. hal-01138544
Transcript of Image watermarking based on the space/spatial-frequency ...
HAL Id: hal-01138544https://hal.archives-ouvertes.fr/hal-01138544
Submitted on 2 Apr 2015
HAL is a multi-disciplinary open accessarchive for the deposit and dissemination of sci-entific research documents, whether they are pub-lished or not. The documents may come fromteaching and research institutions in France orabroad, or from public or private research centers.
L’archive ouverte pluridisciplinaire HAL, estdestinée au dépôt et à la diffusion de documentsscientifiques de niveau recherche, publiés ou non,émanant des établissements d’enseignement et derecherche français ou étrangers, des laboratoirespublics ou privés.
Image watermarking based on thespace/spatial-frequency analysis and Hermite functions
expansionSrdjan Stankovic, Irena Orovic, Marie Chabert, Bijan Mobasseri
To cite this version:Srdjan Stankovic, Irena Orovic, Marie Chabert, Bijan Mobasseri. Image watermarking based on thespace/spatial-frequency analysis and Hermite functions expansion. Journal of Electronic Imaging,SPIE and IS&T, 2013, vol. 22 (n° 1), pp. 1-36. �10.1117/1.JEI.22.1.013014�. �hal-01138544�

Open Archive TOULOUSE Archive Ouverte (OATAO) OATAO is an open access repository that collects the work of Toulouse researchers andmakes it freely available over the web where possible.
This is an author-deposited version published in : http://oatao.univ-toulouse.fr/Eprints ID : 12407
To link to this article : DOI :10.1117/1.JEI.22.1.013014URL : http://dx.doi.org/10.1117/1.JEI.22.1.013014
To cite this version : Stankovic, Srdjan and Orovic, Irena and Chabert,Marie and Mobasseri, Bijan Image watermarking based on the space/spatial-frequency analysis and Hermite functions expansion. (2013) Journal of Electronic Imaging, vol. 22 (n° 1). pp. 1-36. ISSN 1017-9909
Any correspondance concerning this service should be sent to the repository
administrator: [email protected]
1
*1On leave at the Center for Advanced Communications, Villanova University
1University of Montenegro, Faculty of Electrical Engineering, 20000 Podgorica , Montenegro
2University of Toulouse, INP - ENSEEIHT Toulouse, 31071 Toulouse Cedex 7, France
3University of Villanova, Villanova, PA 19085
Corresponding author: Irena Orović, email: [email protected]
Abstract—An image watermarking scheme that combines Hermite functions expansion and
space/spatial-frequency analysis is proposed. In the first step, the Hermite functions expansion is
employed to select busy regions for watermark embedding. In the second step, the space/spatial-
frequency representation and Hermite functions expansion are combined to design the
imperceptible watermark, using the host local frequency content. The Hermite expansion has been
done by using the fast Hermite projection method. Recursive realization of Hermite functions
significantly speeds up the algorithms for regions selection and watermark design. The watermark
detection is performed within the space/spatial-frequency domain. The detection performance is
increased due to the high information redundancy in that domain in comparison with the space or
frequency domains, respectively. The performance of the proposed procedure has been tested
experimentally for different watermark strengths i.e. for different values of the Peak Signal to
Image Watermarking based on the space/spatial-frequency analysis and
Hermite functions expansion
*1Srdjan Stanković, 1Irena Orović, 2Marie Chabert, 3Bijan Mobasseri
2
Noise Ratio (PSNR). The proposed approach provides high detection performance even for high
PSNR values. It offers a good compromise between detection performance (including the
robustness to a wide variety of common attacks) and imperceptibility.
Index Terms— Digital image watermarking, space/spatial-frequency image analysis, Hermite
functions, Hermite expansion coefficients.
I. INTRODUCTION
The rapid development of digital technology brings a need to protect multimedia content from
unauthorized usage. One of the common solutions is known as digital watermarking with
applications ranging from digital rights management to integrity protection. It refers to specific
information hiding based on embedding a secret signal into the multimedia data, under the
constraints of imperceptibility, security and robustness to attacks [1]-[3]. The owner of the
protected content should be able to detect the watermark in order to prove ownership. An
efficient digital watermarking procedure provides a good compromise between the watermark
invisibility (which will preserve the host signal quality) and its robustness against common
attacks (aiming to make the watermark undetectable).
Most of the existing image watermarking techniques can be categorized into spatial domain or
transform domain algorithms [2]-[18]. Watermark embedding in transform domains, e.g.
frequency domains (through the Discrete Cosine Transform (DCT), Discrete Fourier Transform
(DFT), Discrete Wavelet Transform (DWT), etc.), generally increases the robustness to attacks
[4]-[9] compared to the spatial domain. However, the frequency domain embedding usually
3
causes an uncontrolled spread of the watermark over a possibly large spatial region. It means that
the watermark embedded in some components in one domain will be spread over all components
in other domain. In this sense, special masking algorithms are required to preserve the watermark
imperceptibility. In order to exploit the advantage of using both domains simultaneously, the
joint space/spatial-frequency based watermarking has been considered [10]-[14]. The
space/spatial-frequency analysis provides a local frequency content estimation and analysis for
each individual image pixel. Hence, the watermark spatial location and its frequency
characteristics are controlled simultaneously. Furthermore, the space/spatial-frequency based
procedure provides a high robustness to attacks and good detection performance. For each pixel
in the spatial domain, we produce a block of space/spatial-frequency coefficients whose size
depends on the window used for the calculation of space/spatial-frequency representation. It
means that the number of coefficients used in detection is significantly increased comparing to
the number of watermarked pixels: for each pixel, we have approximately 200 space/spatial-
frequency coefficients for correlation (50% of the 20x20 blocks used in our case). Consequently,
a successful detection in space/spatial-frequency domain usually requires smaller number of
watermarked pixels than the procedures in DCT and DWT domain.
This work represents a modified and improved version of the space/spatial-frequency based
image watermarking procedure [14]. Prior to watermark embedding, a set of suitable pixels is
determined. Generally, the imperceptibility-robustness compromise is significantly improved by
embedding the watermark within the busy image regions. According to the masking effects of the
human visual system (HVS), the busy or high contrast image areas can mask any distortion better
than smooth areas, and thus, can support higher watermark signal without visibility problem
[19]-[21]. The HVS frequency sensitivity and masking are closely related, such that both effects
4
suggest that we are less sensitive to noise in high frequencies producing the busy parts of the
image [21],[22]. The similar design [14] uses the energy of local space/spatial-frequency content
to determine the occupancy and busyness of the region. This requires exhaustive procedure for
setting the thresholds, since the energy within the region is not exactly a natural and precise
measure to characterize region busyness. Therefore, we propose a simple and efficient method to
detect busy (high-variance) regions that is based on an incomplete Hermite functions expansion
[26]. Each image region is firstly reconstructed by using a few low-order Hermite functions, and
the mean square error (MSE) between the original and reconstructed region is used as a
distinguishability criterion. The low-order functions are related to the low-frequency content,
while the higher order functions have more high-frequency components [23], [24], [26],[28].
Hence, when using a few low-order functions for the reconstruction, the MSE for busy regions
will be pretty high, since these regions are characterized by high-frequency content [25]. More
details the regions have, more functions are required for proper reconstruction.
The selected busy regions are used for watermark design and embedding. In order to identify
space/spatial-frequency components that are, from the perceptual point of view, appropriate for
watermark embedding, the Hermite projection method is applied in the space/spatial-frequency
domain, as well. The most significant components (from the perceptual point of view) are
omitted to avoid image quality degradation, and the watermark is designed according to the
remaining components. The space/spatial-frequency content of the watermark changes for each
selected pixel according to its local space/spatial-frequency content. This further means that the
space/spatial-frequency content of the watermark is not uniform across the image, as it is the case
in [14], where the watermark is fixed to the middle frequency ring. Comparing to [14], the
5
proposed pixels selection and watermark modeling techniques improves the quality of
watermarked image, which has been measured by the local PSNR.
The watermark detection is performed in the space/spatial-frequency domain, since it provides
a large number of elements available for the correlation based detection. In this case, the
information about watermark will be spread over a large number of coefficients in the
space/spatial-frequency domain, even when a small number of pixels is used. In other words, the
detection is flexible regarding the number of considered pixels, because even for a small number
of pixels there is still large number of elements in correlation. The proposed procedure is tested
on various images in the presence of different commonly used attacks.
The paper is organized as follows. The procedure for busy regions selection is given in Section
II. The watermarking procedure that includes watermark design, embedding and detection is
proposed in Section III. The efficiency of the proposed procedure is tested experimentally in
Section IV, while the concluding remarks are given in Section V.
II. SELECTION OF WATERMARKING REGIONS
A. Hermite Projection Method
The Hermite projection method has been introduced in various image and speech processing
applications [26]-[28]. The Hermite functions are used as the basis functions due to their
favorable properties (orthogonality and good localization property [26], [29]), providing a unique
representation of different signals. They provide better computational localization in both signal
and transform domains in comparison with the trigonometric functions. Also, as it will be shown
later, the coefficients of expansion are easily computed, especially having in mind the recursive
procedure for Hermite functions calculation. Furthermore, by using the Hermite expansion, the
6
signal energy is approximated by the numerical integral of the Gauss-Hermite type and converges
more rapidly than the rectangle rule involved in the DCT computation [27].
The Hermite functions have been defined as:
2 2/2( 1) ( )( )
2 !
p x p x
p pp
e d ex
dxpψ
π
−−= . (1)
To speed up the calculation procedure, they can be defined recursively as follows [28]:
2 2/2 /20 14 4
1 2
1 2( ) , ( ) ,
12( ) ( ) ( ), 2.
x x
p p p
xx e x e
px x x x p
p p
π π
− −
− −
Ψ = Ψ =
−Ψ = Ψ − Ψ ∀ ≥
(2)
For the purpose of image analysis, the expansion into Hermite functions can be applied to image
rows, columns or both. For the sake of simplicity, we consider the Hermite expansion of image
rows (one row at a time). Therefore, an image is represented by using a given number K of
Hermite functions as follows [28]:
1
0( , ) ( ),
K
p pp
I x y c x for fixed yψ−
=
= ∑ , (3)
where I(x,y) denotes an image of size P×Q (or a given region), while cp are coefficients of
Hermite expansion. Note that, prior to the Hermite expansion, removing the baseline from I(x,y)
is required, since ( ) 0,p x xψ → →∞ for all p. The baseline is defined as:
( , ) ( ,0)( ) ( ,0)x
I x Q I xB y I x y
Q
−= + ⋅ . (4)
A complete image reconstruction can be achieved when the number of Hermite functions is equal
to P. However, it has been shown that the image can be successfully reconstructed even by using
7
a smaller number (K<P) of Hermite functions. Additional savings can be achieved by applying
the Hermite projection method over both coordinates. The Hermite expansion coefficients can be
calculated by using the Gauss-Hermite quadrature, as follows:
21 1
( )1 ( ),( ( ))
P p mp y m
m P m
xc I x
P x
ψ
ψ= −
≈ ∑ (5)
where mx are zeros of the Hermite polynomials, while Iy(xm) is I(xm,y) for a fixed y.
B. A procedure for busy regions selection based on the Hermite Projection Method
Image analysis is usually based on texture feature extraction methods, and the most significant
among them are the auto-correlation, edge frequency, primitive-length, Law’s method and co-
occurrence matrices [30],[31]. Each of these methods uses different features for texture
classification, while their performance depends on the quality of feature and amount of training
data. The standard texture classification methods are mainly based on matching algorithms with a
predefined texture patterns, patches or primitives [30], [32]. The classification is then performed
by determining the well-known co-occurrence matrices features [33] (directionality, coarseness,
granularity, etc.), which are compared between the observed image regions and patterns. The first
limitation that we face with in our application is that it is hard to define a pattern or patch for
busy regions in natural images, due to their diversity. Furthermore, the statistical measures
extracted from co-occurrence matrices need to be combined to provide regions classification,
while the thresholds associated with each measure are not standardized and they are subject of
exhaustive experimentation.
In watermarking application we are interested in determining busy regions with large variations
and without fine structures, or busy regions where different texture elements intersect. Moreover,
we should also analyze the amount of variations within the region to decide whether it is suitable
8
for watermarking. If we consider histogram analysis to characterize the variations within the
region, we lack the information about the spatial distribution of different values. When observing
the histograms of different regions (as shown later in Section IV), we may say that the histogram
does not provide such obvious classification features. Moreover, we would need to perform
detailed histogram analysis and certainly to define a completely new procedure for region
classification.
The proposed approach provides a simple and reliable procedure that identifies the regions
with fast variations and irregular structures, by using image independent threshold. The MSE
between the original region and its reconstructed version provides a natural, simple and efficient
measure of region complexity. More complex and disordered region produces higher MSE.
Moreover, it has been shown that the gap between flat (flat and moderately flat) and busy (busy
and moderately busy) regions is significant. It is important to note that the proposed classification
method has not been used so far, although the Hermite projection method has been applied in
texture classification, but with a full set of functions and combined with additional procedures.
An image can be decomposed into a set of regions/blocks Ri(x,y) of size P×Q. Each region can
be separately decomposed into Hermite functions. When the region is uniform/flat, it can be
reconstructed by using much fewer functions than for the busy regions. Hence, when the same
number of Hermite functions is used for all image regions, the mean square error between the
original and reconstructed region will be smaller if the region is more uniform. This property can
be used as a criterion for an efficient busy region selection. The mean square error between the
original and reconstructed region is given by:
21
0
1{ ( , )} ( , ) ( )
K
i i p p
x y p
MSE R x y R x y c xPQ
ψ−
=
= −
∑∑ ∑ , (6)
9
where K is the number of Hermite functions used for reconstruction. Generally, the region size is
firstly chosen approximately to correspond to the size used in texture features characterization
(e.g., between 15x15 and 30x30). Then, based on a number of experiments, the optimal
performance of the proposed procedure is achieved by using the regions 20x20. The values of K
are determined experimentally by using a set of test images. Namely, for the observed 20x20
regions we use a fixed number of five Hermite functions and coefficients, which is 25% of
number of pixels per line. This value of K is enough to reconstruct flat regions with small error
and insufficient to reconstruct busy regions. Apparently, when working with such regions the
classification performance does not vary significantly for different images.
The considered regions are classified as follows:
{ ( , )} ( , ){ ( , )} ( , )
i i
i i
MSE R x y R x y busy regionMSE R x y R x y flat region
>Ξ⇒ ∈≤Ξ⇒ ∈
(7)
where Ξ is some predetermined threshold value (which will be discussed in Section IV).
Generally, the pixels from busy regions are more suitable for watermarking, since the changes in
these regions are more difficult to perceive than in the flat regions. Consequently, watermark
embedded in the busy regions can be stronger, and it is more likely to be robust to different
attacks. In the proposed approach, for watermark embedding we use only the pixels from the
busy regions.
III. WATERMARKING PROCEDURE
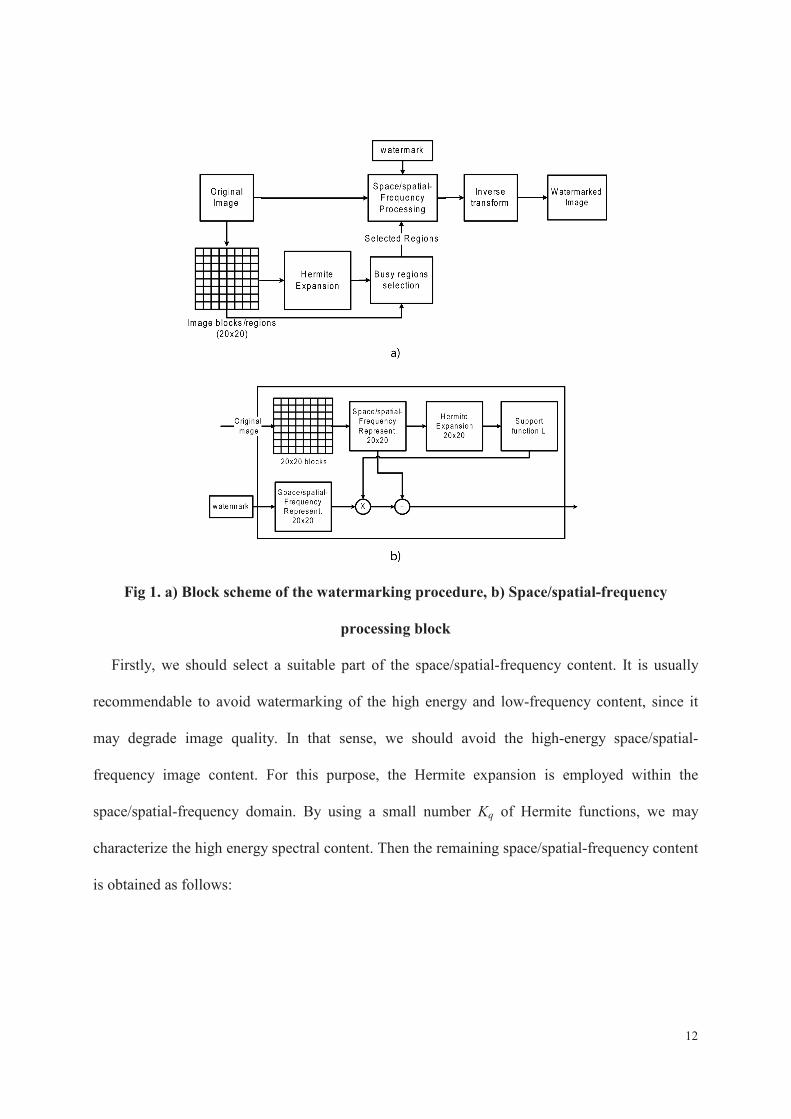
A block diagram of the proposed watermarking procedure is shown in Fig 1.a. The image is
divided into regions processed by using the Hermite expansion method to select busy image
regions. The selected regions are used as input to the space/spatial-frequency processing block
together with the original image to perform watermark modeling and embedding. When choosing
10
the size of image regions, two important issues are considered: 1. small image regions are
difficult for characterization in both spatial and frequency domain; 2. large regions can not be
associated with local frequency content of pixels anymore. Hence, as discussed in the previous
section, the optimal size is set to 20x20.
The space/spatial-frequency processing block is shown in Fig 1.b. It is important to emphasize
that the block scheme given in Fig. 1, includes two major steps from the calculation standpoint:
1. Hermite expansion method, 2. space/spatial-frequency transform and its inverse. The fast
Hermite projection method [26], suitable for hardware realization, has been used for Hermite
expansion. Although, the Hermite functions can be calculated recursively, we can even store and
load functions from registers since we use only a first few Hermite functions. Concerning the
space/spatial-frequency transform and its inverse, it is important to emphasize that the real-time
hardware implementation for space/spatial-frequency image analysis (including the space-
varying filtering) has been already done in [34],[35]. Additional operations required by the
proposed procedure are image decomposition into 20x20 blocks and additive watermark
embedding, with almost negligible computational complexity.
A. Watermark design and embedding
After the pixels that belong to the busy image regions are selected, the watermark embedding
procedure is performed in the space/spatial-frequency domain. As a suitable space/spatial-
frequency representation, the two-dimensional (2D) short-time Fourier transform (STFT) is
considered. By using the 2D STFT, a region of pixels, captured by the window around the central
one, will be mapped into the 2D frequency representation. Hence, to provide a certain model for
11
watermark characteristics, for each pixel we use a 2D representation of its local frequency
content. The watermark embedding will be done in the space/spatial-frequency domain, as well.
The 2D form of the STFT for an image I(x,y) is defined as follows:
2 /( , ) ( ) ( ) ,j k NI
k
STFT n h k I n k e π ωω −= +∑
�� �
�
� �� � � �
(8)
where h is a sliding window (N×N). The following notation is used: 1 2( , )n n n=�
,
{ }1 2 1 2( , ) , [ / 2, / 2 1]k k k k k N N= ∈ − −�
, 1 1 2 2( ) ( , )n k n k n k+ = + +� �
, 1 1 2 2( )k k kω ω ω= +���
.
The STFT is calculated for a region around each pixel that was previously selected for
watermarking. Thus, the windowed part of signal, centered at the selected pixel, is transformed
into the frequency domain. The local frequency content is further used to provide a suitable
mask, which will shape the watermark, as it is described below.
12
Fig 1. a) Block scheme of the watermarking procedure, b) Space/spatial-frequency
processing block
Firstly, we should select a suitable part of the space/spatial-frequency content. It is usually
recommendable to avoid watermarking of the high energy and low-frequency content, since it
may degrade image quality. In that sense, we should avoid the high-energy space/spatial-
frequency image content. For this purpose, the Hermite expansion is employed within the
space/spatial-frequency domain. By using a small number Kq of Hermite functions, we may
characterize the high energy spectral content. Then the remaining space/spatial-frequency content
is obtained as follows:
13
21 2 1 2
12
1 2 1 2 1 20
( , , , )
( , , , ) ( ),Kq
I q q
q
STFTx n n
STFT n n c for fixed
ω ω
ω ω ψ ω ω
−
=
=
= − ∑. (9)
After the high energy components are removed, the space/spatial-frequency content
2( , )STFTx n ω� ��
is used to create a space/spatial-frequency mask:
21, ( , ) 0
( )0, .
w
STFTx nL
otherwise
ωω
>
=
� ��
��
(10)
Then, the space/spatial-frequency characteristics of a watermark are modeled as follows:
( , ) ( , ) ( , )mw w wSTFT n L n STFT nω ω ω=
� �� � �� � ��
, (11)
i.e. ( , ) ( , )mw ww L n STFT n
ω
ω ω=∑��
� �� � ��
,
where ( , )wSTFT n ω� ��
denotes the STFT of the starting watermark created as a 2D pseudo-random
sequence. In this way, the watermark will be separately adapted to the space/spatial-frequency
content of each image region. In other words, each region has its own support function which is
used to distribute watermark over the region in accordance with region components. This
watermark design procedure should result in better watermark imperceptibility.
14
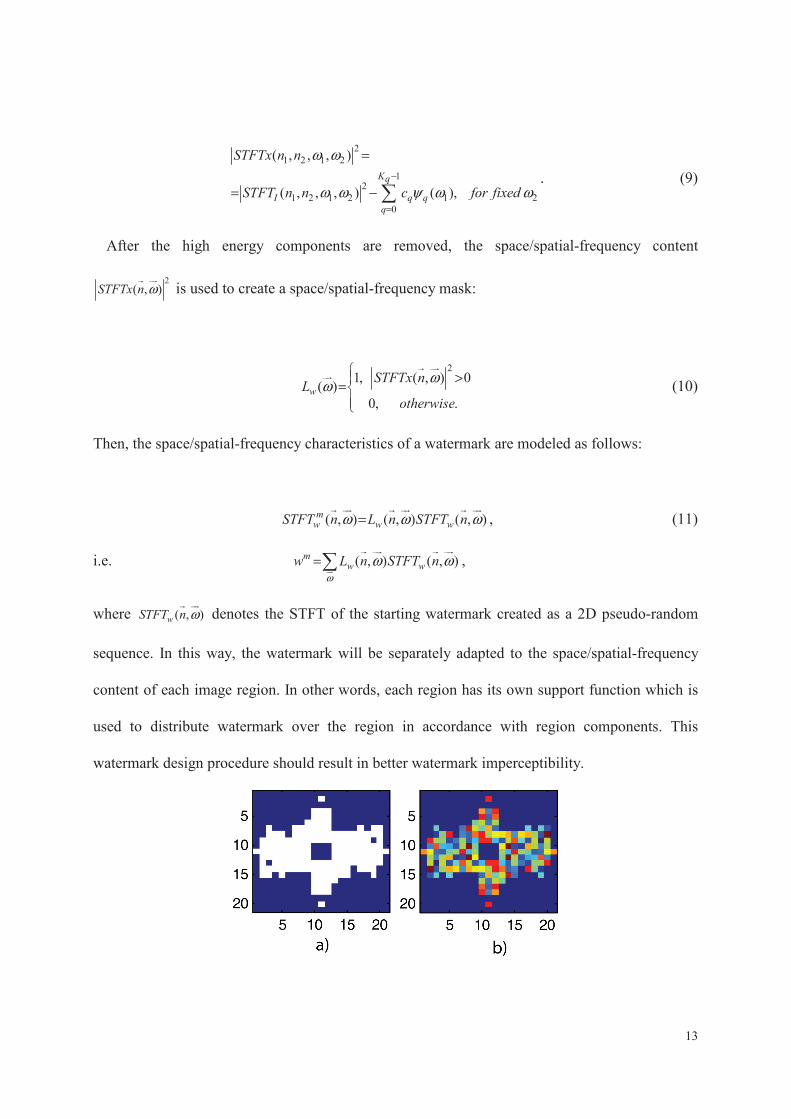
Fig 2. a) An example of 2D space/spatial-frequency mask, b) watermark modelled using
space/spatial-frequency mask
An illustration of the space/spatial-frequency mask and the corresponding space/spatial-
frequency characteristics of the watermark are shown in Fig. 2, for one pixel from the busy image
region (region with majority of busy pixels).
Additive watermark embedding procedure is performed in the space/spatial frequency domain,
as follows:
( , ) ( , ) ( , )mIw I wSTFT n STFT n STFT nω ω α ω= +
� �� � �� � ��
, (12)
where ISTFT and IwSTFT are the STFT of the original and watermarked image, respectively and α
allows to tune the watermark strength. The value of α depends on the initial amplitude of
pseudo-random sequence p. Since the amplitude of pseudo-random sequence influences the
PSNR, alpha is set experimentally to achieve PSNR≈50 dB for a high quality of watermarked
images.
Note that in order to retrieve the signal from its space/spatial-frequency representation, the
concept of space-varying filtering is applied. This technique has been introduced for the purpose
of space-varying filtering of 2D signals [36], [37]. The input of the space-varying filter is IwSTFT ,
while the support function is defined as:
21 2
1 21, ( , ) 0( , ) .
0,Iif STFT
Lotherwise
ω ωω ω >
=
(13)
Finally, the watermarked image is obtained as follows:
15
( ) ( , ) ( , )w IwI n STFT n L nω
ω ω=∑��
� � �� � ��
. (14)
B. Watermark detection
The watermark detection is performed, within the space/spatial-frequency domain, by using the
space/spatial-frequency domain correlation as in [14]:
{ }
( , ) ( , )
( , ) ( , ) ( , )
w
w
mI w
n
I w wn
Det STFT n STFT n
STFT n L n STFT n
ω
ω
ω ω
ω ω ω
∑ ∑
∑ ∑
= =
=
� ��
� ��
� �� � ��
� �� � �� � ��
. (15)
Note that the two-dimensional space/spatial-frequency region is centered on each selected
pixel. Instead of a single pixel in the spatial domain, we use a STFT matrix with a certain number
of elements that depends on the window size. Then the actual number of components used in the
detection is much larger, providing a significant detection improvement. However, note that
( , )mwSTFT n ω
� ��
depends on the support function ( , )wL n ω� ��
, which is specific for each pixel. Thus, in
order to use (15), we would need to store the 2D watermark for each watermarked pixel. In other
words, the 2D support function should be available for each pixel as side information. Hence, to
provide a blind detection and to avoid large side information, which is usually undesirable in
watermarking, we use the modified detector form that does not need any knowledge about the 2D
support functions. The introduced modification does not affect significantly the detection results.
Hence, the detector form includes only the STFT of the starting watermark, created as a 2D
pseudo-random sequence, which is the same for all pixels:
( , ) ( , )wI w
n
Det STFT n STFT nω
ω ω∑ ∑
=
� ��
� �� � ��
,
16
and does not require knowledge about the support function. The detection performance is tested
by using the following measure of detection quality [38], [39]:
2 2
,w wr w
w z
Det DetMD
σ σ
−=
+ (16)
where Det and σ2 represent the mean value and the variance of the detector responses, w and z
indicate watermarks (right keys or trials) and wrong trials, respectively. The probability of error
Perr can be easily calculated by using the measure MD (given by (16)), as follows:
1( ).
2 2err
MDP erfc= (17)
The normal distribution of detector’s responses is assumed. Recall that the watermark is created
from a pseudo-random sequence and for such watermarks the correlation based detector form can
be safely assumed to be sufficiently independent [45]. According to the central limit theorem, if n
random variables distributed according to any probability density function (pdf) are combined,
then their sum will have pdf which tends to a Gaussian for sufficiently large n [45], which is the
case we have. Probability of detection is obtained as Pd=1-Perr. By increasing the value of
measure MD the probability of detection error decreases.
IV. EXPERIMENTAL RESULTS
The performance of the proposed procedure is tested experimentally using various standard
test images, all of size 256x256. According to the practice in the literature (e.g.,
[4],[15],[47],[48]) we have tested the proposed procedure to a certain categories of test images.
Since the watermarking procedure aims to protect natural images, we have selected some specific
and commonly used examples (most of them are standard Matlab test images) such as portraits
(e.g. Lena, Elaine, Barbara), Landscapes (e.g., Boat, Lake, Bridge, Autumn), images with plenty
17
of details or repeating shapes (e.g., Baboon, Tiger, Peppers, Pears), images with dominant
brightness (F16).
Numerous realizations with different watermarks (right keys) and wrong trials have been done.
The STFT is calculated by using the regions of size 20×20. The pixels belonging to busy image
regions are selected by using the proposed procedure based on the Hermite projection method.
The regions classification is done by using parameter 40Ξ= . Note that the classification
performance is not so sensitive to the selection of Ξ . Namely, the experiments have shown that
the MSE (given by (6)) for flat and busy regions have significantly different values, and thus we
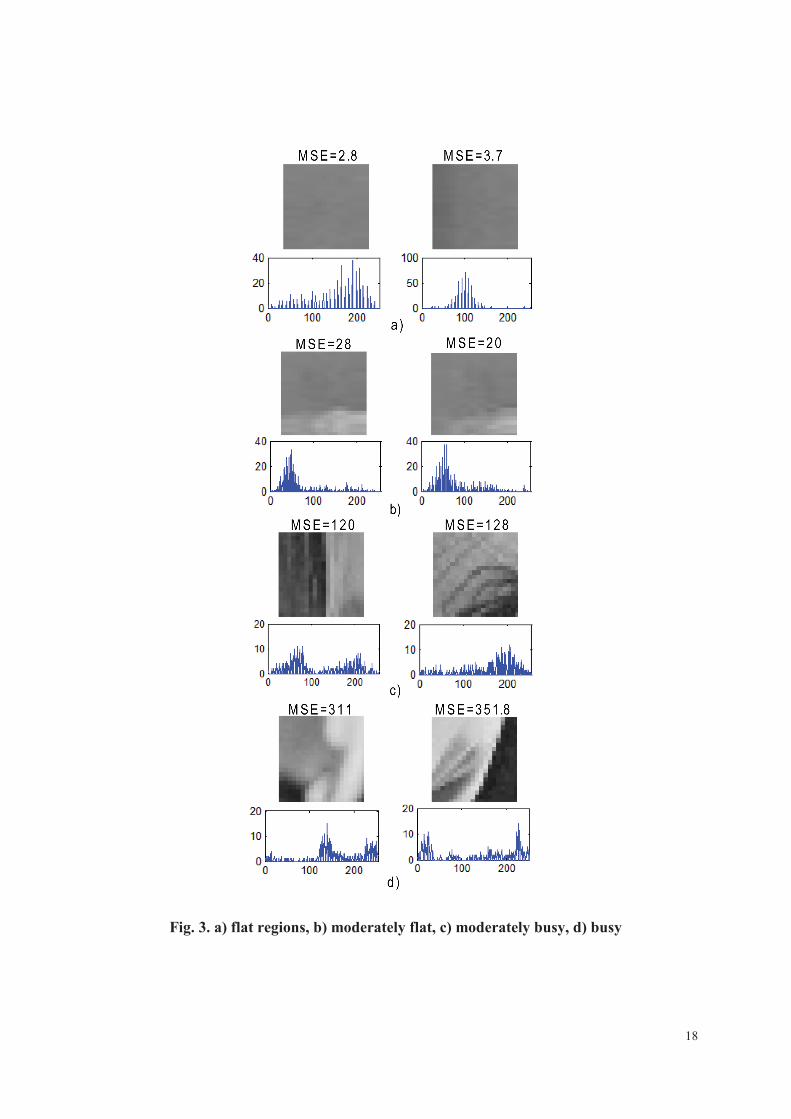
can set parameter Ξ easily and flexibly for all tested images. In Fig. 3 we illustrate four different
types of regions classified according to the value of MSE:
- Strictly flat regions have very low MSE (mostly <10),
- Moderately flat regions may contain certain peripheral changes and thus slightly higher MSE,
- Moderately busy regions contain quite noticeable dynamics (MSE>100),
- Busy regions contain significant dynamics (MSE>200).
Note that there is a large difference between the MSE of moderately flat and moderately busy
regions, which facilitates setting of the threshold value Ξ .
Additionally, we may observe that it would be difficult to conclude anything about regions
dynamics on the basis of their histograms, since they do not have any visible dominant
characteristics for a certain region category (Fig. 3).
18
Fig. 3. a) flat regions, b) moderately flat, c) moderately busy, d) busy
19
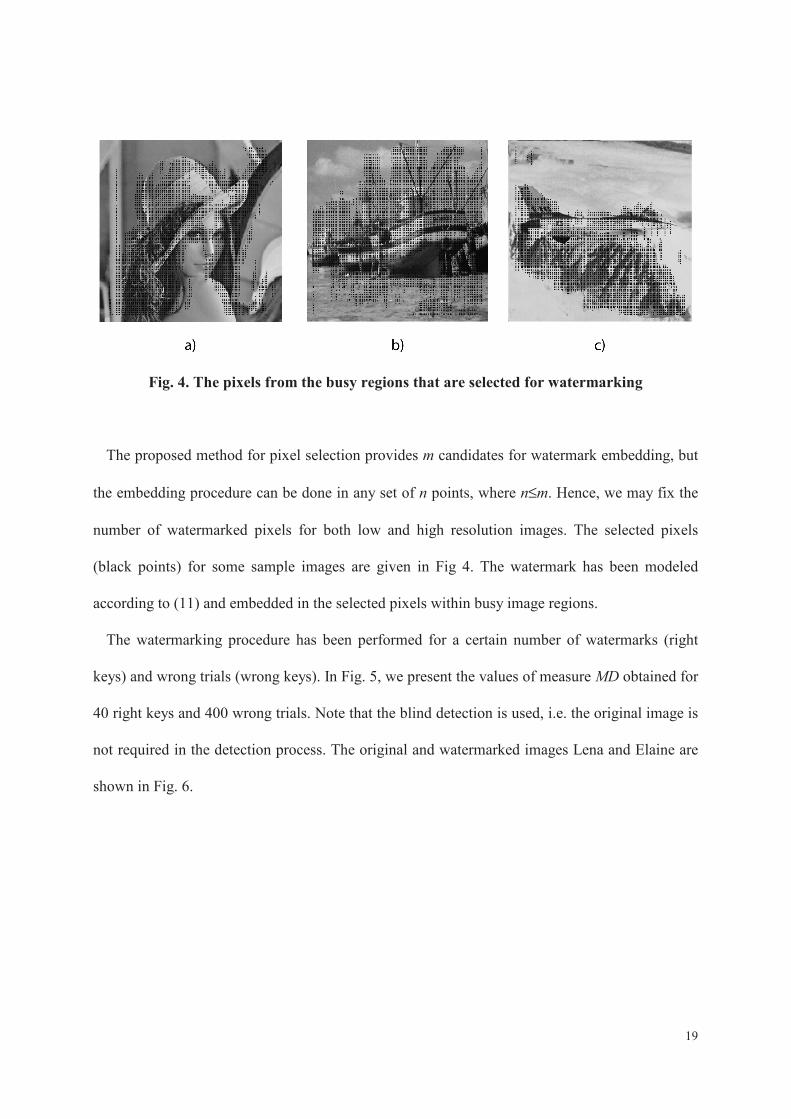
Fig. 4. The pixels from the busy regions that are selected for watermarking
The proposed method for pixel selection provides m candidates for watermark embedding, but
the embedding procedure can be done in any set of n points, where n≤m. Hence, we may fix the
number of watermarked pixels for both low and high resolution images. The selected pixels
(black points) for some sample images are given in Fig 4. The watermark has been modeled
according to (11) and embedded in the selected pixels within busy image regions.
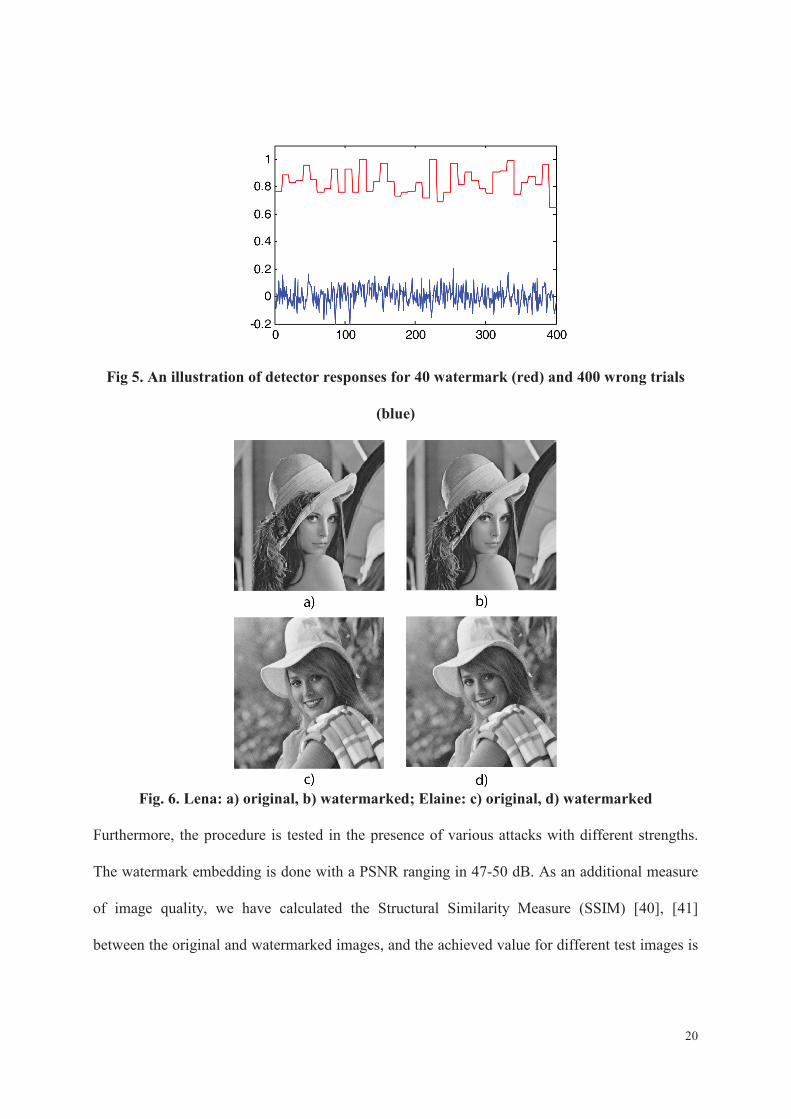
The watermarking procedure has been performed for a certain number of watermarks (right
keys) and wrong trials (wrong keys). In Fig. 5, we present the values of measure MD obtained for
40 right keys and 400 wrong trials. Note that the blind detection is used, i.e. the original image is
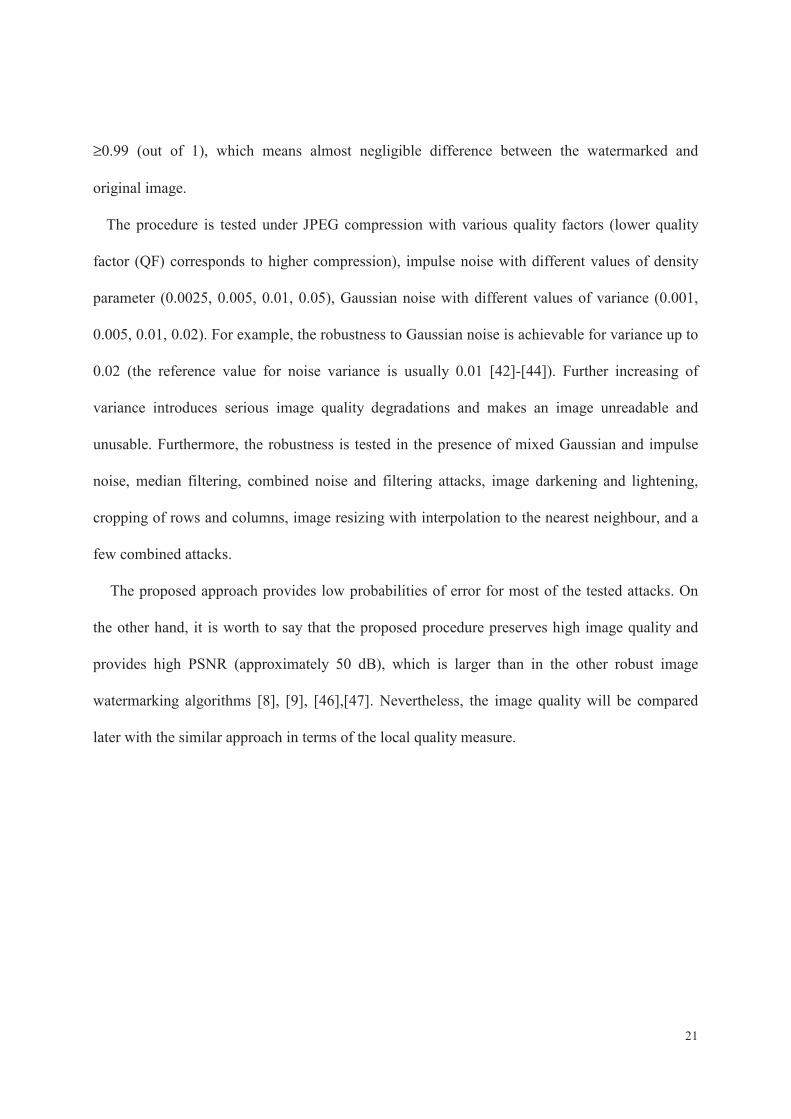
not required in the detection process. The original and watermarked images Lena and Elaine are
shown in Fig. 6.
20
Fig 5. An illustration of detector responses for 40 watermark (red) and 400 wrong trials
(blue)
Fig. 6. Lena: a) original, b) watermarked; Elaine: c) original, d) watermarked
Furthermore, the procedure is tested in the presence of various attacks with different strengths.
The watermark embedding is done with a PSNR ranging in 47-50 dB. As an additional measure
of image quality, we have calculated the Structural Similarity Measure (SSIM) [40], [41]
between the original and watermarked images, and the achieved value for different test images is
21
≥0.99 (out of 1), which means almost negligible difference between the watermarked and
original image.
The procedure is tested under JPEG compression with various quality factors (lower quality
factor (QF) corresponds to higher compression), impulse noise with different values of density
parameter (0.0025, 0.005, 0.01, 0.05), Gaussian noise with different values of variance (0.001,
0.005, 0.01, 0.02). For example, the robustness to Gaussian noise is achievable for variance up to
0.02 (the reference value for noise variance is usually 0.01 [42]-[44]). Further increasing of
variance introduces serious image quality degradations and makes an image unreadable and
unusable. Furthermore, the robustness is tested in the presence of mixed Gaussian and impulse
noise, median filtering, combined noise and filtering attacks, image darkening and lightening,
cropping of rows and columns, image resizing with interpolation to the nearest neighbour, and a
few combined attacks.
The proposed approach provides low probabilities of error for most of the tested attacks. On
the other hand, it is worth to say that the proposed procedure preserves high image quality and
provides high PSNR (approximately 50 dB), which is larger than in the other robust image
watermarking algorithms [8], [9], [46],[47]. Nevertheless, the image quality will be compared
later with the similar approach in terms of the local quality measure.
22
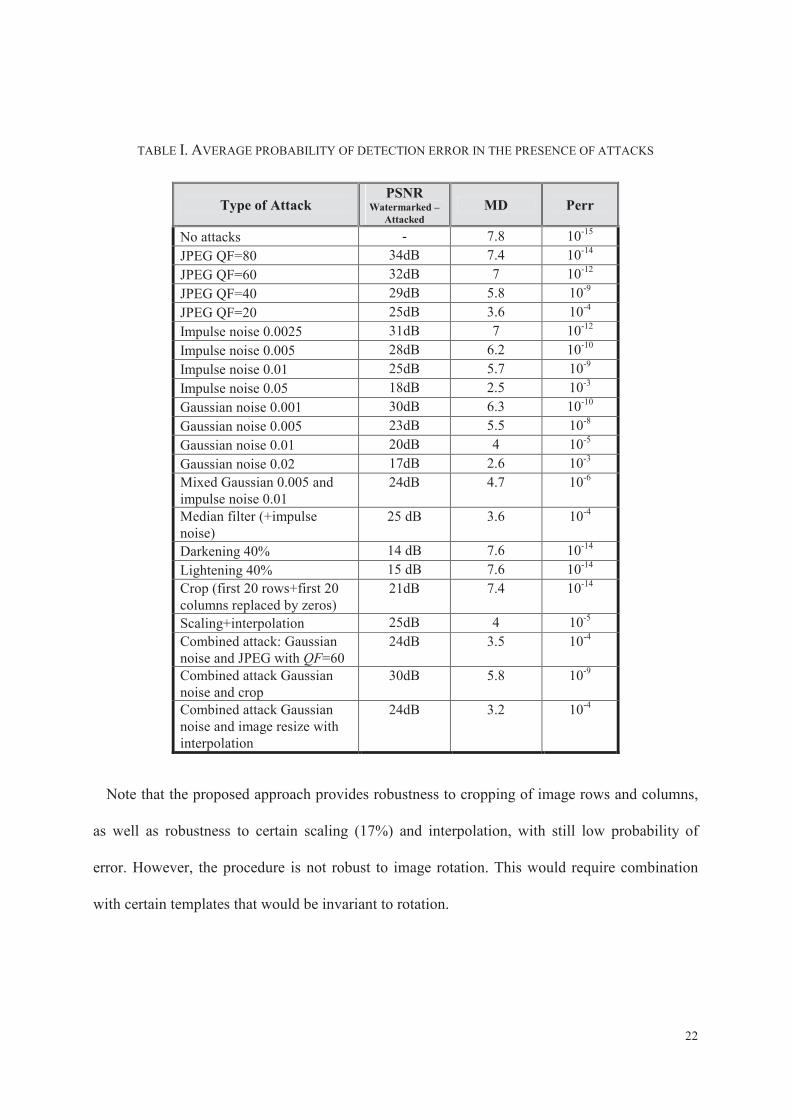
TABLE I. AVERAGE PROBABILITY OF DETECTION ERROR IN THE PRESENCE OF ATTACKS
Type of Attack PSNR
Watermarked –
Attacked
MD Perr
No attacks - 7.8 10-15
JPEG QF=80 34dB 7.4 10-14
JPEG QF=60 32dB 7 10-12
JPEG QF=40 29dB 5.8 10-9
JPEG QF=20 25dB 3.6 10-4
Impulse noise 0.0025 31dB 7 10-12
Impulse noise 0.005 28dB 6.2 10-10
Impulse noise 0.01 25dB 5.7 10-9
Impulse noise 0.05 18dB 2.5 10-3
Gaussian noise 0.001 30dB 6.3 10-10
Gaussian noise 0.005 23dB 5.5 10-8
Gaussian noise 0.01 20dB 4 10-5
Gaussian noise 0.02 17dB 2.6 10-3
Mixed Gaussian 0.005 and impulse noise 0.01
24dB 4.7 10-6
Median filter (+impulse noise)
25 dB 3.6 10-4
Darkening 40% 14 dB 7.6 10-14
Lightening 40% 15 dB 7.6 10-14
Crop (first 20 rows+first 20 columns replaced by zeros)
21dB 7.4 10-14
Scaling+interpolation 25dB 4 10-5
Combined attack: Gaussian noise and JPEG with QF=60
24dB 3.5 10-4
Combined attack Gaussian noise and crop
30dB 5.8 10-9
Combined attack Gaussian noise and image resize with interpolation
24dB 3.2 10-4
Note that the proposed approach provides robustness to cropping of image rows and columns,
as well as robustness to certain scaling (17%) and interpolation, with still low probability of
error. However, the procedure is not robust to image rotation. This would require combination
with certain templates that would be invariant to rotation.
23
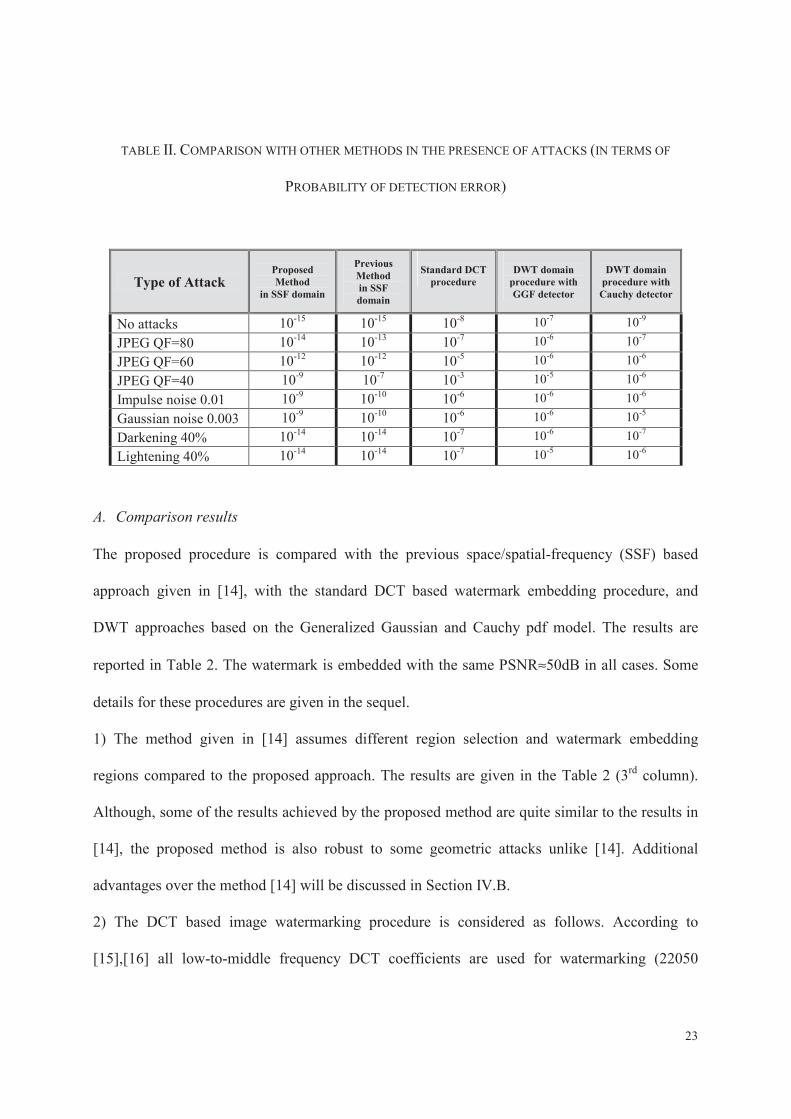
TABLE II. COMPARISON WITH OTHER METHODS IN THE PRESENCE OF ATTACKS (IN TERMS OF
PROBABILITY OF DETECTION ERROR)
Type of Attack Proposed
Method
in SSF domain
Previous
Method
in SSF
domain
Standard DCT
procedure
DWT domain
procedure with
GGF detector
DWT domain
procedure with
Cauchy detector
No attacks 10-15 10-15 10-8 10-7 10-9
JPEG QF=80 10-14 10-13 10-7 10-6 10-7
JPEG QF=60 10-12 10-12 10-5 10-6 10-6
JPEG QF=40 10-9 10-7 10-3 10-5 10-6
Impulse noise 0.01 10-9 10-10 10-6 10-6 10-6
Gaussian noise 0.003 10-9 10-10 10-6 10-6 10-5
Darkening 40% 10-14 10-14 10-7 10-6 10-7
Lightening 40% 10-14 10-14 10-7 10-5 10-6
A. Comparison results
The proposed procedure is compared with the previous space/spatial-frequency (SSF) based
approach given in [14], with the standard DCT based watermark embedding procedure, and
DWT approaches based on the Generalized Gaussian and Cauchy pdf model. The results are
reported in Table 2. The watermark is embedded with the same PSNR≈50dB in all cases. Some
details for these procedures are given in the sequel.
1) The method given in [14] assumes different region selection and watermark embedding
regions compared to the proposed approach. The results are given in the Table 2 (3rd column).
Although, some of the results achieved by the proposed method are quite similar to the results in
[14], the proposed method is also robust to some geometric attacks unlike [14]. Additional
advantages over the method [14] will be discussed in Section IV.B.
2) The DCT based image watermarking procedure is considered as follows. According to
[15],[16] all low-to-middle frequency DCT coefficients are used for watermarking (22050
24
coefficients for images of size 256×256, which is approximately four times the number of
watermarked pixels in the case of the proposed procedure). The detection is performed by using
the traditional correlation detector. The results are given in the Table 2, 4th column.
3) Finally, we consider the standard DWT domain watermarking. The watermark detection in the
DWT subbands is performed by using detectors based on the Generalized Gaussian or Cauchy
pdf [17],[18], since in this case they provide better performance compared to the standard
correlator. Namely, it is commonly assumed that the watermarked coefficients’ pdf may
correspond either to Generalized Gaussian or Cauchy function, and thus detection is performed
by using one of the mentioned models [17]. A number of 4000 DWT coefficients has been used.
Further increasing of the coefficients number will not influence significantly the detection
measure. The results are given in Table 2 (5th and 6th column).
Note that the detection results achieved by the proposed procedure outperform the DCT and
DWT based procedure. Furthermore, we provide a comparison with [14] in terms of the
perceptual quality.
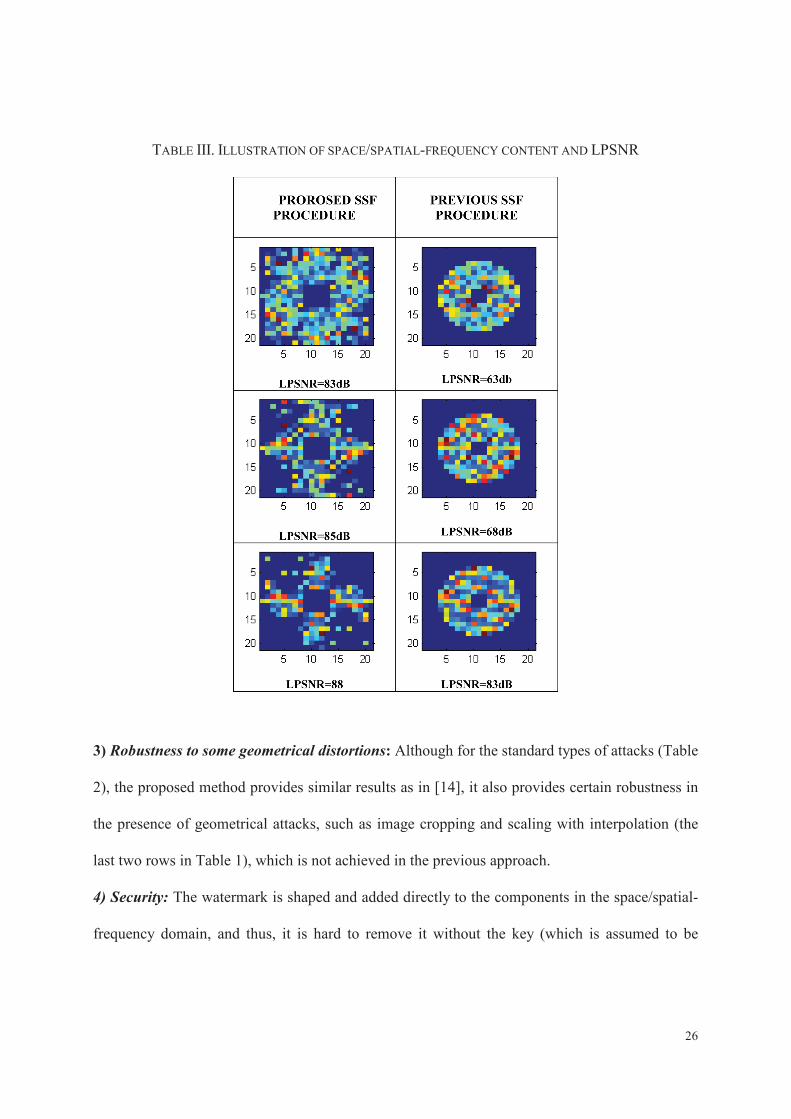
B. Comparison with the previous space/spatial-frequency approach [14]:
1) Improved imperceptibility: Comparing to the previous space/spatial-frequency based image
watermarking, the proposed approach provides better watermark imperceptibility, measured by
the local PSNR (LPSNR). The time-frequency mask obtained by using Hermite functions
expansion allows us to create a watermark that fits well into the corresponding space/spatial-
frequency content of the local image region. In other words the watermark is better suited to the
25
host signal content than in the case when the constant middle frequency content defined by the
circular ring: { }1 2 1 1 2 2( , ) : ,nmD ω ω ρ ω ω ρ= < < is used, as in [14].
In order to prove the above considerations, we have calculated the local PSNR for each
watermarked region, in the case of the proposed and the previous approach [14]. Note that this
local metrics provides much reliable description of image quality than the global PSNR.
For a fair comparison, in these experiments we have used the same watermark for both
approaches, providing the same detection performances. Also, the same image regions have been
used for watermarking. Then, the LPSNR is calculated and compared for watermarked image
regions. The results have shown that the proposed approach provides higher local PSNR for
approximately 90% of watermarked pixels/regions. In Table 3, we have illustrated the
space/spatial-frequency content for a few randomly selected pixels. The values of LPSNR are
reported as well, for the proposed approach and the approach in [14]. The pixels within 20×20
region are used to obtain local space/spatial-frequency content of the central pixel (the
surrounding pixels have similar space/spatial-frequency representation). Similar results are
obtained for other pixels/regions.
2) Robustness to Sensing: Unlike in [14], where the watermark is fixed to the middle frequency
ring, in the proposed approach the space/spatial-frequency content of the watermark changes over
different regions and adapts to the local space/spatial-frequency content of host region. It means
that watermark estimation as an attempt to remove it (sensing attack), is practically impossible
without knowing the parameters K and Kq in (6) and (9), which are used as security keys.
26
TABLE III. ILLUSTRATION OF SPACE/SPATIAL-FREQUENCY CONTENT AND LPSNR
3) Robustness to some geometrical distortions: Although for the standard types of attacks (Table
2), the proposed method provides similar results as in [14], it also provides certain robustness in
the presence of geometrical attacks, such as image cropping and scaling with interpolation (the
last two rows in Table 1), which is not achieved in the previous approach.
4) Security: The watermark is shaped and added directly to the components in the space/spatial-
frequency domain, and thus, it is hard to remove it without the key (which is assumed to be
27
private). In other words, supposing that the image quality is important for the application, any
attempt to remove the watermark will produce significant quality degradation. Furthermore, the
method for pixel selection provides the candidates for watermark embedding that are equal from
the perceptual point of view. Hence, generally, the watermark embedding can be done in any set
of n points, where n<m (m is the number of candidates). These n pixels could be chosen by a
random key, which provides the additional security of the procedure.
CONCLUSION
An image watermarking procedure for ownership protection that combines space/spatial-
frequency analysis and Hermite projection method has been proposed. This approach offers
several advantages regarding imperceptibility and robustness constraints, such as high global
PSNR, higher local PSNR comparing to other space/spatial-frequency approaches and still low
probability of error in the presence of attacks. Thus, it enhances the quality of watermarked
image, providing better watermark imperceptibility. Each image region has its own space-spatial-
frequency support which defines the watermark characteristics within the region, but the
watermark detection is blind and does not need the information about support function.
Furthermore, although the Hermite expansion has been applied in both domains: spatial (for
regions classification) and space/spatial-frequency domain (to create space/spatial-frequency
mask), the complexity of the algorithm is not increased due to the existence of the fast Hermite
projection method and fast recursive realization of Hermite functions.
28
REFERENCES
[1] Proceedings of the IEEE: Special Issue on Identification and Protection of Multimedia
Information, vol. 87, July 1999.
[2] M. Barni, F. Bartolini, Watermarking Systems Engineering. New York: Marcel Dekker, Inc.
2004.
[3] E. Muharemagić, B. Furht, “Survey of Watermarking Techniques and Applications,” CH. 3
in Multimedia Watermarking Techniques and Applications, B. Furht and D. Kirovski, editor,
Auerbach Publication, 91-130, 2006.
[4] A. Nikolaidis and I. Pitas, “Asymptotically optimal detection for additive watermarking in
the DCT and DWT domains,” IEEE Transaction on Image Processing, 12(5), 563-571, 2003.
[5] Vincent Martin, Marie Chabert, Bernard Lacaze, “A Spread Spectrum Watermarking Scheme
Based on Periodic Clock Changes for Digital Images,” In Proceedings of Information Hiding,
91~105, 2005.
[6] J. Liu, K. She, H. Wu, “Blind Image Watermarking using Dual Embedding Scheme in the
Wavelet Transform Domain” Journal of Computational Information Systems vol. 6(6), 1887-
1896, 2010.
[7] J. Vidal, M. Madueno, E. Sayrol, "Color image watermarking using channel-state
knowledge", Proc. SPIE 4675, 214 (2002)
[8] P. Kumsawat, K. Attakitmongcol and A. Srikaew, "A Robust Image Watermarking Scheme
Using Multiwavelet Tree," In Proc. The World Congress on Engineering 2007, London, U.K.
Vol. 1, 612-617, 2007.
[9] C. Nafornita, “A New Pixel-Wise Mask for Watermarking”, Proc. of ACM Multimedia and
Security Workshop 2007, Dallas, TX, USA.
29
[10]B. G. Mobaseri, “Digital watermarking in the joint time-frequency domain,” IEEE
International Conference on Image Processing, vol. 3, pp. 481-484, Sept. 2002, New York
[11]F. Sattar and B. Barkat, “A new time-frequency based private fragile watermarking scheme
for image authentication,” in Proceedings of the 7th International Symposium on Signal
Processing and Its Applications (ISSPA ’03), vol. 2, pp. 363 366, Paris, France, July 2003.
[12]M. Al-khassaweneh and S. Aviyente, "A time-frequency inspired robust image
watermarking," in IEEE Conference Record of the Thirty-Eighth Asilomar Conference, 2004,
vol (1), 392-396.
[13]L. Le, S. Krishnan, “Time-Frequency Signal Synthesis and Its Application in Multimedia
Watermark Detection,” EURASIP Journal on Advances in Signal Processing, 2006
[14]S. Stanković, I. Orović, N. Žarić, “An Application of Multidimensional Time-Frequency
Analysis as a base for the Unified Watermarking Approach,” IEEE Transactions on Image
Processing, 19(3), 736-745, 2010.
[15]A. Briassouli and M. G. Strintzis, “Locally optimum nonlinearities for DCT watermark
detection,” IEEE Trans. Image Process., vol. 13, no. 12, pp. 1604–1618, Dec. 2004
[16]Q. Cheng and T. S. Huang, “An additive approach to transform-domain information hiding
and optimum detection structure,” IEEE Trans. Multimedia, vol. 3, no. 3, pp. 273–284, Sep.
2001.
[17]Nikolaidis, A., and Pitas, I., ’Asymptotically optimal detection for additive watermarking in
the DCT and DWT domains’, IEEE Trans. on Image Process, vol. 12 No.5: 563-571, (2003)
[18]R. Kwitt, P. Meerwald, A. Uhl, 'Efficient Detection of Additive DWT Watermarking in the
DWT domain' 17th European Signal Processing Conference, EUSIPCO 2009, Aug. 2009, pp.
2072–2076.
30
[19]C.I. Podilchuk and W. Zheng, “Image adaptive watermarking using visual models,” IEEE J.
Selected Areas in Communication, vol. 16, pp. 525-539, May 1998.
[20]Peter G.J. Bartens, “Contrast sensitivity of the human eye and its effects on image quality,”
SPIE Press, pp. 147-151, 1999.
[21]Brett T. Hannigan, Alastair Reed, and Brett Bradley, “Digital Watermarking using Improved
Human Visual System Model”, SPIE Electronic Imaging 2001, pp. 468-474, Jan. 2001.
[22]Andrew P. Bradley, “A wavelet visible difference predictor,” IEEE Trans. on Image
Processing, vol.8, no.5, pp. 717-730.
[23]M. Yuan, A. De, T.K. Sarkar, J. Koh, and B. H. Jung, “Conditions for Generation of Stable
and Accurate Hybrid TD–FD MoM Solutions”, IEEE Trans. on Microwave Theory and
Techniques, vol. 54, No. 6, June 2006.
[24]T. M. Brown, R. Kotak, S. D. Horner, E. J. Kennelly, S. Korzennik, P. Nisenson, R. W.
Noyes: “Exoplanets or Dynamic Atmospheres? The Radial Velocity and Line Shape
Variations of 51 Pegasi and tau Bootis,” The Astrophysical Journal, Supplement
Series, 117(2), 1998.
[25]C.S. Won, R.M. Gray, “Stochastic Image Processing (Information Technology:
Transmission, Processing and Storage)”, Kluwer Academic/Plenum Publishers, New York,
2004.
[26]A. Krylov and D. Kortchagine, “Fast Hermite projection method,” in Proc. of the Third
International Conference on Image Analysis and Recognition (ICIAR 2006), vol. 1, Povoa de
Varzim, Portugal, Sept. 18-20, 2006, 329-338.
[27]P. Lazaridis, G. Debarge, P. Gallion, Z. Zaharis, D. Kampitaki, A. Hatzigaidas, A.
Papastergiou, and G. Grammatikopoulos, “Signal compression method for biomedical image
31
using the discrete orthogonal Gauss-Hermite transform,” in Proc. of the 6th WSEAS
international Conference on Signal Processing, Computational Geometry & Artificial Vision,
34-38, 2006
[28]D. Kortchagine and A. Krylov, “Projection filtering in image processing,” in Proc. of Tenth
International Conference on Computer Graphics and Applications (GraphiCon'2000),
Moscow, Russia, 42-45, 2000.
[29]W. F. Eberlein, “A new method for numerical evaluation of the Fourier transform,” Journal
of Mathematical Analysis and Application, 65 (1), 80-84, 1978.
[30]M. Sharma, M. Markou, S. Singh, “Evaluation of Texture Methods for Image Analysis,”
Proc. of Intelligent Information Systems, 117-121, 2001.
[31]D.A. Clausi, “An analysis of co-occurrence texture statistics as a function of grey level
quantization,” Can. J. Remote Sensing, 28, (1), 45–62, 2002.
[32]U. Kandaswamy, D. A. Adjeroh, and M. C. Lee. “Efficient Texture Analysis of SAR
Imagery,” IEEE Transactions on Remote Sensing, 43(9), 2075-2083, 2005.
[33]J.F. Haddon, J.F. Boyce, Co-occurrence matrices for image analysis, IEE Electronics and
Communications Engineering Journal, 5(2), 71-83, 1993.
[34]S. Stankovic, I. Djurovic, V. Vukovic, “System architecture for space-frequency image
analysis,” Electronics Letters, 34(23), 2224-2245, 1998.
[35]S. Stankovic, LJ. Stankovic, V.N. Ivanovic, R. Stojanovic, “An architecture for the VLSI
design of systems for time-frequency analysis and time-varying filtering,” Annals des
Telecommunications, 57(9/10), 974-995, 2002
[36]S. Stankovic, LJ. Stankovic, Z. Uskokovic, “On the local Frequency, Group Shift and Cross
Terms in Some Multidimensional Time-Frequency Distributions; A Method for
32
Multidimensional Time-Frequency Analysis,” IEEE Transactions on Signal Processing, 43,
(7), 1719-1724, 1995
[37]LJ. Stankovic, S. Stankovic, I. Djurovic, “Space/Spatial-Frequency Based Filtering,” IEEE
Transaction on Signal Processing, 48(8), 2343 - 2352 , 2000.
[38]D. Heeger, “Signal Detection Theory,” Dept. Psych., Stanford Univ., Stanford, CA, Teaching
Handout, 1997.
[39]T. D. Wickens, “Elementary Signal Detection Theory”, Oxford, U.K., Oxford Univ. Press,
2002.
[40]Z. Wang, A. C. Bovik, H. R. Sheikh, and E. P. Simoncelli, "Image quality assessment: From
error visibility to structural similarity," IEEE Transactions on Image Processing, vol. 13, no.
4, pp. 600-612, Apr. 2004
[41]http://www.ece.uwaterloo.ca/~z70wang/research/ssim/
[42]H. Rahmani, R. Mortezaei, M.E. Moghaddam, A New Robust Watermarking Scheme to
Increase Image Security. EURASIP J. Adv. Sig. Proc. 2010: (2010)
[43]B. Barkat, and F. Sattar, Time-Frequency and Time-Scale-Based Fragile Watermarking
Methods for Image Authentication, Eurasip Journal on Adv, in Signal Processing, 2010,
doi:10.1155/2010/408109
[44]K. Li and X.P. Zhang, Reliable Adaptive Watermarking Scheme Integrated with JPEG2000,
Proceedings of the 3rd International Symposium on Image and Signal Processing and
Analysis, ISSPA 2003.
[45]A. Tefas, A. Nikolaidis, N. Nikolaidis, V. Solachidis, S. Tsekeridou, I. Pitas, “Performance
analysis of correlation-based watermarking schemes employing Markov chaotic
sequences,” IEEE Transactions on Signal Processing, 51(7), 1979-1994, 2003.
33
[46]X. Kang, J. Huang, W. Zeng, “Improving robustness of quantization-based image
watermarking via adaptive receiver,” IEEE Transactions on Multimedia, 10(6), 953-959,
2008.
[47]M. Ali Akhaee, S. M. E. Sahraeian and F. Marvasti, Contourlet-Based Image Watermarking
Using Optimum Detector in a Noisy Environment, IEEE Transactions on Image Processing,
19(4), 967-980, 2010
[48]M. A. Akhaee, S.M.E. Sahraeian, B. Sankur and F. Marvasti, “Robust Scaling-Based Image
Watermarking Using Maximum-Likelihood Decoder With Optimum Strength Factor,” IEEE
Transactions on Multimedia, 11(5), 822-833, 2009.
34
BIOGRAPHIES
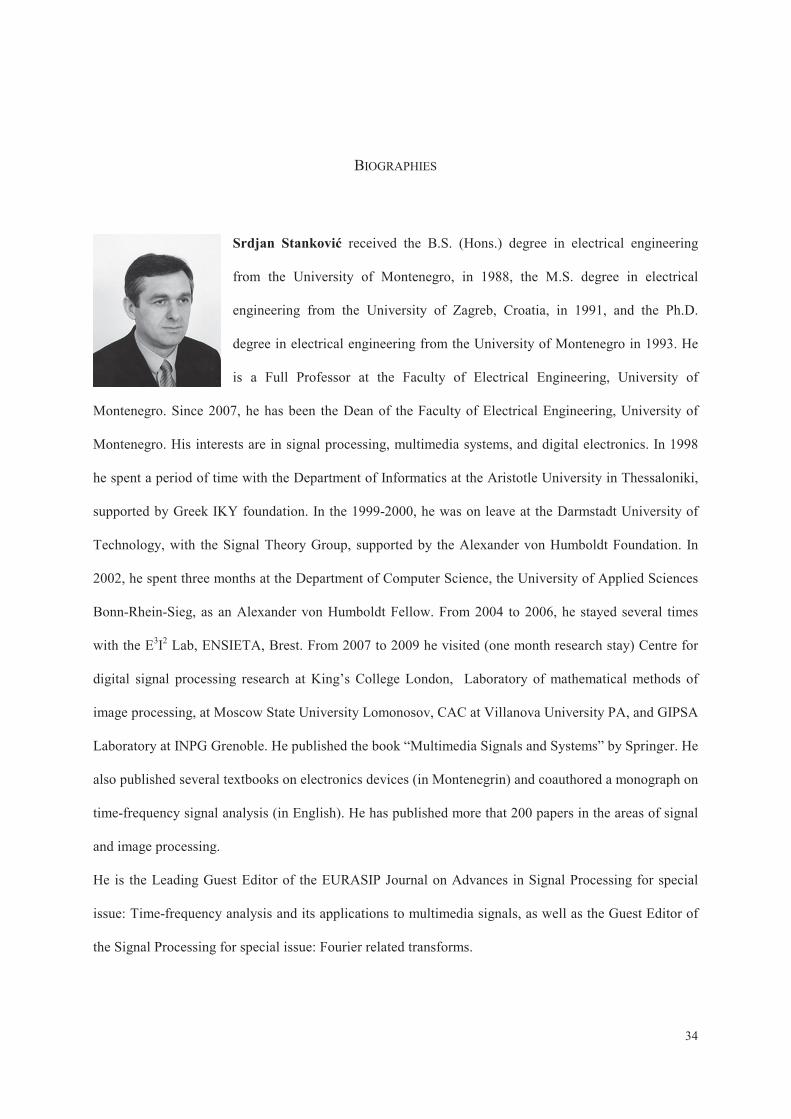
Srdjan Stanković received the B.S. (Hons.) degree in electrical engineering
from the University of Montenegro, in 1988, the M.S. degree in electrical
engineering from the University of Zagreb, Croatia, in 1991, and the Ph.D.
degree in electrical engineering from the University of Montenegro in 1993. He
is a Full Professor at the Faculty of Electrical Engineering, University of
Montenegro. Since 2007, he has been the Dean of the Faculty of Electrical Engineering, University of
Montenegro. His interests are in signal processing, multimedia systems, and digital electronics. In 1998
he spent a period of time with the Department of Informatics at the Aristotle University in Thessaloniki,
supported by Greek IKY foundation. In the 1999-2000, he was on leave at the Darmstadt University of
Technology, with the Signal Theory Group, supported by the Alexander von Humboldt Foundation. In
2002, he spent three months at the Department of Computer Science, the University of Applied Sciences
Bonn-Rhein-Sieg, as an Alexander von Humboldt Fellow. From 2004 to 2006, he stayed several times
with the E3I2 Lab, ENSIETA, Brest. From 2007 to 2009 he visited (one month research stay) Centre for
digital signal processing research at King’s College London, Laboratory of mathematical methods of
image processing, at Moscow State University Lomonosov, CAC at Villanova University PA, and GIPSA
Laboratory at INPG Grenoble. He published the book “Multimedia Signals and Systems” by Springer. He
also published several textbooks on electronics devices (in Montenegrin) and coauthored a monograph on
time-frequency signal analysis (in English). He has published more that 200 papers in the areas of signal
and image processing.
He is the Leading Guest Editor of the EURASIP Journal on Advances in Signal Processing for special
issue: Time-frequency analysis and its applications to multimedia signals, as well as the Guest Editor of
the Signal Processing for special issue: Fourier related transforms.
35
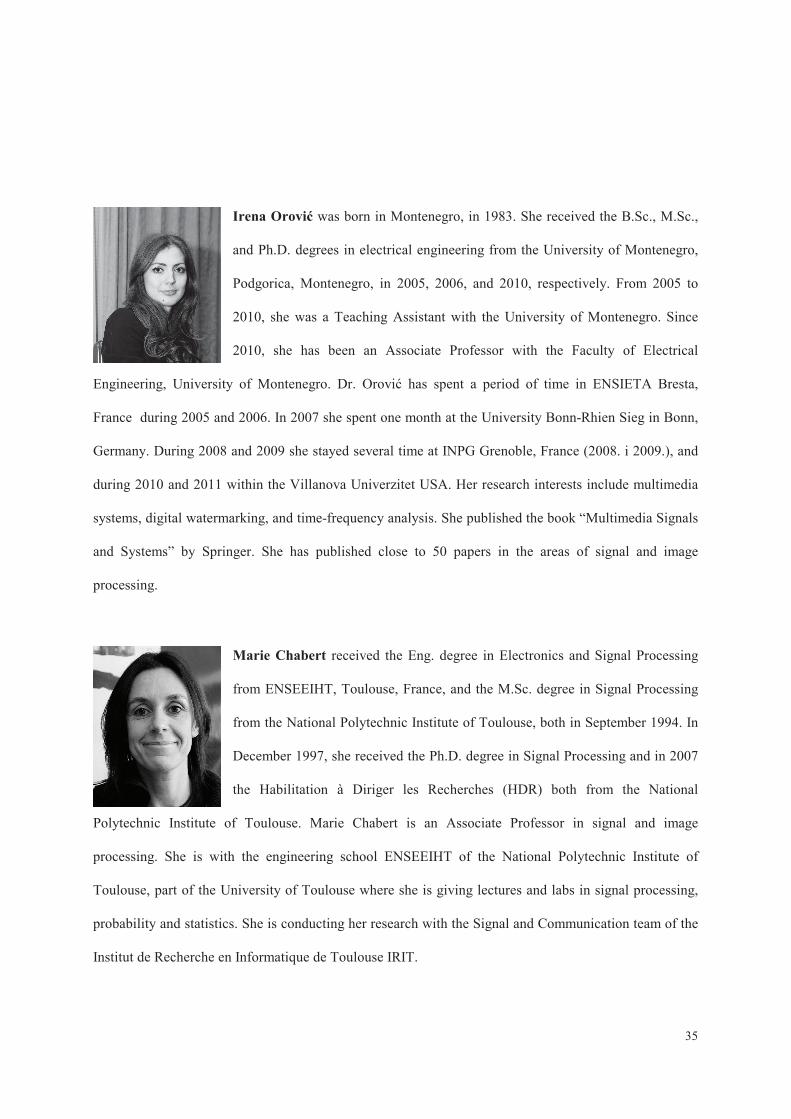
Irena Orović was born in Montenegro, in 1983. She received the B.Sc., M.Sc.,
and Ph.D. degrees in electrical engineering from the University of Montenegro,
Podgorica, Montenegro, in 2005, 2006, and 2010, respectively. From 2005 to
2010, she was a Teaching Assistant with the University of Montenegro. Since
2010, she has been an Associate Professor with the Faculty of Electrical
Engineering, University of Montenegro. Dr. Orović has spent a period of time in ENSIETA Bresta,
France during 2005 and 2006. In 2007 she spent one month at the University Bonn-Rhien Sieg in Bonn,
Germany. During 2008 and 2009 she stayed several time at INPG Grenoble, France (2008. i 2009.), and
during 2010 and 2011 within the Villanova Univerzitet USA. Her research interests include multimedia
systems, digital watermarking, and time-frequency analysis. She published the book “Multimedia Signals
and Systems” by Springer. She has published close to 50 papers in the areas of signal and image
processing.
Marie Chabert received the Eng. degree in Electronics and Signal Processing
from ENSEEIHT, Toulouse, France, and the M.Sc. degree in Signal Processing
from the National Polytechnic Institute of Toulouse, both in September 1994. In
December 1997, she received the Ph.D. degree in Signal Processing and in 2007
the Habilitation à Diriger les Recherches (HDR) both from the National
Polytechnic Institute of Toulouse. Marie Chabert is an Associate Professor in signal and image
processing. She is with the engineering school ENSEEIHT of the National Polytechnic Institute of
Toulouse, part of the University of Toulouse where she is giving lectures and labs in signal processing,
probability and statistics. She is conducting her research with the Signal and Communication team of the
Institut de Recherche en Informatique de Toulouse IRIT.
36
Her research interests include non-uniform sampling, time-frequency diagnosis and condition monitoring,
statistical modeling of heterogeneous data in remote sensing. She is a member of the IEEE.
She is member of the CNU section 61 since 2010.
Bijan Mobasseri received the B.S., M.S., and Ph.D. degrees from Purdue
University, West Lafayette, IN, all in electrical engineering. He is currently a
Professor of electrical and computer engineering with Villanova University,
Villanova, PA. He is currently funded by the Office of Naval Research/NUWC
for developing fundamental ideas for robust information embedding and detection
in sonar propagating through underwater acoustic channels. He was a Visiting
Scientist at the Naval Undersea Warfare Center (NUWC) Division Newport in the summer of 2007. He
was the Guest Editor for the 2010 EURASIP Journal on Advances in Signal Processing Special Issue on
Time-Frequency Analysis and Its Applications to Multimedia Signals. His current research interests
include image classification for through-the-wall radar imaging data, sonar signal processing in
underwater acoustic channels, and data compression.


![Optimization of Digital Image Watermarking Scheme Using ... · image geometrically. Wang et al. [5] proposed an image watermarking scheme in spatial domain and applied classification](https://static.fdocuments.in/doc/165x107/5edcf6afad6a402d6667df18/optimization-of-digital-image-watermarking-scheme-using-image-geometrically.jpg)
![Www.fakengineer.com [1] AN ANALYSIS OF DIGITAL WATERMARKING IN FREQUENCY DOMAIN.](https://static.fdocuments.in/doc/165x107/55145e2c550346284e8b5782/wwwfakengineercom-1-an-analysis-of-digital-watermarking-in-frequency-domain.jpg)


