Spatial damping identi cation in the frequency domain - …lab.fs.uni-lj.si/ladisk/data/pdf/Spatial...
17
Spatial damping identification in the frequency domain - a theoretical and experimental comparison Matija Brumat, Janko Slaviˇ c, Miha Bolteˇ zar University of Ljubljana, Faculty of Mechanical Engineering, Laboratory for dynamics of machines and structures, Aˇ skerˇ ceva 6, 1000 Ljubljana, SI, Slovenia May 26, 2016 Cite as: Matija Brumat, Janko Slaviˇ c and Miha Bolteˇ zar Spatial damping identification in the frequency domain – A Theoretical and Experimental Comparison. Journal of Sound and Vibration, 376:182 – 193, 2016 DOI: 10.1016/j.jsv.2016.04.006 Abstract This paper deals with spatial damping identification methods. In contrast to the commonly used damping methods (modal, proportional) the spatial damping information improves struc- tural models with a known location of the damping sources. The Lee-Kim, Chen-Ju-Tsuei, Fritzen IV and local equation of motion methods were theoretically and experimentally com- pared. Experimentally, the spatial damping identification was tested against: modal and spa- tial incompleteness, differences in viscous and hysteretic damping models, the performance of identification methods and the effect of damping treatments. It was found that for a struc- ture with a known equation of motion (beam, plate) the local equation of motion method is more efficient and gives a more precise location of the damping. Full frequency response func- tion (FRF) matrix methods can also identify the spatial damping, but are more demanding because the numerical and measurement effort increases with n 2 , where n is the number of measurement points and, consequently, the size of the FRF matrix. 1
Transcript of Spatial damping identi cation in the frequency domain - …lab.fs.uni-lj.si/ladisk/data/pdf/Spatial...

Spatial damping identification in the frequency domain - a
theoretical and experimental comparison
Matija Brumat, Janko Slavic, Miha BoltezarUniversity of Ljubljana, Faculty of Mechanical Engineering,
Laboratory for dynamics of machines and structures,Askerceva 6, 1000 Ljubljana, SI, Slovenia
May 26, 2016
Cite as:Matija Brumat, Janko Slavic and Miha Boltezar
Spatial damping identification in the frequency domain – A Theoretical andExperimental Comparison.
Journal of Sound and Vibration, 376:182 – 193, 2016DOI: 10.1016/j.jsv.2016.04.006
Abstract
This paper deals with spatial damping identification methods. In contrast to the commonlyused damping methods (modal, proportional) the spatial damping information improves struc-tural models with a known location of the damping sources. The Lee-Kim, Chen-Ju-Tsuei,Fritzen IV and local equation of motion methods were theoretically and experimentally com-pared. Experimentally, the spatial damping identification was tested against: modal and spa-tial incompleteness, differences in viscous and hysteretic damping models, the performance ofidentification methods and the effect of damping treatments. It was found that for a struc-ture with a known equation of motion (beam, plate) the local equation of motion method ismore efficient and gives a more precise location of the damping. Full frequency response func-tion (FRF) matrix methods can also identify the spatial damping, but are more demandingbecause the numerical and measurement effort increases with n2, where n is the number ofmeasurement points and, consequently, the size of the FRF matrix.
1

1 Introduction
Damping, combined with mass and stiffness, represents the dynamic properties of a structure,and its identification is important for validating and building analytical/numerical models incivil, mechanical and aerospace engineering. Damping in linear mechanical systems is normallyidentified using a method such as logarithmic decay [1] in the time domain, the continuous wavelettransform [2] and the Morlet wave [3] in the time-frequency domain or the half-power point [1],the closed-form solution [4] and the first-order perturbation [5] in the frequency domain. In themodal domain the Error Matrix Method was extended to locate the damping sources on thestructure [6]. However, most of the described methods can be applied to viscous damping, only.Examples, where an exact damping spatial location is needed, are: the identification of dampingsources on existing structures and the precise application of a damping treatment. However, thetypically used damping-identification methods [1, 7] do not provide spatial information (dampingdistribution throughout the structure).
An alternative approach is to use direct damping-identification methods that were developedfor the identification of the damping distribution directly from the frequency-response functions(FRFs) without a transformation to the modal coordinates. The first is the widely used FritzenIV method [9], where IV stands for Instrumental Variable. Instrumental variable methods weredeveloped for an unbiased estimation of the model parameters [9, 10] in comparison with least-squares methods, which are biased due to the noisy measurement data [9]. In 1996 Chen et al.presented a method [11] that identifies the damping separately from the mass and stiffness basedon the imaginary and the real properties of the FRF. A simplified version of the Chen, Ju andTsuei’s [11] method is Lee and Kim’s dynamic stiffness method [12] (it requires only one matrixinverse, resulting in a smaller error). To improve the damping identification on real structuresArora et al. [13] proposed a two-step procedure. In the first step, the mass and stiffness matricesare updated using FRF data, and in the second step, the damping matrix is identified usingupdated mass and stiffness matrices from the previous step. The two-step approach relates thedisplacements to the material properties, which can also be made using the local equation ofmotion method [14], presented recently by Ablitzer et al. Some direct methods, not considered inthis research, are reviewed in [4, 5, 15].
Besides a theoretical and experimental comparison of the methods, this research focuses on theexperimental effects of: the modal incompleteness, the spatial incompleteness and the dampingmodel. Modal incompleteness deals with the limited frequency span over the number of modes,whereas the spatial incompleteness covers the effects of the non-measured points on the structure.Modal and spatial incompleteness for spatial damping have been studied numerically [5, 16] andexperimentally [15] on low-DOF models.
2 Theoretical background
In this section the background to the direct damping identification methods is briefly presented [1].Each method will be presented for both types of the most common linear-damping models: theviscous and the hysteretic.
In contrast to the viscous damping model, one must be careful when using a hysteretic modelas it does not satisfy the causality requirement [17, 18]. Further details are given in [19].
The starting point for the frequency-based, direct-damping identification methods is the fre-quency response function (FRF) matrix H(ω). Assuming a viscous linear system and harmonicexcitation/response at frequency ω, the general second-order equation of motion with the viscousdamping can be written in the frequency domain as:[
K − ω2 M + iωC]
X(ω) = F(ω) (1)
where M is the mass matrix, C is the viscous-damping matrix and K is the stiffness matrix. Theremaining parts of (1) are the imaginary unit i2 = −1, the Fourier transforms of the response
2

X(ω) and the force vector F(ω). From Eq. (1), the FRF matrix H(ω) is defined as:
X(ω) = H(ω) F(ω) (2)
and furthermore:
H(ω) =[K − ω2 M + iωC
]−1(3)
The dynamic stiffness matrix Z(ω) is defined as the matrix inverse of H(ω) for each frequencypoint ω:
Z(ω) = H(ω)−1 =[K − ω2 M + iωC
](4)
Chen et al. [11] also define the undamped or “normal” FRF HN (ω) as:
HN (ω) = [ZN (ω)]−1
=[K − ω2 M
]−1(5)
2.1 Chen, Ju and Tsuei’s method
The method proposed by Chen et al. (1996) [11] identifies the damping matrix in a separate stepfrom the stiffness K and mass M matrix using measurements based on the imaginary and realproperties of the FRF as follows. The general equation of motion Eq. (1) can then be written asa combination of the normal FRF HN (ω) and the damping:
[HN (ω)]−1 X(ω) + iωC X(ω) = F(ω) (6)
Multiplying both sides of Eq. (6) by HN (ω) from the left gives:
X(ω) + iωHN (ω) C X(ω) = HN (ω) F(ω) (7)
Defining the transformation matrix T(ω):
T(ω) = ωHN (ω) C (8)
and recalling that X(ω) = H(ω) F(ω), Eq. (7) can be simplified to:
HN (ω) = [I + i T(ω)] H(ω) (9)
The real and imaginary parts of Eq. (9) are then rewritten separately:
HN (ω) = [Re(H(ω)) − T(ω) Im(H(ω))]
+ i [T(ω) Re(H(ω)) + Im(H(ω))] (10)
The transformation matrix T(ω) and the normal FRF matrix HN (ω) are real by definition; there-fore, it follows that the imaginary part of Eq. (10) equals 0:
Im(HN (ω)) = 0 (11)
= [T(ω) Re(H(ω)) + Im(H(ω))]
From Eq. (11) it is clear that the transformation matrix T(ω) can be defined only with the matrixH(ω):
T(ω) = −Im(H(ω)) [Re(H(ω))]−1 (12)
The remaining real part of Eq. (10) defines the relationship between the normal and the measuredFRF matrix:
HN (ω) = Re(H(ω)) − T(ω) Im(H(ω)) (13)
3

With the measured H(ω), the transformation matrix T can be identified. Consequently, fromEq. (8) the damping matrix can also be identified as:
C = − 1
ω[HN (ω)]−1
[Im(H(ω)) [Re(H(ω))]−1
](14)
A similar procedure would result in the identification of the hysteretic damping matrix [20]:
D = −[HN (ω)]−1[Im(H(ω)) [Re(H(ω))]−1
](15)
2.2 Lee and Kim’s method
Lee and Kim (2001) [12] suggested a simpler procedure than Chen, Ju and Tsuei’s method, withonly one matrix inverse for a more numerical error-prone identification. Using Eq. (4) the viscousdamping matrix can be obtained directly from the imaginary part of the dynamic stiffness matrixZ(ω):
Im(Z(ω)) = Im([H(ω)]−1) = ωC, (16)
Rearranging Eq. (16) to isolate the viscous-damping matrix C gives:
C =1
ωIm([H(ω)]−1) (17)
Method is not limited to the viscous damping [21], for example, the hysteretic-damping matrixversion of Eq. (17) is:
D = Im([H(ω)]−1) (18)
2.3 Instrumental variable method
The instrumental variable (IV) method is used to estimate the causal relationships in economet-rics [5]; Fritzen (1986) [9] applied the method to structural dynamics. From Eq. (4) it follows thatmultiplying the FRF matrix H(ω) by the dynamic stiffness Z(ω) results in the identity matrix I.With a measured H(ω), the error E(ω):
H(ω) Z(ω) = I + E(ω) (19)
can therefore be minimised for the structural parameter (M, K, C, D) identification via thedynamic stiffness Z(ω) Eq. (4):
Z(ω) =[−ω2 M + iωC + K
]=[−ω2 I iωI I
] MCK
(20)
Combining Eq. (19) and Eq. (20) gives:
[−ω2 H(ω) iωH(ω) H(ω)
]︸ ︷︷ ︸A(ω)
MCK
︸ ︷︷ ︸
P
= I + E(ω) (21)
The structural parameters P are estimated from Eq. (21) as:
P = [A(ω)]−1 (I + E(ω)) = [A(ω)]−1 I + [A(ω)]−1 E(ω) (22)
where [A(ω)]−1 E(ω) represents the systematic error (bias) in the parameter estimation. For anunbiased estimation of P we now define a new variable named the instrumental variable IV,
4

which is correlated with P and uncorrelated with the systematic errors [9] and has the followingproperties:
plimp→∞
{1
pIVT E
}= 0 and nonsingular (23)
where plim denotes probability limit and p is the number of measurements. Eq. (23) impliesthat the bias is reduced to zero IVT E = 0 if the estimation is made using a large number ofmeasurement points. To continue, the error E is isolated from Eq. (21) and both sides have to bemultiplied by instrumental variable IVT :
IVT E(ω) = IVT I − IVTA(ω) P (24)
Taking account of the definition Eq. (23), the left-hand side of Eq. (24) equals 0. The structuralparameters P are finally estimated from Eq. (24):
P =[IVTA(ω)
]−1IVT I (25)
The choice of instrumental variable is open to the user; Fritzen [9] and Phani and Wood-house [15] recommend using a reconstructed FRF Eq. (2) from the matrices (M, C and K),identified using Chen, Ju and Tsuei’s or Lee and Kim’s method IV(ω) = H(ω)reconstructed. Theiterative form of Fritzen’s IV method (to use the identified parameters for the next step instru-mental variable) improves the parameter estimation [9, 15] and can be regarded as an iterativeversion of Lee and Kim’s method with a predefined convergence criterion [5]. For the hystereticversion of the method the hysteretic damping i D instead of the viscous damping part iωC shouldbe used in the respective equations.
2.4 Local equation of motion method
The method recently presented by Ablitzer et al. [14] is, in this paper, extended for beam structuresand for viscous damping. The equation of motion for the displacement response w of an isotropicEuler-Bernoulli beam with hysteretic damping in the steady state is [22]:
ρA∂2w
∂t2+ E(1 + i η) I
∂4w
∂x4= f(x, t) (26)
where ρ is the density, A is the cross-section, E is the elastic modulus, η is the hysteretic dampingratio, I is the second moment of area and f(x, t) is the point harmonic excitation force at thefrequency ω, respectively. The viscous damping [23] equation differs only slightly:
ρA∂2w
∂t2+ E I
∂4w
∂x4+ γ
∂w
∂t= f(x, t) (27)
where γ is the viscous damping constant per unit length. the harmonic response w(x, t) can bewritten using the method of separation of variables as:
w(x, t) = W (x) sin(ω t) (28)
where W is response of the beam and is only dependent on the position on the beam x. Thedesignation of the dependency on x will be omitted from here on for reasons of clarity. The partialtime derivatives in Eq. (26) and Eq. (27) can then be expressed as:
∂2w
∂t2= −ω2W sin(ω t) (29)
and:
∂w
∂t= iωW sin(ω t) (30)
5

The fourth derivative is approximated at the measurement point j by the finite-difference schemeδ4j :
∂4w
∂x4= δ4j sin(ω t) (31)
δ4j =1
∆4x
(Wj+2 − 4Wj+1 + 6Wj − 4Wj−1 +Wj−2) (32)
where ∆x is the measurement mesh spacing. Combining Eq. (26) with Eq. (29) and Eq. (31) forthe measurement point j we obtain:
−ρAω2Wj sin(ω t) + Ej(1 + i ηj) I δ4j sin(ω t) = f(xj , t) (33)
When the excitation is applied outside the observation area (Fig. 1), the right-hand side of Eq. (33)is f(xj , t) = 0 and Eq. (33) can be separated into real and imaginary parts:
Ej =ρAω2
IRe
[Wj
δ4j
](34)
ηj =ρAω2
E IIm
[Wj
δ4j
](35)
For a viscous system the real part is the same as in Eq. (34) and the damping per unit length γjat the measurement point j is:
γj = − Ej I
ωIm
[δ4jWj
](36)
The discrete viscous damping cj is obtained from the damping per unit length γj as:
cj = γj ∆x (37)
The presented approach is straightforward to use, but better results due to measurement-noiseamplification in the fourth-order derivation can be obtained with a two-step regularization [14].First, both fields δ4j and Wj are multiplied by a spatial Tukey window for the boundary-effectsattenuation and in the second step each field is convolved with the discrete spatial response of alow-pass filter. The width of the filter kernel is defined by the spatial cut-off wavelength λc, e.g.,λc = 50 mm, details are given in [14].
3 Experiments
An experiment was conducted on the three equal-sized, free-free, beam specimens to comparethe direct-damping identification methods. The specimens are: a) a plain beam - beam A, b)with an asymmetrically added local viscous damper - beam B and c) with a constrained layerdamping (CLD) - beam C, see Fig. 2. The beam specimens B and C have an asymmetricallyapplied damping treatment over a restricted area of the beam in order to know the dampingspatial location. Three samples were considered to emphasize the effect of the different dampingtreatments on the identified spatial location in the subsequent discussion.
3.1 Plain free-free beam
The beam A was a plain steel beam with a constant cross-section h× b = 1 mm × 30 mm, lengthl = 400 mm, mass m = 92.6 g and Young’s modulus E = 210000 MPa. The beam dimensions wereselected to have a low modal overlap and to have a large number of modes in the frequency spanup to 3000 Hz. The beam is shown in Fig. 2(a). Two soft springs (stiffness ≈ 50 N/m) were usedat each beam boundary in the y-direction to limit the rigid-body translation after the impact.
6

3.2 Free-free beam with added discrete viscous damper
The beam B was a similar steel beam to beam A, but an additional viscous damper was added be-tween points 5 and 8, see Fig. 2(b). The discrete damper is based on the design of Rijnen et. al. [24],with each damper being made from two rubber blocks of size 5x5x1 mm glued with cyanoacrylateto the beam and connected with aluminium struts of size 80x5x5 mm.
3.3 Free-free beam with added constrained layer damper
The beam C was the steel beam used as beam A, but it had attached a constrained layer damper,as shown in Fig. 2(c). The visco-elastic layer for the application was 3M 112P02 damping ma-terial [25]. The steel constraining layer was of the same material and thickness as the beam inorder to maximize the damping [25]. Holes were drilled in the constraining layer to measure thresponses of the beam, only.
3.4 Measurement setup
The measurement setup is shown in Fig. 3. A custom-made solenoid impactor with a PCB 086E80force sensor was used for the repeatable impulse excitation (described later). The response (ve-locity) measurements employed a Polytec PDV100 laser vibrometer. The impactor/laser-basedmeasurement allows for a non-contact measurement without any structural modification due tothe added stiffness or mass from the sensors or shakers. The data acquisition and the signalprocessing were undertaken in the custom python software environment using the pyDAQmx li-brary [26] to interface with the NI 9215 acquisition hardware. The sampling rate was 100 kHz andthe signal was captured for 10 seconds. Other details considered during the experiment are:
• The structure is sequentially excited at 15 points and responses are measured at the same15 points in the y direction (15x15 excitation-response pairs, n = 15), as shown in Fig 3
• For the local equation of motion method (see Section 2.4) a denser measurement mesh isneeded due to the fourth-order spatial differentiation and subsequent filtering, see Eq. (32).The structure was excited at point 15 and between points 3 and 11 an additional 100, equallyspaced, responses were measured to obtain the 2.5-mm-measurement mesh.
• Internal low- and high-pass filters in the PDV100 vibrometer were set to 22 kHz and 0.1 Hz,respectively [27].
• The instrumentation phase error was compensated using the time-shift approach from [15]
• Each excitation-response point was measured three times to obtain the averaged H1 estima-tor (mobility FRF).
• The mobility FRFs were divided by iω in the frequency domain to obtain the receptanceFRFs [1].
3.4.1 Solenoid impactor
The solenoid impactor is based on the designs of [28, 29] and is built using a 24-V push-typesolenoid with a 30-mm diameter. For a faster acceleration of the solenoid core and thus theimpact force, the solenoid should be driven at a higher voltage (due to the solenoid’s windinginductance). The impact is triggered using a microcontroller-based MOSFET switch with a mi-crosecond resolution. For a 40-V supply a solenoid needs 5 milliseconds of open switch to travel5 mm and impacts with a 14-N peak force and a duration of approximately 0.15 ms, see Fig. 4.
7

4 Analysis and discussion
For each beam 675 (225 points with 3 averages) measured responses were assembled into a full FRFmatrix of size 15×15, used by the direct damping identification methods. Fig. 5 shows an exampleof the measured receptance magnitude FRF at the pair 15-10 for all three beams; where 15-10denotes the 15th excitation and the 10th response point (this designation will be used throughoutthe paper). From the FRFs it is clear that the damping treatment of beams B and C affects thehigh-frequency region more than the low-frequency region. Furthermore, the added stiffness andthe mass due to the damping treatment barely shift the eigenfrequencies, see Fig. 5.
In contrast to the damping amplitudes at the eigenfrequencies, the damping spatial locationis the focus of this research. Before using viscous and hysteretic damping matrix identificationmethods, the measured FRFs have to be tested for repeatability, linearity and most importantlyfor FRF reciprocity. For a damping model with a symmetric damping matrix the reciprocity isexpected [30]. Nevertheless, the measured FRFs deviate from reciprocity in some details (seeFig. 6), which is often the case in experimental measurements [15, 31]. The observed deviationsof the reciprocity can be eliminated using FRF matrix symmetrisation at every frequency pointusing [32]:
H(ω) = 0.5[H(ω) + HT (ω)
](38)
Any non-symmetry in the identified damping matrices after this step is due to the identificationprocedure only.
4.1 Modal incompleteness
The modal incompleteness is presented in detail using the Lee-Kim method, see Eq. (17). Fig. 7shows the absolute values of the identified viscous damping matrix C for beam B using a frequencyrange of five (0-200 Hz), ten (0-1100 Hz) and fifteen modes (0-3000 Hz). The larger numericalvalues (e.g. 150 Ns/m in Fig. 7) represent areas of higher damping. The identified matrices aresymmetric.
Focusing on the identified values in Fig. 7 reveals higher damping values at the points of theapplied damping for beam B (left point 4 and right point 9 of the discrete damper).
Comparing the high modal incompleteness with the low incompleteness model it is clear thatthe spatial location of the damping becomes localised when the modal incompleteness is sufficientlylow, see Fig. 7. The frequency range of at least ten modes should be used for an accurate viscousdamping location - similar conclusions were found in a theoretical study [16].
A theoretical explanation for the modal incompleteness on the identification of the spatialdamping matrix C seen in Fig. 7 is given in [33, 34, 16]. The authors conclude that it is impossibleto identify the structural parameters of a real mechanical system from a FRF matrix, measuredover a limited frequency range.
Modal incompleteness affects the Chen-Ju-Tsuei and Fritzen methods in a similar way to theLee-Kim method, as all three methods are based on the complex properties of the FRF function,but for reasons of brevity the details are not provided here. The local equation of motion methodrequires a different analysis and will be discussed later.
4.2 Spatial incompleteness
The spatial incompleteness test was made using the full FRF matrix (15 modes) with deleted rowsand columns. These deleted rows and columns can be understood as degrees of freedom (DOF)that were not measured (columns represent response DOFs and rows represent excitation DOFs).
Fig. 8 shows the identified matrix using the Lee-Kim method for four DOFs (i.e., 1, 5, 10, 15)and eight DOFs (i.e., 1, 3, 5, 7, 9, 11, 13, 15). Comparing the results for the 15 modes shown inFig. 7 with Fig. 8 the redistribution of damping over the neighbouring spatial location is observed.The high damping area around the pair 4-9 in Fig. 7 (15 modes) is in the spatially incompletecases redistributed because of the missing information. In the case of 8 DOF the redistribution
8

is to the pair 5-11 and in case of 4 DOF over the complete damping matrix. Low DOF modelsalso tend to have larger damping values because the amount of damping present in the structureis redistributed over fewer DOFs.
The spatial incompleteness is related to the modal incompleteness [33, 34, 16], e.g., from theexperimental modal analysis it is clear that the number of extracted mode shapes depends on theFRF matrix H(ω) shape.
4.3 Viscous vs. hysteretic damping
Fig. 9 shows the absolute values of the identified hysteretic damping matrix of beam B using thehysteretic Lee-Kim method (Eq. 18) for a frequency span of 15 modes. The identified dampingdistribution is similar to the viscous one, see the 15 modes result in Fig. 7.
If the comparison with the classic approach using hysteretic proportional damping [1] is made,the damping values close to the pair 4-9 are approximately 10 % (whereas the other points are2 %) of the stiffness value for the same coordinate. The identified hysteretic damping valuescould be approximated as the fractions of the stiffness D = β10 K10 + β2 K2, where βp is theproportional damping factor, p is the damping value index and Kp is the stiffness matrix of thenon-zero elements over the points of different damping values.
The localisation performance of the identification method is independent of the choice betweenthe hysteretic and the viscous model. The advantage of using the hysteretic model over the viscousthus lies in its ability to be approximated with the stiffness matrix, but care must be taken as themodel does not satisfy the causality requirement [17, 18].
4.4 Identification methods
In this section the Lee-Kim (Eq. 17), Chen-Ju-Tsuei (Eq. 14), Fritzen IV (Eq. 25) and the localequation of motion method (Eq. 36) are compared. Fig. 10 shows the identified viscous dampingmatrix (frequency span of 15 modes) for the Chen-Ju-Tsuei and Fritzen IV method and Fig. 11 forthe local equation of motion method. The Lee-Kim and Chen-Ju-Tsuei methods give comparableresults with regards to values and locations. On the other hand, the Fritzen IV method givesdamping values of the same order, but the damping locations around the left point - 5 on thebeam B are distorted. The identified damping matrix C of the Fritzen IV method is also morerobust with respect to noise than the Lee-Kim and Chen-Ju-Tsuei method (e.g., the values atthe points outside the damped region close to zero - no damping there). Similar conclusions werefound in [15]
A direct comparison of the results from Fig. 10 with the local equation of motion is notpossible; the result of the local equation of motion method is not the damping matrix C, butthe local damping value at each measuring point. The damping is also identified at the selectedfrequency, only.
Fig. 11 shows the identified damping with the local equation of motion method for the fre-quencies 1150, 1840 and 3100 Hz with a spatial cut-off of λc = 20 mm at the location between30 and 240 mm of the discretely damped beam - B. Higher damping values can be found at 120mm and at 200 mm (location of the discrete damper), see Fig. 2. The lower frequencies are morecontaminated with noise (locations 50-100 mm).
If the structure has a known equation of motion (plate, beam) then the local equation of motionmethod can be used as it is more robust with respect to modal and spatial incompleteness (due tothe required finer measurement mesh and the easier measurement procedure for obtaining a largenumber of responses). On the other hand, full FRF matrix-identification methods do not requireany a-priori knowledge about the structure under investigation.
4.5 Effect of damping treatment on the spatial location
In this section the Lee-Kim method for a frequency span of 15 modes is used to evaluate thedifferent damping treatments. The identified viscous damping matrix for beam B was already
9
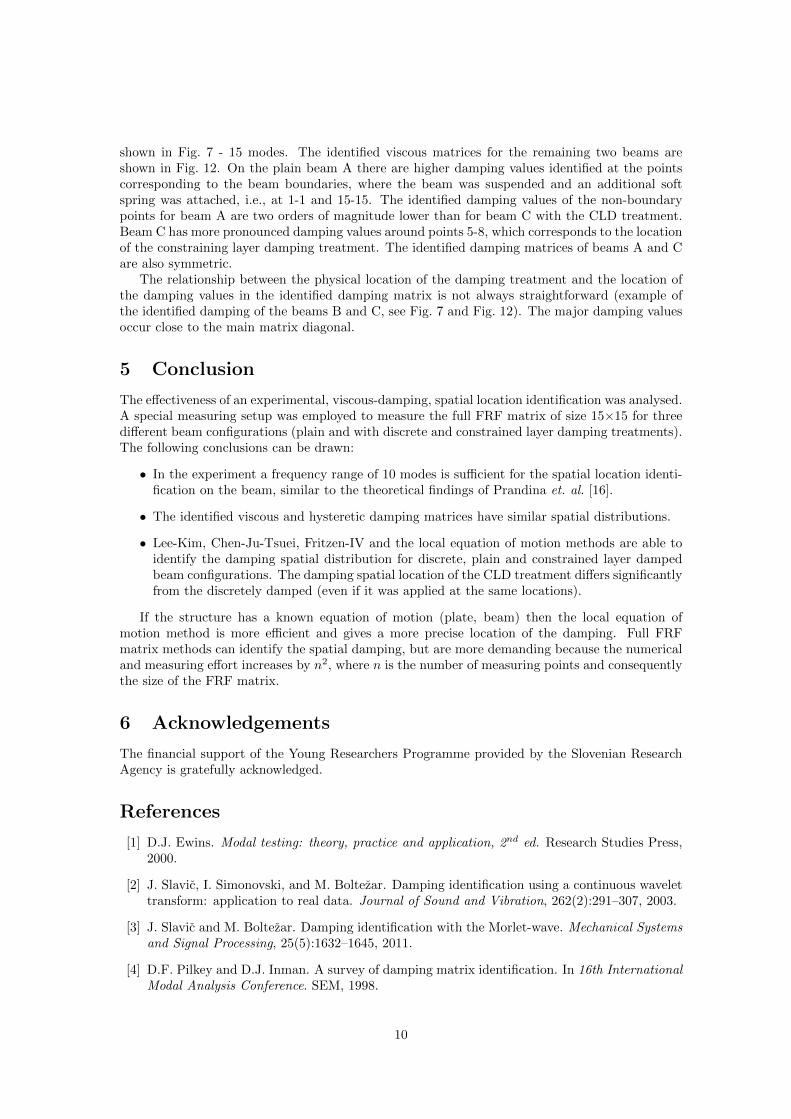
shown in Fig. 7 - 15 modes. The identified viscous matrices for the remaining two beams areshown in Fig. 12. On the plain beam A there are higher damping values identified at the pointscorresponding to the beam boundaries, where the beam was suspended and an additional softspring was attached, i.e., at 1-1 and 15-15. The identified damping values of the non-boundarypoints for beam A are two orders of magnitude lower than for beam C with the CLD treatment.Beam C has more pronounced damping values around points 5-8, which corresponds to the locationof the constraining layer damping treatment. The identified damping matrices of beams A and Care also symmetric.
The relationship between the physical location of the damping treatment and the location ofthe damping values in the identified damping matrix is not always straightforward (example ofthe identified damping of the beams B and C, see Fig. 7 and Fig. 12). The major damping valuesoccur close to the main matrix diagonal.
5 Conclusion
The effectiveness of an experimental, viscous-damping, spatial location identification was analysed.A special measuring setup was employed to measure the full FRF matrix of size 15×15 for threedifferent beam configurations (plain and with discrete and constrained layer damping treatments).The following conclusions can be drawn:
• In the experiment a frequency range of 10 modes is sufficient for the spatial location identi-fication on the beam, similar to the theoretical findings of Prandina et. al. [16].
• The identified viscous and hysteretic damping matrices have similar spatial distributions.
• Lee-Kim, Chen-Ju-Tsuei, Fritzen-IV and the local equation of motion methods are able toidentify the damping spatial distribution for discrete, plain and constrained layer dampedbeam configurations. The damping spatial location of the CLD treatment differs significantlyfrom the discretely damped (even if it was applied at the same locations).
If the structure has a known equation of motion (plate, beam) then the local equation ofmotion method is more efficient and gives a more precise location of the damping. Full FRFmatrix methods can identify the spatial damping, but are more demanding because the numericaland measuring effort increases by n2, where n is the number of measuring points and consequentlythe size of the FRF matrix.
6 Acknowledgements
The financial support of the Young Researchers Programme provided by the Slovenian ResearchAgency is gratefully acknowledged.
References
[1] D.J. Ewins. Modal testing: theory, practice and application, 2nd ed. Research Studies Press,2000.
[2] J. Slavic, I. Simonovski, and M. Boltezar. Damping identification using a continuous wavelettransform: application to real data. Journal of Sound and Vibration, 262(2):291–307, 2003.
[3] J. Slavic and M. Boltezar. Damping identification with the Morlet-wave. Mechanical Systemsand Signal Processing, 25(5):1632–1645, 2011.
[4] D.F. Pilkey and D.J. Inman. A survey of damping matrix identification. In 16th InternationalModal Analysis Conference. SEM, 1998.
10

[5] A. Srikantha Phani and J. Woodhouse. Viscous damping identification in linear vibration.Journal of Sound and Vibration, 303(3–5):475 – 500, 2007.
[6] J. He Identification of structural dynamic characteristics. Ph.D. thesis, Department of Me-chanical Engineering Imperial College, London, 1987.
[7] M.I. Friswell and J.E. Mottershead. Finite Element Model Updating in Structural Dynamics.Kluwer, 1995.
[8] J.E. Mottershead, M. Link, and M.I. Friswell. The sensitivity method in finite element modelupdating: A tutorial. Mechanical Systems and Signal Processing, 25(7):2275–2296, 2011.
[9] C.P. Fritzen. Identification of mass and stiffness matrices of mechanical system. Transactionof ASME, Journal of Vibration, Acoustics, Stress and Reliability in Design, 108:9–16, 1986.
[10] J.E. Mottershead and C.D. Foster. An instrumental variable method for the estimation ofmass, stiffness and damping parameters from measured frequency response functions. Me-chanical Systems and Signal Processing, 2(4):379–390, 1988.
[11] S.Y. Chen, M.S. Ju, and Y.G. Tsuei. Estimation of Mass, Stiffness and Damping Matri-ces from Frequency Response Functions. Transaction of ASME, Journal of Vibration andAcoustics, 118:78–82, 1996.
[12] J.-H. Lee and J. Kim. Development and Validation of a New Experimental Method to IdentifyDamping Matrices of a Dynamic System. Journal of Sound Vibration, 246:505–524, 2001.
[13] V. Arora, S.P. Singh, and T.K. Kundra. Finite element model updating with damping iden-tification. Journal of Sound and Vibration, 324(3–5):1111 – 1123, 2009.
[14] F. Ablitzer, C. Pezerat, J.-M. Genevaux, and J. Begue. Identification of stiffness and dampingproperties of plates by using the local equation of motion. Journal of Sound and Vibration,333(9):2454–2468, 2014.
[15] A. Srikantha Phani and J. Woodhouse. Experimental identification of viscous damping inlinear vibration. Journal of Sound and Vibration, 319(3–5):832 – 849, 2009.
[16] M. Prandina, J.E. Mottershead, and E. Bonisoli. An assessment of damping identificationmethods. Journal of Sound and Vibration, 323(3–5):662 – 676, 2009.
[17] S. H. Crandall. The role of damping in vibration theory. Journal of Sound and Vibration,11(1), 1970.
[18] R. H. Scanlan. Linear damping models and causality in vibrations. Journal of Sound andVibration, 13(4):499–503, 1970.
[19] G. B. Muravskii. On frequency independent damping. Journal of Sound and Vibration,274(3–5):653–668, 2004.
[20] V. Arora. Direct structural damping identification method using complex FRFs. Journal ofSound and Vibration, 339:304–323, 2015.
[21] G.O. Ozgen and J.H. Kim. Direct identification and expansion of damping matrix forexperimental-analytical hybrid modeling. Journal of Sound and Vibration, 308(1–2):348–372,2007.
[22] J.-L. Guyader. Vibration in continuous media. ISTE, Newport Beach, CA, 2006.
[23] H.T. Banks and D.J. Inman. On damping mechanisms in beams. Transaction of ASME,Journal of Applied Mechanics, 58:716–723, 1991.
11

[24] M.W.L.M. Rijnen, F. Pasteuning, R.H.B. Fey, G. van Schothorst, and H. Nijmeijer. A nu-merical and experimental study on viscoelastic damping of a 3d structure. Journal of Soundand Vibration, In Press, Corrected Proof.
[25] 3MTM viscoelastic damping polymeres 112-130 technical data, 2012.
[26] P. Clade. pyDAQmx: a Python interface to the National Instruments DAQmx driver, 2015.
[27] Polytec Portable Digital Vibrometer PDV 100 user manual, 2003.
[28] P.E. Norman, G. Jung, C. Ratcliffe, R. Crane, and C. Davis. Development of an AutomatedImpact Hammer for Modal Analysis of Structures. Technical report, DSTO Defence Scienceand Technology Organisation, Australia, 2012.
[29] J. Pribosek and J. Diaci. Electromagnetic microforging apparatus for low-cost fabrication ofmolds for microlens arrays. Journal of Micromechanics and Microengineering, 25(6):065018,2015.
[30] J. Woodhouse. Linear damping models for structural vibration. Journal of Sound and Vi-bration, 215(3):547 – 569, 1998.
[31] F.E. Udwadia. A Note on Nonproportional Damping. Journal of Engineering Mechanics,2009.
[32] I.Y. Bar-Itzhack. Matrix Symmetrization. Journal of Guidance, Control, and Dynamics,21(1):178–179, 1998.
[33] A. Berman and W.G. Flannelly. Theory of Incomplete Models of Dynamic Structures. AIAAJournal, 9(8):1481–1487, 1971.
[34] A. Berman. System identification of structural dynamic models – Theoretical and practicalbounds. In 25th Structures, Structural Dynamics and Materials Conference. AIAA, PalmSprings, CA, 1984.
12

response points
j+1 j j-1
excitation
observation area
Figure 1: Local equation of motion method; excitation point and observation area.
xz
y
(a)
(b)
measurement-excitation point
(c)1 2 3 4 5 6 7 8 9 10 11 12 13 14 15
constraining layer
1 2 3 45 6 7 8
9 10 11 12 13 14 15
rubber block
1 2 3 4 5 6 7 8 9 10 11 12 13 14 15
h
b
Figure 2: (a) plain beam specimen - beam A, (b) beam with added discrete viscous damper -beam B, (c) beam with added constrained layer damper - beam C
response pointexcitation point
xy
z
nn-1n-2...321
free-freesupport
solenoid impactor
laser vibrometer
Figure 3: Measurement setup.
13

24V push-solenoid
+40 VDC stablepower supply
microcontrollertriggered MOSFET
PCB 086E80force sensor
00 0.2time [ms]
forc
e [N
]
15
Figure 4: Detail of solenoid impactor with a typical excitation profile.
0 500 1000 1500 2000 2500 3000Frequency [Hz]
200
180
160
140
120
100
80
60
40
Mag
nit
ud
e [
dB
m/N
]
A - plain
B - discrete
C - CLD
Figure 5: Receptance magnitude FRF plot for point 15-10.
14

0 500 1000 1500 2000 2500 300016014012010080604020
Mag
nit
ud
e [
dB
m/N
]
H2− 14
H14− 2
0 500 1000 1500 2000 2500 3000
Frequency [Hz]
432101234
Ph
ase
[ra
d]
Figure 6: Reciprocity FRF plot for discretely damped beam B.
1 5 10 15
1
5
10
15exc
itati
on
poin
t 5 modes
1 5 10 15
response point
1
5
10
15
10 modes
1 5 10 15
1
5
10
15
15 modes
0
75
150
[Ns/
m]
Figure 7: Identified absolute valued viscous-damping matrix for beam B, 5, 10 and 15 modes.
1 5 10 15
response point
1
5
10
15exc
itati
on
poin
t
4 DOF
1 3 5 7 9 111315
response point
13579
111315
8 DOF
0
75
150
[Ns/
m]
Figure 8: Identified absolute valued viscous-damping matrix for the beam B of the reduced FRFmatrix.
15

1 5 10 15
response point
1
5
10
15
exc
itati
on
poin
thysteretic
0
115000
230000
[N/m
]
Figure 9: Identified absolute valued hysteretic-damping matrix for the discretely damped beamB.
1 5 10 15
1
5
10
15exc
itati
on
poin
t Lee-Kim
1 5 10 15
response point
1
5
10
15
Chen-Ju-Tsuei
1 5 10 15
1
5
10
15
Fritzen IV
0
75
150
[Ns/
m]
Figure 10: Identified absolute valued viscous-damping matrices for beam B.
16

50 100 150 200 250Beam location [mm]
0
20
40
60
80
100
120
140
160
Dam
pin
g [
Ns/
m]
1150 Hz
1840 Hz
3100 Hz
Figure 11: Identified absolute valued viscous damping for the local equation of motion for beamB at 1150, 1840 and 3100 Hz.
beam A - plain
1 15
1
15
beam C - CLD
response point1 5 15
1
5
15
exci
tati
onpo
int
response point
15
7.5
0
exci
tati
onpo
int
[Ns/
m]
120
60
0
[Ns/
m]
10
5
10
10 5 10
Figure 12: Identified absolute valued viscous-damping matrices for beams A and C. Please notethe different scales.
17