IMA World Health, Kasaï-Occidental 2014 technology report fileThe potential benefits of electronic...
18
TECNOLOGY REPORT - AMF 1 TECHNOLOGY REPORT West Kasai, Democratic Republic of Congo October to December 2014 Authors: AMF with input from IMA
Transcript of IMA World Health, Kasaï-Occidental 2014 technology report fileThe potential benefits of electronic...

TECNOLOGY REPORT - AMF 1
TECHNOLOGY REPORT West Kasai, Democratic Republic of Congo October to December 2014
Authors: AMF with input from IMA

TECNOLOGY REPORT - AMF 2
Contents
1. Executive Summary
2. Operational Decisions
3. Technology Decisions
1. Software
Data Collection software and app
2. Hardware
a) Electronic data collection devices
b) Portable computers
c) WiFi routers
d) Additional batteries
4. Field Operations
5. Data Analysis
6. Summary of Lessons Learned

TECNOLOGY REPORT - AMF 3
1. Executive Summary
Smartphones were used to collect registration information from all households receiving nets in a universal coverage mass net distribution campaign. This allowed a significant quantity of data to be captured directly in electronic form. The process proved very effective overall. It was not without problems but, importantly, demonstrated significant potential for future distributions.
91% of the nets distributed had data recorded electronically
96% of the household data records were without error We consider this a very strong outcome. This was the first use of smartphone data collection in a challenging distribution environment. It is also a strong basis from which to build. We are broadly confident the 9% of nets for which we do not have data in electronic form were distributed as intended for the following reasons:
Signed net movement forms are reported by IMA to show nets moved to the final distribution points as expected
Explanations from IMA as to why data was lost or not collected electronically are credible
Paper based records are reported by IMA to corroborate net distribution totals There is room for improvement in the following areas:
9% of the nets distributed did not have data recorded electronically Due to: o Failure of individual smartphones with no back up available for data collection o Issues with data being corrupted and not retrievable from the smartphones o Issues with the data transfer process leading to data loss
4% of the households had one error or more in the data recorded Due to: o Data inconsistencies within a household record (these can be designed out with
improvements to the logic mechanism i.e. acceptable answers during data entry) o Data anomalies within a household record suggesting data entry error (these can be
reduced with improved training and/or a verification step during data analysis) o No data analysis between data collection and nets being distributed (this can be reduced
if the distribution follows a separate registration phase) We intend to use the same data collection process in the next net distribution, adjusted to apply lessons learned.

TECNOLOGY REPORT - AMF 4
The potential benefits of electronic data collection (EDC) and how they applied in West Kasai are:
1. Acts against potential theft Data in electronic form can be shared widely and easily so net numbers can be tracked with precision and visibly. This inhibits theft, making occurrences obvious, quickly. There was no material loss of nets in this distribution.
2. Improves accountability Detailed data, at the household level, can be shared with partners demonstrating what has taken place. That was the case here. 3. Increases transparency All partners, including donors and the wider public, have access to detailed data and can see what has taken place. That was the case here. 4. Increases data accuracy Data can be processed more quickly and errors spotted with time for corrections to be made prior to the net distribution taking place. That was not the case here as the registration and distribution were contemporaneous. 5. May reduce cost Data processing is simpler compared to paper based data. We are waiting for final details of cost numbers to assess if costs were lower and if so by how much. 6. Additional data can be collected GPS data and photos can be easily collected. That was the case here. 7. Reduces operational risk As long as electronic data is backed up, the risk of data loss, compared to data in paper form, can be significantly reduced or eliminated. While the vast majority of data was accurately stored and transferred, some lessons have been learned to improve in this area.

TECNOLOGY REPORT - AMF 5
2. Operational Decisions
The two principal data‐related decisions for any universal coverage mass distribution are: 1. Is the household level registration data to be placed in electronic form at some stage? 2. If yes, should the data be collected directly in electronic form or collected on paper and then put in electronic form? Smartphones enable data to be collected directly in electronic form. These were the key work streams to make this happen: Preparation and lead‐time Technology choices had to be made and equipment purchased, software loaded and customized so the specific data required could be efficiently and easily collected. Training of staff and volunteers used during the campaign Staff and volunteers able to reliably use electronic devices to collect data were selected and trained. Infrastructure and systems Careful organization was needed to ensure the suite of data collection devices remained adequately charged and the data could be transferred to computers and aggregated. Technology management Staff able to manage the hardware, software and data needed to be in place and trained. Data analysis and reporting The timely availability of data, and in significant volume, provided an opportunity to clean, review and correct data to make the distribution highly accurate. Appropriate staff needed to be in place and trained. Pilot distribution A pilot distribution was used to test the technology at a small but sufficient scale so lessons could be learned before larger roll out. Structuring of distributions across multiple districts The distribution needed to be staggered, since the size of each distribution area is determined (limited) by the number of devices available. The greater the number of devices (greater cost) the larger the distribution area covered at a time.
TECNOLOGY REPORT - AMF 6
3. Technology Decisions
The principal technology‐related decisions were: 1. Specific data collection software and programme to be used 2. Electronic devices (hardware) to be used, which are typically smartphone or tablet devices. 3. Selection of additional equipment required for operational efficiency and data transfer: spare
batteries, battery chargers, protective cases, laptops, WiFi connection devices).
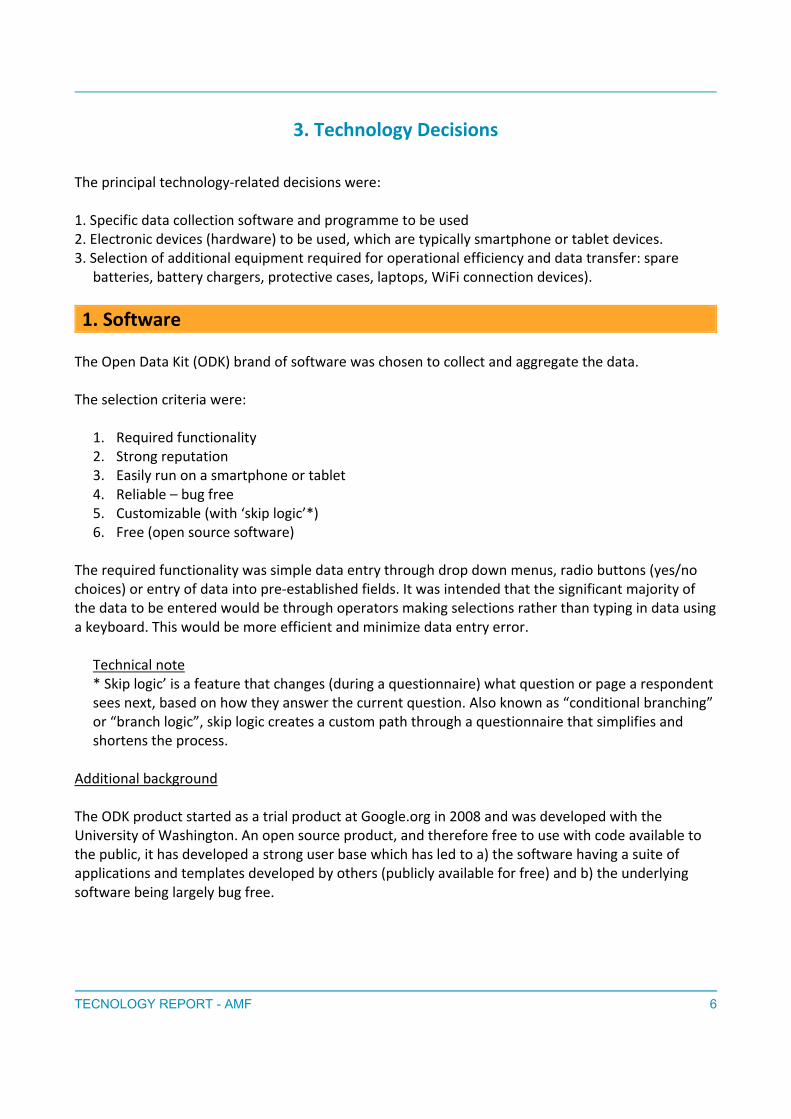
1. Software The Open Data Kit (ODK) brand of software was chosen to collect and aggregate the data. The selection criteria were:
1. Required functionality 2. Strong reputation 3. Easily run on a smartphone or tablet 4. Reliable – bug free 5. Customizable (with ‘skip logic’*) 6. Free (open source software)
The required functionality was simple data entry through drop down menus, radio buttons (yes/no choices) or entry of data into pre‐established fields. It was intended that the significant majority of the data to be entered would be through operators making selections rather than typing in data using a keyboard. This would be more efficient and minimize data entry error.
Technical note * Skip logic’ is a feature that changes (during a questionnaire) what question or page a respondent sees next, based on how they answer the current question. Also known as “conditional branching” or “branch logic”, skip logic creates a custom path through a questionnaire that simplifies and shortens the process.
Additional background The ODK product started as a trial product at Google.org in 2008 and was developed with the University of Washington. An open source product, and therefore free to use with code available to the public, it has developed a strong user base which has led to a) the software having a suite of applications and templates developed by others (publicly available for free) and b) the underlying software being largely bug free.

TECNOLOGY REPORT - AMF 7
Data Collection Application (app) The ODK Collection application (app) is downloaded and installed on each data collection device. The app takes up only 7.3Mb (this is small). The data collection forms to be used are then downloaded to the device. Designing the Data Entry Forms The data entry forms themselves can be built using the Build (https://opendatakit.org/use/build/) web application or by using XLSForm. In this case XLSForm was used as it is recommended for larger forms. This takes an Excel spreadsheet of the relevant format and converts it into an ODK form. This task is best carried out by a tech‐savvy individual liaising with others on the distribution team who can specific exactly what data is needed, how it should be laid out and with what sort of data entry option (Drop down lists; Multiple choice – either ‘pick one’ or ‘pick many’; or text entry, which can be validated and/or restricted to a certain format: numbers, text etc.) The questionnaire can be set so each question must be answered in turn and the inputs can be validated or checked against previous answers (in cases where a later answer contradicts an earlier one – for example; there are 2 people in the household, but later answers include 3 under5s) and present data entry warnings to eliminate ‘inconsistency’ data entry errors.
2. Hardware The hardware employed was:
1. Basic smartphones in protective cases 2. Standard laptop computers and USB memory devices 3. WiFi routers 4. Additional rechargeable batteries for the smartphones and battery chargers
1. Basic smartphones
Smartphones were chosen rather than tablets since they could carry out the task required and were smaller and cheaper. Required features of the phone included:
1. Android device (It had to be Android for open source s/w to be used.) 2. GPS functionality (embedded GPS chipset)* 3. GPS functionality that would work in DRC* 4. Built in WiFi features 5. Camera with flash function (photos were going to be taken at each household) 6. Robustness of the phone (particularly the screen, availability of a protective case) given the environment in which it would be working.

TECNOLOGY REPORT - AMF 8
In addition, the ability to source several hundred smartphones at one time without significant delay (not more than two months) was important.
Technical note * Phones that are only A‐GPS (Assisted‐GPS) capable are not adequate. They rely on an internet network and in the DRC context (and many other net distribution contexts) would not provide GPS functionality.
Devices bought The devices selected were Android Samsung GT‐S7582 and GT‐7582L smartphones (known as the Samsung Galaxy S Duos). 430 smartphones were purchased. Additional information on the price of the phones and the supplier/s has been requested and we hope to add that information here in an updated version of this report. The number of phones required and therefore bought was calculated according to the number of CHW teams needed to perform the distribution and hang‐up in two days per health zone. We estimated that each CHW team would be able to cover 40 households per day. Therefore the total number of households was divided by 80 to determine the number of phones required. The calculation did not specifically include a reserve quantity in case of failure/out of service phones. The phones were purchased from three sources. Even with the popularity and wide availability of the Samsung brand, it was difficult to source all the phone models from one source. 70 phones proved to be faulty and unusable. In retrospect, this problem occurred because one of the suppliers was unproven, and they delivered a faulty batch. The distribution campaign continued with 360 smartphones and it was still possible to finish the distribution in a timely fashion. Lessons Learned 1. Limit phone purchases to suppliers with a proven record. 2. Identify new suppliers that can deal with bulk purchases. 3. Create a phone testing protocol to be applied to each unit prior to shipment to country. We are examining using tablets instead of cell phones due to bigger screens and potentially equal or lower cost. The bigger screen may make data entry quicker and clearer.
2. Standard laptop computers These were the devices at each Health Area facility to which all data from the smartphones was uploaded for aggregation and analysis. The laptop model used in this distribution was the Lenovo T430. Approximately 20 laptops were used

TECNOLOGY REPORT - AMF 9
in each Health Zone. These laptops acted as a portable data hub where, after each day’s registration activity, data collected on the smartphones was uploaded to the laptop using the ‘ODK Aggregate’ server software. ODK Aggregate is displayed using any standard web browser, so it is user friendly. The data from each laptop was then exported to a spreadsheet and combined into one master sheet for each Heath Zone. Additional information on the price of the laptops and the supplier/s has been requested and we hope to add that information here in an updated version of this report.
Technical note We used VM‐based ODK Aggregate server software on the Lenovos. The front‐end App Engine deployment requires a system that is equipped with 600MHz with 128MB of memory. VM back‐end requires 256MB of memory.
3. WiFi routers
Uploading the data collected to the laptop computer required a simple WiFi router to connect the smartphone and laptop. The router was programed with the unique address of the laptop computer to allow each smartphone to connect without interference to that specific laptop (only). The power for the WiFi router was supplied via a USB cable that connects it to the laptop computer. The router model bought was the TP‐Link Wireless N Nano. 20 were bought. Each router cost US$18. The same number of routers was bought as laptops because each laptop requires a router in order for the phones to upload the data through WiFi. An advantage of the Nano router is it is USB‐powered, so the power consumption is low and the router can be plugged directly into the USB port. An additional electrical socket is not needed.
4. Additional rechargeable batteries (for the smartphones) and battery chargers
The lifetime of the smartphone battery (after a full charge) was between 5 and 8 hours. Additional rechargeable batteries were bought and close attention paid the night before each distribution day that spare batteries were fully charged. This was a valuable lesson applied form the pilot distribution in Nyanga Health Zone. There, supervisors needed to swap unused smartphones during the data collection with those that had run out of charge. Once the net distribution team was in the field, the ability to recharge the phones (finding a generator, solar installation, logistics) was extremely limited. Many supervisors needed to travel back (for some, a 2 hour roundtrip) each night to recharge the phones because power sources in the villages were non‐existent. Others were able to rent power generators locally. So, for the main distribution, additional batteries were bought.

TECNOLOGY REPORT - AMF 10
The battery model chosen was the ALLPOWERS 15600mAh external battery. The cost per unit was approximately USD$23. 430 units were bought to match the number of smartphones. The Samsung smartphones came with 1500mAh batteries so, in theory, an external battery would be able to fully recharge a smartphone 10 times. The realistic expectation used was 5 to 6 times. This would be more than adequate for the average time spent in the field per health zone.
Field Experience The reports from the field were positive. The constant use of GPS and photos while collecting household data drained the batteries faster than anticipated. However, the additional batteries enabled Field supervisors and CHWs to stay in the field and not have to search for power each night. Some problems were encountered when phones were charged from some generators. Unfortunately, ‘constant voltage’ transformers were not used and as a result of the fluctuating/surging charging voltage from the generators, some of the phones (and several laptops) suffered ‘burn out’. Constant voltage transformers should be used when charging devices where there are power outages and generators may be needed.

TECNOLOGY REPORT - AMF 11
4. Field Operations
Pre‐distribution The pre‐distribution tasks were:
1. Identifying those individuals involved in the technology team and establishing clear responsibilities covering ordering equipment, equipment preparation, data management, data analysis and data reporting. 2. Ordering, receipt and preparation of all electronic devices and associated equipment 3. The selection and training of Field Supervisors in the operation of the smartphones and associated equipment, i.e. how to enter data; how to troubleshoot problems with the smartphones including delete information/records/correcting mistakes; charging batteries; uploading using the WiFi router data from the smartphones to a laptop; operating the necessary programme on the laptop; forwarding data captured to the central location in the HZ. 4. The selection and training of CHWs, who would collect the registration data at each household, on the correct use of the smartphone and the data collection programme.
Distribution The distribution tasks were:
1. Data collected at households by CHWs (Fig 1 shows typical screenshots) 2. Each household was marked using chalk with a unique identifier. This was constructed from the following elements: date of the distribution + the number of the phone/handset + the number the household was being visited that day i.e. the ‘nth’ 3. At the end of each day the Field Supervisor uploaded the data on the smartphone via WiFi to the laptop at the relevant health facility. 4. The data across each Health Area was compiled into one data set.
5. There are between 17 and 28 Health Areas in a Health Zone. The data was transported to the Health Zone central offices via USB memory sticks and compiled to give a complete data set for each Health Zone. 6. The data was then sent from the Health Zone level to the Assistant Data Manager at the central level by USB memory stick for overall compilation.
7. The data was analysed by the Data Manager and Assistant Data Manager.

TECNOLOGY REPORT - AMF 12
Fig 1. Screenshot of part of the data collection form creation process We have asked for additional screenshots of the data collection screens and will add them here in an updated version of this report.

TECNOLOGY REPORT - AMF 13
5. Data Analysis
Our data analysis seeks to understand:
1. Is the data accurate? 2. When errors were found, were records corrected and with what benefit? 3. Did the collection of data directly in electronic form improve the distribution and in what ways? 4. What can we learn to improve future distributions?
Process The distribution the data was stored in Excel spreadsheets, one for each Health Zone. Data was supplied by IMA Health to AMF in this way. The data required a small amount of formatting and correcting of anomalous data (for example column headings being repeated part way through a spreadsheet) before copying/import. The data was combined in another Excel spreadsheet, one tab for each Health Zone and one tab for all the data. The quantity of combined data, 234,000 rows of information (one row per household) meant the data set was not so large as to prohibit analysis within the spreadsheet and some analysis was done in this way due to its convenience and no specialist skills required. The spreadsheet data was also imported into a SQL Server Database to allow more detailed analysis to be done more efficiently.
Technical note Spreadsheets can contain more than one million rows of data per tab (so a multi‐tab spreadsheet can comfortably contain several millions of rows of data per spreadsheet) so data from large scale distributions can be gathered and shared using spreadsheets. A limiting factor for sharing files (for example by email) is file size. A file of 250,000 rows of data can be between 10‐25MB unzipped, 5‐15Mb zipped. File sharing can be done by using file transfer programmes such as wetransfer.com. IMA plan to import the data to a Business Objects type environment (Tableau software) which, once set up correctly for the data imported will allow users to generate reports on related data.
Analysis done
As the data received was after distribution of the nets, analysis of the data would not lead to cleaned and corrected data being sent back to the field to influence the number of nets distributed to a particular household.

TECNOLOGY REPORT - AMF 14
This was because household registration and distribution of nets – and indeed hang‐up of the nets ‐ was contemporaneous. IMA wished to conduct the distribution in this way to gain information on high hang‐up rates expected to be achieved through immediate hang‐up of the nets. The aim of the analysis was therefore to assess the accuracy of the distribution as judged by: 1. How accurately did the data match records for the number of nets moved to each pre‐positioning and final distribution point?
There are records that show how many of the 670,000 LLINs (excluding the 6,000 designated for hospitals) shipped to West Kasai were moved to each pre‐positioning point and arrived at each distribution point. The two sets of data were compared. The detailed results are shown in Appendix 1. Summary
91% of the nets distributed had data recorded electronically (565,306 nets to 231,925 households, out of total of 624,532 distributed)
9% of the nets distributed did not have data recorded electronically Due to: o Failure of individual smartphones with no back up available for data collection o Issues with data being corrupted and not retrievable from the smartphones o Issues with the data transfer process leading to data loss
We are broadly confident the 9% of nets for which we do not have data in electronic form were distributed as intended for the following reasons:
Signed net movement forms show nets moved to the final distribution points as expected.
Explanations from IMA as to why data was lost or not collected electronically are credible
Paper based records corroborate net distribution totals.
Of the 670,000 nets shipped to West Kasai (which excludes the 6,000 nets shipped and destined for distribution in hospitals), 624,532 were distributed (93%) and 45,568 (7%) were surplus to requirements. The 45,568 nets will be transported to North Ubangi district for distribution in AMF/IMA’s upcoming universal coverage campaign. 2. How free was the data of ‘inconsistency’ and ‘anomaly’ errors?
This was done by assessing each column of data, as well as establishing a series of ratios, to reveal errors or inconsistencies. The detailed results are shown in Appendix 2.

TECNOLOGY REPORT - AMF 15
Summary
96% of the household data records were without error
4% of the households had one or more errors in the data recorded Due to: o Data inconsistencies within a household record (that can be designed out with
improvements to the logic mechanism i.e. acceptable answers during data entry) o Data anomalies within a household record suggesting data entry error (that can be
reduced with improved training and/or a verification step during data analysis) o No data analysis between data collection and nets being distributed (this can be
reduced if the distribution follows a separate registration phase)
An inconsistency error is where two pieces of data are not consistent. For example, 4 sleeping spaces in the household but 5 nets given out; or 3 people in the household but 4 under5s recorded. Usually these are data entry errors. The data entry screens are set up with error messages so as not to allow most inconsistency errors but not all were designed out and some were possible.
An anomaly error is where information looks wrong. For example, more than 20 under 5s in a household or all in a household are under 5s. The data are typically outliers against the bulk of the data. These are also likely to be data entry errors.

TECNOLOGY REPORT - AMF 16
6. Lessons Learned
Equipment 1. Limit phone purchases to suppliers with a proven record. 2. Identify new suppliers that can deal with bulk purchases. 3. Create a phone testing protocol to be applied to each unit prior to shipment to country. 4. Ensure there are sufficient spare rechargeable batteries for all smartphones. 5. Use constant voltage transformers for charging batteries when generators are being used as the power source. 6. Purchase sufficient smartphones to have spares to replace any that don’t work to avoid costly delays in data collection. 7. Consider examining using tablets instead of smartphones due to bigger screens and potentially equal or lower cost. The bigger screen may make data entry quicker and clearer.
Design 8. Ensure the registration questionnaire is designed so inconsistent answers are not possible. 9. Conduct a pilot distribution to test equipment and procedures to ensure any improvements in are fully incorporated in the main distribution. 10. Consider staggering distributions when multiple districts or provinces (i.e. large areas) are being targeted so a lower quantity of smartphones can be used consecutively across multiple locations.
Process 11. Employ a technologically and technically qualified individual (full time allocation) to manage the technology components of the distribution encompassing technology management (planning, purchasing, h/w, s/w, programming, preparation, reporting) and data management (aggregation, analysis and reporting). 12. Ensure those selected to enter data in the smartphone have the requisite skills. Observe candidates using a smartphone and entering data as part of the selection process.

TECNOLOGY REPORT - AMF 17
Appendix 1 Household level data for 670,000 nets distribution in West Kasai showing for each of 8 Health Zones showing ‐ Reconciliation of electronic data records with total nets distributed

TECNOLOGY REPORT - AMF 18
Appendix 2 Household level data for 670,000 nets distribution in West Kasai showing for each of 8 Health Zones showing: ‐ Errors in electronic data: inconsistencies (errors) and anomalies (potential errors)