“I’m Mr. Bad Guy… I’m Mr....
37
“I’m Mr. Bad Guy… I’m Mr. Mercury” Petra Lee – Sr. ES Specialist Division of Environmental Services West Sacramento [email protected] Mercury and Methylmercury Imports and Exports of a Tidal Wetland
Transcript of “I’m Mr. Bad Guy… I’m Mr....

“I’m Mr. Bad Guy… I’m Mr. Mercury”
Petra Lee – Sr. ES SpecialistDivision of Environmental ServicesWest [email protected]
Mercury and Methylmercury Imports and Exports of a Tidal Wetland

•Brief and Possibly Repetitive Background
•Study Area and BRIEF Methods
•QUICK Partial Data Summary
We Will Rock You….

Is this the real life? Is this just fantasy?

InorganicMercury Methyl
mercury
Methylmercury is a potent neurotoxin
Prospect Island Dutch SloughBlacklock
Tidal restorations may create and export methylmercury

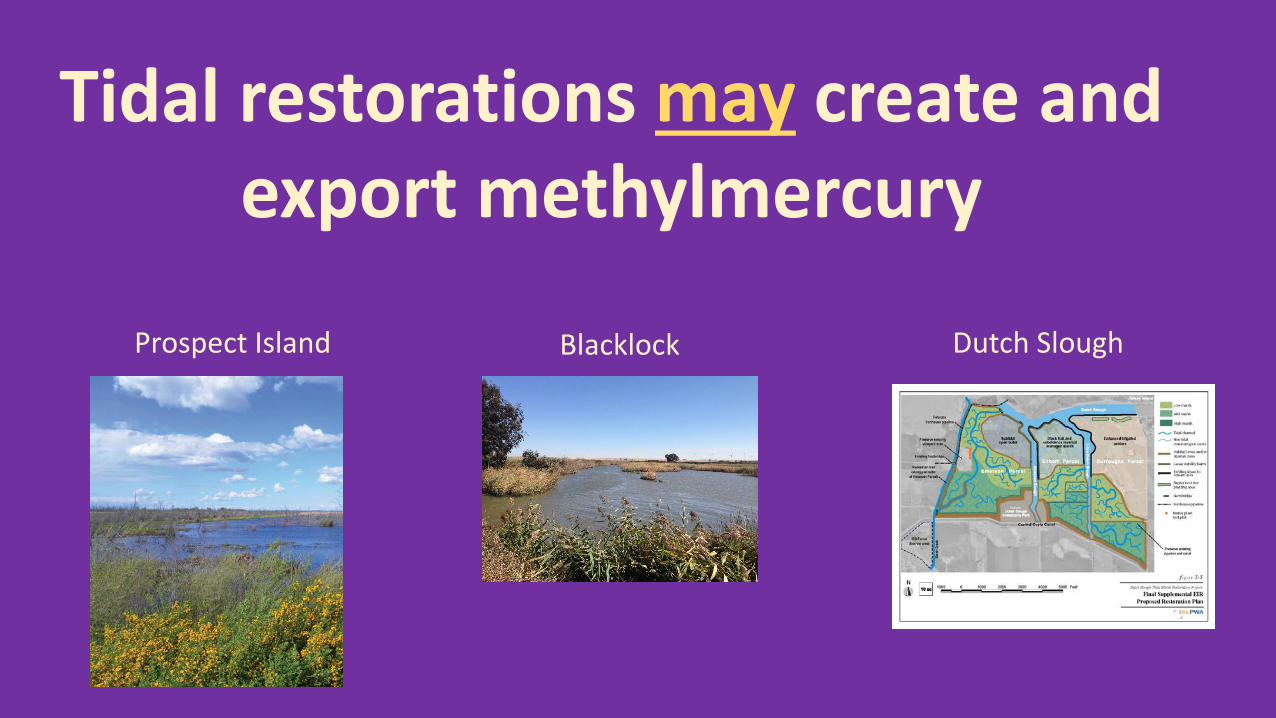
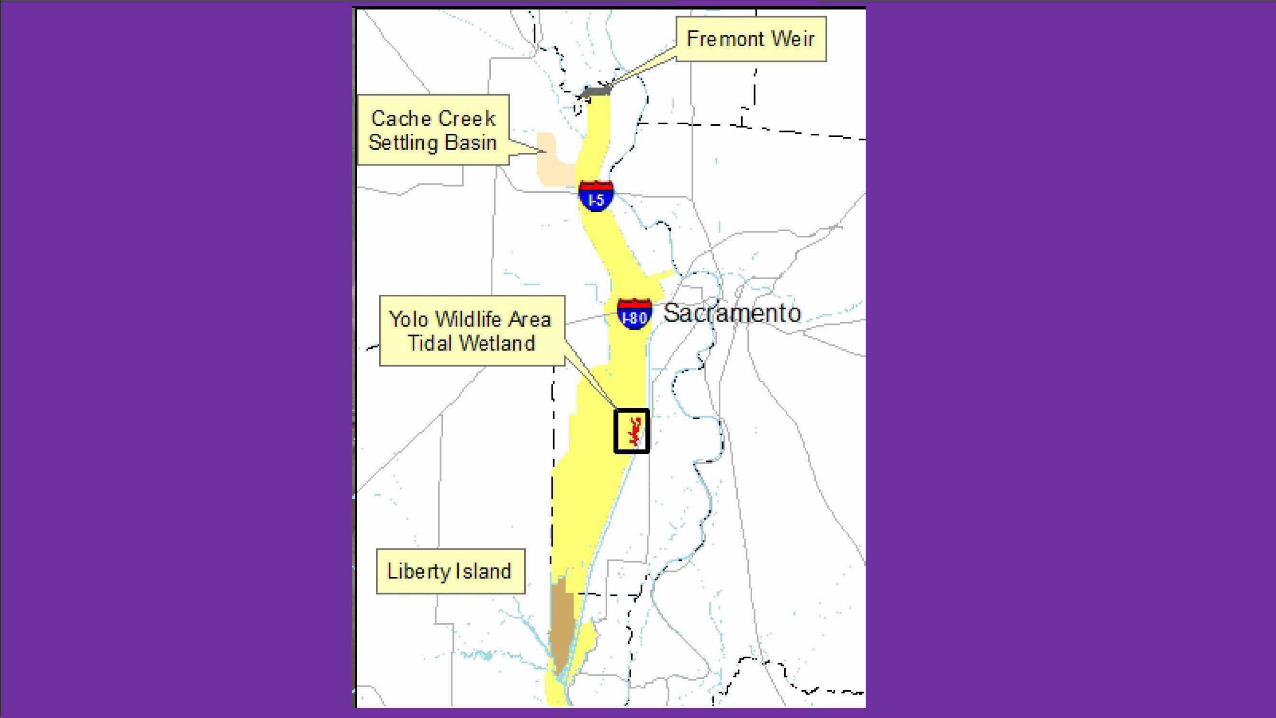
Please. Tell me more about your study area!!!
Cache Cree k Settl ing Basin
Yolo VVi ld life .Area Tidal Wetland
Liberty Island
Fre mont Weir
I ,..... -
- " ~·--· ,· ;
---L
--- - -t ( ,. ( \ • I
) ''·· .....
----
I '··., .~""""
~ ... --,----) .. / ... L
/ J • !
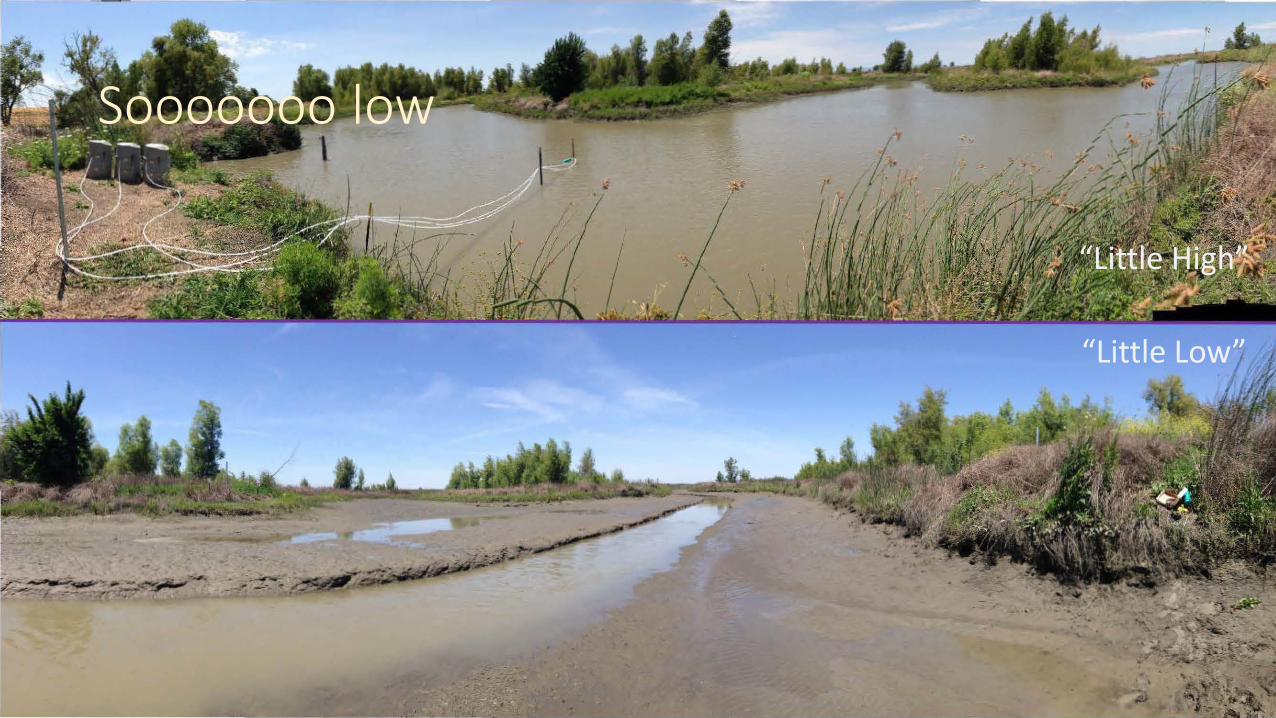
Sooooooo low
“Little High”
“Little Low”

Ebb and flood and source and sink and import and export stuff
Export & Source
Import & Sink
Wetland

A W<~ttr Qu..Jity Sa~ don
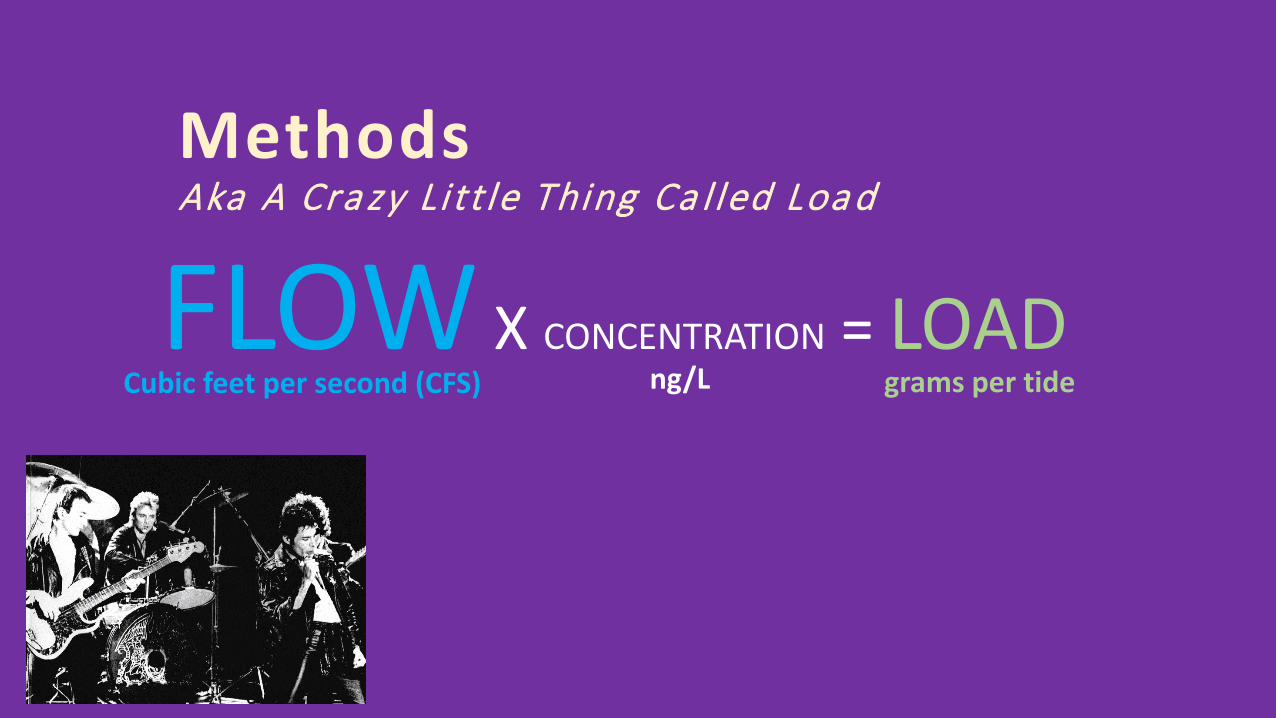
MethodsAka A Cra zy L i tt le Thing Ca l led Loa d
FLOW X CONCENTRATION = LOADCubic feet per second (CFS) ng/L grams per tide

MethodsAka A Cra zy L i tt le Thing Ca l led Loa d
FLOW X CONCENTRATION = LOAD


0.20
0.10
-Q) 0.00 "'C +-J ~ Q) c.. -0.10 V')
E ro bo -0.20 -
"'C ro _g -0.30
-0.40
-0.50
Particulate and Filtered Total Mercury Loads
Source
Sink
• Particulate THg
• Filtered THg

Q)
u > u ro
"'0 ~ lo-
100000
80000
60000
40000
Q) 20000
a. V')
E ro lo-
b.O 0
0
~ :X~
~'li -20000
-40000
-60000
Estimated Monthly Total Suspended Solid Loads
Source
Sink
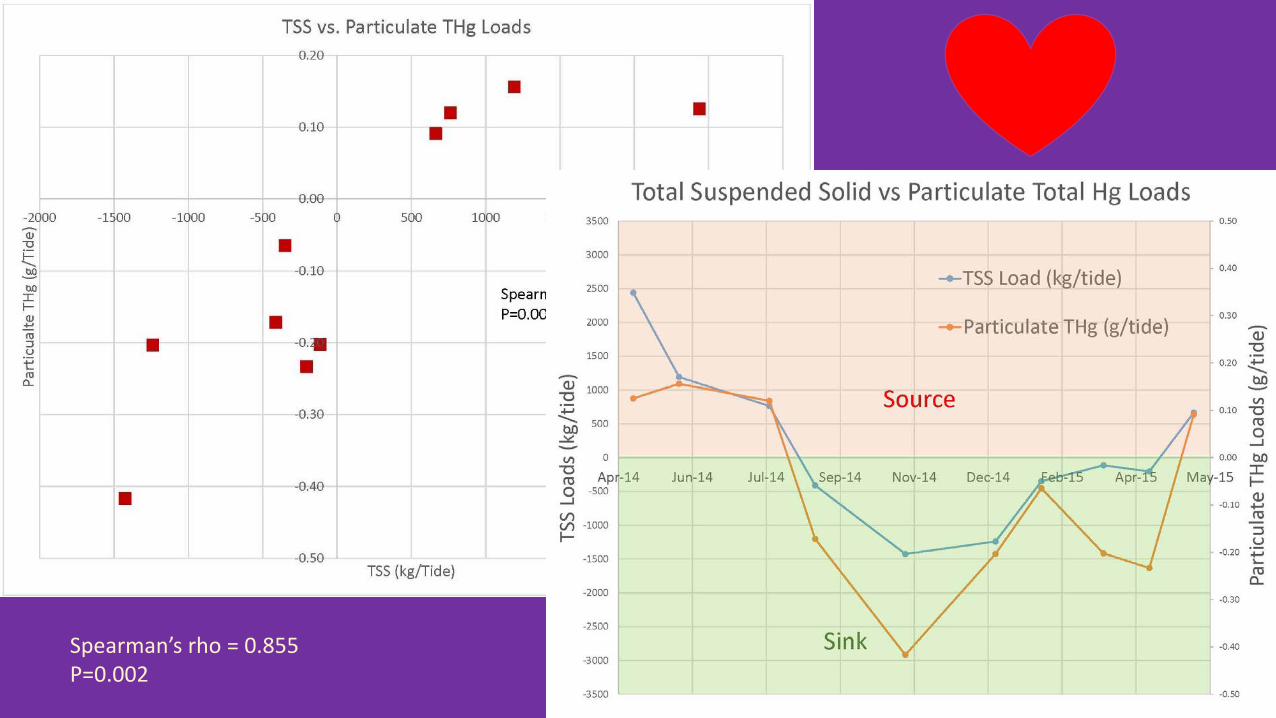
Spearman’s rho = 0.855P=0.002

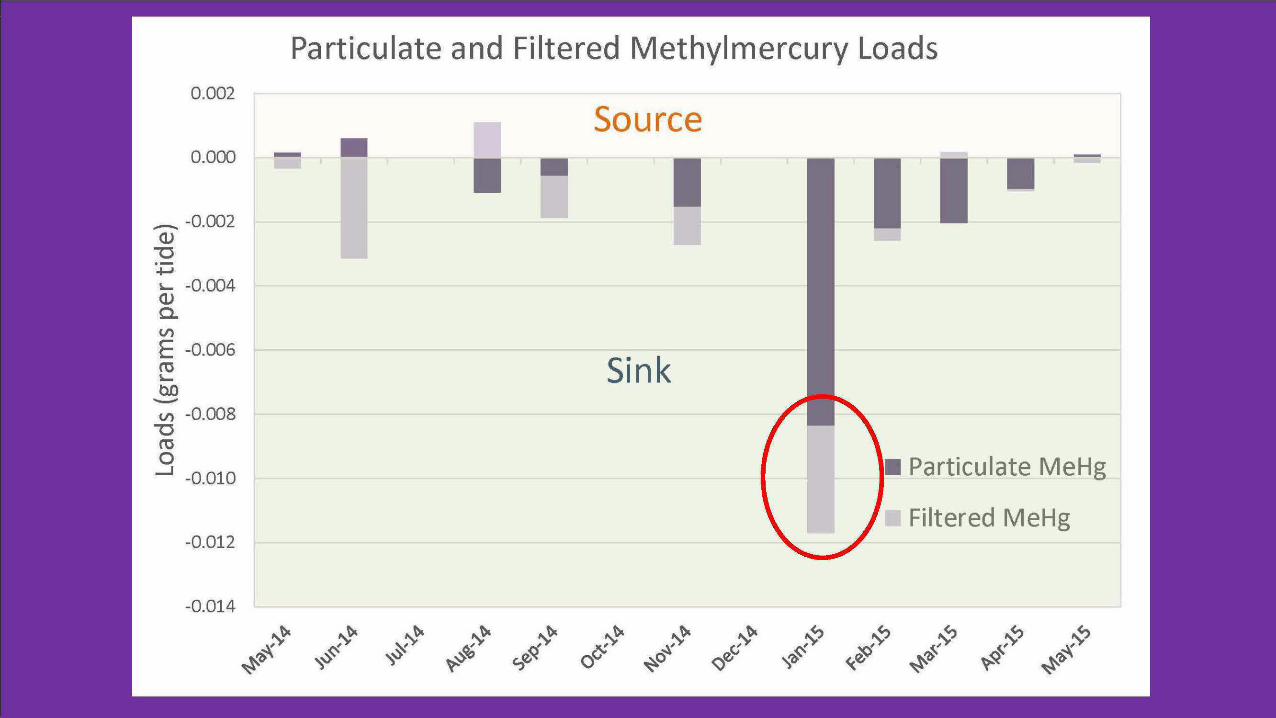
Particulate and Filtered Methylmercury Loads 0.002
Source 0.000 -
- -0.002 Q) -c ·-~ ~ -0.004 Q) a. V')
E -o.ooG ro ~
tlO -V') -0.008 -c ro 0
....J -0.010
-0.012
-0.014
Sink
• Particulate MeHg
• Filtered MeHg
Particulate and Filtered Methylmercury Loads 0.002
Source 0.000 -
- -0.002 Q) -c ·-~ ~ -0.004 Q) a. V')
E -o.ooG ro ~
tlO -V') -0.008 -c ro 0
....J -0.010
-0.012
-0.014
Sink
Particulate MeHg
• Filtered MeHg
20
18
16
14
12 ....J
~10 c
8
6
4
2
0
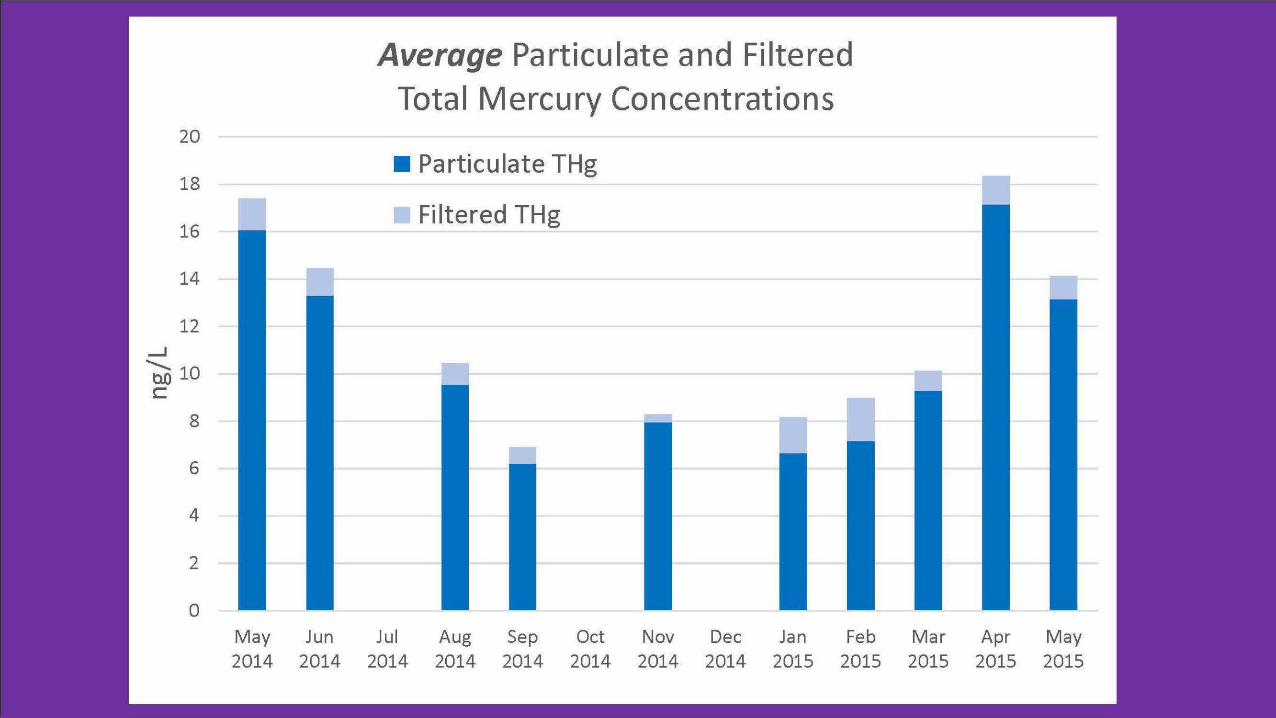
Average Particulate and Filtered Total Mercury Concentrations
• Particulate THg ------
• Filtered THg ~-----
May Jun Jul Aug Sep Oct Nov Dec Jan Feb Mar Apr May 2014 2014 2014 2014 2014 2014 2014 2014 2015 2015 2015 2015 2015
0.50
0.45
0.40
0.35
0.30 .....J .......... b.O 0.25 c
0.20
0.15
0.10
0.05
0.00
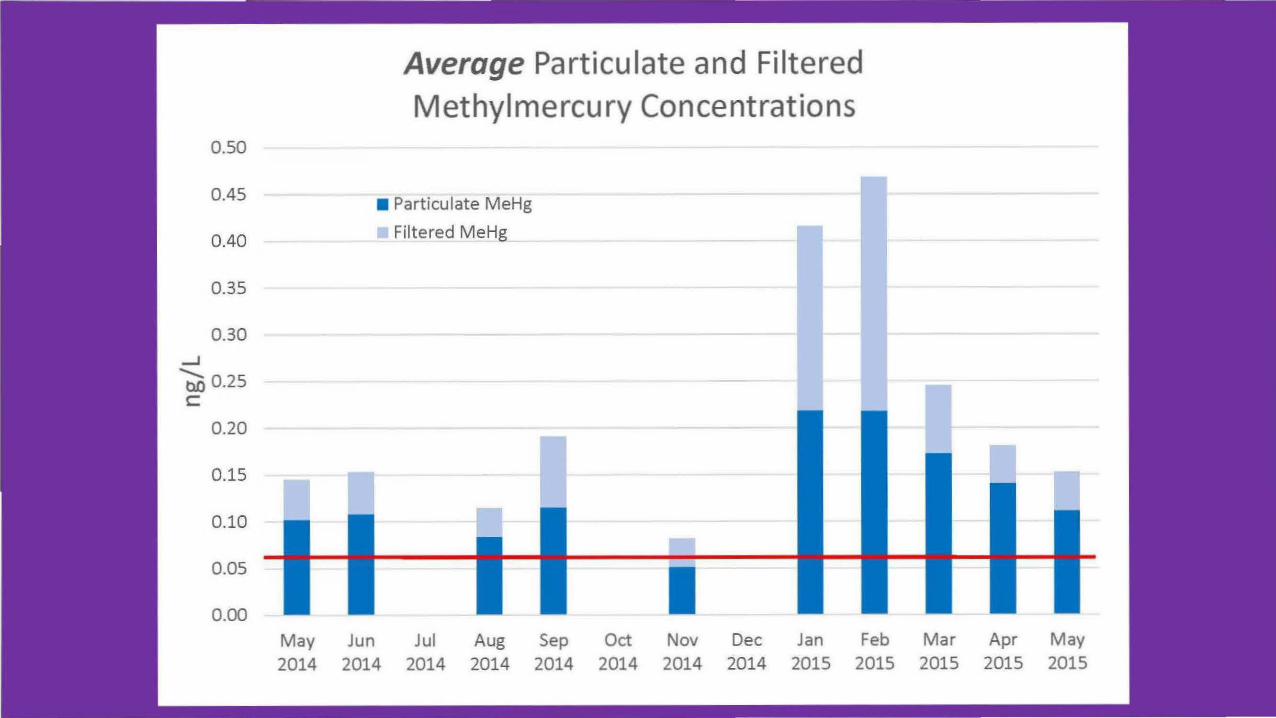
Average Particulate and Filtered Methylmercury Concentrations
• Particulate MeHg
Filtered MeHg
May Jun Jul Aug Sep Oct Nov Dec Jan Feb Mar Apr May 2014 2014 2014 2014 2014 2014 2014 2014 2015 2015 2015 2015 2015

0.50
0.45
0.40
0.35
0.30 .....J .......... b.O 0.25 c
0.20
0.15
0.10
0.05
0.00
Average Particulate and Filtered Methylmercury Concentrations
• Particulate MeHg
Filtered MeHg
May Jun Jul Aug Sep Oct Nov Dec Jan Feb Mar Apr May 2014 2014 2014 2014 2014 2014 2014 2014 2015 2015 2015 2015 2015
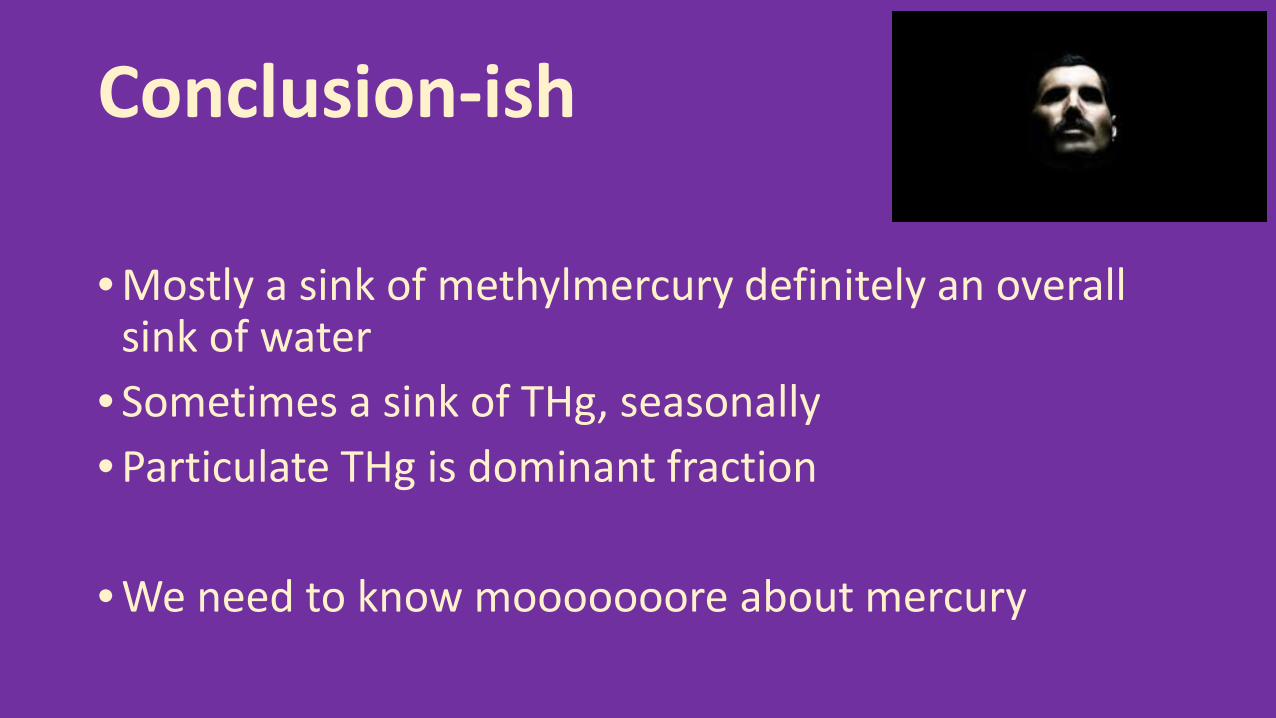
Conclusion-ish
• Mostly a sink of methylmercury definitely an overall sink of water
• Sometimes a sink of THg, seasonally• Particulate THg is dominant fraction
• We need to know mooooooore about mercury

“…don’t stop me now ‘cause I’m having a good time…”

QUESTIONS andTHANKS!
• Many thanks to the Mercury group, Julianna Manning, Dave Bosworth, and Carol DiGiorgio
• Thanks to Otome Lindsey, Janis Cooke, Sonia Miller, Elaine Jeu• More thanks to Bryte Lab and Allan Wong, Sid Fong, Marilyn Toomey, Gary
Munoz, and Kelley Pepper• Thanks for equipment from Zoltan Matica• Thanks for question answering from Carl Mitchell• Thanks to our patron saint, Freddie Mercury and all the good folks who helped
me with Queen quotes
More Questions? Contact Petra [email protected]

~ qj
~ d-(j)
P blo So un y

• * ,
# #
•
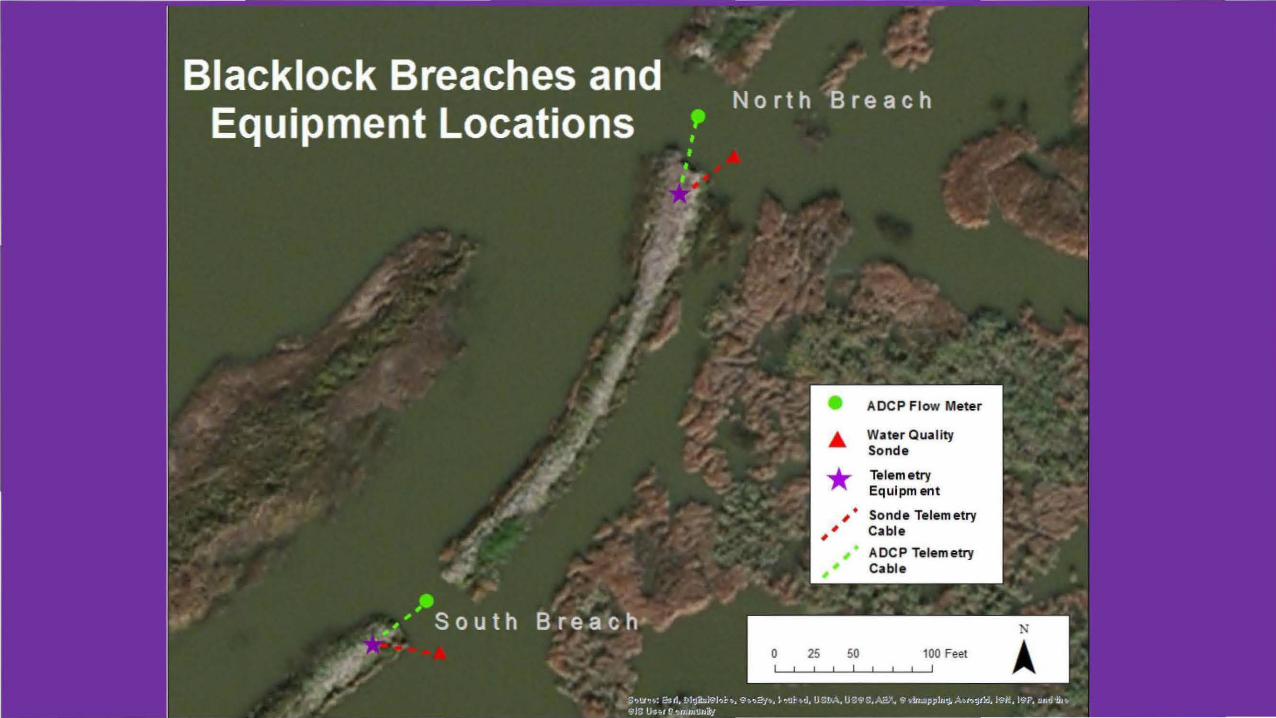
ADCP Flow Meter
Water Quality Sonde
Telemetry Equipment
Sonde Telemetry Cable
A DC P Telemetry Cable
";' :s! .t:, "'
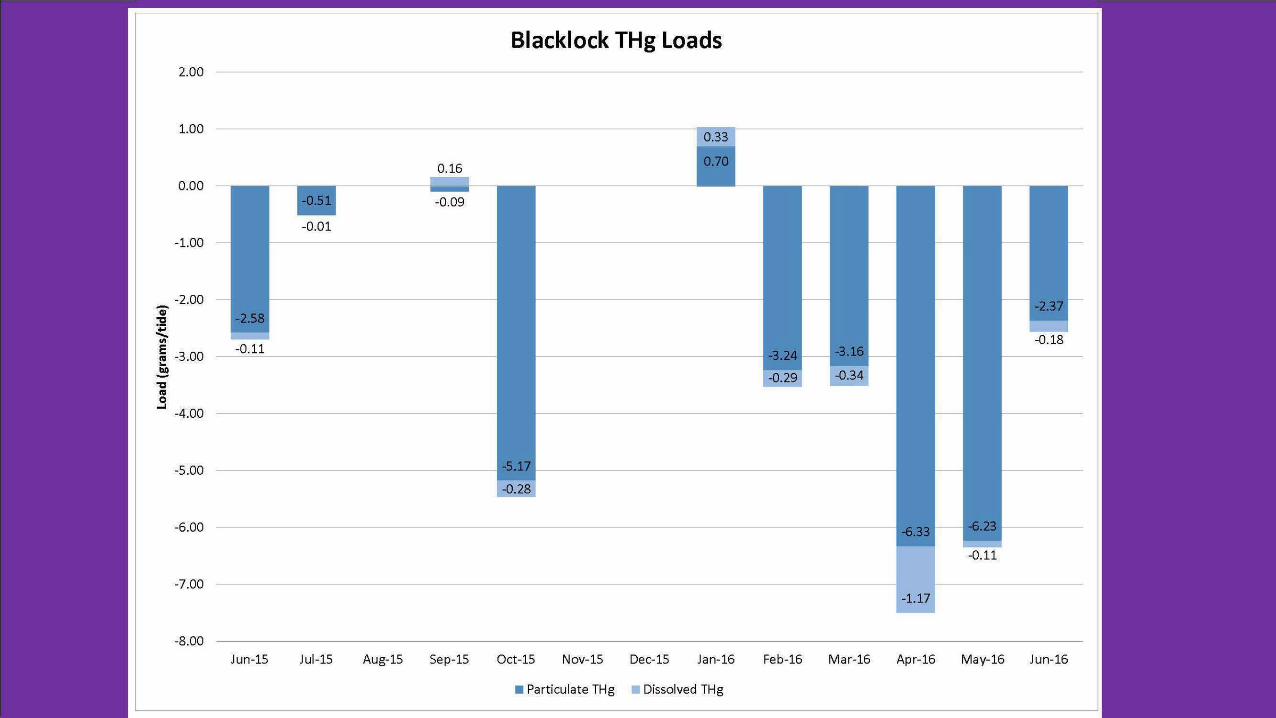
2.00
1.00
0.00
-1.00
-2.00
~ -3.00 -O.l1 ... ~ "'C Ill
..9 -4.00
-5 .00
-6.00
-7.00
-8.00
Jun-15 Jul-15 Aug-15 Sep-15
Blacklock THg Loads
-o.11
-1.17
Oct-15 Nov-15 Dec-15 Jan-16 Feb-16 Mar-16 Apr-16 May-16 Jun-16
• Particulate THg • Dissolved THg
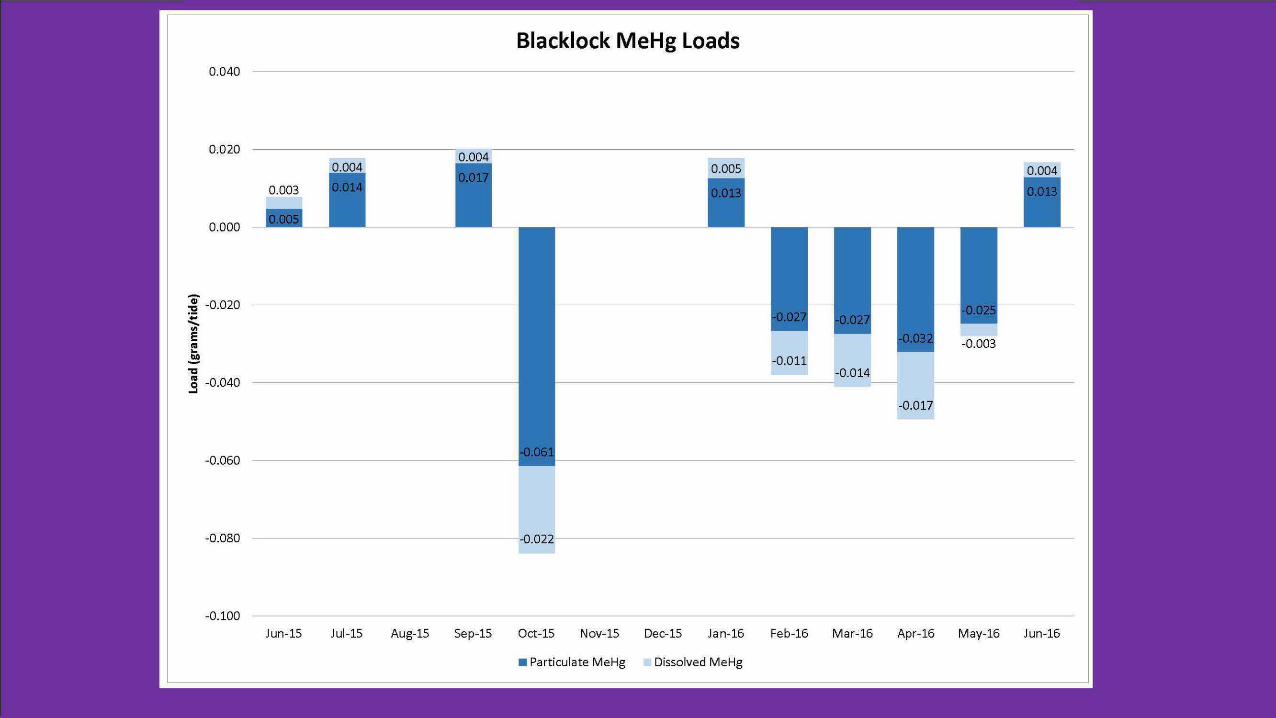
0.040
0.020
0.000
i -0.020 ~ "' E ~ ~ ., ~ -0.040
-0.060
-0.080
-0. 100
Blacklock MeHg Loads
0.005 0.004
-0.017
------------------------------~.022----------------------------------------------------------
Jun-15 Jul-15 Aug-15 Sep-15 Oct-15 Nov-15 Dec-15 Jan-16 Feb-16 Mar-16 Apr-16 May-16 Jun-16
• Particulate MeHg Dissolved MeHg

Q)
u > u ro
"'0 ~ lo-
100000
80000
60000
40000
Q) 20000
a. V')
E ro lo-
b.O 0
0
~ :X~
~'li -20000
-40000
-60000
Estimated Monthly Total Suspended Solid Loads
Source
Sink

Spearman’s rho = 0.855P=0.002
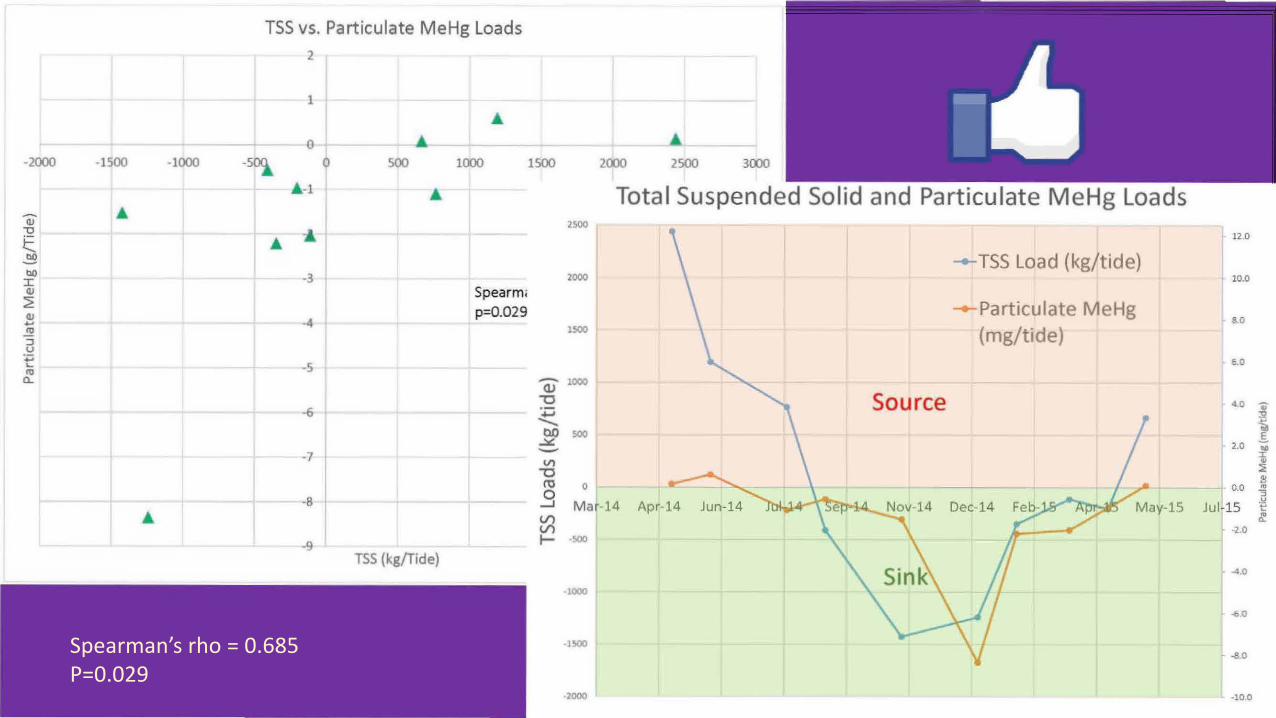
Spearman’s rho = 0.685P=0.029
-2000 -1500 -1000
TSS vs. Particulate MeHg Loads 2
1
0
-~
A-1
A :.l
-3
-4
-5
6
-7
8
-9
0 500
TSS {kg/Tide)
1000
Spearm;
p=0.029
1500 2000
,&
2500 3000
Total Suspended Solid and Particulate MeHg Loads
....__ TSS Load (kg/tide) 2000
_._Particulate MeHg (mg/tide)
Source
Ma r 14
0 Apr-~~-~
1000
-1500
·2000
120
10.0
80
6.0
•. 0 c; :'2 ~
2.0 .§. Qj) :r "' ~ ~
0.0 .. 3
Jul-15 .l:! t: .. Q.
·2.0
-4.0
-6.0
..S.O
-10.0

Spearman’s rho = 0.685P=0.029
-2000 -1500 -1000
TSS vs. Particulate MeHg Loads 2
1
1500
~2000
12.0
10.0
80
6.0
4.0 -.; :2 ~
2.0 .s llj) :c Ill
:e ~
0.0 ., "3
Jul-15 .!./ t: ~
-20
-4.0
~-0
-80
-10.0

Spearman’s rho = 0.085P=0.815
It’s complicated!
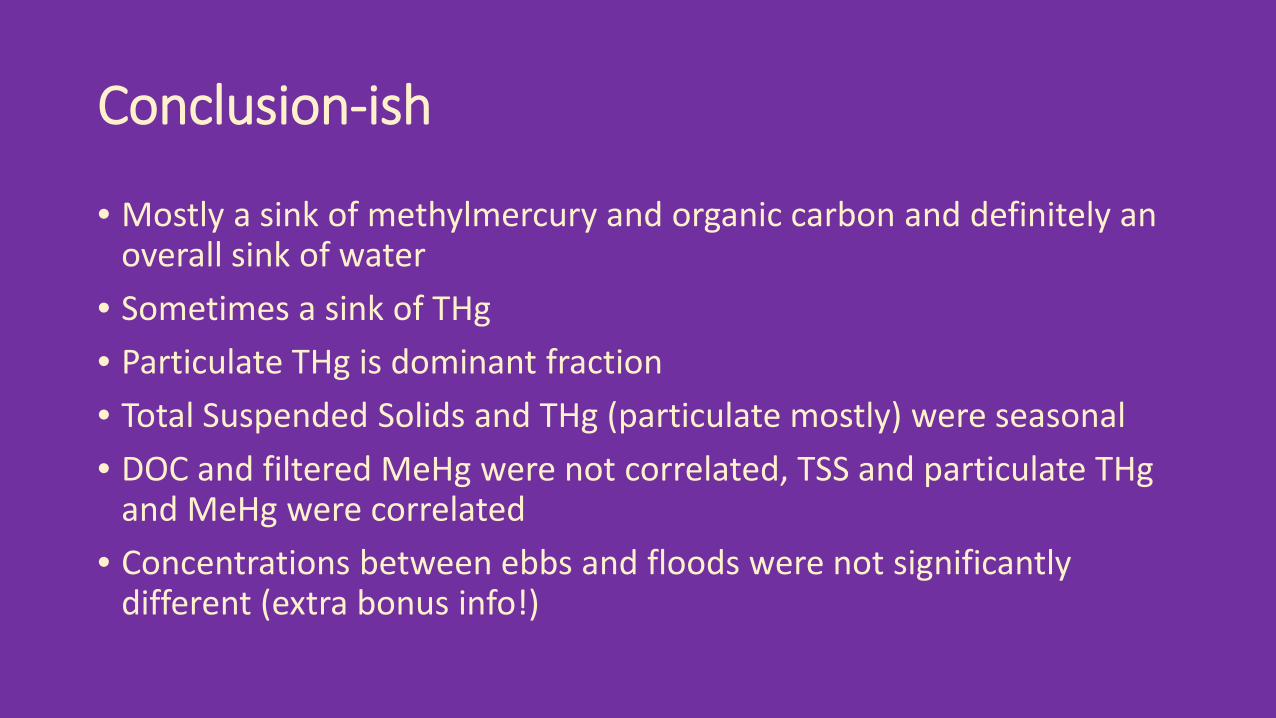
Conclusion-ish
• Mostly a sink of methylmercury and organic carbon and definitely an overall sink of water
• Sometimes a sink of THg• Particulate THg is dominant fraction• Total Suspended Solids and THg (particulate mostly) were seasonal• DOC and filtered MeHg were not correlated, TSS and particulate THg
and MeHg were correlated• Concentrations between ebbs and floods were not significantly
different (extra bonus info!)
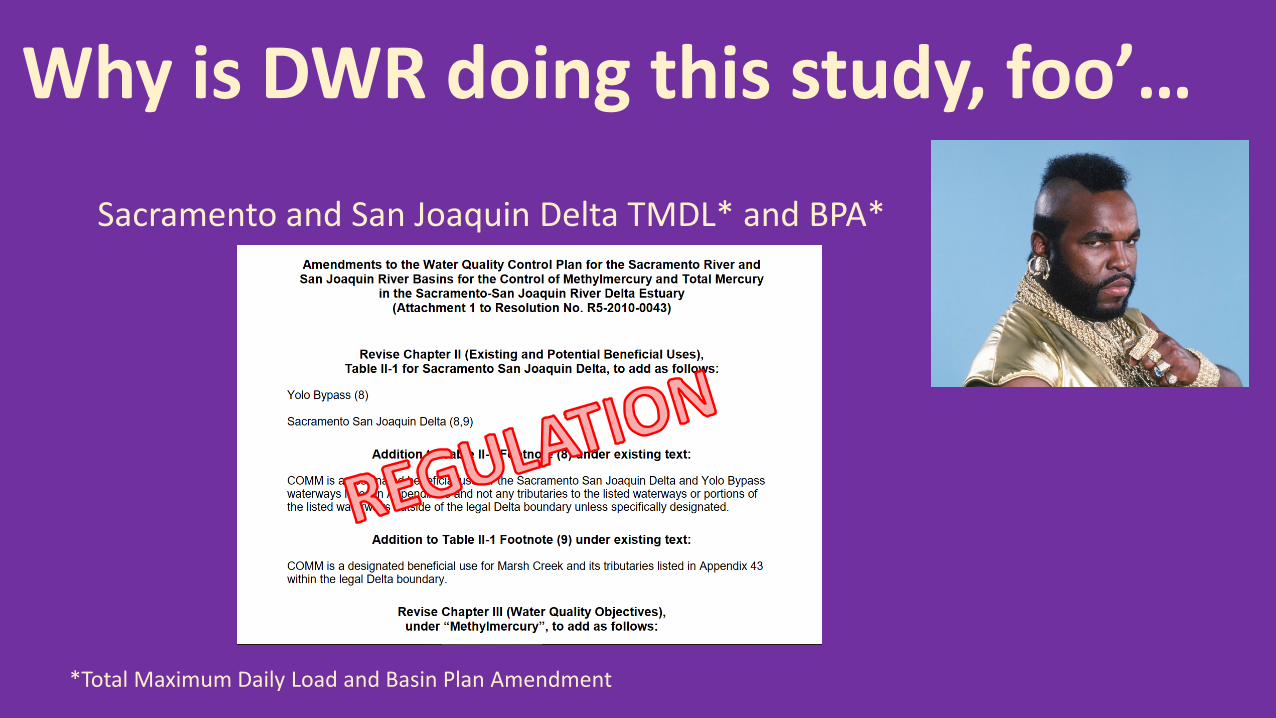
Sacramento and San Joaquin Delta TMDL* and BPA*
*Total Maximum Daily Load and Basin Plan Amendment
Why is DWR doing this study, foo’…