IJNDD 6 1 , Jan-Mar, 2014, 10-24 Research article ZAHEER ABBASijndd.net/jan-mar2014/2. IJNDD 6_1_,...
15
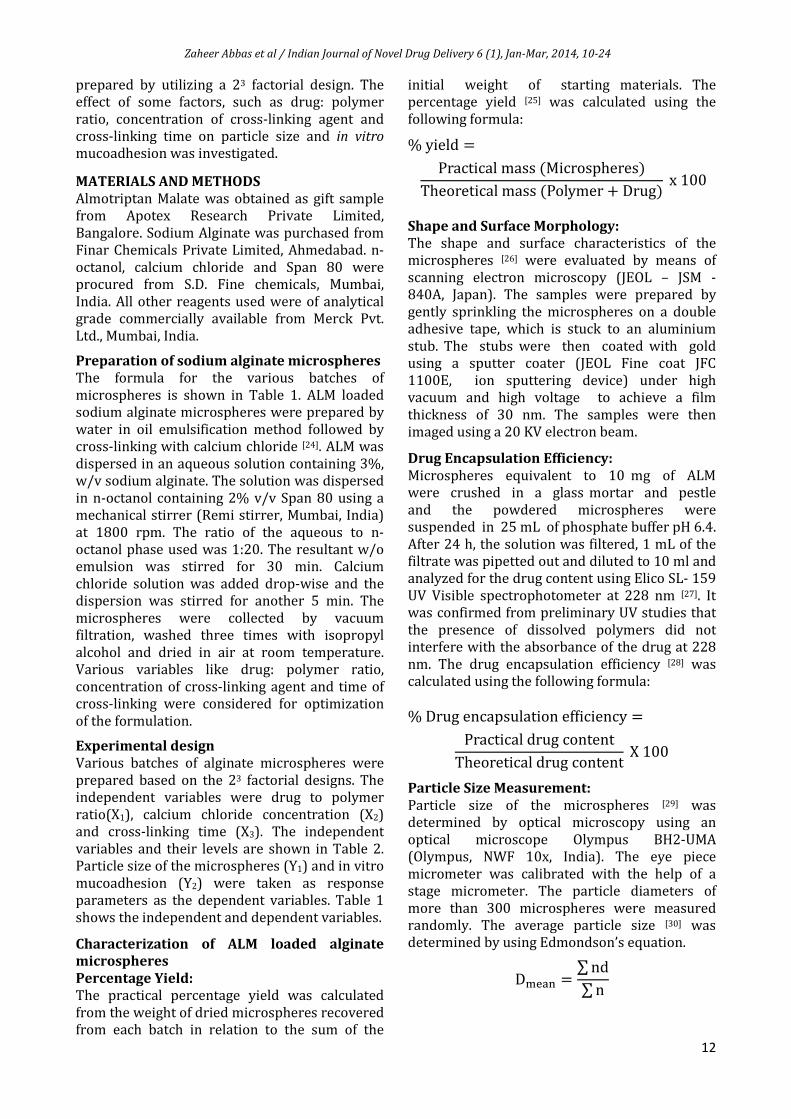
Indian Journal of Novel Drug delivery 6(1), Jan-Mar, 2014, 10-24 10 Indian Journal of Novel Drug Delivery IJNDD An Official Publication of Karnataka Education and Scientific Society Research Article Almotriptan Loaded Sodium Alginate Microspheres for Nasal Delivery: Formulation Optimization Using Factorial Design, Characterization and In Vitro Evaluation ZAHEER ABBAS 1 *, SACHIN MARIHAL 1 , AKIFUDDIN SK 2 1 Formulation Research and Development Department, Apotex Research Private Limited, Bangalore – 560099 2 Executive, Sterile Manufacturing Area, Hospira Healthcare India Private Limited, Kancheepuram, Chennai- 602106 A R T I C L E D E T A I L S A B S T R A C T Article history: Received on 09 February 2014 Modified on 15 March 2014 Accepted on 22 March 2014 Almotriptan malate, indicated for the treatment of migraine with or without aura in adults is not a drug candidate feasible to be administered via oral route during the attack due to its associated symptoms such as nausea and vomiting. This obviates an alternative dosage form. Nasal delivery of this drug is a good substitute to oral and parenteral administration, due to its numerous advantages. In the present study, sodium alginate microspheres of Almotriptan malate, for intranasal delivery, were prepared by water-in-oil (w/o) emulsification cross-linking technique. A 2 3 factorial design was employed with drug to polymer ratio, calcium chloride concentration and cross-linking time as independent variables while particle size and in vitro mucoadhesion of the microspheres were the dependent variables. Regression analysis was performed to identify the best formulation conditions. The microspheres were evaluated for characteristics like particle size, incorporation efficiency, swellability, zeta potential, in vitro mucoadhesion, thermal analysis, X- ray diffraction study and in vitro drug release. The shape and surface characteristics were determined by scanning electron microscopy which revealed spherical nature and nearly smooth surfaces of the microspheres. The drug encapsulation efficiency was found to be in the range of 69.62 ± 1.15 – 89.11 ± 0.95%. In vitro mucoadhesion was performed by adhesion number using sheep nasal mucosa and was observed in a range from 77.58 ± 1.49 – 93.15 ± 1.25%. Differential scanning calorimetry and X-ray diffraction results indicated a molecular level dispersion of drug in the microspheres. In vitro drug diffusion studies in phosphate buffer, pH 6.4 indicated non-Fickian or anomalous type of transport for the release of Almotriptan from the microspheres. © KESS All rights reserved Keywords: Almotriptan Malate Sodium Alginate Mucoadhesive Microspheres Emulsification cross-linking technique Factorial Design, Nasal Drug Delivery INTRODUCTION Migraine is a recurrent incapacitating neurovascular disorder characterized by attacks of debilitating pain associated with photophobia, phonophobia, nausea and vomiting [1] . Almotriptan Malate (ALM), a triptan derivative is a novel selective 5-hydroxytryptamine1B/1D receptor agonist indicated for the acute treatment of migraine with or without aura in adults [2] . During an attack, the blood vessels in the brain dilate and then draw together with stimulation of nerve endings near the affected blood vessels. These changes in the blood vasculature may be responsible for the pain. However, the exact cause of migraine, whether it is a vascular or a neurological dysfunction still remains unclear. Therapeutic approaches for management of migraine has a strong rationale however, it is still a poorly understood phenomenon [3] . ALM is generally given by oral route and available commercially as conventional immediate release solid oral dosage form. ALM is well absorbed after oral administration [4] , with absolute bioavailability of about 70%. The optimal dose for ALM is a 12.5 mg at the start of a migraine headache, which may be repeated once in 2 h to a maximum of 25 mg/24 h. Low oral bioavailability, frequent administration due to lower plasma half-life of 3 - 4 h and associated symptoms such as nausea and vomiting makes oral treatment unsatisfactory and justifies a need of an alternate route for drug delivery [5, 6] . Amongst the different routes for drug administration, nasal delivery offers an *Author for Correspondence: Email: [email protected]
Transcript of IJNDD 6 1 , Jan-Mar, 2014, 10-24 Research article ZAHEER ABBASijndd.net/jan-mar2014/2. IJNDD 6_1_,...
Indian Journal of Novel Drug delivery 6(1), Jan-Mar, 2014, 10-24
10
Indian Journal of Novel Drug Delivery IJNDD
An Official Publication of
Karnataka Education and
Scientific Society
Research Article
Almotriptan Loaded Sodium Alginate Microspheres for Nasal Delivery:
Formulation Optimization Using Factorial Design, Characterization and In
Vitro Evaluation ZAHEER ABBAS1*, SACHIN MARIHAL1, AKIFUDDIN SK2 1Formulation Research and Development Department, Apotex Research Private Limited, Bangalore – 560099 2Executive, Sterile Manufacturing Area, Hospira Healthcare India Private Limited, Kancheepuram, Chennai- 602106
A R T I C L E D E T A I L S A B S T R A C T
Article history:
Received on 09 February 2014
Modified on 15 March 2014
Accepted on 22 March 2014
Almotriptan malate, indicated for the treatment of migraine with or without aura in
adults is not a drug candidate feasible to be administered via oral route during the
attack due to its associated symptoms such as nausea and vomiting. This obviates
an alternative dosage form. Nasal delivery of this drug is a good substitute to oral
and parenteral administration, due to its numerous advantages. In the present
study, sodium alginate microspheres of Almotriptan malate, for intranasal delivery,
were prepared by water-in-oil (w/o) emulsification cross-linking technique. A 23
factorial design was employed with drug to polymer ratio, calcium chloride
concentration and cross-linking time as independent variables while particle size
and in vitro mucoadhesion of the microspheres were the dependent variables.
Regression analysis was performed to identify the best formulation conditions. The
microspheres were evaluated for characteristics like particle size, incorporation
efficiency, swellability, zeta potential, in vitro mucoadhesion, thermal analysis, X-
ray diffraction study and in vitro drug release. The shape and surface
characteristics were determined by scanning electron microscopy which revealed
spherical nature and nearly smooth surfaces of the microspheres. The drug
encapsulation efficiency was found to be in the range of 69.62 ± 1.15 – 89.11 ±
0.95%. In vitro mucoadhesion was performed by adhesion number using sheep
nasal mucosa and was observed in a range from 77.58 ± 1.49 – 93.15 ± 1.25%.
Differential scanning calorimetry and X-ray diffraction results indicated a
molecular level dispersion of drug in the microspheres. In vitro drug diffusion
studies in phosphate buffer, pH 6.4 indicated non-Fickian or anomalous type of
transport for the release of Almotriptan from the microspheres.
© KESS All rights reserved
Keywords:
Almotriptan Malate
Sodium Alginate
Mucoadhesive Microspheres
Emulsification cross-linking technique
Factorial Design,
Nasal Drug Delivery
INTRODUCTION
Migraine is a recurrent incapacitating
neurovascular disorder characterized by attacks
of debilitating pain associated with photophobia,
phonophobia, nausea and vomiting [1].
Almotriptan Malate (ALM), a triptan derivative is
a novel selective 5-hydroxytryptamine1B/1D
receptor agonist indicated for the acute
treatment of migraine with or without aura in
adults [2]. During an attack, the blood vessels in
the brain dilate and then draw together with
stimulation of nerve endings near the affected
blood vessels. These changes in the blood
vasculature may be responsible for the pain.
However, the exact cause of migraine, whether it
is a vascular or a neurological dysfunction still
remains unclear. Therapeutic approaches for
management of migraine has a strong rationale
however, it is still a poorly understood
phenomenon [3].
ALM is generally given by oral route and
available commercially as conventional
immediate release solid oral dosage form. ALM is
well absorbed after oral administration [4], with
absolute bioavailability of about 70%. The
optimal dose for ALM is a 12.5 mg at the start of
a migraine headache, which may be repeated
once in 2 h to a maximum of 25 mg/24 h. Low
oral bioavailability, frequent administration due
to lower plasma half-life of 3 - 4 h and associated
symptoms such as nausea and vomiting makes
oral treatment unsatisfactory and justifies a need
of an alternate route for drug delivery [5, 6].
Amongst the different routes for drug
administration, nasal delivery offers an *Author for Correspondence:
Email: [email protected]
Zaheer Abbas et al / Indian Journal of Novel Drug Delivery 6 (1), Jan-Mar, 2014, 10-24
11
interesting alternative for achieving systemic
drug effects to the parenteral route, which can be
inconvenient or oral administration, which can
result in unacceptably low plasma drug levels.
Conventionally, the nasal cavity is used for the
treatment of local diseases, such as rhinitis and
nasal congestion [7]. However, in the past few
decades, nasal drug delivery has been paid much
more attention as a promising drug
administration route for the systemic therapy.
The nasal cavity as a site for the systemic
absorption of drugs has some advantages such as
relatively large surface area, porous endothelial
basement membrane, highly vascularized
epithelial layer, enhanced blood flow, avoiding
the first-pass metabolism and ready accessibility.
However, the major limitation in respect to the
nasal route of drug administration is the poor
contact time of the formulation with the nasal
mucosa [8, 9].
The nasal mucociliary clearance system
transports the mucus layer that covers the nasal
epithelium towards the nasopharynx by ciliary
beating [10]. Its function is to protect the
respiratory system from damage by inhaled
substances. Normal mucociliary transit time in
humans has been reported to be 12 to 15 min.
The average rate of nasal clearance is about 8
mm/min, ranging from less than 1 to more than
20 mm/min. Nasal mucociliary clearance is one
of the most important limiting factor for nasal
drug delivery. It severely limits the time allowed
for drug absorption to occur and effectively rules
out sustained nasal drug administration. Several
approaches are discussed in the literature to
increase the residence time of drug formulations
in the nasal cavity, resulting in improved nasal
drug absorption [11].
Amongst the various approaches available to
enhance the transnasal delivery of drugs, the
mucoadhesive microsphere drug delivery system
is an attractive concept that has the ability to
control the rate of drug clearance from the nasal
cavity as well as to protect the drug from
enzymatic degradation [12]. The microspheres
swell in contact with nasal mucosa and form a
gel-like layer, which controls the rate of
clearance from the nasal cavity. In the presence
of microspheres, the nasal mucosa is dehydrated
due to moisture uptake by the microspheres.
This results in reversible shrinkage of the cells,
providing a temporary physical separation of the
tight (intercellular) junction, which increase the
absorption of the drug. Hence, a formulation that
would increase residence time in the nasal cavity
and at the same time increased absorption of
drug would be highly beneficial in all respects [13].
Sodium alginate is a water-soluble, natural,
linear polysaccharide which is most widely used
as a polymer matrix due to its non-toxicity,
biocompatibility and gel formation ability [14]. It
has been reported that polyanion polymers are
more effective bioadhesives than polycation
polymers or non-ionic polymers [15]. Alginate,
with its carboxyl end groups, is classified as
anionic mucoadhesive polymer and studies have
shown that alginate has the highest
mucoadhesive strength compared with polymers
such as polystyrene, chitosan,
carboxymethylcellulose and poly (lactic acid).
Sodium alginate develops a simple and rapid
gelation with divalent metal ions such as Ca2+,
therefore many researchers used it as the matrix
to prepare microparticles. It can be cross-linked
with divalent or polyvalent cations to form an
insoluble meshwork. Ca2+ and Zn2+ have been
reported for cross-linking of acid groups of
alginate [16]. However, Ca2+ is preferred as it
selectively binds to the guluronic acid units to
form an ‘egg-box’ model. Preparation of alginate
microparticles is reported by emulsification
cross-linking with calcium salts [17], polylysine [18]
or chitosan [19] by ionotropic gelation [20].
Optimization using factorial designs is a
powerful, efficient and systematic tool that
shortens the time required for the development
of pharmaceutical dosage forms and improves
research and development work. Factorial
designs, where all the factors are studied in all
possible combinations, are considered to be the
most efficient in estimating the influence of
individual variables and their interactions using
minimum experiments [21]. The application of
factorial design in pharmaceutical formulation
development has played a key role in
understanding the relationship between the
independent variables and the responses to
them. The independent variables are
controllable, whereas responses are dependent.
The contour plot gives a visual representation of
the values of the response. This helps the process
of optimization by providing an empirical model
equation for the response as a function of the
different variables [22, 23].
The current investigation was aimed at
improving the therapeutic efficacy of ALM by
preparing Sodium alginate (SA) microspheres for
nasal administration. The microspheres were
Zaheer Abbas et al / Indian Journal of Novel Drug Delivery 6 (1), Jan-Mar, 2014, 10-24
12
prepared by utilizing a 23 factorial design. The
effect of some factors, such as drug: polymer
ratio, concentration of cross-linking agent and
cross-linking time on particle size and in vitro
mucoadhesion was investigated.
MATERIALS AND METHODS
Almotriptan Malate was obtained as gift sample
from Apotex Research Private Limited,
Bangalore. Sodium Alginate was purchased from
Finar Chemicals Private Limited, Ahmedabad. n-
octanol, calcium chloride and Span 80 were
procured from S.D. Fine chemicals, Mumbai,
India. All other reagents used were of analytical
grade commercially available from Merck Pvt.
Ltd., Mumbai, India.
Preparation of sodium alginate microspheres
The formula for the various batches of
microspheres is shown in Table 1. ALM loaded
sodium alginate microspheres were prepared by
water in oil emulsification method followed by
cross-linking with calcium chloride [24]. ALM was
dispersed in an aqueous solution containing 3%,
w/v sodium alginate. The solution was dispersed
in n-octanol containing 2% v/v Span 80 using a
mechanical stirrer (Remi stirrer, Mumbai, India)
at 1800 rpm. The ratio of the aqueous to n-
octanol phase used was 1:20. The resultant w/o
emulsion was stirred for 30 min. Calcium
chloride solution was added drop-wise and the
dispersion was stirred for another 5 min. The
microspheres were collected by vacuum
filtration, washed three times with isopropyl
alcohol and dried in air at room temperature.
Various variables like drug: polymer ratio,
concentration of cross-linking agent and time of
cross-linking were considered for optimization
of the formulation.
Experimental design
Various batches of alginate microspheres were
prepared based on the 23 factorial designs. The
independent variables were drug to polymer
ratio(X1), calcium chloride concentration (X2)
and cross-linking time (X3). The independent
variables and their levels are shown in Table 2.
Particle size of the microspheres (Y1) and in vitro
mucoadhesion (Y2) were taken as response
parameters as the dependent variables. Table 1
shows the independent and dependent variables.
Characterization of ALM loaded alginate
microspheres
Percentage Yield:
The practical percentage yield was calculated
from the weight of dried microspheres recovered
from each batch in relation to the sum of the
initial weight of starting materials. The
percentage yield [25] was calculated using the
following formula:
% yield �
Practical mass �Microspheres�
Theoretical mass �Polymer � Drug� x 100
Shape and Surface Morphology:
The shape and surface characteristics of the
microspheres [26] were evaluated by means of
scanning electron microscopy (JEOL – JSM -
840A, Japan). The samples were prepared by
gently sprinkling the microspheres on a double
adhesive tape, which is stuck to an aluminium
stub. The stubs were then coated with gold
using a sputter coater (JEOL Fine coat JFC
1100E, ion sputtering device) under high
vacuum and high voltage to achieve a film
thickness of 30 nm. The samples were then
imaged using a 20 KV electron beam.
Drug Encapsulation Efficiency:
Microspheres equivalent to 10 mg of ALM
were crushed in a glass mortar and pestle
and the powdered microspheres were
suspended in 25 mL of phosphate buffer pH 6.4.
After 24 h, the solution was filtered, 1 mL of the
filtrate was pipetted out and diluted to 10 ml and
analyzed for the drug content using Elico SL- 159
UV Visible spectrophotometer at 228 nm [27]. It
was confirmed from preliminary UV studies that
the presence of dissolved polymers did not
interfere with the absorbance of the drug at 228
nm. The drug encapsulation efficiency [28] was
calculated using the following formula:
% Drug encapsulation ef iciency �
Practical drug content
Theoretical drug content X 100
Particle Size Measurement:
Particle size of the microspheres [29] was
determined by optical microscopy using an
optical microscope Olympus BH2-UMA
(Olympus, NWF 10x, India). The eye piece
micrometer was calibrated with the help of a
stage micrometer. The particle diameters of
more than 300 microspheres were measured
randomly. The average particle size [30] was
determined by using Edmondson’s equation.
D"#$% �∑ nd
∑ n
Zaheer Abbas et al / Indian Journal of Novel Drug Delivery 6 (1), Jan-Mar, 2014, 10-24
13
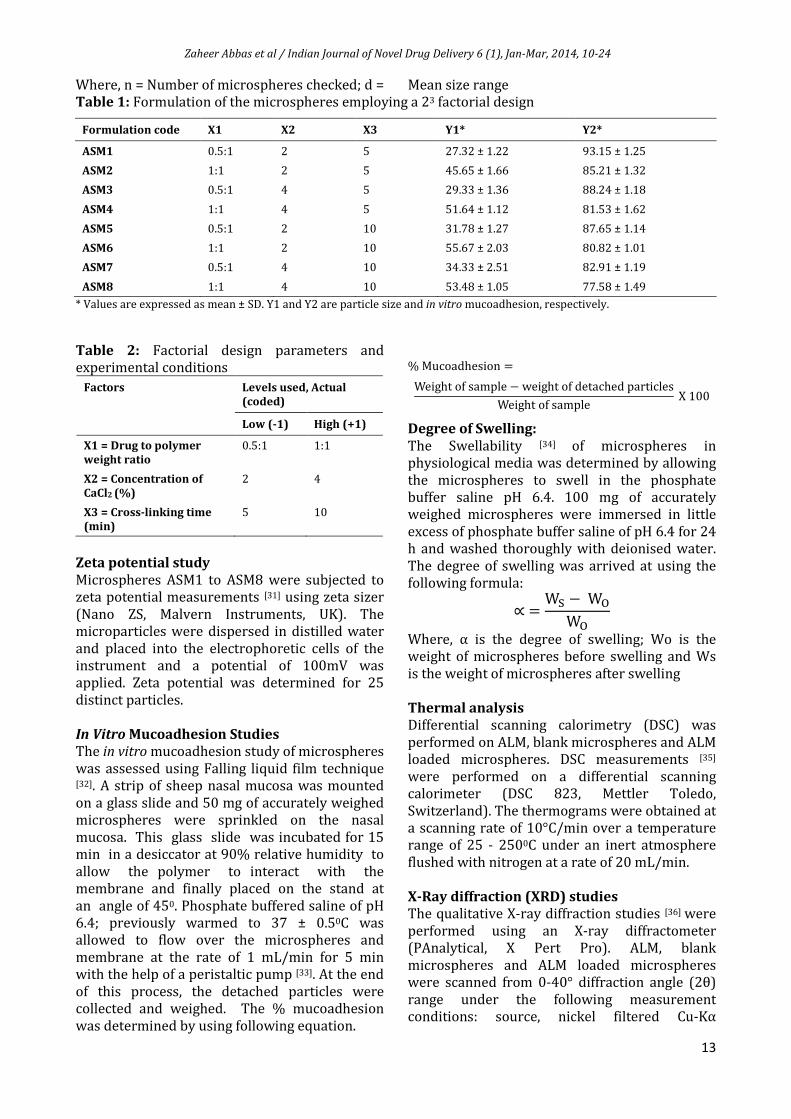
Where, n = Number of microspheres checked; d = Mean size range
Table 1: Formulation of the microspheres employing a 23 factorial design
Formulation code X1 X2 X3 Y1* Y2*
ASM1 0.5:1 2 5 27.32 ± 1.22 93.15 ± 1.25
ASM2 1:1 2 5 45.65 ± 1.66 85.21 ± 1.32
ASM3 0.5:1 4 5 29.33 ± 1.36 88.24 ± 1.18
ASM4 1:1 4 5 51.64 ± 1.12 81.53 ± 1.62
ASM5 0.5:1 2 10 31.78 ± 1.27 87.65 ± 1.14
ASM6 1:1 2 10 55.67 ± 2.03 80.82 ± 1.01
ASM7 0.5:1 4 10 34.33 ± 2.51 82.91 ± 1.19
ASM8 1:1 4 10 53.48 ± 1.05 77.58 ± 1.49
* Values are expressed as mean ± SD. Y1 and Y2 are particle size and in vitro mucoadhesion, respectively.
Table 2: Factorial design parameters and
experimental conditions
Factors Levels used, Actual
(coded)
Low (-1) High (+1)
X1 = Drug to polymer
weight ratio
0.5:1 1:1
X2 = Concentration of
CaCl2 (%)
2 4
X3 = Cross-linking time
(min)
5 10
Zeta potential study
Microspheres ASM1 to ASM8 were subjected to
zeta potential measurements [31] using zeta sizer
(Nano ZS, Malvern Instruments, UK). The
microparticles were dispersed in distilled water
and placed into the electrophoretic cells of the
instrument and a potential of 100mV was
applied. Zeta potential was determined for 25
distinct particles.
In Vitro Mucoadhesion Studies
The in vitro mucoadhesion study of microspheres
was assessed using Falling liquid film technique [32]. A strip of sheep nasal mucosa was mounted
on a glass slide and 50 mg of accurately weighed
microspheres were sprinkled on the nasal
mucosa. This glass slide was incubated for 15
min in a desiccator at 90% relative humidity to
allow the polymer to interact with the
membrane and finally placed on the stand at
an angle of 450. Phosphate buffered saline of pH
6.4; previously warmed to 37 ± 0.50C was
allowed to flow over the microspheres and
membrane at the rate of 1 mL/min for 5 min
with the help of a peristaltic pump [33]. At the end
of this process, the detached particles were
collected and weighed. The % mucoadhesion
was determined by using following equation.
% Mucoadhesion �
Weight of sample ( weight of detached particles
Weight of sample X 100
Degree of Swelling:
The Swellability [34] of microspheres in
physiological media was determined by allowing
the microspheres to swell in the phosphate
buffer saline pH 6.4. 100 mg of accurately
weighed microspheres were immersed in little
excess of phosphate buffer saline of pH 6.4 for 24
h and washed thoroughly with deionised water.
The degree of swelling was arrived at using the
following formula:
* �W+ ( W,
W,
Where, α is the degree of swelling; Wo is the
weight of microspheres before swelling and Ws
is the weight of microspheres after swelling
Thermal analysis
Differential scanning calorimetry (DSC) was
performed on ALM, blank microspheres and ALM
loaded microspheres. DSC measurements [35]
were performed on a differential scanning
calorimeter (DSC 823, Mettler Toledo,
Switzerland). The thermograms were obtained at
a scanning rate of 10°C/min over a temperature
range of 25 - 2500C under an inert atmosphere
flushed with nitrogen at a rate of 20 mL/min.
X-Ray diffraction (XRD) studies
The qualitative X-ray diffraction studies [36] were
performed using an X-ray diffractometer
(PAnalytical, X Pert Pro). ALM, blank
microspheres and ALM loaded microspheres
were scanned from 0-40° diffraction angle (2θ)
range under the following measurement
conditions: source, nickel filtered Cu-Kα
Zaheer Abbas et al / Indian Journal of Novel Drug Delivery 6 (1), Jan-Mar, 2014, 10-24
14
radiation; voltage 40 Kv; current 30mA; scan
speed 0.05/min. Microspheres were triturated to
get fine powder before taking the scan. X-ray
diffractometry was carried out to investigate the
effect of microencapsulation process on
crystallinity of the drug.
In Vitro Drug Diffusion Studies
Preparation of nasal mucosa: Fresh sheep nasal
mucosa was collected from a nearby slaughter
house. The nasal mucosa of sheep was separated
from sub layer bony tissues and stored in
distilled water containing few drops of
Gentamycin injection. After complete removal of
blood from mucosal surface, it was attached to
the donor chamber tube [37].
In vitro nasal diffusion study was done using
nasal diffusion cell, having three openings each
for sampling, thermometer and donor tube
chamber. The receptor compartment has a
capacity of 60 mL in which Phosphate buffer, pH
6.4 was taken [38]. Within 80 min of removal, the
nasal mucosa measuring an area of 3 cm2 was
carefully cut with a scalpel and tied to the donor
tube chamber and it was placed establishing
contact with the diffusion medium in the
recipient chamber. Microspheres equivalent to
10 mg of ALM were spread on the sheep nasal
mucosa. At hourly intervals, 1 mL of the
diffusion sample was withdrawn with the help of
a hypodermic syringe, diluted to 10 mL and
absorbance was read at 228 nm. Each time, the
sample withdrawn was replaced with 1 mL of
pre-warmed buffer solution (pH 6.4) to maintain
a constant volume of the receptor compartment
vehicle.
Optimization data analysis and model-
validation
ANOVA was used to establish the statistical
validation of the polynomial equations generated
by Design Expert® software (version 9.0, Stat-
Ease Inc, Minneapolis, MN). Fitting a multiple
linear regression model to a 23 factorial design
gave a predictor equation which was a first-
order polynomial, having the form:
- � ./ � .010 � .212 � .313 � .021012
� .031013 � .231213
� .023101213
where Y is the measured response associated
with each factor level combination; b0 is an
intercept representing the arithmetic average of
all quantitative outcomes of eight runs; b1 to b123
are regression coefficients computed from the
observed experimental values of Y and X1, X2 and
X3 are the coded levels of independent variables.
The terms X1X2, X2X3 and X1X3 represent the
interaction terms. The main effects (X1, X2 and
X3) represent the average result of changing one
factor at a time from its low to high value. The
interaction terms show how the response
changes when two factors are changed
simultaneously. The polynomial equation was
used to draw conclusions after considering the
magnitude of coefficients and the mathematical
sign it carries, i.e. positive or negative. A positive
sign signifies a synergistic effect, whereas a
negative sign stands for an antagonistic effect [22].
In the model analysis, the responses: the particle
size of the microspheres and in vitro
mucoadhesion of all model formulations were
treated by Design Expert® software. The best
fitting mathematical model was selected based
on the comparisons of several statistical
parameters including the coefficient of variation
(CV), the multiple correlation coefficient (R2),
adjusted multiple correlation coefficient
(adjusted R2) and the predicted residual sum of
square (PRESS), provided by Design Expert®
software. Among them, PRESS indicates how well
the model fits the data and for the chosen model
it should be small relative to the other models
under consideration. Level of significance was
considered at p < 0.05. Three dimensional
response surface plots and two dimensional
contour plots resulting from equations were
obtained by the Design Expert® software.
Subsequently, the desirability approach was used
to generate the optimum settings for the
formulations [39, 40].
456789 :;<7=: - � .010 � .212 � .313
2@A�56B798CB5;6�:;<7=: -
� .010 � .212 � .313
� .021012 � .031013 � .231213
RESULTS AND DISCUSSION
ALM loaded microspheres of Sodium alginate
were successfully fabricated by water in oil
emulsification cross-linking method employing
calcium chloride as cross linking agent. During
the process of microsphere preparation, the drug
may partition out into the aqueous phase due to
its hydrophilic nature, hence in the present
investigation n-Octanol was used as the
harvesting medium. In this condition, ALM would
find it non-favourable to diffuse out of the
microspheres before they harden thus resulting
in sufficiently high encapsulation efficiency.
Zaheer Abbas et al / Indian Journal of Novel Drug Delivery 6 (1), Jan-Mar, 2014, 10-24
15
Table 3: Characteristics of the prepared ALM-loaded alginate microspheres
Formulation code % Yield % encapsulation efficiency* Degree of swelling*
ASM1 85.62 89.11 ± 0.95 1.104 ± 0.151
ASM2 89.24 74.19 ± 1.21 1.098 ± 0.069
ASM3 76.55 84.59 ± 1.62 0.843 ± 0.210
ASM4 84.98 71.23 ± 1.94 0.895 ± 0.168
ASM5 88.95 85.29 ± 2.16 0.914 ± 0.054
ASM6 92.84 72.44 ± 1.47 0.902 ± 0.176
ASM7 89.62 83.39 ± 0.62 0.780 ± 0.235
ASM8 94.73 69.62 ± 1.15 0.766 ± 0.319
* Values are expressed as mean ± SD.
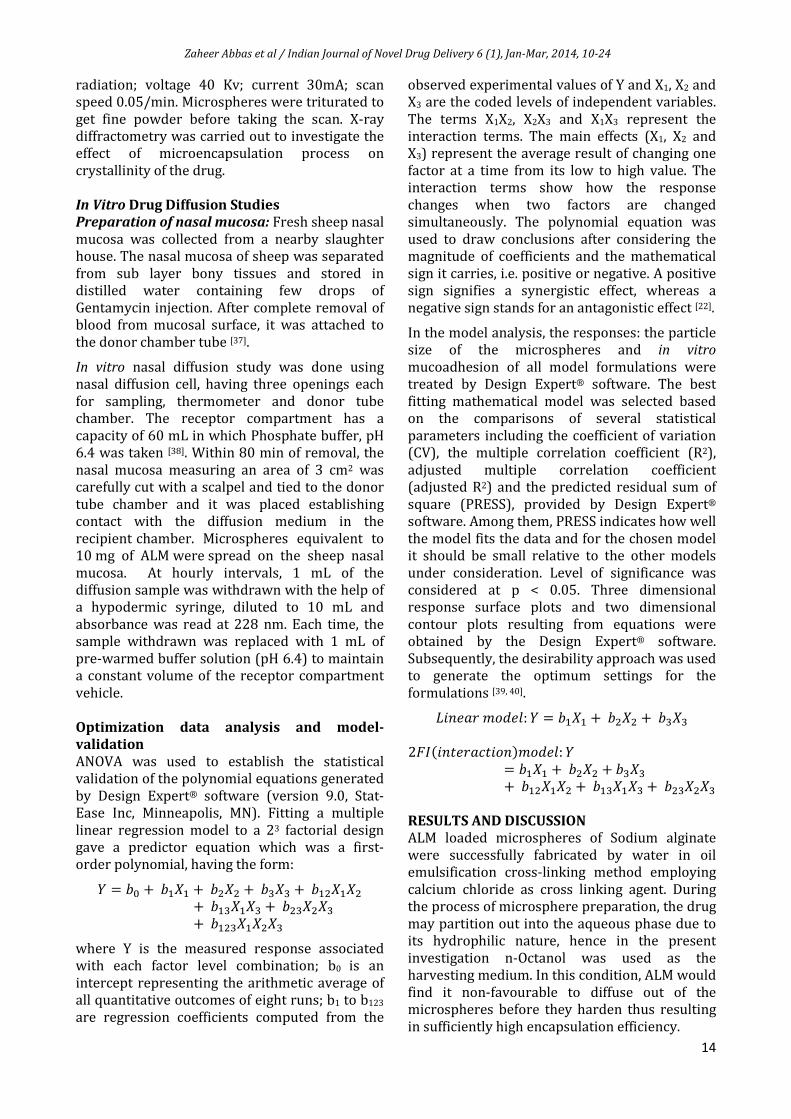
Figure 1: SEM Photograph of ALM Loaded alginate microspheres at low (a) and high (b) magnification
It was observed that as the drug to polymer ratio
increased from 0.5:1 to 1:1, the product yield
also increased. The low percentage yield in some
of the formulations may be due to loss of
microspheres during the washing process. The
percentage yield was found to be in the range of
76.55 to 94.73%. The photographs of the
optimized formulation (ASM1) taken by scanning
electron microscope are depicted in the Figure 1.
The SEM photographs revealed that the
microspheres were discrete and spherical in
shape with nearly smooth surface morphology.
These microspheres had no pores on the surface;
such morphology would result in slow clearance
and good deposition pattern in nasal cavity.
As the drug to polymer ratio was varied from
0.5:1 to 1:1, it was observed that the particle size
increased, whereas, encapsulation efficiency
decreased. The drug encapsulation efficiency was
found to be in the range between 69.62 ± 1.15% -
89.11 ± 0.95% and revealed its dependency on
drug loading, amount of cross-linking agent and
time of cross-linking. The formulations loaded
with higher amount of drug (ASM2, ASM4, ASM6,
ASM8) exhibited decrease encapsulation
efficiencies which could be related to the
increased extent of drug diffusion to the external
phase due to greater flux at higher drug content
during the emulsification and microsphere
formation process. The decrease in
encapsulation efficiency with increase in
concentration of calcium chloride and cross-
linking time could be attributed either to an
increase in cross-link density, which will reduce
the free volume spaces within the polymer
matrix or incomplete emulsification as a result of
higher viscosity of the internal phase. The %
yield and drug encapsulation efficiency of the
prepared microspheres is compiled in Table 3.
The prepared microspheres were in the mean
particle size range of 27.32 ± 1.22 µm to 55.67 ±
2.03 µm, ideal for intranasal absorption.
Preliminary studies showed that as the
concentration of polymer was increased, the
particle size also proportionally increased.
Lower sodium alginate concentrations (1% w/v
and 2% w/v) resulted in clumping of
(a) (b)
Zaheer Abbas et al / Indian Journal of Novel Drug Delivery 6 (1), Jan-Mar, 2014, 10-24
16
microspheres, whereas high sodium alginate
concentration (4% w/v) resulted in formation of
discrete microspheres with a mean particle size
greater than 80 µm which could be attributed to
an increase in the relative viscosity at higher
concentration of polymer and formation of larger
particles during emulsification. Hence an
optimum sodium alginate concentration of 3%
w/v was selected for preparing the different
batches of the microspheres. The mean particle
size of the microspheres increased with an
increase in drug loading. This can be attributed
to the corresponding increase in viscosity of
drug–polymer dispersion comprising the
internal phase of the emulsion. The increase in
viscosity within the internal phase results in the
generation of a coarser emulsion with larger
droplets, leading eventually to the formation of
larger microspheres. A similar increase in the
size of microspheres was also observed with
increase in calcium chloride concentration as
well as cross-linking time. The addition of higher
amount of Ca2+ will result in relatively more
crosslinking of the guluronic acid units of sodium
alginate, thereby leading to formation of larger
microspheres. Similarly, increasing the cross-
linking time will increase the extent of cross-
linking and thereby increase the particle size.
The mean particle size (Y1) of the prepared
microspheres is presented in Table 1.
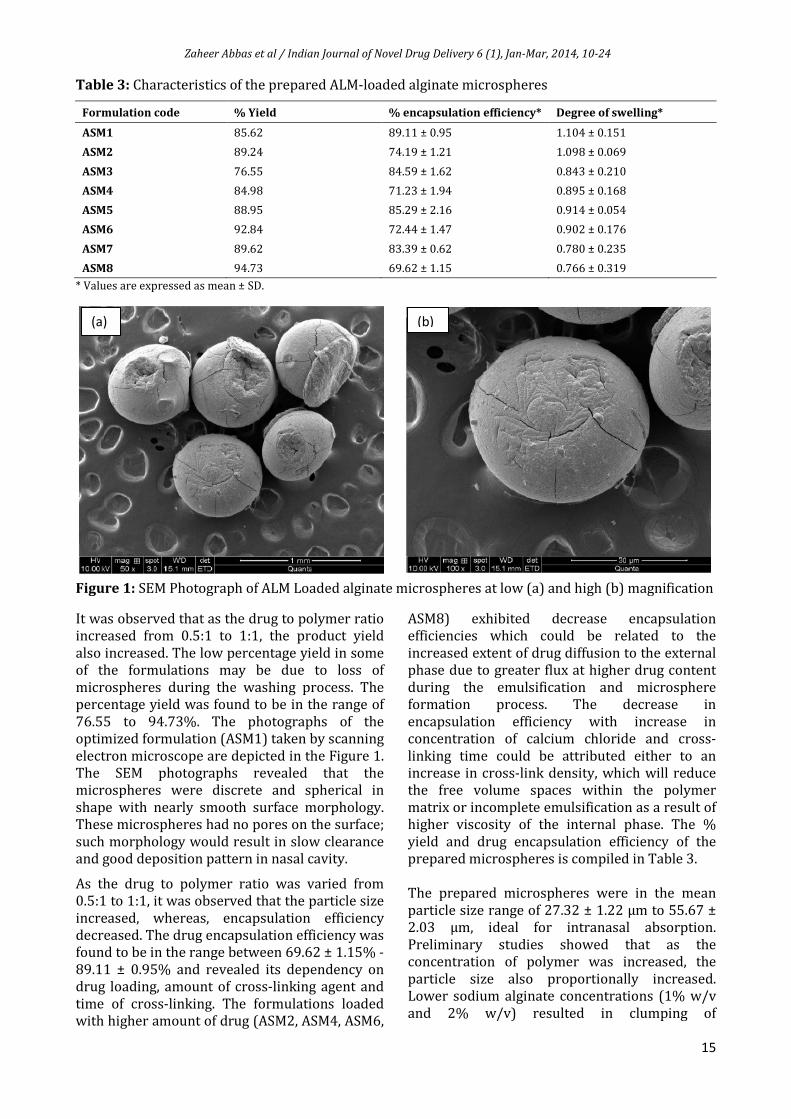
Zeta potential analysis was performed to get the
information about the surface properties of the
microspheres. All microspheres prepared were
negatively charged, indicating the presence of SA
at the surface of all microspheres formed. Studies
have cited that polymers with charged density
can serve as good mucoadhesive agents. It has
also been reported that anion polymers are more
effective bioadhesive than polycations or non-
ionic polymers. Zeta potential distribution curve
of the optimum formulation (ASM1) is depicted
in Fig. 2.
Figure 2: Zeta potential distribution curve of
ALM-Loaded alginate microspheres (ASM1)
The results of in vitro mucoadhesion test (Y2) are
displayed in Table 1. The prepared microspheres
had satisfactory mucoadhesive properties
ranging from 77.58 ± 1.49% to 93.15 ± 1.25%
and could adequately adhere on nasal mucosa.
The results also showed that, with increasing
polymer ratio, higher mucoadhesion percentages
were obtained. This could be attributed to the
availability of a higher amount of polymer for
interaction with mucus. Increase in calcium
chloride concentration and cross-linking time
decreased the mucoadhesive property of the
microspheres. Most of the studies showed that
the pre-requisite for a good mucoadhesion is the
high flexibility of polymer backbone structure
and its polar functional groups. Such a flexibility
of the polymer chains, however, is reduced if the
polymer molecules are cross-linked either with
each other or with coagulation agents like
calcium ions. Although the cross-linked
microspheres will absorb water, they are
insoluble and will not form a liquid gel on the
nasal epithelium but rather a more solid gel-like
structure. This decrease in flexibility imposed
upon polymer chains by the cross-linking makes
it more difficult for cross-linked polymers to
penetrate the mucin network [41]. Thus, cross-
linking effectively limits the length of polymer
chains that can penetrate the mucus layer and
could possibly decrease the mucoadhesion
strength of the microspheres. The formulation,
ASM1, with highest mucoadhesion (93.15 ±
1.25%) was considered to be the best
formulation.
Swellability is an indicative parameter for rapid
availability of drug solution for diffusion with
greater flux. Swellability data revealed that the
amount of polymer plays an important role in
solvent transfer. It can be concluded from the
data shown in Table 3 that, with an increase in
calcium chloride concentration and cross-linking
time, the degree of swelling decreased in the
range from 1.104 ± 0.151 to 0.766 ± 0.319. This
tendency could be attributed to greater
crosslinking degree of the polymer resulting in
rigid microspheres which lowers the solvent
transfer rate, reduced swelling and thus reduced
mucoadhesiveness.
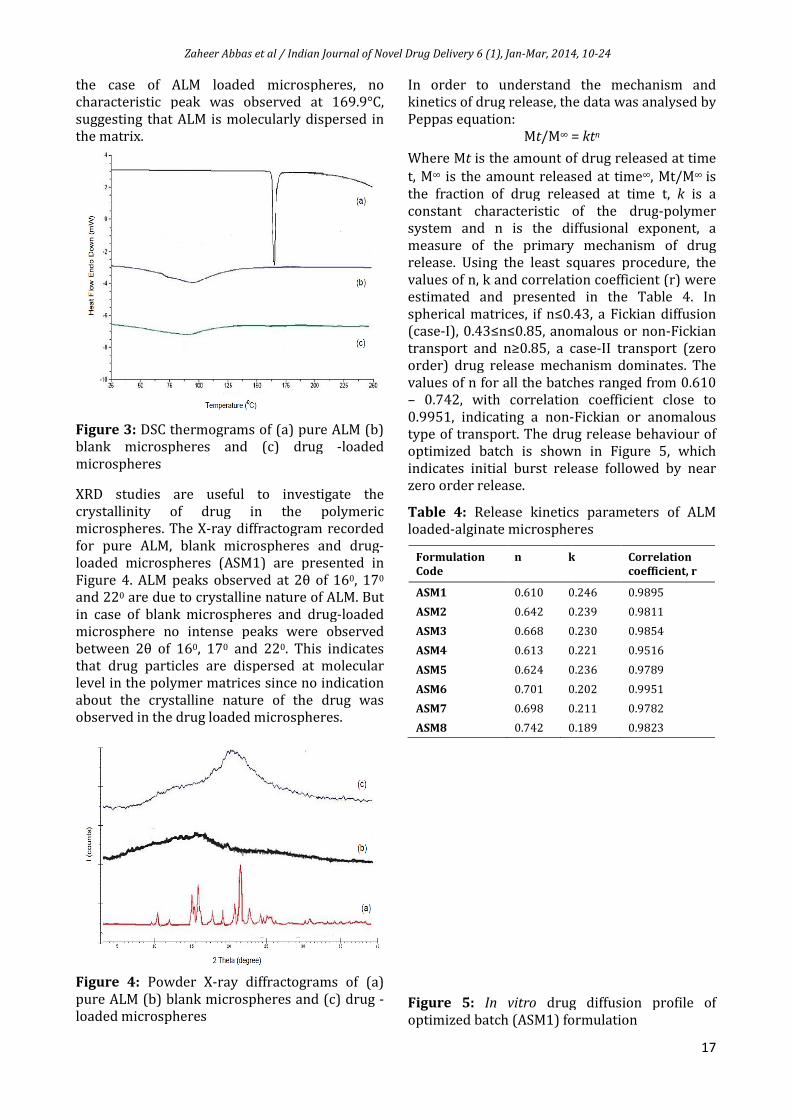
In an effort to assess the physical state of the
drug in the SA microspheres, we attempted to
analyze ALM, blank microspheres and drug-
loaded microspheres (ASM1) using DSC. The
results are displayed in Figure 3. The DSC
thermogram showed a sharp endothermic peak
at 169.9°C due to the melting of the ALM but, in
Zaheer Abbas et al / Indian
the case of ALM loaded microspheres, no
characteristic peak was observed at 169.9°C,
suggesting that ALM is molecularly dispersed in
the matrix.
Figure 3: DSC thermograms of (a) pure ALM (b)
blank microspheres and (c) drug
microspheres
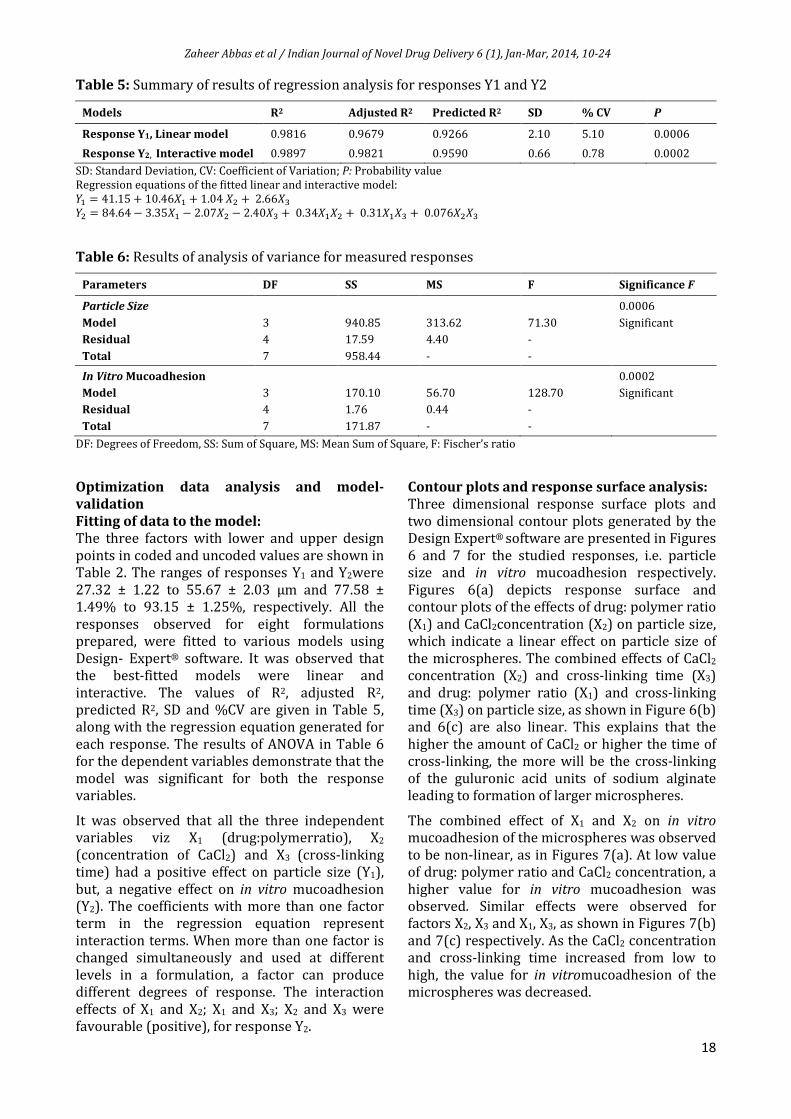
XRD studies are useful to investigate the
crystallinity of drug in the polymeric
microspheres. The X-ray diffractogram recorded
for pure ALM, blank microspheres and drug
loaded microspheres (ASM1) are presen
Figure 4. ALM peaks observed at 2θ of 16
and 220 are due to crystalline nature of ALM. But
in case of blank microspheres and drug
microsphere no intense peaks were observed
between 2θ of 160, 170 and 220. This indicates
that drug particles are dispersed at molecular
level in the polymer matrices since no indication
about the crystalline nature of the drug was
observed in the drug loaded microspheres.
Figure 4: Powder X-ray diffractograms of (a)
pure ALM (b) blank microspheres and (c) drug
loaded microspheres
et al / Indian Journal of Novel Drug Delivery 6 (1), Jan-Mar, 2014,
the case of ALM loaded microspheres, no
characteristic peak was observed at 169.9°C,
suggesting that ALM is molecularly dispersed in
DSC thermograms of (a) pure ALM (b)
microspheres and (c) drug -loaded
XRD studies are useful to investigate the
crystallinity of drug in the polymeric
ray diffractogram recorded
microspheres and drug-
loaded microspheres (ASM1) are presented in
Figure 4. ALM peaks observed at 2θ of 160, 170
are due to crystalline nature of ALM. But
in case of blank microspheres and drug-loaded
microsphere no intense peaks were observed
. This indicates
les are dispersed at molecular
level in the polymer matrices since no indication
about the crystalline nature of the drug was
observed in the drug loaded microspheres.
ray diffractograms of (a)
pure ALM (b) blank microspheres and (c) drug -
In order to understand the mechanism and
kinetics of drug release, the data was analysed by
Peppas equation:
Mt/M∞ =
Where Mt is the amount of drug
t, M∞ is the amount released at time
the fraction of drug released at time t,
constant characteristic of the drug
system and n is the diffusional exponent, a
measure of the primary mechanism of drug
release. Using the least squares procedure, the
values of n, k and correlation coefficient (r) were
estimated and presented in the Table 4. In
spherical matrices, if n≤0.43, a Fickian diffusion
(case-I), 0.43≤n≤0.85, anomalous or non
transport and n≥0.85, a case
order) drug release mechanism dominates. The
values of n for all the batches ranged fro
– 0.742, with correlation coefficient close to
0.9951, indicating a non-
type of transport. The drug release behaviour of
optimized batch is shown in Figure 5, which
indicates initial burst release followed by near
zero order release.
Table 4: Release kinetics parameters of ALM
loaded-alginate microspheres
Formulation
Code
n k
ASM1 0.610 0.246
ASM2 0.642 0.239
ASM3 0.668 0.230
ASM4 0.613 0.221
ASM5 0.624 0.236
ASM6 0.701 0.202
ASM7 0.698 0.211
ASM8 0.742 0.189
Figure 5: In vitro drug diffusion profile of
optimized batch (ASM1) formulation
14, 10-24
17
In order to understand the mechanism and
kinetics of drug release, the data was analysed by
= ktn
is the amount of drug released at time
is the amount released at time∞, Mt/M∞ is
the fraction of drug released at time t, k is a
constant characteristic of the drug-polymer
system and n is the diffusional exponent, a
measure of the primary mechanism of drug
release. Using the least squares procedure, the
values of n, k and correlation coefficient (r) were
ed in the Table 4. In
≤0.43, a Fickian diffusion
≤n≤0.85, anomalous or non-Fickian
≥0.85, a case-II transport (zero
order) drug release mechanism dominates. The
values of n for all the batches ranged from 0.610
0.742, with correlation coefficient close to
-Fickian or anomalous
type of transport. The drug release behaviour of
optimized batch is shown in Figure 5, which
indicates initial burst release followed by near
Release kinetics parameters of ALM
alginate microspheres
k Correlation
coefficient, r
0.246 0.9895
0.239 0.9811
0.230 0.9854
0.221 0.9516
0.236 0.9789
0.202 0.9951
0.211 0.9782
0.189 0.9823
drug diffusion profile of
optimized batch (ASM1) formulation
Zaheer Abbas et al / Indian Journal of Novel Drug Delivery 6 (1), Jan-Mar, 2014, 10-24
18
Table 5: Summary of results of regression analysis for responses Y1 and Y2
Models R2 Adjusted R2 Predicted R2 SD % CV P
Response Y1, Linear model 0.9816 0.9679 0.9266 2.10 5.10 0.0006
Response Y2, Interactive model 0.9897 0.9821 0.9590 0.66 0.78 0.0002
SD: Standard Deviation, CV: Coefficient of Variation; P: Probability value
Regression equations of the fitted linear and interactive model:
-0 � 41.15 � 10.4610 � 1.04 12 � 2.6613
-2 � 84.64 ( 3.3510 ( 2.0712 ( 2.4013 � 0.341012 � 0.311013 � 0.0761213
Table 6: Results of analysis of variance for measured responses
Parameters DF SS MS F Significance F
Particle Size
Model
Residual
Total
3
4
7
940.85
17.59
958.44
313.62
4.40
-
71.30
-
-
0.0006
Significant
In Vitro Mucoadhesion
Model
Residual
Total
3
4
7
170.10
1.76
171.87
56.70
0.44
-
128.70
-
-
0.0002
Significant
DF: Degrees of Freedom, SS: Sum of Square, MS: Mean Sum of Square, F: Fischer’s ratio
Optimization data analysis and model-
validation
Fitting of data to the model:
The three factors with lower and upper design
points in coded and uncoded values are shown in
Table 2. The ranges of responses Y1 and Y2were
27.32 ± 1.22 to 55.67 ± 2.03 µm and 77.58 ±
1.49% to 93.15 ± 1.25%, respectively. All the
responses observed for eight formulations
prepared, were fitted to various models using
Design- Expert® software. It was observed that
the best-fitted models were linear and
interactive. The values of R2, adjusted R2,
predicted R2, SD and %CV are given in Table 5,
along with the regression equation generated for
each response. The results of ANOVA in Table 6
for the dependent variables demonstrate that the
model was significant for both the response
variables.
It was observed that all the three independent
variables viz X1 (drug:polymerratio), X2
(concentration of CaCl2) and X3 (cross-linking
time) had a positive effect on particle size (Y1),
but, a negative effect on in vitro mucoadhesion
(Y2). The coefficients with more than one factor
term in the regression equation represent
interaction terms. When more than one factor is
changed simultaneously and used at different
levels in a formulation, a factor can produce
different degrees of response. The interaction
effects of X1 and X2; X1 and X3; X2 and X3 were
favourable (positive), for response Y2.
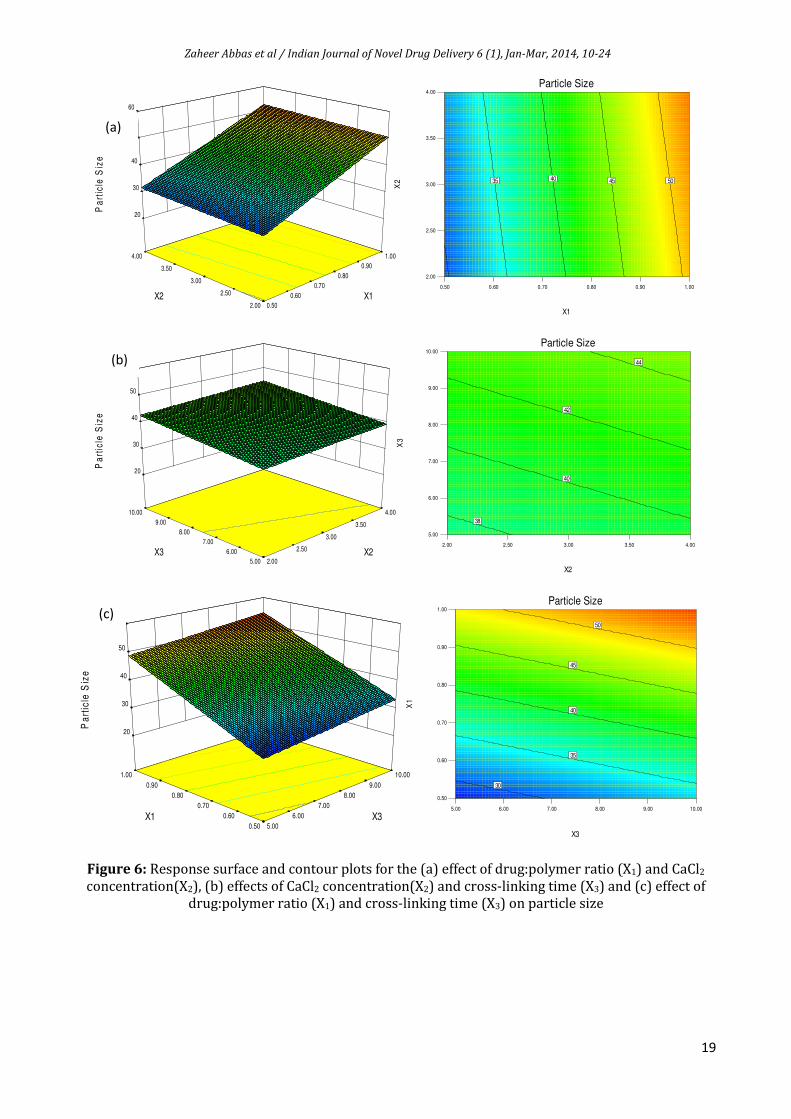
Contour plots and response surface analysis:
Three dimensional response surface plots and
two dimensional contour plots generated by the
Design Expert® software are presented in Figures
6 and 7 for the studied responses, i.e. particle
size and in vitro mucoadhesion respectively.
Figures 6(a) depicts response surface and
contour plots of the effects of drug: polymer ratio
(X1) and CaCl2concentration (X2) on particle size,
which indicate a linear effect on particle size of
the microspheres. The combined effects of CaCl2
concentration (X2) and cross-linking time (X3)
and drug: polymer ratio (X1) and cross-linking
time (X3) on particle size, as shown in Figure 6(b)
and 6(c) are also linear. This explains that the
higher the amount of CaCl2 or higher the time of
cross-linking, the more will be the cross-linking
of the guluronic acid units of sodium alginate
leading to formation of larger microspheres.
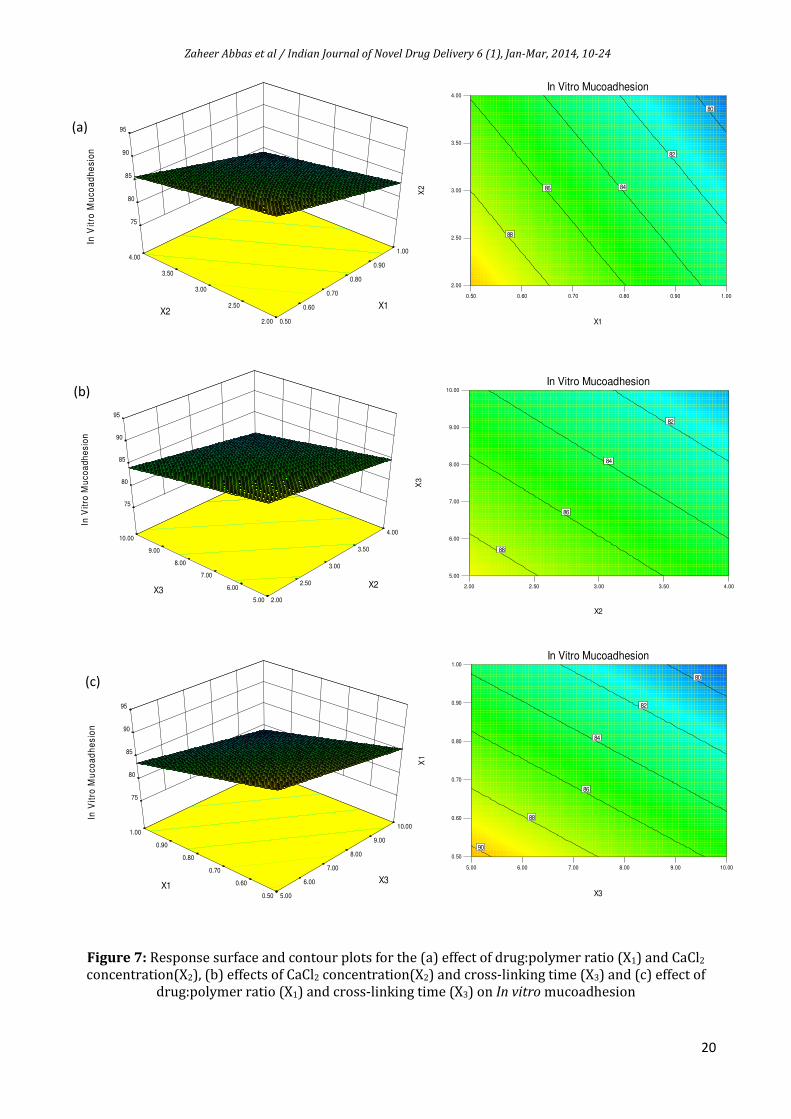
The combined effect of X1 and X2 on in vitro
mucoadhesion of the microspheres was observed
to be non-linear, as in Figures 7(a). At low value
of drug: polymer ratio and CaCl2 concentration, a
higher value for in vitro mucoadhesion was
observed. Similar effects were observed for
factors X2, X3 and X1, X3, as shown in Figures 7(b)
and 7(c) respectively. As the CaCl2 concentration
and cross-linking time increased from low to
high, the value for in vitromucoadhesion of the
microspheres was decreased.
Zaheer Abbas et al / Indian Journal of Novel Drug Delivery 6 (1), Jan-Mar, 2014, 10-24
19
Figure 6: Response surface and contour plots for the (a) effect of drug:polymer ratio (X1) and CaCl2
concentration(X2), (b) effects of CaCl2 concentration(X2) and cross-linking time (X3) and (c) effect of
drug:polymer ratio (X1) and cross-linking time (X3) on particle size
2.00
2.50
3.00
3.50
4.00
0.50
0.60
0.70
0.80
0.90
1.00
20
30
40
50
60
Pa
rtic
le S
ize
X1X2
0.50 0.60 0.70 0.80 0.90 1.00
2.00
2.50
3.00
3.50
4.00
Particle Size
X1
X2 35 40 45 50
2.00 2.50 3.00 3.50 4.00
5.00
6.00
7.00
8.00
9.00
10.00
Particle Size
X2
X3
38
40
42
44
5.00
6.00
7.00
8.00
9.00
10.00
2.00
2.50
3.00
3.50
4.00
20
30
40
50
60
Pa
rtic
le S
ize
X2X3
5.00 6.00 7.00 8.00 9.00 10.00
0.50
0.60
0.70
0.80
0.90
1.00
Particle Size
X3
X1
30
35
40
45
50
0.50
0.60
0.70
0.80
0.90
1.00
5.00
6.00
7.00
8.00
9.00
10.00
20
30
40
50
60
Pa
rtic
le S
ize
X3X1
(a) (a)
(b)
(c)
Zaheer Abbas et al / Indian Journal of Novel Drug Delivery 6 (1), Jan-Mar, 2014, 10-24
20
Figure 7: Response surface and contour plots for the (a) effect of drug:polymer ratio (X1) and CaCl2
concentration(X2), (b) effects of CaCl2 concentration(X2) and cross-linking time (X3) and (c) effect of
drug:polymer ratio (X1) and cross-linking time (X3) on In vitro mucoadhesion
2.00
2.50
3.00
3.50
4.00
0.50
0.60
0.70
0.80
0.90
1.00
75
80
85
90
95
In V
itro
Mu
co
ad
he
sio
n
X1X2
0.50 0.60 0.70 0.80 0.90 1.00
2.00
2.50
3.00
3.50
4.00
In Vitro Mucoadhesion
X1
X2
80
82
8486
88
5.00
6.00
7.00
8.00
9.00
10.00
2.00
2.50
3.00
3.50
4.00
75
80
85
90
95
In V
itro
Mu
co
ad
he
sio
n
X2X3
2.00 2.50 3.00 3.50 4.00
5.00
6.00
7.00
8.00
9.00
10.00
In Vitro Mucoadhesion
X2
X3
82
84
86
88
0.50
0.60
0.70
0.80
0.90
1.00
5.00
6.00
7.00
8.00
9.00
10.00
75
80
85
90
95
In V
itro
Mu
co
ad
he
sio
n
X3X1
5.00 6.00 7.00 8.00 9.00 10.00
0.50
0.60
0.70
0.80
0.90
1.00
In Vitro Mucoadhesion
X3
X1
80
82
84
86
88
90
(a)
(b)
(c)
Zaheer Abbas et al / Indian Journal of Novel Drug Delivery 6 (1), Jan-Mar, 2014, 10-24
21
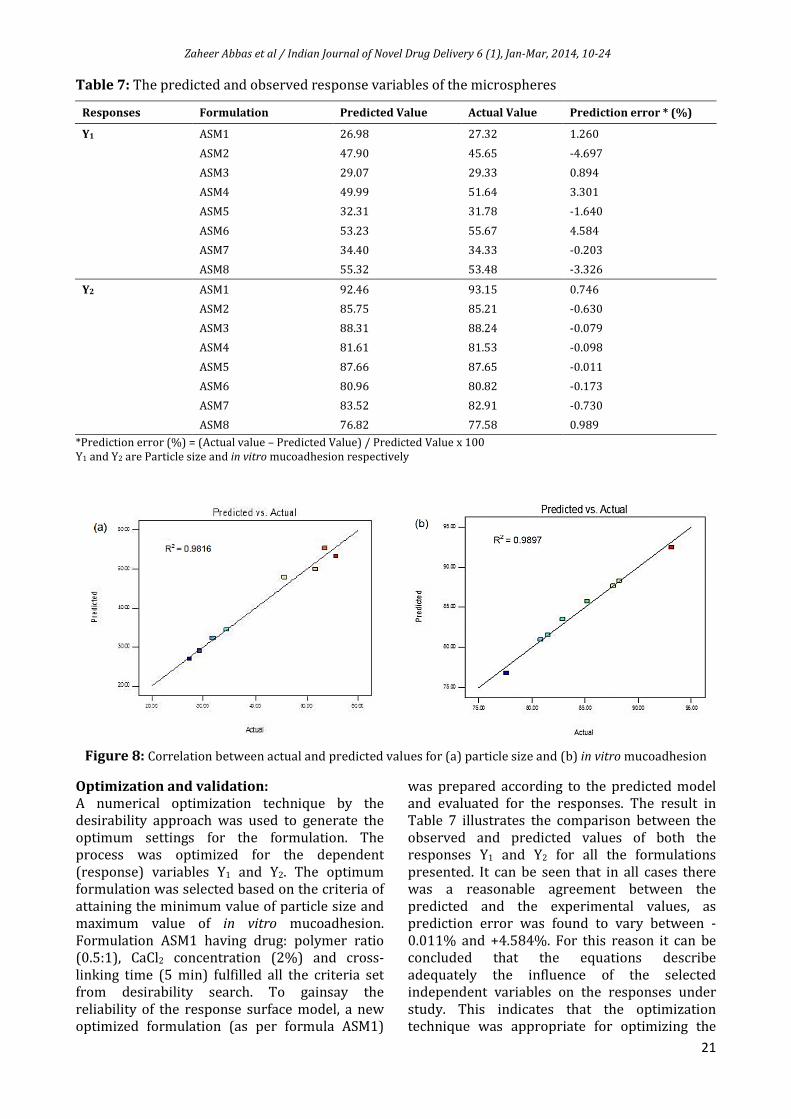
Table 7: The predicted and observed response variables of the microspheres
Responses Formulation Predicted Value Actual Value Prediction error * (%)
Y1 ASM1 26.98 27.32 1.260
ASM2 47.90 45.65 -4.697
ASM3 29.07 29.33 0.894
ASM4 49.99 51.64 3.301
ASM5 32.31 31.78 -1.640
ASM6 53.23 55.67 4.584
ASM7 34.40 34.33 -0.203
ASM8 55.32 53.48 -3.326
Y2 ASM1 92.46 93.15 0.746
ASM2 85.75 85.21 -0.630
ASM3 88.31 88.24 -0.079
ASM4 81.61 81.53 -0.098
ASM5 87.66 87.65 -0.011
ASM6 80.96 80.82 -0.173
ASM7 83.52 82.91 -0.730
ASM8 76.82 77.58 0.989
*Prediction error (%) = (Actual value – Predicted Value) / Predicted Value x 100
Y1 and Y2 are Particle size and in vitro mucoadhesion respectively
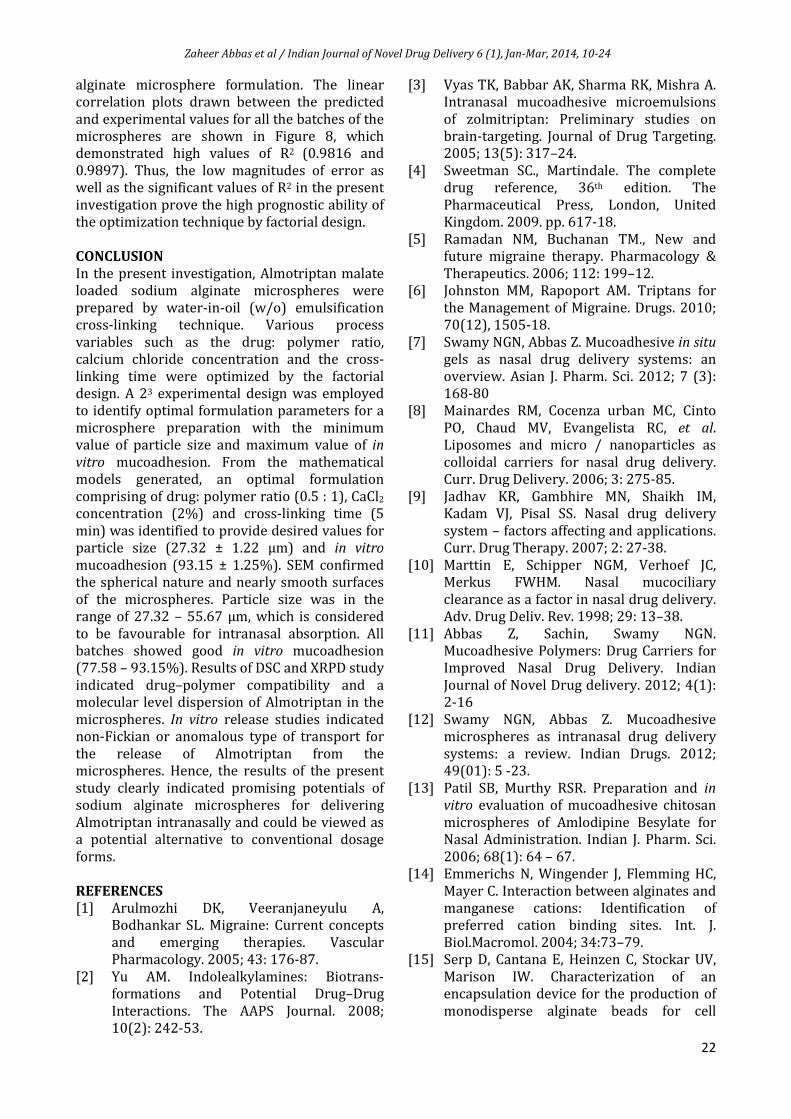
Figure 8: Correlation between actual and predicted values for (a) particle size and (b) in vitro mucoadhesion
Optimization and validation:
A numerical optimization technique by the
desirability approach was used to generate the
optimum settings for the formulation. The
process was optimized for the dependent
(response) variables Y1 and Y2. The optimum
formulation was selected based on the criteria of
attaining the minimum value of particle size and
maximum value of in vitro mucoadhesion.
Formulation ASM1 having drug: polymer ratio
(0.5:1), CaCl2 concentration (2%) and cross-
linking time (5 min) fulfilled all the criteria set
from desirability search. To gainsay the
reliability of the response surface model, a new
optimized formulation (as per formula ASM1)
was prepared according to the predicted model
and evaluated for the responses. The result in
Table 7 illustrates the comparison between the
observed and predicted values of both the
responses Y1 and Y2 for all the formulations
presented. It can be seen that in all cases there
was a reasonable agreement between the
predicted and the experimental values, as
prediction error was found to vary between -
0.011% and +4.584%. For this reason it can be
concluded that the equations describe
adequately the influence of the selected
independent variables on the responses under
study. This indicates that the optimization
technique was appropriate for optimizing the
Zaheer Abbas et al / Indian Journal of Novel Drug Delivery 6 (1), Jan-Mar, 2014, 10-24
22
alginate microsphere formulation. The linear
correlation plots drawn between the predicted
and experimental values for all the batches of the
microspheres are shown in Figure 8, which
demonstrated high values of R2 (0.9816 and
0.9897). Thus, the low magnitudes of error as
well as the significant values of R2 in the present
investigation prove the high prognostic ability of
the optimization technique by factorial design.
CONCLUSION
In the present investigation, Almotriptan malate
loaded sodium alginate microspheres were
prepared by water-in-oil (w/o) emulsification
cross-linking technique. Various process
variables such as the drug: polymer ratio,
calcium chloride concentration and the cross-
linking time were optimized by the factorial
design. A 23 experimental design was employed
to identify optimal formulation parameters for a
microsphere preparation with the minimum
value of particle size and maximum value of in
vitro mucoadhesion. From the mathematical
models generated, an optimal formulation
comprising of drug: polymer ratio (0.5 : 1), CaCl2
concentration (2%) and cross-linking time (5
min) was identified to provide desired values for
particle size (27.32 ± 1.22 µm) and in vitro
mucoadhesion (93.15 ± 1.25%). SEM confirmed
the spherical nature and nearly smooth surfaces
of the microspheres. Particle size was in the
range of 27.32 – 55.67 µm, which is considered
to be favourable for intranasal absorption. All
batches showed good in vitro mucoadhesion
(77.58 – 93.15%). Results of DSC and XRPD study
indicated drug–polymer compatibility and a
molecular level dispersion of Almotriptan in the
microspheres. In vitro release studies indicated
non-Fickian or anomalous type of transport for
the release of Almotriptan from the
microspheres. Hence, the results of the present
study clearly indicated promising potentials of
sodium alginate microspheres for delivering
Almotriptan intranasally and could be viewed as
a potential alternative to conventional dosage
forms.
REFERENCES
[1] Arulmozhi DK, Veeranjaneyulu A,
Bodhankar SL. Migraine: Current concepts
and emerging therapies. Vascular
Pharmacology. 2005; 43: 176-87.
[2] Yu AM. Indolealkylamines: Biotrans-
formations and Potential Drug–Drug
Interactions. The AAPS Journal. 2008;
10(2): 242-53.
[3] Vyas TK, Babbar AK, Sharma RK, Mishra A.
Intranasal mucoadhesive microemulsions
of zolmitriptan: Preliminary studies on
brain-targeting. Journal of Drug Targeting.
2005; 13(5): 317–24.
[4] Sweetman SC., Martindale. The complete
drug reference, 36th edition. The
Pharmaceutical Press, London, United
Kingdom. 2009. pp. 617-18.
[5] Ramadan NM, Buchanan TM., New and
future migraine therapy. Pharmacology &
Therapeutics. 2006; 112: 199–12.
[6] Johnston MM, Rapoport AM. Triptans for
the Management of Migraine. Drugs. 2010;
70(12), 1505-18.
[7] Swamy NGN, Abbas Z. Mucoadhesive in situ
gels as nasal drug delivery systems: an
overview. Asian J. Pharm. Sci. 2012; 7 (3):
168-80
[8] Mainardes RM, Cocenza urban MC, Cinto
PO, Chaud MV, Evangelista RC, et al.
Liposomes and micro / nanoparticles as
colloidal carriers for nasal drug delivery.
Curr. Drug Delivery. 2006; 3: 275-85.
[9] Jadhav KR, Gambhire MN, Shaikh IM,
Kadam VJ, Pisal SS. Nasal drug delivery
system – factors affecting and applications.
Curr. Drug Therapy. 2007; 2: 27-38.
[10] Marttin E, Schipper NGM, Verhoef JC,
Merkus FWHM. Nasal mucociliary
clearance as a factor in nasal drug delivery.
Adv. Drug Deliv. Rev. 1998; 29: 13–38.
[11] Abbas Z, Sachin, Swamy NGN.
Mucoadhesive Polymers: Drug Carriers for
Improved Nasal Drug Delivery. Indian
Journal of Novel Drug delivery. 2012; 4(1):
2-16
[12] Swamy NGN, Abbas Z. Mucoadhesive
microspheres as intranasal drug delivery
systems: a review. Indian Drugs. 2012;
49(01): 5 -23.
[13] Patil SB, Murthy RSR. Preparation and in
vitro evaluation of mucoadhesive chitosan
microspheres of Amlodipine Besylate for
Nasal Administration. Indian J. Pharm. Sci.
2006; 68(1): 64 – 67.
[14] Emmerichs N, Wingender J, Flemming HC,
Mayer C. Interaction between alginates and
manganese cations: Identification of
preferred cation binding sites. Int. J.
Biol.Macromol. 2004; 34:73–79.
[15] Serp D, Cantana E, Heinzen C, Stockar UV,
Marison IW. Characterization of an
encapsulation device for the production of
monodisperse alginate beads for cell
Zaheer Abbas et al / Indian Journal of Novel Drug Delivery 6 (1), Jan-Mar, 2014, 10-24
23
immobilization. Biotech.Bioeng. 2000;
70:41–53.
[16] Chan LW, Jin Y, Heng PWS., Cross-linking
mechanisms of calcium and zinc in
production of alginate microspheres. Int. J.
Pharm. 2002; 242:255–58.
[17] Fundueanu G, Esposito E, Mihai D, Carpov
A, Desbrieres J, Rinaudo M, et al.
Preparation and characterization of
calcium alginate microspheres by a new
emulsification method. Int. J. Pharm.
1998;170:11–21.
[18] Gonzalez Ferreiro M, Tillman LG, Hardee G,
Bumpier R., Alginate/poly-l-lysine
microparticles for the intestinal delivery of
antisense oligonucleotides. Pharm Res.
2002; 19: 755–64.
[19] Lucinda-Silva RM, Evangelista RC.
Microspheres of alginate–chitosan
containing isoniazid. J. Microencapsulation.
2003; 20:145–52.
[20] Gursoy A, Karakus D, Okar I.,Polymers for
sustained release formulations of
dipyridamole-alginate microspheres and
tabletted microspheres. J.
Microencapsulation. 1999; 16: 439–52.
[21] Vandervoort J, Ludwig A.,Preparation
factors affecting the properties of
polylactide nanoparticles: A factorial
design study. Pharmazie. 2001; 56: 484–88.
[22] Dhiman MK, Yedurkar PD, Sawant KK.,
Buccal bioadhesive delivery system of 5-
fluorouracil: Optimization and
characterization. Drug Dev. Ind. Pharm.
2008. 34, 761–770.
[23] Mehta AK, Yadav KS, Sawant
KK.,Nimodipine loaded PLGA
nanoparticles: Formulation optimization
using factorial design, characterization and
in vitro evaluation. Curr. Drug Delivery.
2007; 4:185–193.
[24] Wan L.S.C., Heng P.W.S., Chan L.W., Drug
encapsulation in alginate microspheres by
emulsification. J. Microencapsulation. 1992.
9: 309–16.
[25] Mahajan H.S., Gattani S.G. Gellan gum based
microparticles of Metoclopromide
hydrochloride for Intranasal delivery:
Development and Evaluation. Chem.
Pharm. Bull. 2009; 57(4): 388-92.
[26] Jain SA, Chauk DS, Mahajan HS, Tekade AR,
Gattani SG., Formulation and evaluation of
nasal mucoadhesive microspheres of
Sumatriptan succinate. J.
Microencapsulation. 2009; 26(8), 711–721
[27] Suneetha A, Raviteja R, Karthivel S.,
Spectrophotometric estimation of
almotriptan malate in bulk and
pharmaceutical formulations by
multivariate technique. International
Journal of Medicinal Chemistry and
Analysis. 2012; 2(2): 76-80.
[28] Swamy NGN, Abbas Z, Praveen B.,
Fabrication and In vitro evaluation of
Doxycycline loaded Chitosan Microspheres
for the treatment of Periodontitis. RGUHS J.
Pharm. Sci. 2013; 3(2): 26-32.
[29] Sankar C, Mishra B.,Development and in
vitro evaluations of gelatinA microspheres
of ketorolac tromethamine for intranasal
administration. Acta Pharm. 2003; 53: 101-
10.
[30] Dandagi PM, Mastiholimath VS, Gadad AP,
Iliger SR.,Mucoadhesive microspheres of
Propranolol Hydrochloride for Nasal
Delivery. Indian J. Pharm. Sci. 2007; 69(3):
402-407.
[31] Swamy NGN, Rupa V, Abbas Z, Dasankoppa
FS., Formulation and evaluation of
Nanosuspensions for enhancing the
dissolution of poorly soluble Mebendazole.
Indian Drugs. 2010; 47(9): 47-54.
[32] Ascentiis AD, Grazia JL, Bowman CN,
Colombo P, Peppas NA., Mucoadhesion of
poly (2-hydroxyethyl methacrylate) is
improved when linear poly (ethylene
oxide) chains are added to the polymer
network. J. Control. Release. 1995; 33:
197-201.
[33] Rajinikanth PS, Sankar C, Mishra B., Sodium
Alginate Microspheres of Metoprolol
Tartrate for Intranasal Systemic Delivery:
Development and Evaluation. Drug
Delivery. 2003; 10: 21-28.
[34] Jain SK, Jain NK, Gupta Y, Jain A, Jain D, et
al., Mucoadhesive chitosan microspheres
for non-invasive and improved nasal
delivery of Insulin. Indian J. Pharm. Sci.
2007; 69(4): 498-504.
[35] Akifuddin SK, Abbas Z, Marihal S, Ranadev
AK, Santosh Kumar, Kulkarni R.,
Preparation, Characterization and in Vitro
Evaluation of Microcapsules for Controlled
Release of Diltiazem Hydrochloride by
Ionotropic Gelation Technique. J. App.
Pharm Sci. 2013; 3(04): 35-42.
[36] Sultana Y, Mall S, Maurya DP, Kumar D, Das
M., Preparation and in vitro
characterization of diltiazem hydrochloride
loaded alginate microspheres. Pharm. Dev.
Tech. 2009; 14: 321 – 31.
Zaheer Abbas et al / Indian Journal of Novel Drug Delivery 6 (1), Jan-Mar, 2014, 10-24
24
[37] Swamy NGN, Abbas Z., Preparation and In
Vitro Characterization of Mucoadhesive
Polyvinyl Alcohol Microspheres Containing
Amlodipine Besylate for Nasal
Administration. Ind. J. Pharm. Edu. Res.
2012; 46(1): 52 – 58.
[38] Pisal S, Shelke V, Mahadik K, Kadam S.,
Effect of Organogel components on in vitro
nasal delivery of Propranolol
hydrochloride. AAPS PharmSciTech. 2004;
4: 1-9.
[39] Huang YB, Tsai YH, Lee SH, Chang JS, Wu
PC., Optimization of pH independent
release of nicardipine hydrochloride
extended-release matrix tablets using
response surface methodology. Int. J.
Pharm. 2005; 289:87–95.
[40] Narendra C, Srinath MS, PrakashRao B.,
Development of three layered buccal
compact containing metoprolol tartrate by
statistical optimization technique. Int. J.
Pharm. 2005; 304:102–114.
[41] Illum L, Jorgensen H, Bisgaard H,
Krogsgaard O, Rossing N., Bioadhesive
microspheres as a potential nasal drug
delivery system. Int. J. Pharm. 1987;
39:189–99.