IJMIE Volume 2, Issue 9 ISSN: 2249-0558 201 doc/IJMIE_SEPTEMBER2012/IJMRA-MIE1761.pdfamong the heirs...
16
IJMIE Volume 2, Issue 9 ISSN: 2249-0558 __________________________________________________________ A Monthly Double-Blind Peer Reviewed Refereed Open Access International e-Journal - Included in the International Serial Directories Indexed & Listed at: Ulrich's Periodicals Directory ©, U.S.A., Open J-Gage as well as in Cabell’s Directories of Publishing Opportunities, U.S.A. International Journal of Management, IT and Engineering http://www.ijmra.us 353 September 2012 Livestock Trade in Semi-Subsistence Type of Rural Economy: A Case Study from Uttar Pradesh, India Mushir Ali* __________________________________________________________ Abstract: The paper attempts that seasons as basic determents of the livestock trade in monsoon India. To analysis livestock trade by uses and seasons, 14 rural markets were selected on the basis of stratified random sampling where four times field surveys were conducted in agricultural year, 2005-06. The analysis of data indicates that higher livestock were traded in the pre-monsoon and cool seasons. Trade deviations for buffalo 17%, cattle 9%, and goats 12% show influence of agricultural operations, weather and matrimonial seasons. The demand livestock for rearing, meat and milk varies in different seasons with the symbiosis of socio-economic conditions in the study area. Keywords: Seasons, livestock trade, agricultural operations, and society * Assistant Professor, Department of Geography and Environmental Studies, Mekelle University, Mekelle, Ethiopia.
Transcript of IJMIE Volume 2, Issue 9 ISSN: 2249-0558 201 doc/IJMIE_SEPTEMBER2012/IJMRA-MIE1761.pdfamong the heirs...

IJMIE Volume 2, Issue 9 ISSN: 2249-0558 __________________________________________________________
A Monthly Double-Blind Peer Reviewed Refereed Open Access International e-Journal - Included in the International Serial Directories Indexed & Listed at: Ulrich's Periodicals Directory ©, U.S.A., Open J-Gage as well as in Cabell’s Directories of Publishing Opportunities, U.S.A.
International Journal of Management, IT and Engineering http://www.ijmra.us
353
September
2012
Livestock Trade in Semi-Subsistence Type of
Rural Economy:
A Case Study from Uttar Pradesh, India
Mushir Ali*
__________________________________________________________
Abstract:
The paper attempts that seasons as basic determents of the livestock trade in monsoon India. To
analysis livestock trade by uses and seasons, 14 rural markets were selected on the basis of
stratified random sampling where four times field surveys were conducted in agricultural year,
2005-06. The analysis of data indicates that higher livestock were traded in the pre-monsoon and
cool seasons. Trade deviations for buffalo 17%, cattle 9%, and goats 12% show influence of
agricultural operations, weather and matrimonial seasons. The demand livestock for rearing, meat
and milk varies in different seasons with the symbiosis of socio-economic conditions in the study
area.
Keywords: Seasons, livestock trade, agricultural operations, and society
* Assistant Professor, Department of Geography and Environmental Studies, Mekelle University,
Mekelle, Ethiopia.
IJMIE Volume 2, Issue 9 ISSN: 2249-0558 __________________________________________________________
A Monthly Double-Blind Peer Reviewed Refereed Open Access International e-Journal - Included in the International Serial Directories Indexed & Listed at: Ulrich's Periodicals Directory ©, U.S.A., Open J-Gage as well as in Cabell’s Directories of Publishing Opportunities, U.S.A.
International Journal of Management, IT and Engineering http://www.ijmra.us
354
September
2012
Introduction
Livestock husbandry is one of the important segments of Indian agriculture. It has been
practiced as auxiliary activity in the process of production of different food and non-food crops
since antiquity. Various kinds of livestock species like cattle, buffalo, goats, sheep, pigs, hen, etc.
were reared as domestic and subsistence animals. Traditional techniques and practices have been
applied in the process of their rearing. Commercial form of livestock husbandry rarely existed
before the independences except in the case of milk and meat production but at a small scale with
little production to meet local demands (Gandhi & Mani, 1995).
During the last decade of 20th
century, Indian agriculture was at a crossroad and
frustration among farmers as well as in government was inevitable (Van Loon, 2007; Sengupta,
2008). The foodgrain production became uneconomical due to increasing gap between input cost
and output price per unit weight of its production with increasing cost of inputs because of
removal of subsidies by the government in successive years under the influence of world
economic order. Inefficient agricultural marketing system resulted in low price per unit weight of
output (Arena, 2005). Reduction in the size of operational holdings year after year due to division
among the heirs has also contributed to decline of productivity (Ali, 2009) and consequently
badly affected the economic viability of some traditional crops like foodgrains.
Livestock farming has offered the opportunities to producers to expand this sector through
the enhancing production, both in qualitative and quantitative terms. Scaling up of the production
and agri-business has also been encouraging in developing countries like India on the pattern of
developed countries. It is because of that livestock products from tropical monsoon countries are
greatly demanded in Asian as well as European markets. The livestock products, especially,
produced in India have good competitive price in international markets due to low production cost

IJMIE Volume 2, Issue 9 ISSN: 2249-0558 __________________________________________________________
A Monthly Double-Blind Peer Reviewed Refereed Open Access International e-Journal - Included in the International Serial Directories Indexed & Listed at: Ulrich's Periodicals Directory ©, U.S.A., Open J-Gage as well as in Cabell’s Directories of Publishing Opportunities, U.S.A.
International Journal of Management, IT and Engineering http://www.ijmra.us
355
September
2012
as compared to developed world after reducing the subsidies on agricultural production and
export in recent years (Rutherford, 1999; Food world India, 2005).
Rural markets, however, are the most important nodal points for transaction of the livestock
and their products. They play role in linking the livestock trade with the terminal markets where
large scale livestock transaction as wholesale is undertaken. The marketable surplus of livestock
like cattle, buffalo, sheep, and goats are brought through walking by producer sellers from
different villages of rearing centres. Long distance transport of the livestock increases heavy
transport over head cost, and bad weather puch livestock trade in nearby rural markets at large
proportion (Ali & Neka, 2012).
Objectives
Keeping consideration into the significance of transaction livestock through rural
markets in semi-subsistence type of economy, Shahjahanpur district of Uttar Pradesh, an effort
was made by researcher the followings following objectives:
To assess seasonal behavior of livestock trade in semi-subsistence type rural economy
of Shahjahanpur district.
To describe livestock trade variation by uses and seasons in the study area.
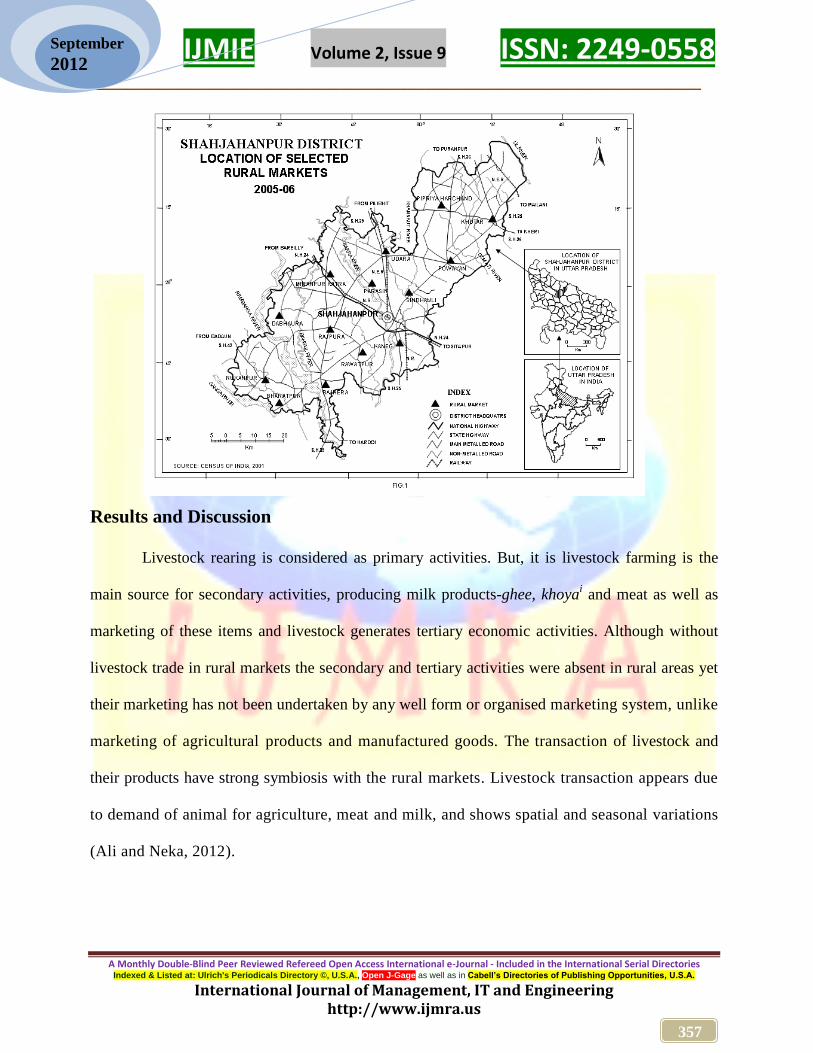
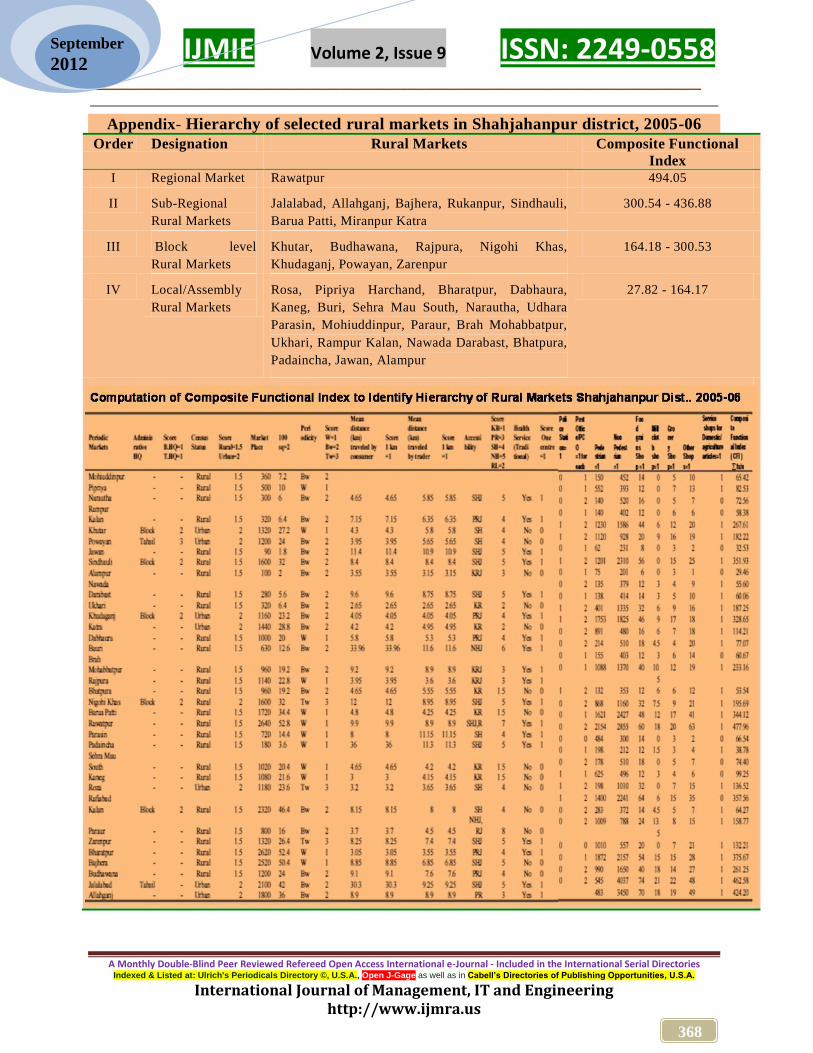
Data and Methodology
The present study is based fully on the primary data those were collected through field
surveys. Secondary data were not available regarding livestock trade through rural markets.
Fourteen rural markets, one from each block have been selected on basis of stratified random
sampling technique by using hierarchical order with CFI (Composite Functional Index) formula
(Ali 2009).
IJMIE Volume 2, Issue 9 ISSN: 2249-0558 __________________________________________________________
A Monthly Double-Blind Peer Reviewed Refereed Open Access International e-Journal - Included in the International Serial Directories Indexed & Listed at: Ulrich's Periodicals Directory ©, U.S.A., Open J-Gage as well as in Cabell’s Directories of Publishing Opportunities, U.S.A.
International Journal of Management, IT and Engineering http://www.ijmra.us
356
September
2012
n
iFiWiCFI
1
where, CFI = Composite Functional Index
Fi = number of markets/units
Wi = Weight of the particular function
On the basis of calculated Composite Functional Index (CFI) four grades as regional, sub-
regional, block level and local rural markets were recognized and every type of markets (
please see appendix). The selected markets were surveyed four times in the year 2005 and 2006
to collect data regarding spatial and seasonal trade of livestock. The spatial use wise demand and
supply of buffalo, cattle, and goats with changing seasons were recorded in detail. The collected
data were tabulated and analyzed by using simple statistical technique. Maps and diagrams were
prepared with the help of GIS technique.
Study Area
In the view of importance livestock markets in the semi-subsistence type of rural
economy, a micro geographical unit Shahjahanpur district was selected as study area. It is situated
in the tract between the Ganga River and foothills of the Himalayas in Uttar Pradesh. The area
consisted with five natural divisions, i.e. the Tarai forest belt, the Gomti basin, the Central
Bangar land, the Ramganga Khadar, and the Bankati. A large chunk of population of the district
is engaged in animal rearing and agricultural activities. The rural population is dependent on rural
markets to sale and purchase of livestock. They also provide employment to workers of
unorganized sector and contribute a source of livelihood for itinerant traders, who purchase the
livestock from different places to sale in these market centres. The district covers an area 4575 sq
km, and population of 25.4 million. There were four tahsils (sub-divisions), 14 community
development blocks, 11 urban centres, 2080 villages, total 846947 heads of livestock consisting
315190 buffalo, 244535 cattle, 242550 sheep and goats.
IJMIE Volume 2, Issue 9 ISSN: 2249-0558 __________________________________________________________
A Monthly Double-Blind Peer Reviewed Refereed Open Access International e-Journal - Included in the International Serial Directories Indexed & Listed at: Ulrich's Periodicals Directory ©, U.S.A., Open J-Gage as well as in Cabell’s Directories of Publishing Opportunities, U.S.A.
International Journal of Management, IT and Engineering http://www.ijmra.us
357
September
2012
Results and Discussion
Livestock rearing is considered as primary activities. But, it is livestock farming is the
main source for secondary activities, producing milk products-ghee, khoyai and meat as well as
marketing of these items and livestock generates tertiary economic activities. Although without
livestock trade in rural markets the secondary and tertiary activities were absent in rural areas yet
their marketing has not been undertaken by any well form or organised marketing system, unlike
marketing of agricultural products and manufactured goods. The transaction of livestock and
their products have strong symbiosis with the rural markets. Livestock transaction appears due
to demand of animal for agriculture, meat and milk, and shows spatial and seasonal variations
(Ali and Neka, 2012).

IJMIE Volume 2, Issue 9 ISSN: 2249-0558 __________________________________________________________
A Monthly Double-Blind Peer Reviewed Refereed Open Access International e-Journal - Included in the International Serial Directories Indexed & Listed at: Ulrich's Periodicals Directory ©, U.S.A., Open J-Gage as well as in Cabell’s Directories of Publishing Opportunities, U.S.A.
International Journal of Management, IT and Engineering http://www.ijmra.us
358
September
2012
Table 1: Livestock transaction by seasons through rural markets
Markets Oct-Dec
(Cool-season)
Jan-March
(Cold-Season)
April-June
(Pre-monsoon
season)
July-Sept
(Monsoon-
season)
Annual
Pipriya Harchand 6396
(25.05)
6240
(24.44)
6188
(24.24)
6708
(26.27)
25532
(100)
Khutar 5928
(24.31)
6552
(26.87)
5876
(24.09)
6032
(24.73)
24388
(100)
Powayan 5460
(23.70)
6344
(27.54)
5200
(22.57)
6032
(26.19)
23036
(100)
Sindhauli 4992
(25.26)
4940
(25)
4888
(24.74)
4940
(25)
19760
(100)
Miranpur Katra 8840
(24.32)
9464
(26.04)
8580
(23.61)
9464
(26.04)
36348
(100)
Dabhaura 6240
(27.40)
4264
(18.72)
7280
(31.96)
4992
(21.92)
22776
(100)
Rajpura 3380
(24.34)
3640
(26.22)
3692
(26.59)
3172
(22.85)
13884
(100)
Udara 5720
(23.78)
5772
(24)
6526
(27.14)
6032
(25.08)
24050
(100)
Rawatpur 7254
(24.62)
7540
(25.60)
7904
(26.83)
6760
(22.95)
29458
(100)
Parasin 1924
(23.57)
1976
(24.20)
2574
(31.53)
1690
(20.70)
8164
(100)
Kaneg 4108
(25.24)
4082
(25.08)
4550
(27.96)
3536
1.73)
16276
(100)
Rukanpur 7644
(24.30)
6136
(19.50)
9048
(28.76)
8632
(27.44)
31460
(100)
Bharatpur 5798
(24.83)
4160
(17.82)
7488
(32.07)
5902
(25.28)
23348
(100)
Bajhera 9620
(25.03)
9672
(25.17)
10244
(26.66)
8892
(23.14)
38428
(100)
Total 83304
(24.73)
80782
(23.98)
90038
(27.72)
82784
(24.57)
336908
(100)
*Figures in parenthesis show percentage to total livestock transaction
Source: Field Survey, 2005-06
The study area witnessed variations of livestock trade with reference to time or season
and species aspects. The socio-economic factors of the market areas are the most important
determinants of volume of livestock trade in the selected markets. It varies between 8164 heads in
Parasin to 36348 heads in Miranpur Katra (Table 1). Study area, being a geographical unit in
tropical monsoon region, experiences three distinct seasons, i.e. winter, summer, and rainy which
coincide very much with agricultural seasons like rabi, zaid and kharif respectively. Agricultural
seasons affect the arrival and transaction of not only draught livestock but also dairy and meat
IJMIE Volume 2, Issue 9 ISSN: 2249-0558 __________________________________________________________
A Monthly Double-Blind Peer Reviewed Refereed Open Access International e-Journal - Included in the International Serial Directories Indexed & Listed at: Ulrich's Periodicals Directory ©, U.S.A., Open J-Gage as well as in Cabell’s Directories of Publishing Opportunities, U.S.A.
International Journal of Management, IT and Engineering http://www.ijmra.us
359
September
2012
animals. Agricultural operations, breeding and lactation of livestock, meat consumption, and
fodder availability are very much related with seasonal changes.
The analysis of data reflects almost a of seasonal livestock transaction the slight variation
from 23% to 28%. April-June (season of zaid crop or pre-monsoon) was recorded the highest
proportion (27.72%) that was followed by 24.73% (Oct-Nov) and 24.57 % (July-Sept). However,
Jan-March attracted about 24% livestock trade (Table 1).
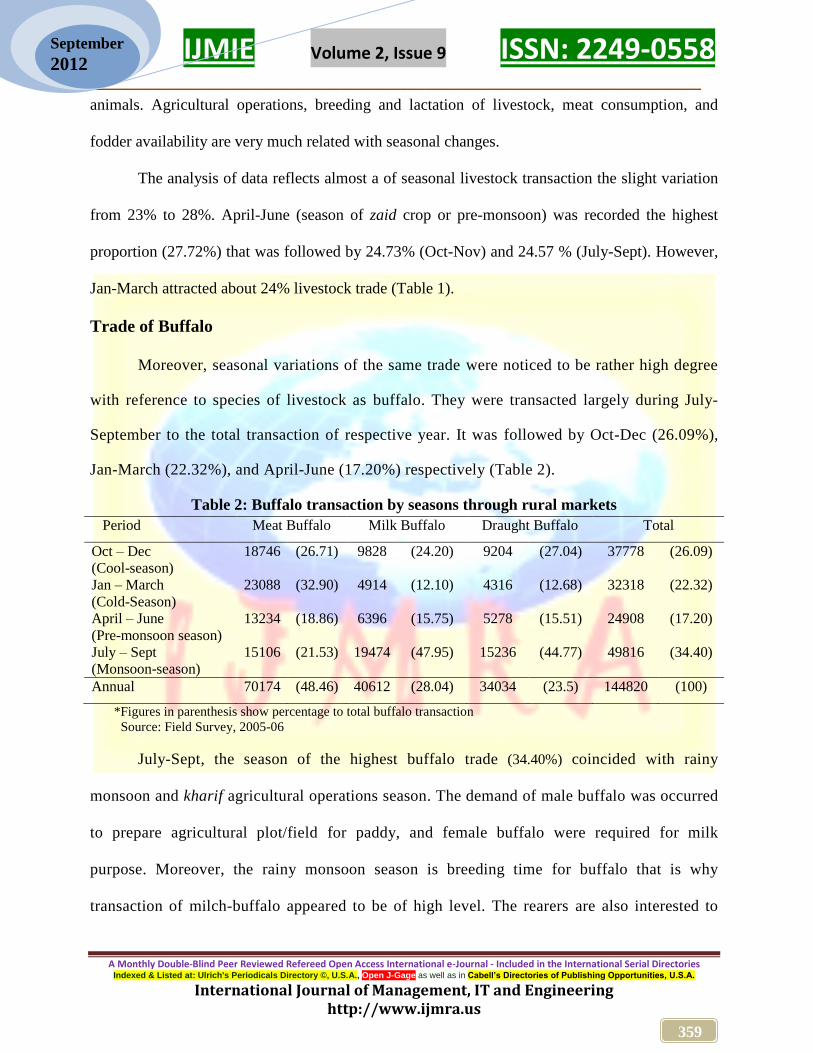
Trade of Buffalo
Moreover, seasonal variations of the same trade were noticed to be rather high degree
with reference to species of livestock as buffalo. They were transacted largely during July-
September to the total transaction of respective year. It was followed by Oct-Dec (26.09%),
Jan-March (22.32%), and April-June (17.20%) respectively (Table 2).
Table 2: Buffalo transaction by seasons through rural markets
Period Meat Buffalo Milk Buffalo Draught Buffalo Total
Oct – Dec
(Cool-season)
18746 (26.71) 9828 (24.20) 9204 (27.04) 37778 (26.09)
Jan – March
(Cold-Season)
23088 (32.90) 4914 (12.10) 4316 (12.68) 32318 (22.32)
April – June
(Pre-monsoon season)
13234 (18.86) 6396 (15.75) 5278 (15.51) 24908 (17.20)
July – Sept
(Monsoon-season)
15106 (21.53) 19474 (47.95) 15236 (44.77) 49816 (34.40)
Annual 70174 (48.46) 40612 (28.04) 34034 (23.5) 144820 (100)
*Figures in parenthesis show percentage to total buffalo transaction
Source: Field Survey, 2005-06
July-Sept, the season of the highest buffalo trade (34.40%) coincided with rainy
monsoon and kharif agricultural operations season. The demand of male buffalo was occurred
to prepare agricultural plot/field for paddy, and female buffalo were required for milk
purpose. Moreover, the rainy monsoon season is breeding time for buffalo that is why
transaction of milch-buffalo appeared to be of high level. The rearers are also interested to

IJMIE Volume 2, Issue 9 ISSN: 2249-0558 __________________________________________________________
A Monthly Double-Blind Peer Reviewed Refereed Open Access International e-Journal - Included in the International Serial Directories Indexed & Listed at: Ulrich's Periodicals Directory ©, U.S.A., Open J-Gage as well as in Cabell’s Directories of Publishing Opportunities, U.S.A.
International Journal of Management, IT and Engineering http://www.ijmra.us
360
September
2012
dispose off their surplus buffalo because of paucity of space (shed) to accommodate in small
houses during rainy season. The meat-buffalo showed only slight seasonal variation as they
are demanded uniformly throughout the year to meet the dietary demand of population. But, it
is Idul-Azha, religious festival of Muslims that enhanced the trade of livestock.
Trade of Cattle
Cattle transaction was recorded with variation of agricultural operations, breeding
time, and atmospheric seasons those were casted their effects on behaviour of cattle trade.
April-June, post-harvest period rabi crop and sowing time for kharif attracts cattle for the
transaction at large scale (51.17%) in semi-subsistence type of rural masses. The intensive use
of cattle in rabi post-harvest operations like threshing and transporting of wheat, oilseeds, and
preparing of fields for kharif paddy and rough cereals contribute to such high level of
transaction. Being, an effective cow-breeding season, more milk production per unit cow
elevates cattle transaction in the period and vacant fields at post-harvest of rabi also provides
for good grazing opportunities. However, July-Sept is not preferable period to cattle. That is
why the lowest (18%) cattle transaction. It is due to being wet-season, declining requirement
of cattle in agriculture and paucity of covered cowsheds discourage the farmers to buy the
same from the markets (Table 3).
Table 3: Cattle transaction by seasons through rural markets
Period Milk Cattle Draught Cattle Total
Oct – Dec
(Cool-season)
4628 (19.67) 6578 (23) 11206 (21.50)
Jan – March
(Cold-Season)
3692 (15.69) 2756 (9.64) 6448 (12.37)
April – June
(Pre-monsoon season)
12402 (52.71) 14274 (49.91) 26676 (51.17)
July – Sept
(Monsoon-season)
2808 (11.94) 4992 (17.45) 7800 (14.96)
Annual 23530 (45.14) 28600 (54.86) 52130 (100)
*Figures in parenthesis show percentage to total cattle transaction

IJMIE Volume 2, Issue 9 ISSN: 2249-0558 __________________________________________________________
A Monthly Double-Blind Peer Reviewed Refereed Open Access International e-Journal - Included in the International Serial Directories Indexed & Listed at: Ulrich's Periodicals Directory ©, U.S.A., Open J-Gage as well as in Cabell’s Directories of Publishing Opportunities, U.S.A.
International Journal of Management, IT and Engineering http://www.ijmra.us
361
September
2012
Source: Field Survey, 2005-06
Trade of Goats
Field surveys reveal that goats are transacted mainly for meat purpose, more than 75%
of the total goat trade. Goats are consumed mainly for meat, also exhibit seasonal variations
in quantum and degree of transaction (Rathore, 1993), which is slightly different from that of
earlier discussed buffalo and cattle species. A group of three-seasons except July-Sept shows
seasonal variations in goat transaction with a little range not more than 6% (Table 4). Jan-
March period is endorsed the highest (30%) goat transaction, chiefly due to increasing
demand of live goats for sacrifice as a religious obligation offered on Idul-Azha. The period
of April-June exhibits second maxima of goat transaction owning to occurrences of social
rituals like marriage ceremonies. They are frequently held during this interval because
farmers feel free after harvesting of rabi-crop. Commonly, mutton is used in abundance and
has single option for rural population unlike urban areas where buffalo meat and chicken are
as other options for marriage feasts. It was observed during field surveys that rainy season,
July-Sept has rather low share due to fact that goats feel uncomfortable under rain. Besides,
they are usually reared by marginal farmers who have no adequate space under covered shed;
consequently, their demand is discouraged.
Table 4: Goats transaction by seasons through rural markets
Period Meat Goat Milk Goat Total
Oct – Dec
(Cool-season)
25636 (24.04) 8684 (26.07) 34320 (24.52)
Jan – March
(Cold-Season)
36244 (33.98) 5772 (17.33) 42016 (30.02)
April – June
(Pre-monsoon season)
24804 (23.25) 13650 (40.99) 38454 (27.48)
July – Sept
(Monsoon-season)
19968 (18.73) 5200 (15.61) 25168 (17.98)

IJMIE Volume 2, Issue 9 ISSN: 2249-0558 __________________________________________________________
A Monthly Double-Blind Peer Reviewed Refereed Open Access International e-Journal - Included in the International Serial Directories Indexed & Listed at: Ulrich's Periodicals Directory ©, U.S.A., Open J-Gage as well as in Cabell’s Directories of Publishing Opportunities, U.S.A.
International Journal of Management, IT and Engineering http://www.ijmra.us
362
September
2012
Annual 106652 (76.20) 33306 (23.80) 139958 (100)
*Figures in parenthesis show percentage to total goat transaction
Source: Field Survey, 2005-06
Trade of Livestock for Different Uses
Livestock transaction in rural market is frequently held either for their live form or
meat, milk and draught works. The degree and intensity of their uses in distinct sectors is the
reflection of physio-socio-economic conditions of a region. Income level in the form of
purchasing power, level of agricultural mechanization, weakening of ethical-taboo for use of
livestock for milk and meat led to awareness of health conscious. The study of spatial
variation in marketable livestock surplus provides an understanding of socio-economic
transformation in both qualitative and quantitative form.
Table 5: Transaction of livestock by uses through rural markets
Markets Meat Milk Draught All
Pipriya Harchand 13988 (54.79) 8632 (33.81) 2912 (11.41) 25532 (100)
Khutar 15132 (62.05) 7332 (30.06) 1924 (7.88) 24388 (100)
Powayan 13832 (60.05) 6500 (28.22) 2704 (11.74) 23036 (100)
Sindhauli 10712 (54.21) 6448 (32.63) 2600 (13.16) 19760 (100)
Miranpur Katra 23920 (65.81) 7280 (20.03) 5148 (14.16) 36348 (100)
Dabhaura 8320 (36.53) 8320 (36.53) 6136 (26.94) 22776 (100)
Rajpura 9412 (67.79) 2704 (19.48) 1768 (12.73) 13884 (100)
Udara 11388 (47.35) 7670 (31.89) 4992 (20.76) 24050 (100)
Rawatpur 15756 (53.49) 6552 (22.24) 7150 (24.27) 29458 (100)
Parasin 2626 (32.17) 4342 (53.18) 1196 (14.65) 8164 (100)
Kaneg 8632 (53.04) 4472 (27.48) 3172 (19.49) 16276 (100)
Rukanpur 11700 (37.19) 10868 (34.55) 8892 (28.26) 31460 (100)
Bharatpur 7176 (30.73) 8528 (36.53) 7644 (32.74) 23348 (100)
Bajhera 24232 (63.06) 7800 (20.3) 6396 (16.64) 38428 (100)
Total 176826 (52.48) 97448 (28.92) 62634 (18.59) 336908 (100)
*Figures in parenthesis show percentage to total livestock transaction
Source: Field Survey, 2005-06

IJMIE Volume 2, Issue 9 ISSN: 2249-0558 __________________________________________________________
A Monthly Double-Blind Peer Reviewed Refereed Open Access International e-Journal - Included in the International Serial Directories Indexed & Listed at: Ulrich's Periodicals Directory ©, U.S.A., Open J-Gage as well as in Cabell’s Directories of Publishing Opportunities, U.S.A.
International Journal of Management, IT and Engineering http://www.ijmra.us
363
September
2012
Table 5 gives an idea about livestock transaction for different uses. More than 50% livestock
are brought for transaction belonged to meat category. It is followed by milk or dairy (28.9%)
and agricultural uses (18.6%). The species wise livestock use analysis is also showed the
same pattern with the exception of cattle. Out of total buffalo transacted meat buffalo share
48%, milch-buffalo 28%, and draught-buffalo 23% (Table 2). Cattle transaction was absence
for the meat purpose but milch and draught cattle have share 45% and 54 % respectively.
Meat livestock show their domination (52.48 %) in livestock transaction (Table 5). It
is because of increasing demand of meat and meat-processed products in national and
international markets in response of increasing urban population, health consciousness among
the middle-income group population and food habit shifts from vegetarian to animal protein
added food in the country (Robbins, 1999). The social transformation, weakening of religious
taboos to take animal food (protein), has increased tremendously the demand of meat intake
among young educated population all over the country. These markets are supplier of
livestock of bovine (both big and rudimentary) for meat production and consumption needed
in big regional urban centres like Bareilly and Shahjahanpur. Moreover, livestock transaction
for meat purpose is still religion oriented which resulted in the absence of meat cattle
transaction as cow slaughtered is prohibited in north India and she is treated as scared animal
among the Hindu majority population. A laudable share of meat goats among total transacted
goats has been the result of its wide acceptance among all socio-religious group and high-
income group of population.

IJMIE Volume 2, Issue 9 ISSN: 2249-0558 __________________________________________________________
A Monthly Double-Blind Peer Reviewed Refereed Open Access International e-Journal - Included in the International Serial Directories Indexed & Listed at: Ulrich's Periodicals Directory ©, U.S.A., Open J-Gage as well as in Cabell’s Directories of Publishing Opportunities, U.S.A.
International Journal of Management, IT and Engineering http://www.ijmra.us
364
September
2012
Fig. 2
Moreover, the study reveals that buffalo cattle, goats, are important species of
livestock brought for transaction. Moreover, the milch-livestock especially belong to buffalo
and cattle, stood at first as in cattle case and second in buffalo, in proportion of livestock
trade. Development of dairy industry at household level and market accessibility for milk
especially in urban areas have encouraged the trade of milch-livestock in almost all markets
under the study (Fig.2).
Marketwise variations were observed regarding transaction of individual livestock by
uses during field surveys. Those markets were located in the areas of urban influences, show
the supremacy of meat and milk livestock, i.e Khutar (62.05% and 30.06%), Miranpur Katra
(65.81% and 20.3%), and Powayan (60.05% and 28.22%). While those markets situated in
interior and remote villages attract rather draught livestock in larger proportion as a
consequent of low level of mechanization in agriculture.

IJMIE Volume 2, Issue 9 ISSN: 2249-0558 __________________________________________________________
A Monthly Double-Blind Peer Reviewed Refereed Open Access International e-Journal - Included in the International Serial Directories Indexed & Listed at: Ulrich's Periodicals Directory ©, U.S.A., Open J-Gage as well as in Cabell’s Directories of Publishing Opportunities, U.S.A.
International Journal of Management, IT and Engineering http://www.ijmra.us
365
September
2012
Conclusion
The livestock marketing is in rudimentary and unorganized form in the study area. The
animal transaction appears to be a spatio-seasonal and socio-economic oriented the economic
phenomena. The arrival and transaction of various kinds of livestock in the markets are the
functions of space, time, and economy of the area where such phenomena takes place. The study
reveals that total annual average number of livestock (buffalo, cattle, and goats) surplus arrived in
the market for transaction, which varied among the selected rural markets from 8164 to 38428
heads. Such variations for trade of livestock were caused mainly by their locations, connectivity,
nature, catchment areas, fairness in market prices, protection of traders from bogus intermediaries
inside of market and outside from robbers, and attractive policies of market owners. Marketing of
livestock shows seasonal behaviour. Crop and weather seasons affect the livestock transaction in
the semi-subsitsnce type of agriculral economy because mostly fatming is operated by use of
livestock. April-June period attracts the largest number of livestock because cultivators become
free after harvesting of rabi crop (wheat, oilseeds, pluses). They visit the markets to dispose off
their animals (male buffalo, oxen) and purchase new one of good quality to prepare their field for
kharif crop. Cows are transacted highly due to their breeding and lactating period. Besides, the
demand of goats was rather high due to excess amount of meat is required for marriages. As, post
harvesting period of rabi is suitable matrimonial season in the north Indian plain. Cattle were
recorded second maxima of livestock transaction because male cattle (oxen) and buffalo were
demanded for ploughing the land for rabi crop.
Buffalo scored the largest number of transaction. It was followed by goats and cattle. The
larger share of buffalo and goats transaction was due to increasing, demand of meat (both mutton
IJMIE Volume 2, Issue 9 ISSN: 2249-0558 __________________________________________________________
A Monthly Double-Blind Peer Reviewed Refereed Open Access International e-Journal - Included in the International Serial Directories Indexed & Listed at: Ulrich's Periodicals Directory ©, U.S.A., Open J-Gage as well as in Cabell’s Directories of Publishing Opportunities, U.S.A.
International Journal of Management, IT and Engineering http://www.ijmra.us
366
September
2012
and beef) within as well as outside of the study area. That is why 76.20% of total transaction of
goats and 48.46% of total buffalo were transacted for slaughter.
Transaction of milch-livestock was at second position, in the milch category cattle ranked top
followed by buffalo, goats at second and third positions respectively. The milch-livestock were
demanded because of their increasing consumption of milk products (khoa, ghee) and livestock
husbandry. Draught-livestock trade ranked last level due to enhancement of mechanization in
agriculture.
Moreover, the livestock marketing faces several infrastructural deficiencies related to
infrastructural and fairness in prices those are urgently needed for getting the benefit of livestock
revolution occurred at global level after increasing influence of WTO by processing activities at
grass roots level linking to the regional, national, and international markets.
iKhoa is a milk-oriented product that is used for making sweets as well as other north Indian food dishes,
and ghee is an Indian clarified butter.
References
Ali, M. (2009). Geography of Agricultural Marketing at Grass roots Levels, Pacific Publication,
New Delhi
Ali, M. and Khan, N. (2007). Agricultural Marketing through Periodic Markets in Shahjahanpur
District, Uttar Pradesh, Agricultural Marketing, 55 (2): 31-36
Ali, M. and Neka, M. (2012). Livestock Husbandry and Economic-Sustainability of Small
Farmers in Peri-Urban Areas: A Case Study from West Gojjam Region, Ethiopia,
Ethiopian Journal of Environmental Studies and Management,5 (2):207-217
Arena, A.J. (2005). Confronting Agrarian Crisis: Historical Food Insecurity, the Indian State, and
the Green Revolution, Achieve 8, May 2005.

IJMIE Volume 2, Issue 9 ISSN: 2249-0558 __________________________________________________________
A Monthly Double-Blind Peer Reviewed Refereed Open Access International e-Journal - Included in the International Serial Directories Indexed & Listed at: Ulrich's Periodicals Directory ©, U.S.A., Open J-Gage as well as in Cabell’s Directories of Publishing Opportunities, U.S.A.
International Journal of Management, IT and Engineering http://www.ijmra.us
367
September
2012
Food world India, (2005). A Conference organized by Federation of Indian Commerce and
Industry (FICCI), 28-30 Nov, 2005
Gandhi, V.P.G. and Mani (1995). Are Livestock Products Rising in Importance? A Study of the
Growth and Behavior of their Consumption in India, Indian Journal Agricultural
Economics, 50: 283-93.
Indian Express, (2001). Fears of tainted meat cloud Muslim feast in Egypt. Indian Express News
paper, Bombay, March 5, 2001
Khullar, D.R. (2006). India: A Comprehensive Geography. Kalyani Publishers, New Delhi.
Malaviya, A.K. (1996). Rural Marketing in India. The Indian Journal of Commerce, 41 (186-87):
43-48.
Rathore, M.S. (1993). Marketing of Goats in Rajasthan, Institute of Development Studies,
Jaipur.
Robbins, P. (1999). Meat Matters: Cultural Politics along the Commodity Chain in India,
Ecumene, 6 (4):399-423.
Rutherford, A.S. (1999). Meat and Milk Self-sufficiency in Asia: Forecast trends and
Implementations, Agricultural Economics, 21 (1): 21-39.
Sengupta, S. (2008). Indian Agriculture, ABD Publishers, Jaipur.
Van Loon, G.W. (2007). Agricultural Sustainability, Sage Publications, New Delhi.
IJMIE Volume 2, Issue 9 ISSN: 2249-0558 __________________________________________________________
A Monthly Double-Blind Peer Reviewed Refereed Open Access International e-Journal - Included in the International Serial Directories Indexed & Listed at: Ulrich's Periodicals Directory ©, U.S.A., Open J-Gage as well as in Cabell’s Directories of Publishing Opportunities, U.S.A.
International Journal of Management, IT and Engineering http://www.ijmra.us
368
September
2012
Appendix- Hierarchy of selected rural markets in Shahjahanpur district, 2005-06
Order Designation Rural Markets Composite Functional
Index
I Regional Market Rawatpur 494.05
II Sub-Regional
Rural Markets
Jalalabad, Allahganj, Bajhera, Rukanpur, Sindhauli,
Barua Patti, Miranpur Katra
300.54 - 436.88
III Block level
Rural Markets
Khutar, Budhawana, Rajpura, Nigohi Khas,
Khudaganj, Powayan, Zarenpur
164.18 - 300.53
IV Local/Assembly
Rural Markets
Rosa, Pipriya Harchand, Bharatpur, Dabhaura,
Kaneg, Buri, Sehra Mau South, Narautha, Udhara
Parasin, Mohiuddinpur, Paraur, Brah Mohabbatpur,
Ukhari, Rampur Kalan, Nawada Darabast, Bhatpura,
Padaincha, Jawan, Alampur
27.82 - 164.17