IEEE Std 3006.8-2018 IEEE Recommended Practice for ... · IEEE documents are made available for use...
71
Recommended Practice for Analyzing Reliability Data for Equipment Used in Industrial and Commercial Power Systems IEEE Std 3006.8 ™ -2018 IEEE 3006 STANDARDS: POWER SYSTEMS RELIABILITY
Transcript of IEEE Std 3006.8-2018 IEEE Recommended Practice for ... · IEEE documents are made available for use...

Recommended Practice for Analyzing Reliability Data for Equipment Used in Industrial and Commercial Power Systems
IEEE Std 3006.8™-2018
IEEE 3006 STANDARDS: POWER SYSTEMS RELIABILITY

IEEE Std 3006.8™-2018
IEEE Recommended Practice for Analyzing Reliability Data for Equipment Used in Industrial and Commercial Power Systems
Sponsor
Technical Books Coordinating Committee of the IEEE Industry Applications Society
Approved 27 September 2018
IEEE-SA Standards Board

Abstract: Data supporting the reliability evaluation of existing industrial and commercial power systems are described. This recommended practice is likely to be of greatest value to the power-oriented engineer with limited experience in the area of reliability. It can also be an aid to all engineers responsible for the electrical design of industrial and commercial power systems.
Keywords: availability, IEEE 3006.8™, mean down time (MDT), mean time between failures (MTBF), mean time to maintain (MTTM), mean time to repair (MTTR), reliability analysis, reliability data
•
The Institute of Electrical and Electronics Engineers, Inc. 3 Park Avenue, New York, NY 10016-5997, USA
Copyright © 2018 by The Institute of Electrical and Electronics Engineers, Inc. All rights reserved. Published 17 October 2018. Printed in the United States of America.
IEEE is a registered trademark in the U.S. Patent & Trademark Office, owned by The Institute of Electrical and Electronics Engineers, Incorporated.
PDF: ISBN 978-1-5044-5029-4 STD23333 Print: ISBN 978-1-5044-5206-9 STDPD23333
IEEE prohibits discrimination, harassment, and bullying. For more information, visit http://www.ieee.org/web/aboutus/whatis/policies/p9-26.html. No part of this publication may be reproduced in any form, in an electronic retrieval system or otherwise, without the prior written permission of the publisher.

Important Notices and Disclaimers Concerning IEEE Standards Documents IEEE documents are made available for use subject to important notices and legal disclaimers. These notices and disclaimers, or a reference to this page, appear in all standards and may be found under the heading “Important Notices and Disclaimers Concerning IEEE Standards Documents.” They can also be obtained on request from IEEE or viewed at http://standards.ieee.org/IPR/disclaimers.html.
Notice and Disclaimer of Liability Concerning the Use of IEEE Standards Documents
IEEE Standards documents (standards, recommended practices, and guides), both full-use and trial-use, are developed within IEEE Societies and the Standards Coordinating Committees of the IEEE Standards Association (“IEEE-SA”) Standards Board. IEEE (“the Institute”) develops its standards through a consensus development process, approved by the American National Standards Institute (“ANSI”), which brings together volunteers representing varied viewpoints and interests to achieve the final product. IEEE Standards are documents developed through scientific, academic, and industry-based technical working groups. Volunteers in IEEE working groups are not necessarily members of the Institute and participate without compensation from IEEE. While IEEE administers the process and establishes rules to promote fairness in the consensus development process, IEEE does not independently evaluate, test, or verify the accuracy of any of the information or the soundness of any judgments contained in its standards.
IEEE Standards do not guarantee or ensure safety, security, health, or environmental protection, or ensure against interference with or from other devices or networks. Implementers and users of IEEE Standards documents are responsible for determining and complying with all appropriate safety, security, environmental, health, and interference protection practices and all applicable laws and regulations.
IEEE does not warrant or represent the accuracy or content of the material contained in its standards, and expressly disclaims all warranties (express, implied and statutory) not included in this or any other document relating to the standard, including, but not limited to, the warranties of: merchantability; fitness for a particular purpose; non-infringement; and quality, accuracy, effectiveness, currency, or completeness of material. In addition, IEEE disclaims any and all conditions relating to: results; and workmanlike effort. IEEE standards documents are supplied “AS IS” and “WITH ALL FAULTS.”
Use of an IEEE standard is wholly voluntary. The existence of an IEEE standard does not imply that there are no other ways to produce, test, measure, purchase, market, or provide other goods and services related to the scope of the IEEE standard. Furthermore, the viewpoint expressed at the time a standard is approved and issued is subject to change brought about through developments in the state of the art and comments received from users of the standard.
In publishing and making its standards available, IEEE is not suggesting or rendering professional or other services for, or on behalf of, any person or entity nor is IEEE undertaking to perform any duty owed by any other person or entity to another. Any person utilizing any IEEE Standards document, should rely upon his or her own independent judgment in the exercise of reasonable care in any given circumstances or, as appropriate, seek the advice of a competent professional in determining the appropriateness of a given IEEE standard.
IN NO EVENT SHALL IEEE BE LIABLE FOR ANY DIRECT, INDIRECT, INCIDENTAL, SPECIAL, EXEMPLARY, OR CONSEQUENTIAL DAMAGES (INCLUDING, BUT NOT LIMITED TO: PROCUREMENT OF SUBSTITUTE GOODS OR SERVICES; LOSS OF USE, DATA, OR PROFITS; OR BUSINESS INTERRUPTION) HOWEVER CAUSED AND ON ANY THEORY OF LIABILITY, WHETHER IN CONTRACT, STRICT LIABILITY, OR TORT (INCLUDING NEGLIGENCE OR OTHERWISE) ARISING IN ANY WAY OUT OF THE PUBLICATION, USE OF, OR RELIANCE UPON ANY STANDARD, EVEN IF ADVISED OF THE POSSIBILITY OF SUCH DAMAGE AND REGARDLESS OF WHETHER SUCH DAMAGE WAS FORESEEABLE.

Translations The IEEE consensus development process involves the review of documents in English only. In the event that an IEEE standard is translated, only the English version published by IEEE should be considered the approved IEEE standard.
Official statements
A statement, written or oral, that is not processed in accordance with the IEEE-SA Standards Board Operations Manual shall not be considered or inferred to be the official position of IEEE or any of its committees and shall not be considered to be, or be relied upon as, a formal position of IEEE. At lectures, symposia, seminars, or educational courses, an individual presenting information on IEEE standards shall make it clear that his or her views should be considered the personal views of that individual rather than the formal position of IEEE.
Comments on standards Comments for revision of IEEE Standards documents are welcome from any interested party, regardless of membership affiliation with IEEE. However, IEEE does not provide consulting information or advice pertaining to IEEE Standards documents. Suggestions for changes in documents should be in the form of a proposed change of text, together with appropriate supporting comments. Since IEEE standards represent a consensus of concerned interests, it is important that any responses to comments and questions also receive the concurrence of a balance of interests. For this reason, IEEE and the members of its societies and Standards Coordinating Committees are not able to provide an instant response to comments or questions except in those cases where the matter has previously been addressed. For the same reason, IEEE does not respond to interpretation requests. Any person who would like to participate in revisions to an IEEE standard is welcome to join the relevant IEEE working group.
Comments on standards should be submitted to the following address:
Secretary, IEEE-SA Standards Board 445 Hoes Lane Piscataway, NJ 08854 USA
Laws and regulations
Users of IEEE Standards documents should consult all applicable laws and regulations. Compliance with the provisions of any IEEE Standards document does not imply compliance to any applicable regulatory requirements. Implementers of the standard are responsible for observing or referring to the applicable regulatory requirements. IEEE does not, by the publication of its standards, intend to urge action that is not in compliance with applicable laws, and these documents may not be construed as doing so.
Copyrights
IEEE draft and approved standards are copyrighted by IEEE under U.S. and international copyright laws. They are made available by IEEE and are adopted for a wide variety of both public and private uses. These include both use, by reference, in laws and regulations, and use in private self-regulation, standardization, and the promotion of engineering practices and methods. By making these documents available for use and adoption by public authorities and private users, IEEE does not waive any rights in copyright to the documents.

Photocopies
Subject to payment of the appropriate fee, IEEE will grant users a limited, non-exclusive license to photocopy portions of any individual standard for company or organizational internal use or individual, non-commercial use only. To arrange for payment of licensing fees, please contact Copyright Clearance Center, Customer Service, 222 Rosewood Drive, Danvers, MA 01923 USA; +1 978 750 8400. Permission to photocopy portions of any individual standard for educational classroom use can also be obtained through the Copyright Clearance Center.
Updating of IEEE Standards documents Users of IEEE Standards documents should be aware that these documents may be superseded at any time by the issuance of new editions or may be amended from time to time through the issuance of amendments, corrigenda, or errata. A current IEEE document at any point in time consists of the current edition of the document together with any amendments, corrigenda, or errata then in effect.
Every IEEE standard is subjected to review at least every ten years. When a document is more than ten years old and has not undergone a revision process, it is reasonable to conclude that its contents, although still of some value, do not wholly reflect the present state of the art. Users are cautioned to check to determine that they have the latest edition of any IEEE standard.
In order to determine whether a given document is the current edition and whether it has been amended through the issuance of amendments, corrigenda, or errata, visit IEEE Xplore at http://ieeexplore.ieee.org/ or contact IEEE at the address listed previously. For more information about the IEEE-SA or IEEE’s standards development process, visit the IEEE-SA Website at http://standards.ieee.org.
Errata
Errata, if any, for all IEEE standards can be accessed on the IEEE-SA Website at the following URL: http://standards.ieee.org/findstds/errata/index.html. Users are encouraged to check this URL for errata periodically.
Patents
Attention is called to the possibility that implementation of this standard may require use of subject matter covered by patent rights. By publication of this standard, no position is taken by the IEEE with respect to the existence or validity of any patent rights in connection therewith. If a patent holder or patent applicant has filed a statement of assurance via an Accepted Letter of Assurance, then the statement is listed on the IEEE-SA Website at http://standards.ieee.org/about/sasb/patcom/patents.html. Letters of Assurance may indicate whether the Submitter is willing or unwilling to grant licenses under patent rights without compensation or under reasonable rates, with reasonable terms and conditions that are demonstrably free of any unfair discrimination to applicants desiring to obtain such licenses.
Essential Patent Claims may exist for which a Letter of Assurance has not been received. The IEEE is not responsible for identifying Essential Patent Claims for which a license may be required, for conducting inquiries into the legal validity or scope of Patents Claims, or determining whether any licensing terms or conditions provided in connection with submission of a Letter of Assurance, if any, or in any licensing agreements are reasonable or non-discriminatory. Users of this standard are expressly advised that determination of the validity of any patent rights, and the risk of infringement of such rights, is entirely their own responsibility. Further information may be obtained from the IEEE Standards Association.
Copyright © 2018 IEEE. All rights reserved.
7
Participants
At the time this IEEE recommended practice was submitted to the IEEE-SA Standards Board for approval, the Power Systems Reliability Working Group of the Technical Books Coordinating Committee of the Industrial and Commercial Power Systems Department of the Industry Applications Society had the following membership:
Robert G. Arno, Chair Neal Dowling, Vice Chair
Timothy Coyle Peyton S. Hale
Masoud Pourali Robert Schuerger
Michael Simon Christopher C. Thompson
At the time this IEEE recommended practice was completed, the Power Systems Reliability Working Group had the following membership:
Christopher C. Thompson, Chair
Timothy Coyle Neal Dowling
Peyton S. Hale Masoud Pourali
Robert Schuerger Michael Simon
The following members of the individual balloting committee voted on this recommended practice. Balloters may have voted for approval, disapproval, or abstention.
Ali Al Awazi Robert G. Arno Louis Barrios Wallace Binder Thomas Bishop Frederick Brockhurst Gustavo Brunello Demetrio Bucaneg, Jr. William Byrd Paul Cardinal Dion Caves Steven Chen Michael Chirico Greg Clement Terry Conrad Daryld Crow Glenn Davis Davide De Luca Gary Donner Neal Dowling H. Landis FloydMietek GlinkowskiWaymon GochEdwin GoodwinLou GrahorRandall GrovesScott Hietpas
Werner Hoelzl Robert Hoerauf Gary Hoffman Richard Holub Christel Hunter Gerald Irvine John Kay Yuri Khersonsky Yoonik Kim Jim Kulchisky James Lagree Wei-Jen Lee Duane Leschert Albert Livshitz William Lockley Daleep Mohla William Moylan Jerry Murphy Daniel Neeser Dennis Neitzel Arthur Neubauer Joe Nims Gearold O. H. Eidhin Howard Penrose Jim Phillips Masoud Pourali Iulian Profir
John Rama James Reilly John Roach Tim Rohrer Ryandi Ryandi Daniel Sabin Vincent Saporita Bartien Sayogo Robert Schuerger Kenneth Sedziol Michael Simon Jerry Smith Gary Smullin Wayne Stec Thomas Stewart David Tepen Wayne Timm Timothy Unruh James Van De Ligt Van Wagner Keith Waters Kenneth White Dean Yager Jian Yu David Zech Shuhui Zhang Gaetano Zizzo

When the IEEE-SA Standards Board approved this recommended practice on 27 September 2018, it had the following membership:
Jean-Philippe Faure, Chair Gary Hoffman, Vice Chair
John Kulick, Past Chair Konstantinos Karachalios, Secretary
Chuck Adams Masayuki Ariyoshi Ted Burse Stephen Dukes Doug Edwards J. Travis GriffithMichael Janezic
Thomas Koshy Joseph L. Koepfinger* Kevin Lu Daleep Mohla Damir Novosel Ronald C. Petersen Annette D. Reilly
Robby Robson Dorothy Stanley Adrian Stephens Mehmet Ulema Phil Wennblom Howard Wolfman Yu Yuan
*Member Emeritus
8
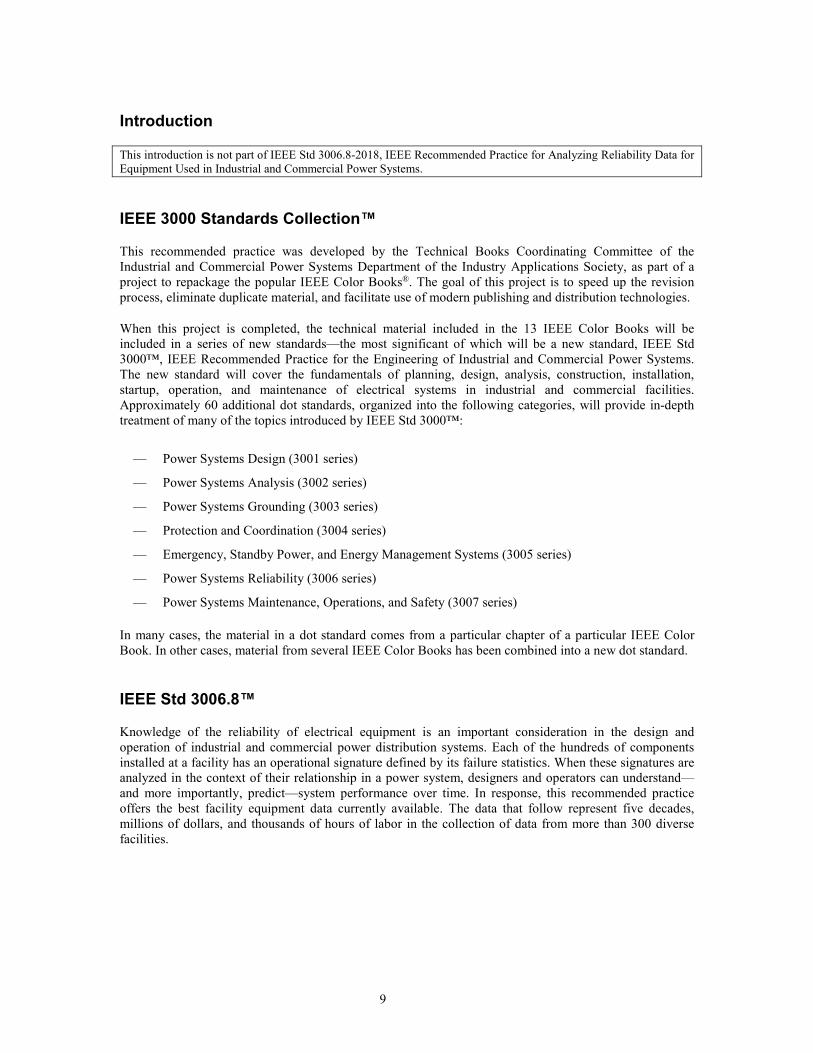
Introduction
This introduction is not part of IEEE Std 3006.8-2018, IEEE Recommended Practice for Analyzing Reliability Data for Equipment Used in Industrial and Commercial Power Systems.
IEEE 3000 Standards Collection™
This recommended practice was developed by the Technical Books Coordinating Committee of the Industrial and Commercial Power Systems Department of the Industry Applications Society, as part of a project to repackage the popular IEEE Color Books®. The goal of this project is to speed up the revision process, eliminate duplicate material, and facilitate use of modern publishing and distribution technologies.
When this project is completed, the technical material included in the 13 IEEE Color Books will be included in a series of new standards—the most significant of which will be a new standard, IEEE Std 3000™, IEEE Recommended Practice for the Engineering of Industrial and Commercial Power Systems. The new standard will cover the fundamentals of planning, design, analysis, construction, installation, startup, operation, and maintenance of electrical systems in industrial and commercial facilities. Approximately 60 additional dot standards, organized into the following categories, will provide in-depth treatment of many of the topics introduced by IEEE Std 3000™:
— Power Systems Design (3001 series)
— Power Systems Analysis (3002 series)
— Power Systems Grounding (3003 series)
— Protection and Coordination (3004 series)
— Emergency, Standby Power, and Energy Management Systems (3005 series)
— Power Systems Reliability (3006 series)
— Power Systems Maintenance, Operations, and Safety (3007 series)
In many cases, the material in a dot standard comes from a particular chapter of a particular IEEE Color Book. In other cases, material from several IEEE Color Books has been combined into a new dot standard.
IEEE Std 3006.8™
Knowledge of the reliability of electrical equipment is an important consideration in the design and operation of industrial and commercial power distribution systems. Each of the hundreds of components installed at a facility has an operational signature defined by its failure statistics. When these signatures are analyzed in the context of their relationship in a power system, designers and operators can understand—and more importantly, predict—system performance over time. In response, this recommended practice offers the best facility equipment data currently available. The data that follow represent five decades, millions of dollars, and thousands of hours of labor in the collection of data from more than 300 diverse facilities.
9

Contents
1. Overview ...................................................................................................................................................11 1.1 Scope ..................................................................................................................................................11
2. Normative references .................................................................................................................................11
3. Definitions .................................................................................................................................................11
4. Introduction ...............................................................................................................................................12
5. Part 1: Mechanical and electrical equipment data, 1994 and 2005 ............................................................13 5.1 Database development ........................................................................................................................13 5.2 Results ................................................................................................................................................16 5.3 Introduction ........................................................................................................................................34 5.4 1979 switchgear bus reliability data ...................................................................................................34 5.5 1980 generator survey data .................................................................................................................35 5.6 1979 survey of the reliability of transformers .....................................................................................36 5.7 1983 IEEE survey on the reliability of large motors ..........................................................................42
6. Part 3: Equipment reliability surveys conducted prior to 1976 .................................................................52 6.1 Introduction ........................................................................................................................................52 6.2 Reliability of electrical equipment (1974 survey)...............................................................................54
Annex A (informative) Bibliography ............................................................................................................68
10

IEEE Recommended Practice for Analyzing Reliability Data for Equipment Used in Industrial and Commercial Power Systems
1. Overview
1.1 Scope
This recommended practice describes how to analyze reliability data for equipment used in industrial and commercial power systems. Equipment reliability data collected over the years is presented. This is followed by a discussion of key equipment reliability metrics, such as failure rate, downtime to repair in hours per failure, and probability of starting (operating).
2. Normative references
The following referenced documents are indispensable for the application of this document (i.e., they must be understood and used, so each referenced document is cited in text and its relationship to this document is explained). For dated references, only the edition cited applies. For undated references, the latest edition of the referenced document (including any amendments or corrigenda) applies.
Historical Reliability Data for IEEE 3006 Standards: Power System Reliability™.1,2
IEEE Std 3006.2-2016™, Recommended Practice for Evaluating the Reliability of Existing Industrial and Commercial Power Systems.
3. Definitions
For the purposes of this document, the following terms and definitions apply. The IEEE Standards Dictionary Online should be consulted for terms not defined in this clause.3
1 The IEEE standards or products referred to in this clause are trademarks of The Institute of Electrical and Electronics Engineers, Inc. 2 IEEE publications are available from The Institute of Electrical and Electronics Engineers, 445 Hoes Lane, Piscataway, NJ 08854, USA (http://standards.ieee.org/).
11

IEEE Std 3006.8-2018 IEEE Recommended Practice for Analyzing Reliability Data for Equipment Used in Industrial and Commercial Power
Systems
For definitions of terms pertaining to power system reliability used in this standard, refer to IEEE Std 3006.5™-2014.
4. Introduction
Knowledge of the reliability of electrical equipment is an important consideration in the design and operation of industrial and commercial power distribution systems. Each of the hundreds of components installed at a facility has an operational signature defined by its failure statistics. When these signatures are analyzed in the context of their relationship in a power system, designers and operators can understand—and more importantly, predict—system performance over time. In response, this recommended practice offers the best facility equipment data currently available. The data that follow represent five decades, millions of dollars, and thousands of hours of labor in the collection of data from more than 300 diverse facilities.
The failure characteristics of individual pieces of electrical equipment can be partially described by the following basic statistics: mean time to repair (MTTR) and mean time between failures (MTBF). From these, most failure statistics can be calculated, including and especially, reliability (r) and inherent availability (ai). Data on other factors (e.g., cause and type of failures, maintenance procedures, repair method, etc.) are also required to characterize the performance of electrical equipment in service (refer to Historical Reliability Data for IEEE 3006 Standards: Power System Reliability, page 1 and page 61 for more information).
Availability is a key measure of facility performance. Many facilities operate for long periods of time, providing power to perform critical functions. Balancing the cost of design, construction, and maintenance against the requirement for continuous and reliable operation is of the utmost importance. Understanding both component-level and system-level failure statistics is essential to achieving this balance.
The data in this recommended practice are used to model power system performance. The analytical models required for estimating power system performance are presented in IEEE Std 3006.3™-2017 [B21], IEEE Std 3006.5™-2014, and IEEE Std 3006.9™-2013 [B23].
The recommended practice is divided into three parts, which together cover data collection programs spanning more than 45 years. Each part consists of a large collection of equipment reliability and availability statistics.
Part 1 includes data from two major collection efforts conducted by the U.S. Army Corps of Engineers Power Reliability Enhancement Program (USACE-PREP). The 1994 data collection program was extensive, including information for many types of commercial facilities within the United States. The 2005 program replicated and expanded upon the 1994 program, respecting its standards for data integrity. Together, these efforts created the most comprehensive facility equipment reliability database in existence.
Part 2 is a collection of equipment surveys conducted between 1976 and 1994. The resolution is remarkable, as it specifically divulges cause of failure, a valuable piece of knowledge for facility managers.
Part 3 is a collection of equipment surveys conducted before 1976. The data in this collection reveal detail about failure modes, time of failure discovery, and how failures were repaired following discovery. The data also give failure data for utility providers in a variety of configurations and voltage classes.
Each of the three parts complements the others, providing focused data to key indicators of equipment performance. Details of the survey data (Part 2 and Part 3) are unavailable to statistically merge with the data collected in Part 1; the raw individual component information from the data collection has been lost over time.
3IEEE Standards Dictionary Online is available at: http://dictionary.ieee.org.
12
IEEE Std 3006.8-2018 IEEE Recommended Practice for Analyzing Reliability Data for Equipment Used in Industrial and Commercial Power
Systems
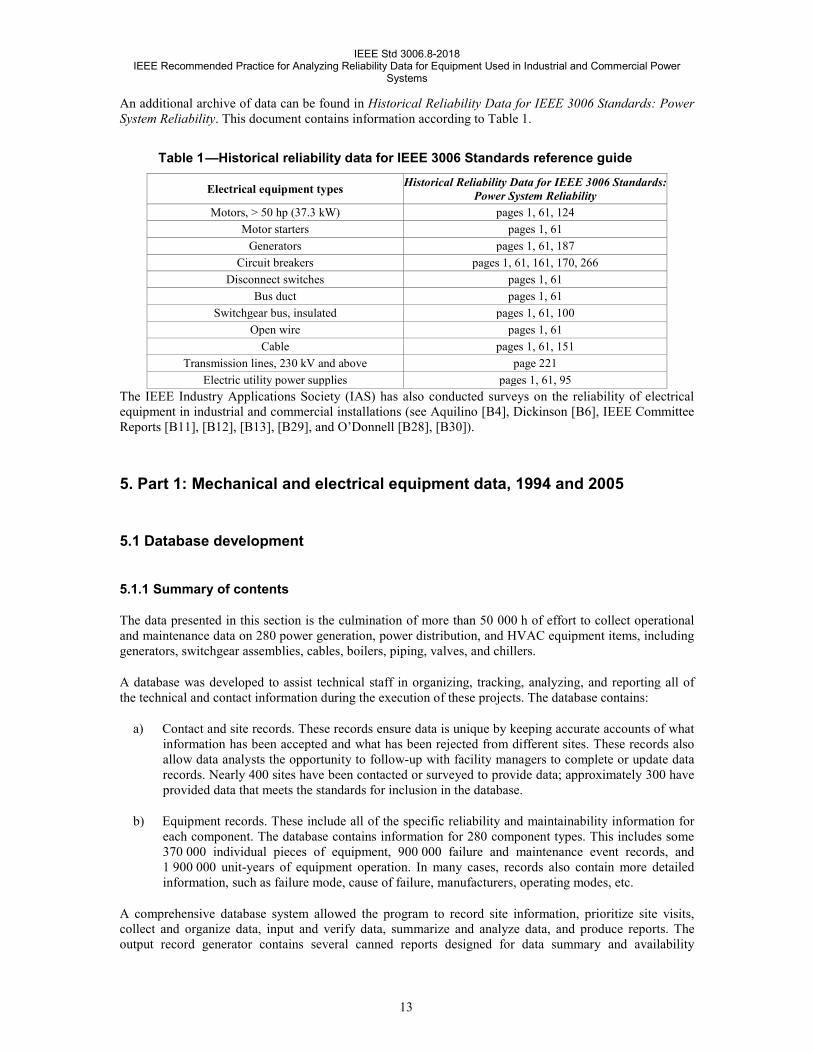
An additional archive of data can be found in Historical Reliability Data for IEEE 3006 Standards: Power System Reliability. This document contains information according to Table 1.
Table 1 —Historical reliability data for IEEE 3006 Standards reference guide
Electrical equipment types Historical Reliability Data for IEEE 3006 Standards: Power System Reliability
Motors, > 50 hp (37.3 kW) pages 1, 61, 124 Motor starters pages 1, 61
Generators pages 1, 61, 187 Circuit breakers pages 1, 61, 161, 170, 266
Disconnect switches pages 1, 61 Bus duct pages 1, 61
Switchgear bus, insulated pages 1, 61, 100 Open wire pages 1, 61
Cable pages 1, 61, 151 Transmission lines, 230 kV and above page 221
Electric utility power supplies pages 1, 61, 95 The IEEE Industry Applications Society (IAS) has also conducted surveys on the reliability of electrical equipment in industrial and commercial installations (see Aquilino [B4], Dickinson [B6], IEEE Committee Reports [B11], [B12], [B13], [B29], and O’Donnell [B28], [B30]).
5. Part 1: Mechanical and electrical equipment data, 1994 and 2005
5.1 Database development
5.1.1 Summary of contents
The data presented in this section is the culmination of more than 50 000 h of effort to collect operational and maintenance data on 280 power generation, power distribution, and HVAC equipment items, including generators, switchgear assemblies, cables, boilers, piping, valves, and chillers.
A database was developed to assist technical staff in organizing, tracking, analyzing, and reporting all of the technical and contact information during the execution of these projects. The database contains:
a) Contact and site records. These records ensure data is unique by keeping accurate accounts of whatinformation has been accepted and what has been rejected from different sites. These records alsoallow data analysts the opportunity to follow-up with facility managers to complete or update datarecords. Nearly 400 sites have been contacted or surveyed to provide data; approximately 300 haveprovided data that meets the standards for inclusion in the database.
b) Equipment records. These include all of the specific reliability and maintainability information foreach component. The database contains information for 280 component types. This includes some370 000 individual pieces of equipment, 900 000 failure and maintenance event records, and1 900 000 unit-years of equipment operation. In many cases, records also contain more detailedinformation, such as failure mode, cause of failure, manufacturers, operating modes, etc.
A comprehensive database system allowed the program to record site information, prioritize site visits, collect and organize data, input and verify data, summarize and analyze data, and produce reports. The output record generator contains several canned reports designed for data summary and availability
13

IEEE Std 3006.8-2018 IEEE Recommended Practice for Analyzing Reliability Data for Equipment Used in Industrial and Commercial Power
Systems
calculations. Some of the reports are designed to allow the user the flexibility to select a multitude of query topics.
The database software and structure has evolved as the database has grown. The current version is contained in a common software package with a user-friendly front-end graphical user interface. Recent design changes allowed new data to be automatically uploaded, reducing manual labor and increasing accuracy.
5.1.2 Data collection
Contacts were the key to the success of this program. The cooperation and support of the people involved from the many facilities is demonstrated in the quality of data received to support the data collection.
A concerted effort was employed to develop an extensive contact database using manufacturers, facilities, societies, and locations of any potential data contributor utilizing key electrical, mechanical, and control components. The collection teams sought manufacturers for contacts as well as warranty information, 25 of which participated. A total of 25 professional societies were also contacted, including:
a) American Gas Association
b) National Association of Power Engineers
c) American Society of Mechanical Engineers
d) Association of Physical Plant Administrators
e) Association of Energy Engineers
The final list of sites includes universities, government facilities, prisons, utilities, office buildings, and other types of facilities. Specifics of these contributors are withheld to protect the confidentiality of the sources.
Building and managing the database requires a broad focus, looking into how each additional site contributes to the database as a whole. In order to collect statistically valid data it was important that a stratified survey of different facility categories, applications, and operating conditions be conducted. Guidelines were developed to assist in the selection of potential sites that vary in (a) degree of maintenance, (b) facility type, (c) component size, and (d) equipment age.
Collecting diversified data was critical to covering the spectrum of how equipment may operate and fail. To locate sites with equipment and data collection policies that conform to the standards of the database, surveys were first issued to hundreds of candidate facilities. Those that responded with potential for inclusion were visited by the data collection team. The team then copied the data, to be later pushed through the rigorous quality assurance process. The procedure for conducting the survey is given in Historical Reliability Data for IEEE 3006 Standards: Power System Reliability, page 109. Information on the determination and analysis of reliability studies is presented in IEEE Std 500™-1984 [B18].
5.1.3 Data summarization and classification
As with every data collection program, there are varying degrees of completeness in the data gathered. Some data sources had complete records and could give statistics on operational characteristics on every piece of equipment from the installation date through the collection date. More often, the only items tracked were major items, such as cooling towers and generators. Other problems included incomplete or non-current versions of the equipment drawings.
14

IEEE Std 3006.8-2018 IEEE Recommended Practice for Analyzing Reliability Data for Equipment Used in Industrial and Commercial Power
Systems
It became important to categorize the different levels of data completeness to ensure that the final data collection included fair data representation for each component. In other words, it is important to avoid a bias stemming from record quality. To quantify this data completion (or quality) index, the collection team identified these four levels:
a) Perfect data: Data needed for a valid, complete reliability study, including a parts list, failurehistory data with time-to-failure statistics, parts description data, operational periods, and fivecontinuous years of recorded data. No engineering judgment or data extrapolation is required. TheUSACE-PREP equipment record database is composed of 10% to 20% of this type of data.
b) Imperfect data: Data without serious flaws, but the data collection process demanded additionaltime to ensure useful information was gathered. Examples include parts list determined byinspection, incomplete drawings, or less than five years of data. The USACE-PREP equipmentrecord database contains 35% to 40% of this type of data.
c) Verbal/inspection data: Data with serious gaps that required additional documentation andverification prior to its inclusion in the database. Items included were typically major items, such asgenerator sets and boilers. Senior maintenance personnel were interviewed to extract the necessaryinformation to fill the data gaps. These interviews were used as support documentation of recordeddata, not as data source information. About 25% of this type of data exists in the USACE-PREPequipment record database.
d) Soft data: Data that relied on the memories of experienced maintenance personnel from theparticipating facility; it was often extracted from log books containing maintenance personnelentries, filing cabinets with work order forms, and repair records when outside repair support wasneeded. Engineering judgment was often used to determine numerous performance parameters.This type of data was the most difficult and time consuming to summarize, and was only usedwhen other data sources were unavailable and when it could be sufficiently completed to meet theinput standards. The USACE-PREP equipment record database is composed of 10% to 15% of thistype of data.
These levels helped determine the effort required to identify and categorize the components at the site. Engineers prepared all candidate data for analysis through a process called summarization. The database requires all information to be imported in correct and consistent format. Engineers assemble all known data for a subject component in tables, including nameplate information, such as make, model, serial number, install/removal date, etc., and failure and maintenance event information, such as date of incident, outage duration, cause of event, type of event, etc. Engineers purged data for other types of equipment outside of the database scope.
5.1.4 Maintenance policy
One objective of the data collection effort was to minimize the effects of maintenance policies and procedures on the calculated availability values by collecting data from a variety of locations having various maintenance policies. The database team developed a code to categorize each facility’s maintenance policies and procedures into one of three levels:
a) Code 1: Above average maintenance policy. The facility not only followed a scheduled, preventivemaintenance policy that was equivalent or similar to the manufacturer’s suggested policy, but alsowent beyond it, such as using redundant units, specialized equipment tests (thermograph, vibrationanalysis, oil analysis), complete spare parts kits for equipment, and so on. The USACE-PREPequipment database is composed of 25% of this type of data.
b) Code 2: Average maintenance policy. The facility used either in-house maintenance crewsperforming scheduled, preventative maintenance according to the equipment manufacturer’s
15
IEEE Std 3006.8-2018 IEEE Recommended Practice for Analyzing Reliability Data for Equipment Used in Industrial and Commercial Power
Systems
suggested preventive maintenance schedule, or a combination of in-house maintenance crews and outside contractors. In both cases, it was verified that they did actually follow a fairly rigid schedule. The USACE-PREP equipment database is composed of 58% of this type of data.
c) Code 3: Below average maintenance policy. The facility’s actual policy was slightly lower thanaverage. It may have instituted a scheduled maintenance policy but not followed it, or it may havehad no maintenance policy. Symptoms such as leaky valves with rags tied around them, dirty airfilters, squeaky bearings, loose belts, and lax general housekeeping because of unavailable laborwere typical signs that maintenance policies were less than desirable. The USACE-PREPequipment database is composed of 17% of this type of data.
Each location was then compared to each other and to the average maintenance policy. Overall, the facilities that the collection teams visited practiced an average level of maintenance; that is, they adhered to the manufacturer’s recommended maintenance policies. The team looked at approximately the same number of facilities that had below average maintenance policies as those facilities that had an above average maintenance policy.
5.1.5 Analysis and inclusion
Engineers used test statistics (goodness-of-fit, Weibull) to compare candidate data to established populations of reliability data. Significant outliers warranted a review of the data set being considered. If the new data set was both an outlier and showed suspicious site data (e.g., data gaps, mistakes) the data set was rejected. A statistical outlier alone was not a sufficient reason to reject candidate data.
Following the analysis, engineers made accept/reject decisions for every candidate data set. A computer algorithm processed all accepted data, verifying formatting, data types, and other information. Engineers reviewed an output file for each submission, confirming that data was incorporated into the database as expected.
5.2 Results
5.2.1 USACE-PREP equipment reliability database
The final USACE-PREP database includes the 280 different components. A hierarchical structure provides the analyst with options to use a specific type of component or data for a general category of components. As an example, the category of Accumulator comprises two classes (pressurized and unpressurized). Reliability data are presented for each class and for the entire category of Accumulators.
Some categories of equipment are more complete than others. Though not a perfect proxy, unit-years can be used to interpret the confidence in a data point. A few components have less than 10 unit-years of information available; many have more than 10 000. When using information from the database, the analyst may opt to use a data point for a category of equipment, which may be a more reliable statistic than a data point for a specific class.
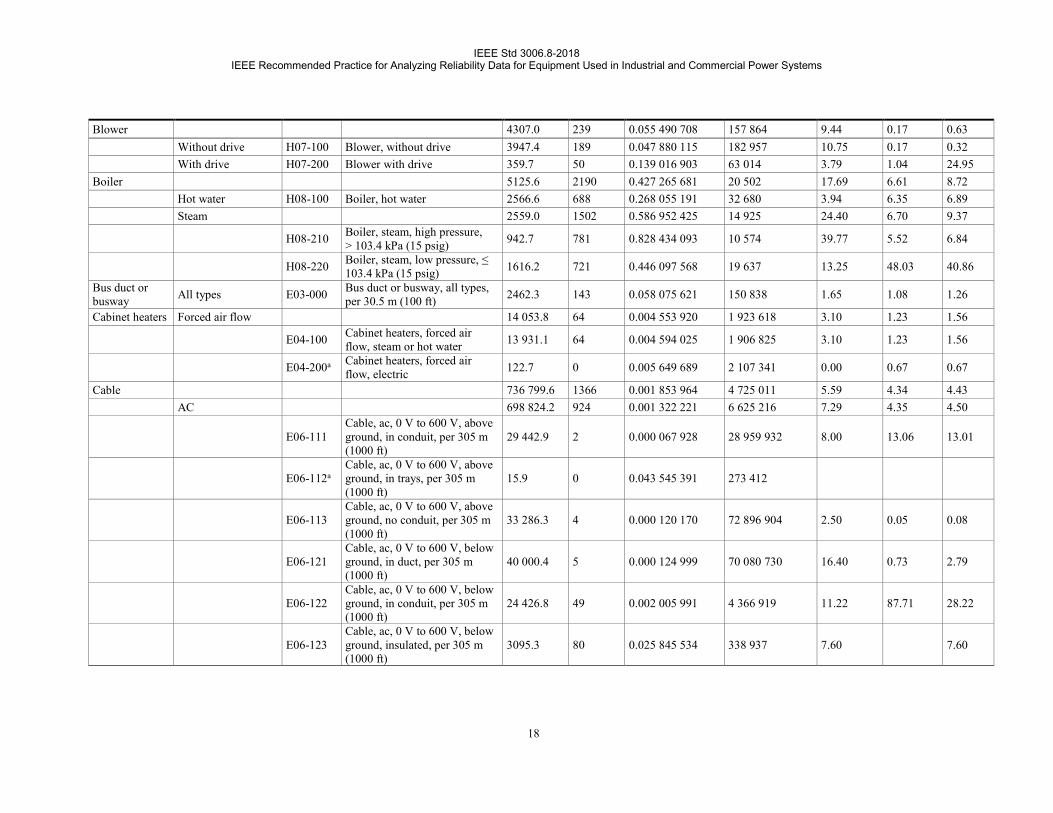
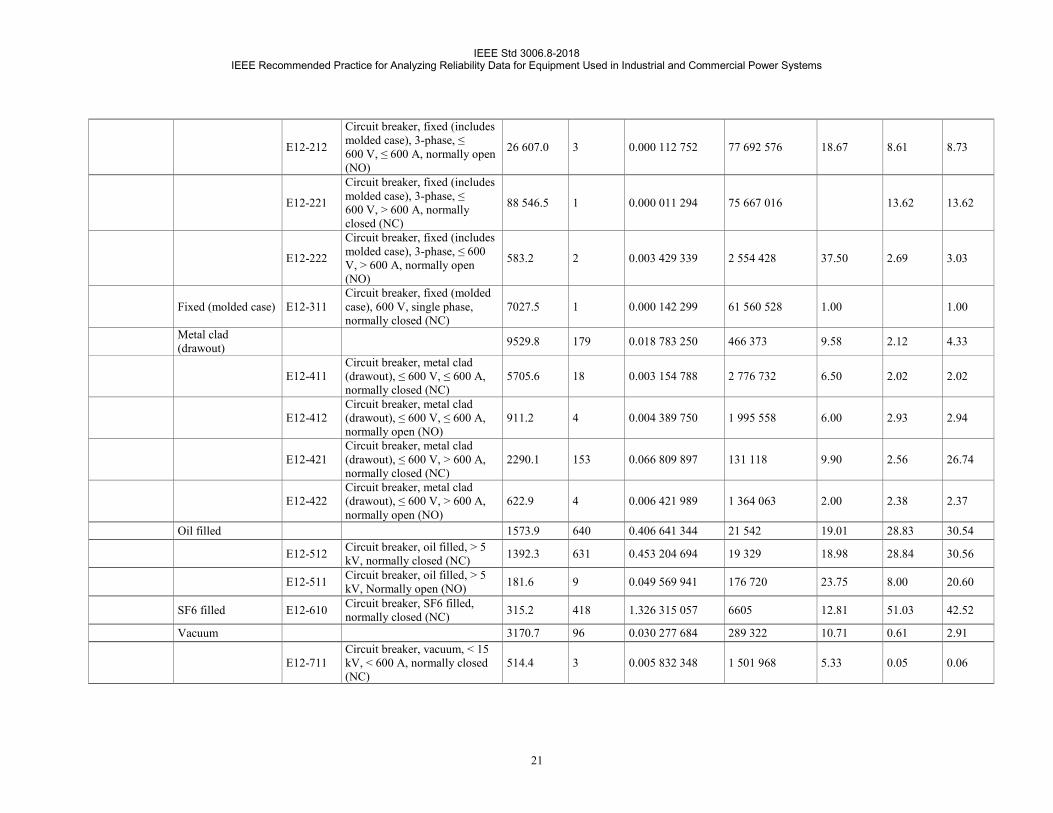
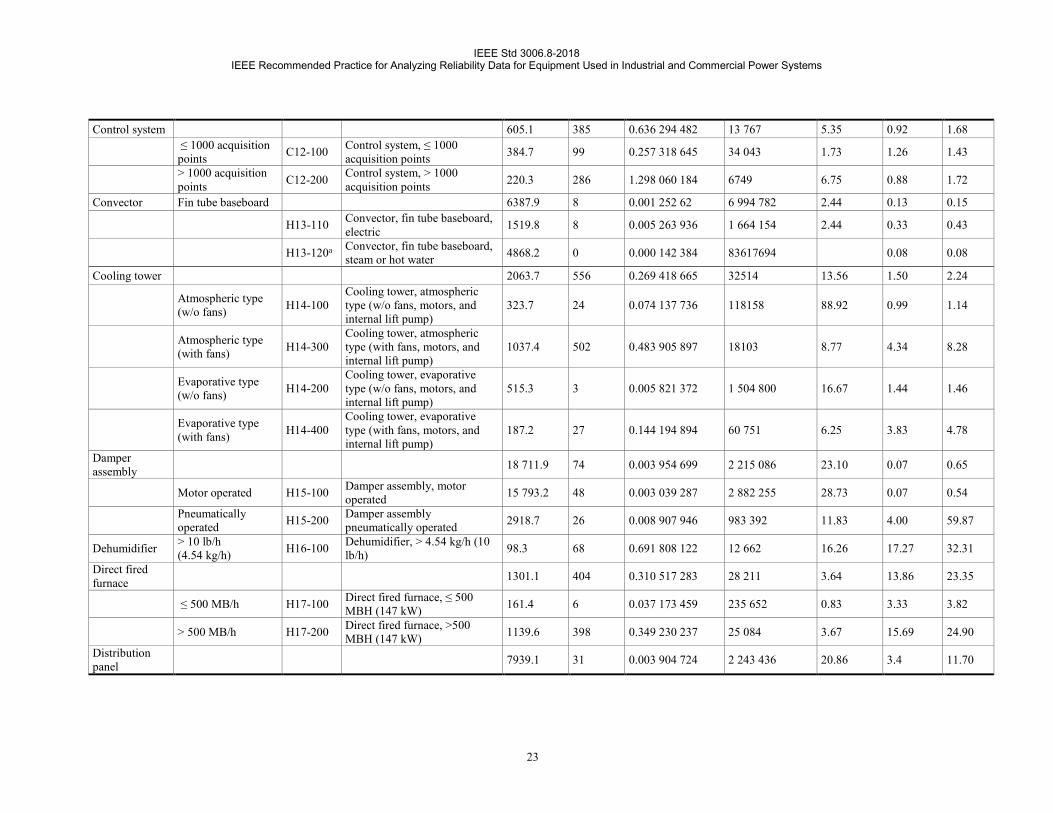
Table 2 displays the average failure and maintenance statistics of the data collection described in Part 1.
16

IEEE Std 3006.8-2018 IEEE Recommended Practice for Analyzing Reliability Data for Equipment Used in Industrial and Commercial Power Systems
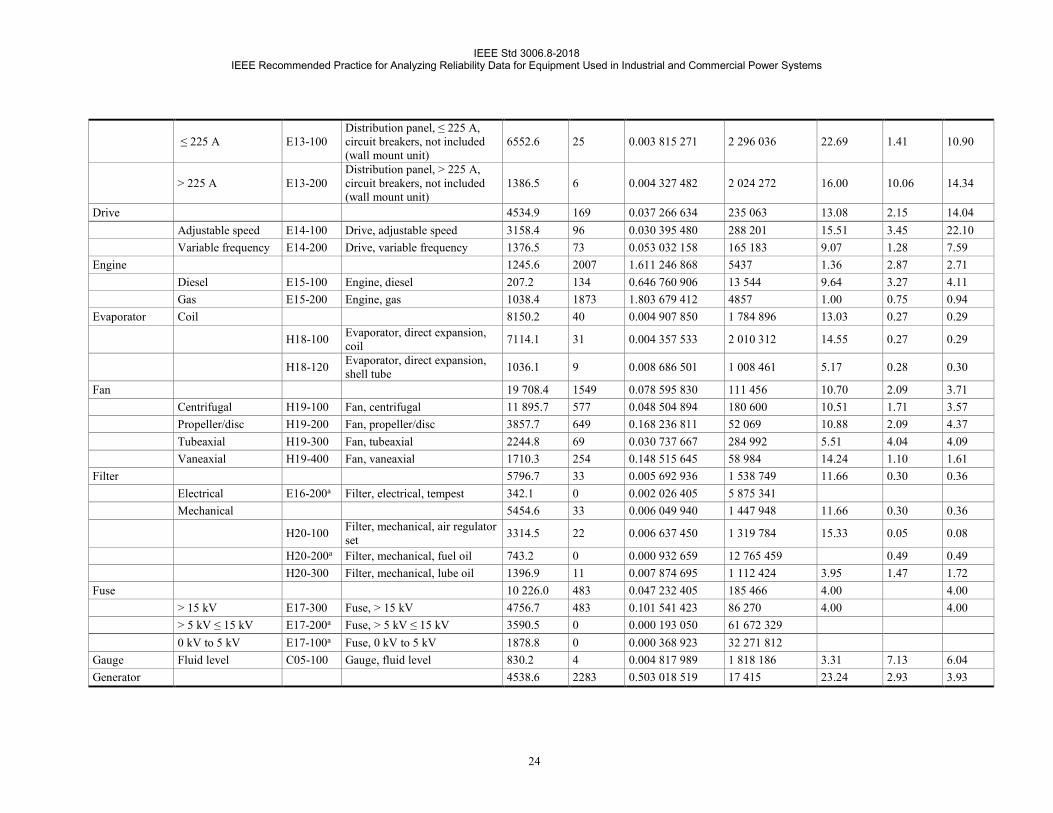
Table 2 —USACE-PREP equipment reliability database
Category Class Unit-years Failures Failure rate
(failures/year) MTBF (hours)
MTTR (hours)
MTTM (hours)
MDT (hours)
Accumulator 1463.2 10 0.006 834 233 1 281 782 7.80 0.94 0.98 Pressurized H01-100 Accumulator, pressurized 1072.8 7 0.006 525 131 1 342 502 10.29 0.96 1.01 Unpressurized H01-200 Accumulator, unpressurized 390.4 3 0.007 683 510 1 140 104 2.00 0.33 0.42
Air compressor 5124.5 1592 0.310 662 877 28 198 12.20 1.55 4.24 Electric H02-100 Air compressor, electric 4534.6 1492 0.329 029 093 26 624 11.80 1.48 4.16 Fuel H02-200 Air compressor, fuel 590.0 100 0.169 499 396 51 682 17.45 2.72 5.71
Air conditioner All types H03-000 Air conditioner 4947.4 781 0.157 860 257 55 492 5.95 1.59 2.63 Air dryer All types H04-000 Air dryer, all types 2307.2 170 0.073 681 948 118 889 9.11 1.44 5.36 Air handling unit 12 173.7 2650 0.217 681 964 40 242 5.06 1.99 3.27
Humid 379.1 68 0.179 375 438 48 836 2.55 2.53 3.21
H05-110a Air handling unit, humid, pan humid, w/o drive 25.0 0 0.027 695 536 429 882 0.00 0.00 0.00
H05-130 Air handling unit, humid, pan humid, with drive 212.8 30 0.140 975 629 62 138 3.02 2.73 2.94
H05-120a Air handling unit, humid, spray humid, w/o drive 38.1 0 0.018205276 653 976 0.00 0.00 0.00
H05-140 Air handling unit, humid, spray humid, with drive 103.2 38 0.368 256 160 23 788 2.27 1.59 4.31
Multizone system H05-310 Air handling unit, multizone system, packaged 1103.7 448 0.405 891 785 21 582 6.18 4.34 9.97
Non-humid 10 690.9 2134 0.199 609 243 43 886 4.75 1.67 2.38
H05-210 Air handling unit, non-humid, without drive 7821.1 1734 0.221 709 225 39 511 4.95 1.88 2.40
H05-220 Air handling unit, non-humid, with drive 2869.8 400 0.139 380 939 62 849 4.18 1.51 2.36
Air separator All types H06-000 Air separator, all types 84.7 9 0.106 272 848 82 429 6.31 0.88 3.35
Surge arrester Surge and lightning E01-000 Surge arrester, surge and lightning 1863.4 12 0.006 439 803 1 360 290 9.50 12.28 11.66
Battery Rechargeable 13 228.7 121 0.009 146 782 957 714 13.40 0.16 0.45 E02-110 Battery, gel cell-sealed 3106.8 53 0.017 059 514 513 496 2.00 0.13 0.15 E02-120 Battery, lead acid 5022.6 65 0.012 941 467 676 894 24.08 0.25 4.31 E02-130 Battery, nickel-cadmium 5099.3 3 0.000 588 315 14 889 985 10.33 0.16 0.16
17
IEEE Std 3006.8-2018 IEEE Recommended Practice for Analyzing Reliability Data for Equipment Used in Industrial and Commercial Power Systems
Blower 4307.0 239 0.055 490 708 157 864 9.44 0.17 0.63 Without drive H07-100 Blower, without drive 3947.4 189 0.047 880 115 182 957 10.75 0.17 0.32 With drive H07-200 Blower with drive 359.7 50 0.139 016 903 63 014 3.79 1.04 24.95
Boiler 5125.6 2190 0.427 265 681 20 502 17.69 6.61 8.72 Hot water H08-100 Boiler, hot water 2566.6 688 0.268 055 191 32 680 3.94 6.35 6.89 Steam 2559.0 1502 0.586 952 425 14 925 24.40 6.70 9.37
H08-210 Boiler, steam, high pressure, > 103.4 kPa (15 psig) 942.7 781 0.828 434 093 10 574 39.77 5.52 6.84
H08-220 Boiler, steam, low pressure, ≤ 103.4 kPa (15 psig) 1616.2 721 0.446 097 568 19 637 13.25 48.03 40.86
Bus duct or busway All types E03-000 Bus duct or busway, all types,
per 30.5 m (100 ft) 2462.3 143 0.058 075 621 150 838 1.65 1.08 1.26
Cabinet heaters Forced air flow 14 053.8 64 0.004 553 920 1 923 618 3.10 1.23 1.56
E04-100 Cabinet heaters, forced air flow, steam or hot water 13 931.1 64 0.004 594 025 1 906 825 3.10 1.23 1.56
E04-200a Cabinet heaters, forced air flow, electric 122.7 0 0.005 649 689 2 107 341 0.00 0.67 0.67
Cable 736 799.6 1366 0.001 853 964 4 725 011 5.59 4.34 4.43 AC 698 824.2 924 0.001 322 221 6 625 216 7.29 4.35 4.50
E06-111 Cable, ac, 0 V to 600 V, above ground, in conduit, per 305 m (1000 ft)
29 442.9 2 0.000 067 928 28 959 932 8.00 13.06 13.01
E06-112a Cable, ac, 0 V to 600 V, above ground, in trays, per 305 m (1000 ft)
15.9 0 0.043 545 391 273 412
E06-113 Cable, ac, 0 V to 600 V, above ground, no conduit, per 305 m (1000 ft)
33 286.3 4 0.000 120 170 72 896 904 2.50 0.05 0.08
E06-121 Cable, ac, 0 V to 600 V, below ground, in duct, per 305 m (1000 ft)
40 000.4 5 0.000 124 999 70 080 730 16.40 0.73 2.79
E06-122 Cable, ac, 0 V to 600 V, below ground, in conduit, per 305 m (1000 ft)
24 426.8 49 0.002 005 991 4 366 919 11.22 87.71 28.22
E06-123 Cable, ac, 0 V to 600 V, below ground, insulated, per 305 m (1000 ft)
3095.3 80 0.025 845 534 338 937 7.60 7.60
18

IEEE Std 3006.8-2018 IEEE Recommended Practice for Analyzing Reliability Data for Equipment Used in Industrial and Commercial Power Systems
E06-211 Cable, ac, 601 kV to 15 kV, above ground, in conduit, per 305 m (1000 ft)
523 356.6 281 0.000 536 919 16 315 315 8.56 40.51 16.11
E06-212a Cable, ac, 601 kV to 15 kV, Above ground, in trays, per 305 m (1000 ft)
180.1 0 0.003 849 060 3 093 176
E06-214 Cable, ac, 601 kV to 15 kV, above ground, in trays, in conduit, per 305 m (1000 ft)
2646.0 2 0.000 755 852 11 589 564 4.00 4.00
E06-221 Cable, ac, 601 kV to 15 kV, below ground, in conduit, per 305 m (1000 ft)
19 525.5 46 0.002 355 896 3 718 331 15.70 211.43 41.55
E06-222 Cable, ac, 601 kV to 15 kV, below ground, in duct, per 305 m (1000 ft)
78.1 1 0.012 799 383 684 408
E06-223 Cable, ac, 601 kV to 15 kV, below ground, insulated, per 305 m (1000 ft)
22 770.3 454 0.019 938 292 439 356 5.13 3.97 4.01
Aerial 37 500.3 439 0.011 706 565 748 298 2.03 0.35 1.91
E07-200 Cable, aerial, > 15 kV, per 1.6 km (1 mile) 30 884.9 127 0.004 112 048 2 130 325 2.54 0.35 2.08
E07-100 Cable, aerial, 0 kV to 15 kV, per 1.6 km (1 mile) 6615.5 312 0.047 162 173 185 742 1.82 1.82
DC E08-100 Cable, dc, insulated, per 305 m (1000 ft) 475.1 3 0.006 313 969 1 387 400 2.00 2.00
Cable connection Underground E05-100 Cable connection, underground,
duct, ≤ 600 V 21 574.5 8 0.000 370 808 23 624 073 0.75 0.75
Capacitor bank All types E10-000 Capacitor/capacitor bank, all types 2041.1 104 0.050 951 857 171 927 2.37 4.27 3.13
Charger Battery E11-000 Charger, battery 666.0 26 0.039 040 966 224 380 7.46 0.72 2.29 Chiller 3607.7 1283 0.355 626 726 24 633 8.57 1.86 3.33
Absorption H10-100 Chiller, absorption 587.7 93 0.158 231 093 55 362 11.40 0.68 0.72 Centrifugal 1054.5 529 0.501 674 408 17 462 7.73 11.29 24.68
H10-210 Chiller, centrifugal, ≤ 600 tons (2110 kW) 152.1 298 1.959 149 120 4471 5.75 29.58 140.30
H10-230 Chiller, centrifugal, > 1000 tons (3517 kW) 242.9 152 0.625 733 105 14 000 9.23 35.17 35.44
19

IEEE Std 3006.8-2018 IEEE Recommended Practice for Analyzing Reliability Data for Equipment Used in Industrial and Commercial Power Systems
H10-220 Chiller, centrifugal, 600 tons to 1000 tons (2110 kW to 3517 kW)
659.4 79 0.119 797 371 73 123 11.81 5.28 5.51
Reciprocating 1193.5 192 0.160 868 248 54 455 10.77 1.65 2.21
H10-321 Chiller, reciprocating, closed, with drive, 50 tons to 200 tons (176 kW to 703 kW)
881.8 139 0.157 633 096 55 572 11.11 1.53 2.06
H10-331 Chiller, reciprocating, open, w/o drive, 50 tons to 200 tons (176 kW to 703 kW)
285.7 53 0.185 495 934 47 225 10.02 2.98 3.80
H10-311a Chiller, reciprocating, with drive, < 50 tons (176 kW) 26.0 0 0.026 651 082 446 729 1.00 1.00
Rotary 122.5 15 0.122 477 741 71 523 7.33 8.47 9.47
H10-420 Chiller, rotary, < 600 tons (2110 kW) 32.0 1 0.031 244 650 280 368 1.00 1.63 1.60
H10-410 Chiller, rotary, 600 tons to 1000 tons (2110 kW to 3517 kW)
90.5 14 0.154 754 694 56 606 8.60 8.74 9.79
Screw 649.5 454 0.698 994 807 12 532 7.83 8.12 10.69
H10-510 Chiller, screw, ≤ 300 tons (1055 kW) 499.0 380 0.761 497 960 11 504 5.37 27.44 15.71
H10-520 Chiller, screw, > 300 tons (1055 kW) 150.5 74 0.491 734 634 17 814 23.24 6.37 7.97
Circuit breaker 180 935.2 1437 0.007 942 070 1 102 987 15.11 7.99 11.33 Air 9012.4 93 0.010 319 132 848 909 11.65 73.27 60.16
E12-111 Circuit breaker, air, 3-phase, > 600 V, > 600 A, normally closed (NC)
8885.8 90 0.010 128 467 864 889 11.65 73.27 60.16
E12-112 Circuit breaker, air, 3-phase, > 600 V, > 600 A, normally open (NO)
126.5 3 0.023 707 970 369 496
Fixed (includes molded case) 150 305.9 10 0.000 066 531 31 667 972 25.36 8.29 9.74
E12-211
Circuit breaker, fixed (includes molded case), 3-phase, ≤ 600 V, ≤ 600 A, normally closed (NC)
34 569.2 4 0.000 115 710 75 706 529 23.25 3.09 9.64
20
IEEE Std 3006.8-2018 IEEE Recommended Practice for Analyzing Reliability Data for Equipment Used in Industrial and Commercial Power Systems
E12-212
Circuit breaker, fixed (includes molded case), 3-phase, ≤ 600 V, ≤ 600 A, normally open (NO)
26 607.0 3 0.000 112 752 77 692 576 18.67 8.61 8.73
E12-221
Circuit breaker, fixed (includes molded case), 3-phase, ≤ 600 V, > 600 A, normally closed (NC)
88 546.5 1 0.000 011 294 75 667 016 13.62 13.62
E12-222
Circuit breaker, fixed (includes molded case), 3-phase, ≤ 600 V, > 600 A, normally open (NO)
583.2 2 0.003 429 339 2 554 428 37.50 2.69 3.03
Fixed (molded case) E12-311 Circuit breaker, fixed (molded case), 600 V, single phase, normally closed (NC)
7027.5 1 0.000 142 299 61 560 528 1.00 1.00
Metal clad (drawout) 9529.8 179 0.018 783 250 466 373 9.58 2.12 4.33
E12-411 Circuit breaker, metal clad (drawout), ≤ 600 V, ≤ 600 A, normally closed (NC)
5705.6 18 0.003 154 788 2 776 732 6.50 2.02 2.02
E12-412 Circuit breaker, metal clad (drawout), ≤ 600 V, ≤ 600 A, normally open (NO)
911.2 4 0.004 389 750 1 995 558 6.00 2.93 2.94
E12-421 Circuit breaker, metal clad (drawout), ≤ 600 V, > 600 A, normally closed (NC)
2290.1 153 0.066 809 897 131 118 9.90 2.56 26.74
E12-422 Circuit breaker, metal clad (drawout), ≤ 600 V, > 600 A, normally open (NO)
622.9 4 0.006 421 989 1 364 063 2.00 2.38 2.37
Oil filled 1573.9 640 0.406 641 344 21 542 19.01 28.83 30.54
E12-512 Circuit breaker, oil filled, > 5 kV, normally closed (NC) 1392.3 631 0.453 204 694 19 329 18.98 28.84 30.56
E12-511 Circuit breaker, oil filled, > 5 kV, Normally open (NO) 181.6 9 0.049 569 941 176 720 23.75 8.00 20.60
SF6 filled E12-610 Circuit breaker, SF6 filled, normally closed (NC) 315.2 418 1.326 315 057 6605 12.81 51.03 42.52
Vacuum 3170.7 96 0.030 277 684 289 322 10.71 0.61 2.91
E12-711 Circuit breaker, vacuum, < 15 kV, < 600 A, normally closed (NC)
514.4 3 0.005 832 348 1 501 968 5.33 0.05 0.06
21

IEEE Std 3006.8-2018 IEEE Recommended Practice for Analyzing Reliability Data for Equipment Used in Industrial and Commercial Power Systems
E12-712a Circuit breaker, vacuum, < 15 kV, < 600 A, normally closed (NC)
458.2 0 0.001 512 626 7 870 965 1.84 1.84
E12-721 Circuit breaker, vacuum, < 15 kV, > 600 A, normally closed (NC)
1476.2 65 0.044 031 239 198 950 11.58 2.60 14.89
E12-722 Circuit breaker, vacuum, < 15 kV, > 600 A, normally closed (NC)
716.8 28 0.039 061 903 224 259 9.39 0.35 0.49
E12-730a Circuit breaker, vacuum, > 15 kV 5.0 0 0.138 553 516 85 929
Compressor Refrigerant 1344.2 19 0.014 134 513 619 760 8.69 0.93 1.02
H11-010 Compressor, refrigerant, ≤ 1 ton (3.52 kW) 74.7 2 0.026 780 146 327 108 9.00 1.31 1.53
H11-020 Compressor, refrigerant, > 1 ton (3.52 kW) 1052.0 5 0.004 752 765 1 843 138 3.50 0.91 0.93
H11-100 Compressor, refrigerant, screw 217.5 12 0.055 165 812 158 794 10.83 0.94 1.15 Computer 406.3 100 0.246 142 641 35 589 4.30 4.82 23.48
Control system server C02-200 Computer, control system
server 156.9 94 0.598 997 888 14 624 4.52 4.65 27.62
Personal computer (PC) workstation C02-100 Computer, PC workstation 249.3 6 0.024 063 554 364 036 1.90 5.09 4.09
Condenser 3972.6 305 0.076 775 438 114 099 8.10 2.83 4.91 Double tube H12-100 Condensers, double tube 298.7 8 0.026 781 865 327 087 2.50 2.63 2.63
Propeller type fans/coils H12-200
Condensers, propeller type fans with coils, direct expansion (DX)
2097.2 267 0.127 309 780 68 809 8.18 1.98 4.91
Shell and tube H12-300 Condenser, shell and tube 1576.7 30 0.019 027 462 460 387 9.50 6.86 7.06
Control center Motor/load center C03-100 Control center, motor/load center 1109.4 12 0.010 816 417 809 880 5.03 6.40 6.38
Control panel 6247.8 73 0.011 684 020 749 742 2.86 4.29 4.36
Generator C04-100 Control panel, generator, w/o switchgear 1808.4 30 0.016 589 350 528 050 4.38 0.62 1.45
Heating, ventilation, and air conditioning (HVAC)/chillers/air-handling unit (AHU)
C04-200 Control panel, HVAC/chillers/AHU, w/o switchgear
3841.9 32 0.008 329 286 1 051 711 2.07 1.41 1.45
Switchgear controls C04-300 Control panel, switchgear controls 597.6 11 0.018 407 130 475 903 1.27 7.01 6.96
22
IEEE Std 3006.8-2018 IEEE Recommended Practice for Analyzing Reliability Data for Equipment Used in Industrial and Commercial Power Systems
Control system 605.1 385 0.636 294 482 13 767 5.35 0.92 1.68 ≤ 1000 acquisition points C12-100 Control system, ≤ 1000
acquisition points 384.7 99 0.257 318 645 34 043 1.73 1.26 1.43
> 1000 acquisitionpoints C12-200 Control system, > 1000
acquisition points 220.3 286 1.298 060 184 6749 6.75 0.88 1.72
Convector Fin tube baseboard 6387.9 8 0.001 252 62 6 994 782 2.44 0.13 0.15
H13-110 Convector, fin tube baseboard, electric 1519.8 8 0.005 263 936 1 664 154 2.44 0.33 0.43
H13-120a Convector, fin tube baseboard, steam or hot water 4868.2 0 0.000 142 384 83617694 0.08 0.08
Cooling tower 2063.7 556 0.269 418 665 32514 13.56 1.50 2.24
Atmospheric type (w/o fans) H14-100
Cooling tower, atmospheric type (w/o fans, motors, and internal lift pump)
323.7 24 0.074 137 736 118158 88.92 0.99 1.14
Atmospheric type (with fans) H14-300
Cooling tower, atmospheric type (with fans, motors, and internal lift pump)
1037.4 502 0.483 905 897 18103 8.77 4.34 8.28
Evaporative type (w/o fans) H14-200
Cooling tower, evaporative type (w/o fans, motors, and internal lift pump)
515.3 3 0.005 821 372 1 504 800 16.67 1.44 1.46
Evaporative type (with fans) H14-400
Cooling tower, evaporative type (with fans, motors, and internal lift pump)
187.2 27 0.144 194 894 60 751 6.25 3.83 4.78
Damper assembly 18 711.9 74 0.003 954 699 2 215 086 23.10 0.07 0.65
Motor operated H15-100 Damper assembly, motor operated 15 793.2 48 0.003 039 287 2 882 255 28.73 0.07 0.54
Pneumatically operated H15-200 Damper assembly
pneumatically operated 2918.7 26 0.008 907 946 983 392 11.83 4.00 59.87
Dehumidifier > 10 lb/h(4.54 kg/h) H16-100 Dehumidifier, > 4.54 kg/h (10
lb/h) 98.3 68 0.691 808 122 12 662 16.26 17.27 32.31
Direct fired furnace 1301.1 404 0.310 517 283 28 211 3.64 13.86 23.35
≤ 500 MB/h H17-100 Direct fired furnace, ≤ 500 MBH (147 kW) 161.4 6 0.037 173 459 235 652 0.83 3.33 3.82
> 500 MB/h H17-200 Direct fired furnace, >500 MBH (147 kW) 1139.6 398 0.349 230 237 25 084 3.67 15.69 24.90
Distribution panel 7939.1 31 0.003 904 724 2 243 436 20.86 3.4 11.70
23
IEEE Std 3006.8-2018 IEEE Recommended Practice for Analyzing Reliability Data for Equipment Used in Industrial and Commercial Power Systems
≤ 225 A E13-100 Distribution panel, ≤ 225 A, circuit breakers, not included (wall mount unit)
6552.6 25 0.003 815 271 2 296 036 22.69 1.41 10.90
> 225 A E13-200 Distribution panel, > 225 A, circuit breakers, not included (wall mount unit)
1386.5 6 0.004 327 482 2 024 272 16.00 10.06 14.34
Drive 4534.9 169 0.037 266 634 235 063 13.08 2.15 14.04 Adjustable speed E14-100 Drive, adjustable speed 3158.4 96 0.030 395 480 288 201 15.51 3.45 22.10 Variable frequency E14-200 Drive, variable frequency 1376.5 73 0.053 032 158 165 183 9.07 1.28 7.59
Engine 1245.6 2007 1.611 246 868 5437 1.36 2.87 2.71 Diesel E15-100 Engine, diesel 207.2 134 0.646 760 906 13 544 9.64 3.27 4.11 Gas E15-200 Engine, gas 1038.4 1873 1.803 679 412 4857 1.00 0.75 0.94
Evaporator Coil 8150.2 40 0.004 907 850 1 784 896 13.03 0.27 0.29
H18-100 Evaporator, direct expansion, coil 7114.1 31 0.004 357 533 2 010 312 14.55 0.27 0.29
H18-120 Evaporator, direct expansion, shell tube 1036.1 9 0.008 686 501 1 008 461 5.17 0.28 0.30
Fan 19 708.4 1549 0.078 595 830 111 456 10.70 2.09 3.71 Centrifugal H19-100 Fan, centrifugal 11 895.7 577 0.048 504 894 180 600 10.51 1.71 3.57 Propeller/disc H19-200 Fan, propeller/disc 3857.7 649 0.168 236 811 52 069 10.88 2.09 4.37 Tubeaxial H19-300 Fan, tubeaxial 2244.8 69 0.030 737 667 284 992 5.51 4.04 4.09 Vaneaxial H19-400 Fan, vaneaxial 1710.3 254 0.148 515 645 58 984 14.24 1.10 1.61
Filter 5796.7 33 0.005 692 936 1 538 749 11.66 0.30 0.36 Electrical E16-200a Filter, electrical, tempest 342.1 0 0.002 026 405 5 875 341 Mechanical 5454.6 33 0.006 049 940 1 447 948 11.66 0.30 0.36
H20-100 Filter, mechanical, air regulator set 3314.5 22 0.006 637 450 1 319 784 15.33 0.05 0.08
H20-200a Filter, mechanical, fuel oil 743.2 0 0.000 932 659 12 765 459 0.49 0.49 H20-300 Filter, mechanical, lube oil 1396.9 11 0.007 874 695 1 112 424 3.95 1.47 1.72
Fuse 10 226.0 483 0.047 232 405 185 466 4.00 4.00 > 15 kV E17-300 Fuse, > 15 kV 4756.7 483 0.101 541 423 86 270 4.00 4.00 > 5 kV ≤ 15 kV E17-200a Fuse, > 5 kV ≤ 15 kV 3590.5 0 0.000 193 050 61 672 329 0 kV to 5 kV E17-100a Fuse, 0 kV to 5 kV 1878.8 0 0.000 368 923 32 271 812
Gauge Fluid level C05-100 Gauge, fluid level 830.2 4 0.004 817 989 1 818 186 3.31 7.13 6.04 Generator 4538.6 2283 0.503 018 519 17 415 23.24 2.93 3.93
24
IEEE Std 3006.8-2018 IEEE Recommended Practice for Analyzing Reliability Data for Equipment Used in Industrial and Commercial Power Systems
Diesel engine 3045.1 1305 0.428 550 581 20 441 19.29 2.02 3.08
E18-111 Generator, diesel engine, packaged, < 250 kW, continuous
15.0 16 1.063 558 550 8 237
E18-112 Generator, diesel engine, packaged, < 250 kW, standby 857.8 281 0.327 590 557 26 741 12.24 1.69 4.88
E18-121 Generator, diesel engine, packaged, 250 kW to 1.5 MW, continuous
266.0 155 0.582 686 262 15 034 25.74 0.52 1.15
E18-122 Generator, diesel engine, packaged, 250 kW to 1.5 MW, standby
1439.8 358 0.248 652 553 35 230 12.95 1.72 2.63
E18-211 Generator, diesel engine, unpackaged, 750 kW to 7 MW, continuous
180.6 328 1.815 727 611 4825 25.08 3.86 5.00
E18-212 Generator, diesel engine, unpackaged, 750 kW to 7 MW, standby
285.9 167 0.584 093 735 14 998 23.91 2.57 3.11
Gas turbine 983.7 485 0.493 016 528 17 768 25.05 2.39 2.72
E19-111 Generator, gas turbine, packaged, 750 kW to 7 MW, continuous
185.5 295 1.590 684 138 5507 27.31 0.83 1.23
E19-112 Generator, gas turbine, packaged, 750 kW to 7 MW, standby
612.4 113 0.184 526 491 47 473 6.05 4.40 4.42
E19-211 Generator, gas turbine, unpackaged, 750 kW to 7 MW, continuous
185.9 77 0.414 185 923 21 150 50.33 13.26 15.87
Hydro turbine E20-000 Generator, hydro turbine 90.4 27 0.298 790 286 29 318 78.36 238.44 310.21 Natural gas 281.4 250 0.888 285 342 9862 5.87 139.75 64.13
E21-110 Generator, natural gas, < 250 kW, continuous 7.4 5 0.674 926 036 12 979 1.50 1.50
E21-120 Generator, natural gas, < 250 kW, standby 222.4 31 0.139 419 404 62 832 6.33 32.87 34.60
e21-210 generator, natural gas, ≥ 250 kW, continuous 51.7 214 4.140 691 264 2116 191.73 71.13
Steam E23-000 Generator, steam, heat recovery 20.5 86 4.185 891 452 2093 162.40 45.84 Steam turbine E22-000 Generator, steam turbine 117.4 130 1.107 687 280 7908 100.59 288.24 263.61
Heat exchanger 4858.5 272 0.055 984 436 156 472 10.81 1.11 1.74
25
IEEE Std 3006.8-2018 IEEE Recommended Practice for Analyzing Reliability Data for Equipment Used in Industrial and Commercial Power Systems
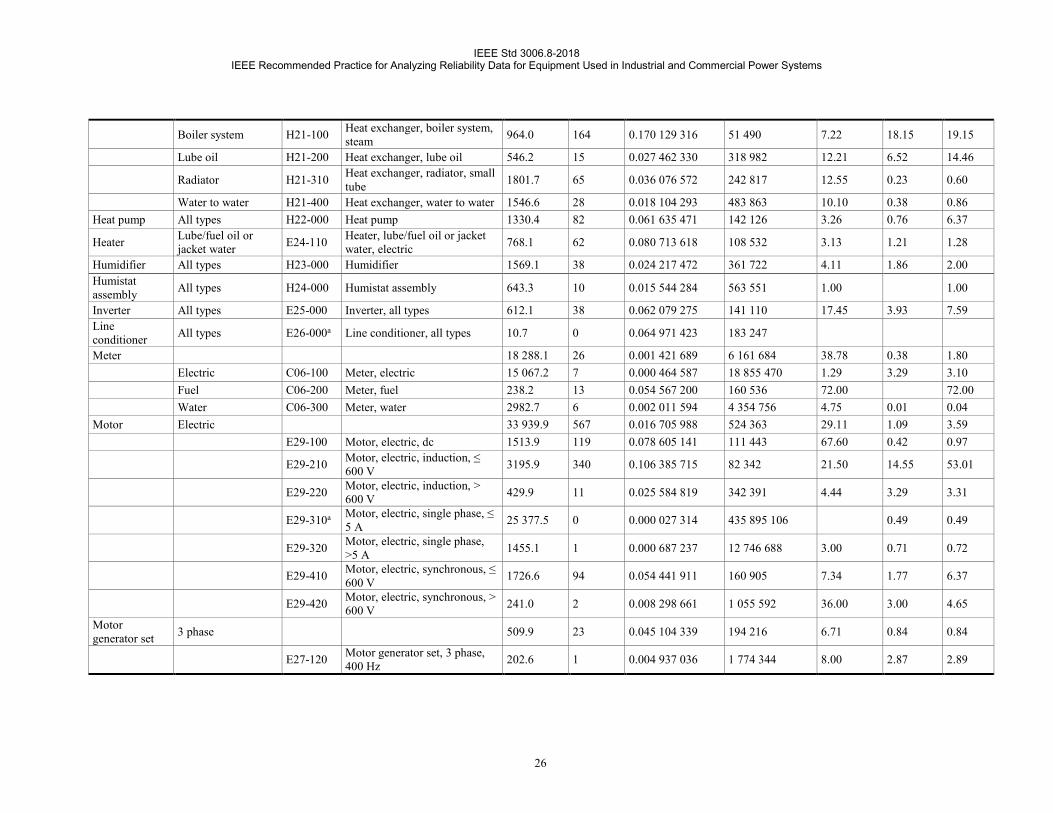
Boiler system H21-100 Heat exchanger, boiler system, steam 964.0 164 0.170 129 316 51 490 7.22 18.15 19.15
Lube oil H21-200 Heat exchanger, lube oil 546.2 15 0.027 462 330 318 982 12.21 6.52 14.46
Radiator H21-310 Heat exchanger, radiator, small tube 1801.7 65 0.036 076 572 242 817 12.55 0.23 0.60
Water to water H21-400 Heat exchanger, water to water 1546.6 28 0.018 104 293 483 863 10.10 0.38 0.86 Heat pump All types H22-000 Heat pump 1330.4 82 0.061 635 471 142 126 3.26 0.76 6.37
Heater Lube/fuel oil or jacket water E24-110 Heater, lube/fuel oil or jacket
water, electric 768.1 62 0.080 713 618 108 532 3.13 1.21 1.28
Humidifier All types H23-000 Humidifier 1569.1 38 0.024 217 472 361 722 4.11 1.86 2.00 Humistat assembly All types H24-000 Humistat assembly 643.3 10 0.015 544 284 563 551 1.00 1.00
Inverter All types E25-000 Inverter, all types 612.1 38 0.062 079 275 141 110 17.45 3.93 7.59 Line conditioner All types E26-000a Line conditioner, all types 10.7 0 0.064 971 423 183 247
Meter 18 288.1 26 0.001 421 689 6 161 684 38.78 0.38 1.80 Electric C06-100 Meter, electric 15 067.2 7 0.000 464 587 18 855 470 1.29 3.29 3.10 Fuel C06-200 Meter, fuel 238.2 13 0.054 567 200 160 536 72.00 72.00 Water C06-300 Meter, water 2982.7 6 0.002 011 594 4 354 756 4.75 0.01 0.04
Motor Electric 33 939.9 567 0.016 705 988 524 363 29.11 1.09 3.59 E29-100 Motor, electric, dc 1513.9 119 0.078 605 141 111 443 67.60 0.42 0.97
E29-210 Motor, electric, induction, ≤ 600 V 3195.9 340 0.106 385 715 82 342 21.50 14.55 53.01
E29-220 Motor, electric, induction, > 600 V 429.9 11 0.025 584 819 342 391 4.44 3.29 3.31
E29-310a Motor, electric, single phase, ≤ 5 A 25 377.5 0 0.000 027 314 435 895 106 0.49 0.49
E29-320 Motor, electric, single phase, >5 A 1455.1 1 0.000 687 237 12 746 688 3.00 0.71 0.72
E29-410 Motor, electric, synchronous, ≤ 600 V 1726.6 94 0.054 441 911 160 905 7.34 1.77 6.37
E29-420 Motor, electric, synchronous, > 600 V 241.0 2 0.008 298 661 1 055 592 36.00 3.00 4.65
Motor generator set 3 phase 509.9 23 0.045 104 339 194 216 6.71 0.84 0.84
E27-120 Motor generator set, 3 phase, 400 Hz 202.6 1 0.004 937 036 1 774 344 8.00 2.87 2.89
26

IEEE Std 3006.8-2018 IEEE Recommended Practice for Analyzing Reliability Data for Equipment Used in Industrial and Commercial Power Systems
E27-110 Motor generator set, 3 phase, 60 Hz 307.4 22 0.071 573 093 122 392 6.62 0.82 0.83
Motor starter 4056.8 33 0.008 134 545 1 076 889 4.33 0.62 1.34 ≤ 600 V E28-100 Motor starter, ≤ 600 V 3505.6 28 0.007 987 258 1 096 747 3.37 0.72 1.66 > 600 V E28-200 Motor starter, > 600 V 551.2 5 0.009 071 298 965 683 9.15 0.48 0.87
Network hub 234.0 2 0.008 545 408 1 025 112 2.75 2.75 Ethernet C07-100 Network hub, Ethernet 229.0 2 0.008 732 057 1 003 200 2.75 2.75 Fiber-optic C07-200a Network hub, fiber-optic 5.0 0 0.138 553 516 85 929
Network printer 13 311.4 4682 0.351 727 580 24 906 1.69 1.55 3.29 Inkjet NWP-100 Network printer, inkjet 1260.0 670 0.531 744 876 16 474 1.74 1.78 5.57 Laser NWP-200 Network printer, laser 12 051.4 4012 0.332 906 396 26 314 1.68 1.50 2.87
Oil cooler All types E30-000 Oil cooler 92.9 3 0.032 302 791 271 184 13.25 0.50 2.20 Pipe 14 886.9 22 0.001 477 814 5 927 674 8.38 7.72 7.72
Flex 1818.8 10 0.005 498 167 1 593 258 3.38 4.00 3.50
H25-112 Pipe, flex, non-reinforced, > 100 mm (4 in) 206.3 3 0.014 544 485 602 290 3.33 4.00 3.60
H25-111 Pipe, flex, reinforced, < 100 mm (4 in) 273.8 3 0.010 957 670 799 440 8.00 8.00
H25-122 Pipe, flex, reinforced, > 100 mm (4 in) 1338.7 4 0.002 987 876 2 931 848 2.25 2.25
Refrigerant 11 221.0 6 0.000 534 713 16 382 612 9.33 3.06 3.20
H25-310 Pipe, refrigerant, < 25 mm per 30.5 m (1 in per 100 ft) 7913.6 3 0.000 379 094 23 107 704 10.67 2.00 2.11
H25-320 Pipe, refrigerant, 25 mm to 80 mm per 30.5 m (1 in to 3 in per 100 ft)
3307.4 3 0.000 907 065 9 657 520 8.00 8.78 8.73
Water 1847.1 6 0.003 248 338 2 696 764 14.08 8.00 8.01
H25-410a Pipe, water, ≤ 50 mm per 30.5 m (2 in per 100 ft) 462.5 0 0.001 498 852 7 943 294
H25-450a Pipe, water, > 300 mm per 30.5 m (12 in per 100 ft) 8.2 0 0.084 984 454 140 094
H25-420 Pipe, water, 50 mm to 100 mm per 30.5 m (2 in to ≤ 4 in per 100 ft)
292.3 6 0.020 530 031 426 692 14.08 14.08
H25-430a Pipe, water, 100 mm to 200 mm per 30.5 m (4 in to 8 in per 100 ft)
268.7 0 0.002 579 961 4 614 729
27

IEEE Std 3006.8-2018 IEEE Recommended Practice for Analyzing Reliability Data for Equipment Used in Industrial and Commercial Power Systems
H25-440a Pipe, water, 200 mm to 300 mm per 30.5 m (8 in to 12 in per 100 ft)
815.6 0 0.000 849 893 14 008 612 8.00 8.00
Pressure control assembly
All types C08-000 Pressure control assembly 896.3 82 0.091 485 687 95 753 8.10 3.53 4.08
Pressure regulator Hot gas C09-100 Pressure regulator, hot gas 2711.4 29 0.010695434 819 041 2.94 1.68 19.52
Programmable logic controller All types C10-000 Programmable logic controller
(PLC) 203.9 6 0.029 422 829 297 728 23.50 2.00 73.27
Pump 25 386.6 3097 0.121 993 479 71 807 11.83 1.75 6.24 Centrifugal 23 888.4 2917 0.122 109 700 71 739 11.91 1.92 6.47
H26-110 Pump, centrifugal, with drive 21 835.4 2655 0.121 591 798 72 045 11.95 2.21 7.95 H26-120 Pump, centrifugal, w/o drive 2052.9 262 0.127 621 356 68 641 11.28 1.04 1.52
Positive displacement H26-200 Pump, positive displacement 1498.2 180 0.120 140 438 72 915 7.91 0.70 4.74
Recloser (interrupter) 8368.5 85 0.010 157 168 862 445 5.00 6.02 5.97
Electronic E31-100 Recloser (interrupter), electronic 1949.4 13 0.006 668 840 1 313 572
Hydraulic E31-200 Recloser (interrupter), hydraulic 2939.1 58 0.019 734 144 443 901 8.00 8.00
Undefined type E31-099a Recloser (interrupter), undefined type 3480.0 14 0.004 022 941 2 177 511 5.00 5.00 5.00
Rectifiers All types E32-000 Rectifiers, all types 563.4 2 0.003 549 686 2 467 824 16.00 3.45 3.47 Relay Electromechanical 5307.4 5 0.000 942 089 9 298 488 26.33 3.63 3.70
E33-110 Relay, electromechanical, differential, differential voltage 828.1 2 0.002 415 059 3 627 240 35.50 4.28 4.51
E33-120a Relay, electromechanical, drawout 790.4 0 0.000 876 976 13 576 000
E33-130 Relay, electromechanical, overcurrent 3688.8 3 0.000 813 265 10 771 400 8.00 3.35 3.36
Router Wired RTR-100 Router, wired 2763.5 262 0.094 806 605 92 399 2.14 1.13 3.37 Sending unit 43 914.1 171 0.003 893 968 2 249 633 6.39 0.07 1.56
Air velocity C13-100 Sending unit, air velocity 7492.2 47 0.006 273 186 1 396 420 6.96 0.04 1.30 Pressure C13-200 Sending unit, pressure 7565.9 95 0.012 556 363 697 654 5.82 0.10 2.22 Temperature C13-300 Sending unit, temperature 28 856.0 29 0.001 004 991 8 716 496 0.25 0.39
Server 8145.9 540 0.066 290 672 132 145 3.02 1.00 2.41
28

IEEE Std 3006.8-2018 IEEE Recommended Practice for Analyzing Reliability Data for Equipment Used in Industrial and Commercial Power Systems
Blade SVR-100 Server, blade 526.0 25 0.047 528 517 18 310 2.68 0.70 2.29 Rack mount SVR-200 Server, rack mount 6323.2 387 0.061 203 480 143 129 3.02 0.98 2.38 Tower case SVR-300 Server, tower case 1296.8 128 0.0987 065 589 88 748 3.08 1.09 2.49
Strainer 9788.4 88 0.008 990 193 974 395 16.96 0.35 0.62
Air or gaseous H27-110 Strainer, air or gaseous, air systems 304.2 1 0.003 287 222 266 4864
Liquid 9484.2 87 0.009 173 117 954 964 16.96 0.35 0.62 H27-210a Strainer, liquid, coolant 488.2 0 0.001 419 921 8 384 847 1.62 1.62 H27-220a Strainer, duplex fuel/lube oil 280.2 0 0.002 473 565 4 813 224 0.86 0.86 H27-230a Strainer, liquid, fuel oil 460.4 0 0.001 505 416 7 908 659 1.67 1.67 H27-240 Strainer, liquid, lube oil 1161.2 25 0.021 528 741 406 898 14.29 1.85 4.12
H27-251 Strainer, water, ≤ 100 mm (4 in) 6466.1 25 0.003 866 327 2 265 716 2.25 0.00 0.00
H27-252 Strainer, water, > 100 mm (4 in) 628.1 37 0.058 908 203 148 706 25.58 4.03 8.99
Switch 36 667.8 385 0.010 499 665 834 312 8.63 2.01 7.08 Automatic transfer 2883.7 101 0.035 024 398 250 111 7.89 2.40 2.96
E34-110 Switch, automatic transfer, ≤ 600 V, > 600 A 1030.8 27 0.026 193 875 334 429 2.66 8.98 8.32
E34-120 Switch, automatic transfer, ≤ 600 V, 0 A to 600 A 1852.9 74 0.039 936 775 219 347 9.90 1.82 2.42
Disconnect 19 349.5 23 0.001 188 660 7 369 646 17.83 1.75 1.90
E34-211 Switch, disconnect, enclosed, ≤ 600 V 8372.7 6 0.000 716 616 12 224 124 2.09 2.09
E34-212 Switch, disconnect, enclosed, > 600 V to ≤ 5 kV 2238.8 2 0.000 893 351 9 805 776 46.00 3.03 3.38
E34-213 Switch, disconnect, enclosed, > 5 kV 2091.2 15 0.007 172 820 1 221 277 15.82 2.08 2.86
E34-222a Switch, disconnect, fused, dc, > 600 A; ≤ 600 V 861.5 0 0.000 804 591 14 797 365
E34-221a Switch, disconnect, fused, dc, ≤ 600 A; ≤ 600 V 5785.4 0 0.000 119 811 99 372 047 0.54 0.54
Electric E34-310 Switch, electric, on/off breaker type, non-knife, ≤ 600 V 3115.2 2 0.000 642 008 13 644 684 1.00 0.01 0.01
Float E34-400 Switch, float, electric 2513.6 87 0.034 611 071 253 098 9.84 0.91 22.86 Manual transfer 640.4 0 0.001 082 408 10 999 388
29

IEEE Std 3006.8-2018 IEEE Recommended Practice for Analyzing Reliability Data for Equipment Used in Industrial and Commercial Power Systems
E34-510a Switch, manual transfer, ≤ 600 V, ≤ 600 A 266.6 0 0.002 599 818 4 579 482
E34-520a Switch, manual transfer, ≤ 600 V, > 600 A 373.8 0 0.001 854 517 6 419 906
Oil filled E34-610a Switch, oil filled, ≥ 5 kV 300.2 0 0.002 308 614 5 157 129 1.38 1.38 Pressure E34-700 Switch, pressure 6661.0 169 0.025 371 639 345 267 7.04 3.08 16.89 Static 921.5 2 0.002 170 468 4 035 996 13.00 2.04 2.11
E34-810a Switch, static, ≤ 600 V, 0 A to 600 A 498.4 0 0.001 390 875 8 559 953 0.03 0.03
E34-820 Switch, static, ≤ 600 V, > 600 A ≤ 1000 A 130.0 1 0.007 692 794 1 138 728 2.00 0.05 0.08
E34-830 Switch, static, ≤ 600 V, > 1000 A 271.7 1 0.003 680 066 2 380 392 24.00 3.47 3.58
E34-850a Switch, static, with insulated-gate bipolar transistor (IGBT) technology
15.3 0 0.045 210 636 26 3341
E34-860a Switch, static, w/o IGBT technology 6.0 0 0.114 582 754 103 906
Vibration E34-900 Switch, vibration 282.7 1 0.003 537 644 2 476 224 0.50 0.50 Switchgear 6747.6 47 0.006 965 393 1 257 646 24.32 3.35 3.56
Bare bus 4229.7 42 0.009 929 718 882 200 24.31 3.64 3.94
E36-110 Switchgear, bare bus, ≤ 600 V (circuit breaker not included) 2493.6 23 0.009 223 683 949 729 7.91 4.28 4.35
E36-130 Switchgear, bare bus, > 5 kV (circuit breaker not included) 895.7 15 0.016 746 168 523 105 2.27 1.28 1.30
E36-120 Switchgear, bare bus, > 600 V to ≤ 5 kV (circuit breaker not included)
840.4 4 0.004 759 530 1 840 518 195.75 6.59 9.67
Insulated bus 1713.6 5 0.002 917 820 3 002 242 24.40 2.90 2.97
E36-210a Switchgear, insulated bus, ≤ 600 V (circuit breaker not included)
505.2 0 0.001 372 077 8 677 224 3.18 3.18
E36-220 Switchgear, insulated bus, > 600 V to ≤ 5 kV (circuit breaker not included)
405.8 2 0.004 928 902 1 777 272 5.00 0.77 0.78
E36-230 Switchgear, insulated bus, > 5 kV (circuit breaker not included)
802.7 3 0.003 737 584 2 343 760 37.33 14.01 14.43
30

IEEE Std 3006.8-2018 IEEE Recommended Practice for Analyzing Reliability Data for Equipment Used in Industrial and Commercial Power Systems
Load center (free standing unit) E36-300a Switchgear, load center (free
standing unit) 804.3 0 0.000 861 792 13 815 200 0.59 0.59
Tank 4876.1 137 0.028 096 327 311 785 18.02 1.11 3.10 Air E37-110 Tank, air, receiver 1519.1 22 0.014 482 011 604 888 11.53 1.25 1.63 Liquid 3357.0 115 0.034 257 224 255 712 18.99 0.88 5.31
E37-210 Tank, liquid, day, fuel 484.8 2 0.004 125 040 2 123 616 5.00 0.31 0.35 E37-220 Tank, liquid, fuel 614.7 21 0.034 162 930 256 418 13.80 1.28 2.52 E37-230 Tank, liquid, water 2257.4 92 0.040 754 653 214 945 20.57 0.91 7.23
Thermocouple All types C14-000 Thermocouple 5761.5 101 0.017 530 270 499 707 13.48 14.00 479.86 Thermostat Radiator C15-100 Thermostat, radiator 8735.0 153 0.017 515 835 500 119 3.16 1.13 2.00 Transducer 26 305.4 81 0.003 079 211 2 844 885 3.74 0.06 0.09
Flow C16-100 Transducer, flow 1188.0 5 0.004 208 706 2 081 400 2.00 1.17 1.18 Pressure C16-200 Transducer, pressure 2139.0 28 0.013 090 212 669 202 7.50 2.28 3.07 Temperature C16-300 Transducer, temperature 22 978.4 48 0.002 088 916 4 193 563 1.89 0.02 0.03
Transformer 164 239.4 456 0.002 776 435 3 155 125 14.92 10.83 11.43 Dry 96 735.4 248 0.002 563 695 3 416 944 3.63 2.77 3.40
E38-111 Transformer, dry, air cooled, ≤ 500 kVA 86095.4 226 0.002 624 996 3 337 148 2.13 2.36 2.33
E38-112 Transformer, dry, air cooled, > 500 kVA ≤ 1500 kVA 1700.3 3 0.001 764 436 4 964 760 2.00 5.41 36.50
E38-113a Transformer, dry, air cooled, > 1500 kVA ≤ 3000 kVA 999.7 0 0.000 693 337 17 171 772 4.39 4.39
E38-114a Transformer, dry, air cooled, > 3000 kVA ≤ 5000 kVA 1142.2 0 0.000 606 854 19 618 918 5.50 5.50
E38-121 Transformer, dry, isolation, delta wye, < 600 V 6797.8 19 0.002 795 011 3 134 156 21.26 0.93 2.52
Liquid 67 504.0 208 0.00 3081 299 2 842 957 36.89 13.29 14.16
E38-211 Transformer, liquid, forced air, ≤ 5000 kVA 5849.5 52 0.008 889 630 985 418 8.69 0.98 2.08
E38-212 Transformer, liquid, forced air, > 5000 kVA ≤ 10 000 600.6 23 0.038 292 418 228 766 251.00 22.96 23.60
E38-213 Transformer, liquid, forced air, >10 000 kVA ≤ 50 000 kVA 482.1 34 0.070 518 976 124 222 965.33 21.69 24.34
E38-214 Transformer, liquid, forced air, > 50 000 18.6 24 1.289 752 650 6792 11.95 2.43 5.30
E38-221 Transformer, liquid, non-forced air, ≤ 3000 kVA 59 708.0 63 0.001 055 134 8 302 262 2.33 2.00 2.02
31

IEEE Std 3006.8-2018 IEEE Recommended Practice for Analyzing Reliability Data for Equipment Used in Industrial and Commercial Power Systems
E38-222 Transformer, liquid, non-forced air, > 3000 kVA ≤ 10 000 kVA 190.7 1 0.005 242 671 1 670 904 1.00 2.67 2.50
E38-223 Transformer, liquid, non-forced air, > 10 000 kVA ≤ 50 000 kVA
654.3 11 0.016 811 614 521 068 6.09 0.58 0.65
UPS 1232.8 65 0.052 726 440 166 141 5.24 2.08 6.48
Rotary E39-100 Uninterruptible power supply (UPS), rotary 134.7 2 0.014 848 263 589 968 8.75 6.11 7.81
Small computer room floor E39-200
Uninterruptible power supply (UPS), small computer room floor
724.7 41 0.056 575 669 154 837 6.25 2.12 3.74
Solid state 373.4 22 0.058 919 780 148 677 2.93 1.14 11.44
E39-310 Uninterruptible power supply (UPS), solid state, 60 Hz/module
357.3 22 0.061 578 810 142 257 2.93 1.09 13.83
E39-320a Uninterruptible power supply (UPS), solid state, with IGBT technology
16.1 0 0.042 990 437 276 941 1.30 1.30
Valve 157 135.7 1345 0.008 559 481 1 023 427 11.94 2.62 8.08 3-way 16 490.6 7 0.000 424 484 20 636 822 5.86 0.52 0.81
H28-110 Valve, 3-way, diverting/sequencing 736.9 4 0.005 428 034 1 613 844 9.13 0.02 0.59
H28-120 Valve, 3-way, mixing control 15 753.7 3 0.000 190 432 46 000 792 1.50 1.02 1.03 Backflow preventer H28-200 Valve, backflow preventer 742.6 30 0.040 401 283 216 825 13.27 1.11 15.63 Ball 2703.6 5 0.001 849 362 4 736 770 1.20 0.19 0.24
H28-310a Valve, ball, normally closed (NC) 1092.7 0 0.000 634 368 18 768 000 0.19 0.19
H28-320 Valve, ball, normally open (NO) 1611.0 5 0.003 103 705 2 822 434 1.20 1.20
Butterfly 18 225.8 26 0.001 426 553 6 140 677 3.88 0.55 0.67
H28-410 Valve, butterfly, normally closed (NC) 2809.7 26 0.009 253 770 946 641 3.88 1.01 1.67
H28-420a Valve, butterfly, normally open (NO) 15 416.1 0 0.000 044 963 64 793 976 0.48 0.48
Check H28-500 Valve, check 4699.2 44 0.009 363 323 935 565 26.69 1.11 8.60 Control 22 796.4 647 0.028 381 678 308 650 17.32 0.50 15.34
H28-610 Valve, control, normally closed (NC) 17 563.1 388 0.022 091 808 396 527 17.76 0.23 8.54
32

IEEE Std 3006.8-2018 IEEE Recommended Practice for Analyzing Reliability Data for Equipment Used in Industrial and Commercial Power Systems
H28-620 Valve, control, normally open (NO) 5233.3 259 0.049 490 515 177 004 16.93 1.56 38.85
Expansion H28-700a Valve, expansion 1984.1 0 0.000 349 348 34 080 094 Gate 19 302.5 97 0.005 025 268 1 743 191 10.45 0.81 33.26
H28-830 Valve, gate, double flap 173.2 76 0.438 785 195 19 964 10.67 10.67
H28-810 Valve, gate, normally closed (NC) 1830.5 8 0.004 370 485 2 004 354 7.50 0.59 0.99
H28-820 Valve, gate, normally open (NO) 17 298.8 13 0.000 751 498 11 656 721 9.31 1.30 150.13
Globe 41 402.3 66 0.001 594 112 5 495 221 16.65 1.00 1.74
H28-910a Valve, globe, normally closed (NC) 22 125.4 0 0.000 031 328 80 035 718 1.00 1.00
H28-920 Valve, globe, normally open (NO) 19 277.0 66 0.003 423 773 2 558 581 16.65 0.40 129.72
Plug 15 233.3 148 0.009 715 539 901 648 1.81 0.05 1.59
H28-A10 Valve, plug, normally closed (NC) 8845.9 123 0.013 904 727 630 002 1.37 0.05 1.17
H28-A20 Valve, plug, normally open (NO) 6387.4 25 0.003 913 946 2 238 151 4.00 4.00
Reducing H28-B10 Valve, reducing, makeup water 701.9 100 0.142 473 496 61 485 5.56 0.59 17.99 Relief H28-C00 Valve, relief 10 598.4 165 0.015 568 452 562 676 7.55 102.91 137.61 Suction H28-D00 Valve, suction 2255.1 10 0.004 434 439 1 975 447 7.25 0.61 0.77
Valve operator 10 025.1 80 0.007 980 004 1 097 744 10.02 1.06 1.47 Electric C17-100 Valve operator, electric 3684.0 43 0.011 672 052 750 511 16.42 0.98 1.40 Hydraulic C17-200 Valve operator, hydraulic 68.2 6 0.087 937 681 99 616 3.00 2.16 2.20 Pneumatic C17-300 Valve operator, pneumatic 6272.8 31 0.004 941 961 1 772 576 2.92 0.98 1.76
Voltage regulator Static E40-100 Voltage regulator, static 3381.5 77 0.022 771 080 384 698 15.73 0.53 2.23
Water cooling coil Fan coil unit H29-100 Water cooling coil, fan coil unit 16 076.0 96 0.005 971 646 1 466 932 3.72 2.04 2.09
Water heater Domestic hot water 1399.8 44 0.031 431 955 278 697 6.37 1.28 12.85
H30-110 Water heater, domestic hot water, electric 957.5 19 0.019 843 370 441 457 9.64 0.82 29.64
H30-130 Water heater, domestic hot water, gas 442.4 25 0.056 516 246 155 000 3.53 1.35 9.11
Workstation All types WST-000 Workstation 169 635.1 7948 0.046 853 516 186 966 0.73 0.62 1.11 a Failure rate calculated using 50% single-sided confidence interval.Part 2: Equipment reliability surveys conducted between 1976 and 1994.
33

IEEE Std 3006.8-2018 IEEE Recommended Practice for Analyzing Reliability Data for Equipment Used in Industrial and Commercial Power
Systems
5.3 Introduction
Clause 6 presents data derived from a series of electrical equipment surveys for specific types of equipment according to Table 3.
Table 3 —Part 2 equipment reliability table reference guide
Electrical equipment types Reference tables in Part 2: survey data from 1976 to 1989
Motors
> 50 hp (37.3 kW) Table 23, Table 25
> 200 hp (149 kW) Table 16, Table 17, Table 18, Table 19, Table 20, Table 21, Table 22
> 250 hp (187 kW) Table 26 Generators Table 5
Transformers Power Table 6, Table 8, Table 9, Table 10, Table 11,
Table 12, Table 13, Table 14
Rectifier Table 7, Table 9, Table 10, Table 11, Table 12, Table 13, Table 15
Switchgear Bus insulated Table 4
Bus bare Table 4
5.4 1979 switchgear bus reliability data
The reliability of switchgear bus in industrial and commercial applications was investigated in a 1979 survey (see O’Donnell [B29] and Historical Reliability Data for IEEE 3006 Standards: Power System Reliability, page 100) and the summarized failure rate and median outage duration time for the various subcategories of equipment are shown in Table 4. In this survey, the term units for a bus is defined as the total number of connected circuit breakers and connected switches. In the previous survey of 1974, the term units included the total number of connected circuit breakers or instrument transformer compartments. The total number of plants in the 1979 survey response was considerably greater than the 1974 survey; however the unit-year sample size was slightly less.
Table 4 —Switchgear bus, indoor and outdoor 1979 survey data
Industry Equipment subclass Failure rate (failures per unit-year)
Median hours down time per failure
All All 0.001 050 28 All Insulated, above 600 V 0.001 129 28 All Bare, all voltages 0.000 977 28 All Bare, 0 V to 600 V 0.000 802 27 All Bare, above 600 V 0.001 917 36 Petroleum/chemical Insulated, above 600 V 0.002 020 40 Petroleum/chemical Bare, all voltages 0.002 570 28 Petroleum/chemical Bare, 0 V to 600 V 0.002 761 22 Petroleum/chemical Bare, above 600 V a 48 a Small sample size; fewer than eight failures.
The 1974 survey generated some controversy concerning bare and insulated buses; insulated bus equipment showed a significantly higher failure rate than bare bus above 600 V. An analysis of the 1974 database revealed that the majority of the data collected came from the petroleum/chemical industry. In the 1979
34

IEEE Std 3006.8-2018 IEEE Recommended Practice for Analyzing Reliability Data for Equipment Used in Industrial and Commercial Power
Systems
survey, the petroleum/chemical industry data was separated from the remaining industrial database. The resulting bare bus failure rate was significantly higher and the insulated bus failure rate lower in the 1979 survey than in the 1974 survey.
A comparison of the median downtime per failure in both surveys revealed no significant differences. It is important to emphasize that the duration of an outage is dependent on many factors, and without supplementary information on the operating procedures, maintenance type, spare parts inventory, etc., the data in these surveys should be viewed as general information.
Some important additional observations based on the 1979 survey are as follows:
a) Newer bus appears to experience a higher failure rate than older bus. This may be partly explainedby improper installation, type of construction of new switchgear, etc., but is not completelyconsistent with the observation that failure rates are highly dependent on maintenance.
b) Outdoor bus shows a higher failure rate than indoor bus.
c) Primary and contributing causes of failures were investigated. Inadequate maintenance was one ofthe leading “suspected primary causes of failure” and exposure to contaminants (including dust,moisture, and chemicals) was the leading “contributing cause to failure.” This tends to support thedata showing outdoor bus with a relatively high failure rate.
d) The survey results on type of failures show a surprisingly high percentage of line-to-line failures,rather than line-to-ground.
5.5 1980 generator survey data
5.5.1 Introduction
The results of the 1980 generator survey data (see IEEE Committee Report [B12]) are summarized in Table 5. A unit in this survey was defined to include the generator’s driver and its ancillary equipment, includingthe device from which the generator’s output is made available to the “outside” world. The term unit-yearwas defined as the summation of the running times reported for each generator.
Table 5 —Generator survey data, 1980
Equipment subclass Average downtime per failure (h) Failure rate
Continuous service steam turbine driven 32.7 0.16 900 failures per unit-year
Emergency and standby units reciprocating engines driven 478.0 0.00 536 failures per hour in use
Reciprocating engines driven a 0.01 350 failures per start attempt a Small sample size; fewer than eight failures.
Two major categories (i.e., continuously applied units and emergency or standby applied units) emerged from an evaluation of the responses. All of the continuous units were steam turbine driven, and all of the emergency or standby units were reciprocating engine driven. An important point to note on the data for emergency and standby units: Failure to start for automatically started units was counted as a failure, whereas failure to start for manually started units was not counted as a failure.
35

IEEE Std 3006.8-2018 IEEE Recommended Practice for Analyzing Reliability Data for Equipment Used in Industrial and Commercial Power
Systems
5.5.2 Reliability/availability guarantees of gas turbine and combined cycle generating units
Many industrial firms are now purchasing gas turbine generating units or combined cycle units that include both a gas turbine and a steam turbine. In some cases, the specification contains a reliability/availability guarantee. Historical Reliability Data for IEEE 3006 Standards: Power System Reliability, page 221 (see Ekstrom [B7]) contains one manufacturer’s suggestion on how to write a reliability/availability guarantee when purchasing such units; this is a very thorough description of the factors that need to be considered along with the necessary definitions. Historical Reliability Data for IEEE 3006 Standards: Power System Reliability, page 221 also contains some 1993 data on the reliability/availability of gas turbine units that was collected by an independent data collection organization.
5.6 1979 survey of the reliability of transformers
5.6.1 Introduction
A survey published in 1973-1974 raised some interesting questions and created some controversy (see IEEE Committee Report [B10]). The most controversial items in this survey concerned the average outage duration time after a transformer failure in relation to the failure restoration method, and the comparatively high failure rate for rectifier transformers.
The 1979 survey form (see IEEE Committee Report [B11]) was improved considerably, taking lessons learned from the 1973-1974 version. Items felt to be of little significance in the past were omitted and the form was simplified to maximize the response. Data relating specifically to transformer reliability, such as rating, voltage, age, and maintenance were included in the new form. The most significant categories in the failed unit data are the causes of failure, the restoration method, restoration urgency, the duration of failure, and the transformer age at time of failure. The survey form of the 1979 survey (published in 1983) is shown in the Historical Reliability Data for IEEE 3006 Standards: Power System Reliability, on page 114.
5.6.2 Failure rate and restoration method for power and rectified transformers survey results
The survey response for power transformers is summarized in Table 6 and the survey response for rectifier transformers is summarized in Table 7.
36

IEEE Std 3006.8-2018 IEEE Recommended Practice for Analyzing Reliability Data for Equipment Used in Industrial and Commercial Power
Systems
Table 6 —Power transformers (1979 survey)
Equipment subclass Failure rate (failures per unit-year)
Average repair time (hours per failure)
Average replacement time
(hours per failure)
All liquid filled 0.0062 356.1 85.1
Liquid filled 300 kVA to 10 000 kVA 0.0059 297.4 79.3
Liquid filled > 10 000 kVA 0.0153 1178.5a 192.0a
Dry 300 kVA to 10 000 kVA
a a a
a Small sample size; fewer than eight failures.
Table 7 —Rectifier transformers (1979 survey)
Equipment subclass Failure rate (failures per unit-year)
Average repair time (hours per failure)
Average replacement time (hours per
failure)
All liquid filled 0.0190 2316.0 41.4
Liquid filled 300 kVA to 10 000 kVA 0.0153 1644.0a 38.7a
Liquid filled > 10 000 kVA
a a a
a Small sample size; fewer than eight failures.
The survey results for the liquid-filled power transformers compared favorably between the 1973-1974 and 1979 surveys: 0.0041 and 0.0062 failures per unit-year, respectively. The 1979 survey also confirmed the fact that the failure rate for rectifier transformers (i.e., 0.0190) is much higher than those for the other transformer categories (i.e., 0.0062). This may be due to the severe duties to which they were subjected and/or the harsh environments in which they are housed.
Table 6 and Table 7 include data on restoration time versus restoration method. The data clearly indicate that the restoration of a unit to service by repair rather than replacement results in a much longer outage duration in every case. This is consistent with previous survey results. Despite this fact, in most categories a larger number of units were restored to service by repair. These results show the obvious benefits in having spares at the site or readily available. The data also provides some of the information necessary in the preparation of an economic justification for spares. The averages shown represent only those cases where restoration work was begun immediately. Those instances in which the repair or replacement was deferred were excluded to avoid distorting the average restoration time data.
5.6.3 Failure rate versus age of power transformers
The survey response for power transformer failures as a function of their age is summarized in Table 8.
37

IEEE Std 3006.8-2018 IEEE Recommended Practice for Analyzing Reliability Data for Equipment Used in Industrial and Commercial Power
Systems
Table 8 —Failure rate versus age of power transformers (1979 survey)
Equipment subclass Agea (years)
Number of units
Sample size (unit-years)
Number of failuresb
Failure rate (failures per unit-year)
Liquid filled 300 kVA to 10 000 kVA 1 to 10 638 2625.5 19 0.0072
Liquid filled 300 kVA to 10 000 kVA 11 to 25 715 8846.5 47 0.0053
Liquid filled 300 kVA to 10 000 kVA > 25 397 5938.0 36 0.0060
Liquid filled > 10 000 kVA 1 to 10 27 144.0 0c —
Liquid filled > 10 000 kVA 11 to 25 28 283.5 7c 0.0246c
Liquid filled > 10 000 kVA > 25 9 158.0 2c 0.0126c
a Age was the age of the transformer at the end of the reporting period. b Relay or tap changer faults were not considered in calculation of failure rates or repair and replacement times. c Small sample size; fewer than eight failures.
An examination of Table 8 reveals that the failure rates for power transformers was approximately equal in all three age groups. It can be seen that slightly higher failure rates for transformer units aged 1 year to 10 years and for units greater than 25 years may be attributable to “infant mortality” and to units approaching the end of their life, respectively.
5.6.4 Failure-initiating cause
Table 9 summarizes the failure-initiating cause data for power and rectifier transformers. This table reveals that a large percentage of transformer failures were initiated by some type of insulation breakdown or transient over-voltages.
38
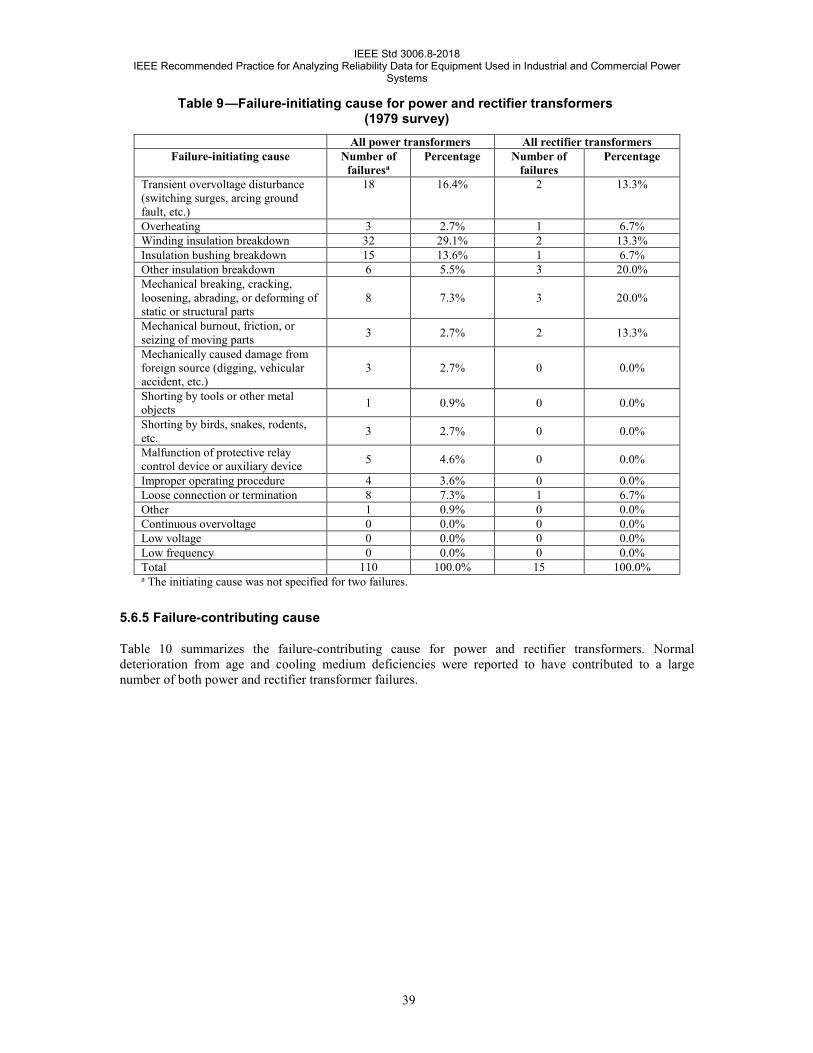
IEEE Std 3006.8-2018 IEEE Recommended Practice for Analyzing Reliability Data for Equipment Used in Industrial and Commercial Power
Systems
Table 9 —Failure-initiating cause for power and rectifier transformers (1979 survey)
All power transformers All rectifier transformers Failure-initiating cause Number of
failuresa Percentage Number of
failures Percentage
Transient overvoltage disturbance (switching surges, arcing ground fault, etc.)
18 16.4% 2 13.3%
Overheating 3 2.7% 1 6.7% Winding insulation breakdown 32 29.1% 2 13.3% Insulation bushing breakdown 15 13.6% 1 6.7% Other insulation breakdown 6 5.5% 3 20.0% Mechanical breaking, cracking, loosening, abrading, or deforming of static or structural parts
8 7.3% 3 20.0%
Mechanical burnout, friction, or seizing of moving parts 3 2.7% 2 13.3%
Mechanically caused damage from foreign source (digging, vehicular accident, etc.)
3 2.7% 0 0.0%
Shorting by tools or other metal objects 1 0.9% 0 0.0%
Shorting by birds, snakes, rodents, etc. 3 2.7% 0 0.0%
Malfunction of protective relay control device or auxiliary device 5 4.6% 0 0.0%
Improper operating procedure 4 3.6% 0 0.0% Loose connection or termination 8 7.3% 1 6.7% Other 1 0.9% 0 0.0% Continuous overvoltage 0 0.0% 0 0.0% Low voltage 0 0.0% 0 0.0% Low frequency 0 0.0% 0 0.0% Total 110 100.0% 15 100.0% a The initiating cause was not specified for two failures.
5.6.5 Failure-contributing cause
Table 10 summarizes the failure-contributing cause for power and rectifier transformers. Normal deterioration from age and cooling medium deficiencies were reported to have contributed to a large number of both power and rectifier transformer failures.
39

IEEE Std 3006.8-2018 IEEE Recommended Practice for Analyzing Reliability Data for Equipment Used in Industrial and Commercial Power
Systems
Table 10 —Failure-contributing cause for power and rectifier transformers (1979 survey)
All power transformers All rectifier transformers
Failure-contributing cause Number of failuresa Percentage Number of
failuresb Percentage
Persistent overloading 1 1.1% 0 0% Abnormal temperature 5 5.5% 1 7.1% Exposure to aggressive chemicals, solvents, dusts, moisture, or other contaminants
13 14.4% 1 7.1%
Normal deterioration from age 12 13.3% 4 28.60% Severe wind, rain, snow, sleet, or other weather conditions 4 4.4% 0 0.0%
Lack of protective device 2 2.2% 0 0.0% Malfunction of protective device 7 7.8% 0 0.0%
Loss, deficiency, contamination, or degradation of oil or other cooling medium
9 10.0% 3 21.50%
Improper operating procedure or testing error 3 3.3% 0 0.0%
Inadequate maintenance 7 7.8% 3 21.50% Others 27 30.0% 1 7.1% Exposure to nonelectrical fire or burning 0 0.0% 0 0.0%
Obstruction of ventilation by foreign object or material 0 0.0% 0 0.0%
Improper setting of protective device 0 0.0% 0 0.0%
Inadequate protective device 0 0.0% 1 7.1% Total 90 100.0% 140 100.0% a Failure-contributing cause not specified for 22 failures. b Failure-contributing cause not specified for two failures.
5.6.6 Suspected failure responsibility
Table 11 summarizes the suspected failure responsibility for power and rectifier transformer failures. The respondents believed that manufacturer defects and inadequate maintenance were responsible for the majority of power transformer failures (i.e., 59.3%). Table 11 shows that inadequate operating procedures were a more significant cause of rectifier transformer failures (i.e., 31.2%) than inadequate maintenance.
40
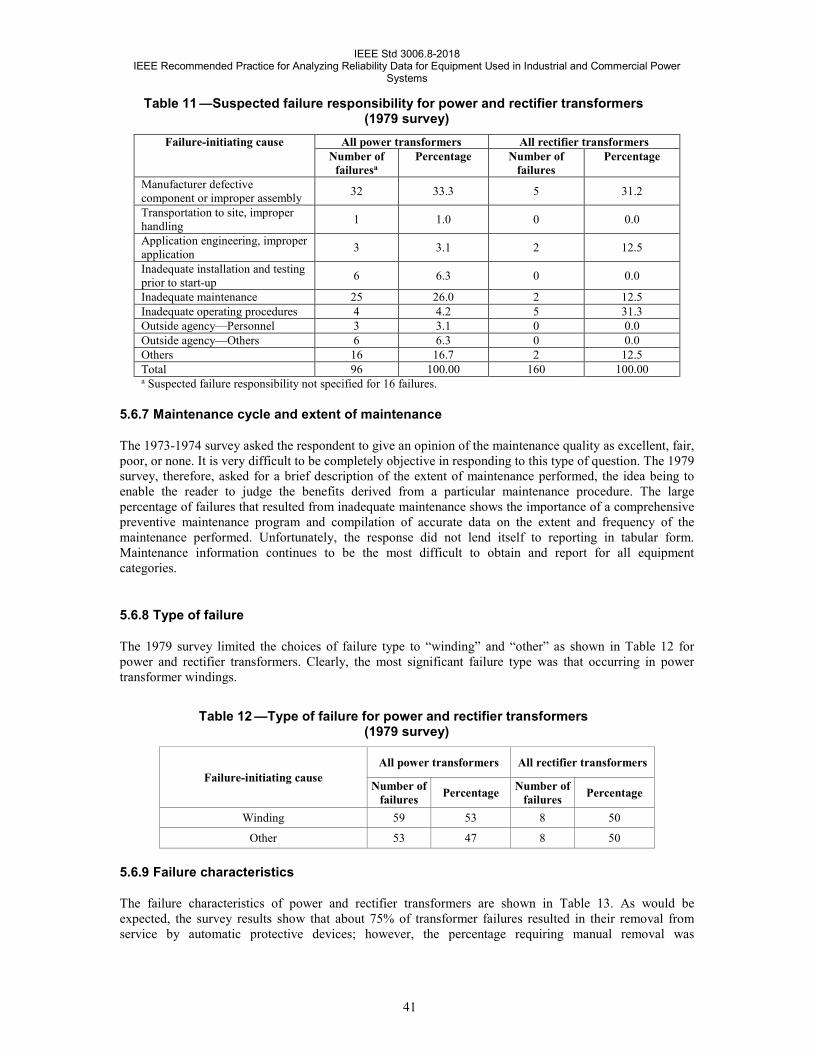
IEEE Std 3006.8-2018 IEEE Recommended Practice for Analyzing Reliability Data for Equipment Used in Industrial and Commercial Power
Systems
Table 11 —Suspected failure responsibility for power and rectifier transformers (1979 survey)
Failure-initiating cause All power transformers All rectifier transformers Number of
failuresa Percentage Number of
failures Percentage
Manufacturer defective component or improper assembly 32 33.3 5 31.2
Transportation to site, improper handling 1 1.0 0 0.0
Application engineering, improper application 3 3.1 2 12.5
Inadequate installation and testing prior to start-up 6 6.3 0 0.0
Inadequate maintenance 25 26.0 2 12.5 Inadequate operating procedures 4 4.2 5 31.3 Outside agency—Personnel 3 3.1 0 0.0 Outside agency—Others 6 6.3 0 0.0 Others 16 16.7 2 12.5 Total 96 100.00 160 100.00 a Suspected failure responsibility not specified for 16 failures.
5.6.7 Maintenance cycle and extent of maintenance
The 1973-1974 survey asked the respondent to give an opinion of the maintenance quality as excellent, fair, poor, or none. It is very difficult to be completely objective in responding to this type of question. The 1979 survey, therefore, asked for a brief description of the extent of maintenance performed, the idea being to enable the reader to judge the benefits derived from a particular maintenance procedure. The large percentage of failures that resulted from inadequate maintenance shows the importance of a comprehensive preventive maintenance program and compilation of accurate data on the extent and frequency of the maintenance performed. Unfortunately, the response did not lend itself to reporting in tabular form. Maintenance information continues to be the most difficult to obtain and report for all equipment categories.
5.6.8 Type of failure
The 1979 survey limited the choices of failure type to “winding” and “other” as shown in Table 12 for power and rectifier transformers. Clearly, the most significant failure type was that occurring in power transformer windings.
Table 12 —Type of failure for power and rectifier transformers (1979 survey)
Failure-initiating cause All power transformers All rectifier transformers
Number of failures Percentage Number of
failures Percentage
Winding 59 53 8 50
Other 53 47 8 50
5.6.9 Failure characteristics
The failure characteristics of power and rectifier transformers are shown in Table 13. As would be expected, the survey results show that about 75% of transformer failures resulted in their removal from service by automatic protective devices; however, the percentage requiring manual removal was
41

IEEE Std 3006.8-2018 IEEE Recommended Practice for Analyzing Reliability Data for Equipment Used in Industrial and Commercial Power
Systems
significant. Increasing use of transformer oil or gas analysis could be a factor here, enabling detection of incipient faults in their early stages, and thus permitting manual removal before a major failure occurs.
Table 13 —Failure characteristic for power and rectifier transformers (1979 survey)
All power transformers All rectifier transformers Failure-initiating cause Number of
failures Percentage Number of
failures Percentage
Automatic removal by protective device
83 75 11 69
Partial failure, reducing capacity
5 5 0 0
Manual removal 23 20 5 31
5.6.10 Voltage rating
The failure rates for liquid-filled power transformers and rectifier transformers classified by their voltage ratings are shown in Table 14 and Table 15, respectively. An examination of Table 14 reveals the failure rate for the 600 V to 15 000 V transformers (i.e., 0.0052 failures per unit year) is fewer than that for the higher voltage units. The lack of data (i.e., small sample sizes) reported for rectifier transformers makes it impossible to draw any definite conclusions as to the effect of voltage or size on their failure rates.
Table 14 —Failure rate versus voltage rating and size for power transformers (1979 survey)
Equipment subclass Voltage (kV)
Number of units
Sample size (unit-years)
Number of failures
Failure rate (failures per unit-year)
Liquid filled 300 kVA to 10 000 kVA 0.16 to 15 1626 15 775 82 0.0052
Liquid filled 300 kVA to 10 000 kVA > 15 124 1637 18 0.0110
Liquid filled > 10 000 kVA > 15 52 490 9 0.0184
Table 15 —Failure rate versus voltage rating for rectifier transformers (1979 survey)
Equipment subclass Voltage (kV) Number of units
Sample size (unit-years)
Number of failures
Failure rate (failures per unit-year)
All liquid filled 0.16 to 15 65 745 15 0.0201
5.7 1983 IEEE survey on the reliability of large motors
5.7.1 Introduction
A decision was made by the IEEE Motor Reliability Working Group to focus on motors that were of a critical nature in industrial and commercial installations, and thus, only motors larger than 200 hp (149 kW) were selected to be included in the survey (see IEEE Committee Report [B12] and Historical Reliability Data for IEEE 3006 Standards: Power System Reliability, page 151). Another decision was made to limit the survey to only include motors that were 15 years old or less to focus on motors that were similar to those presently being manufactured and used today.
42
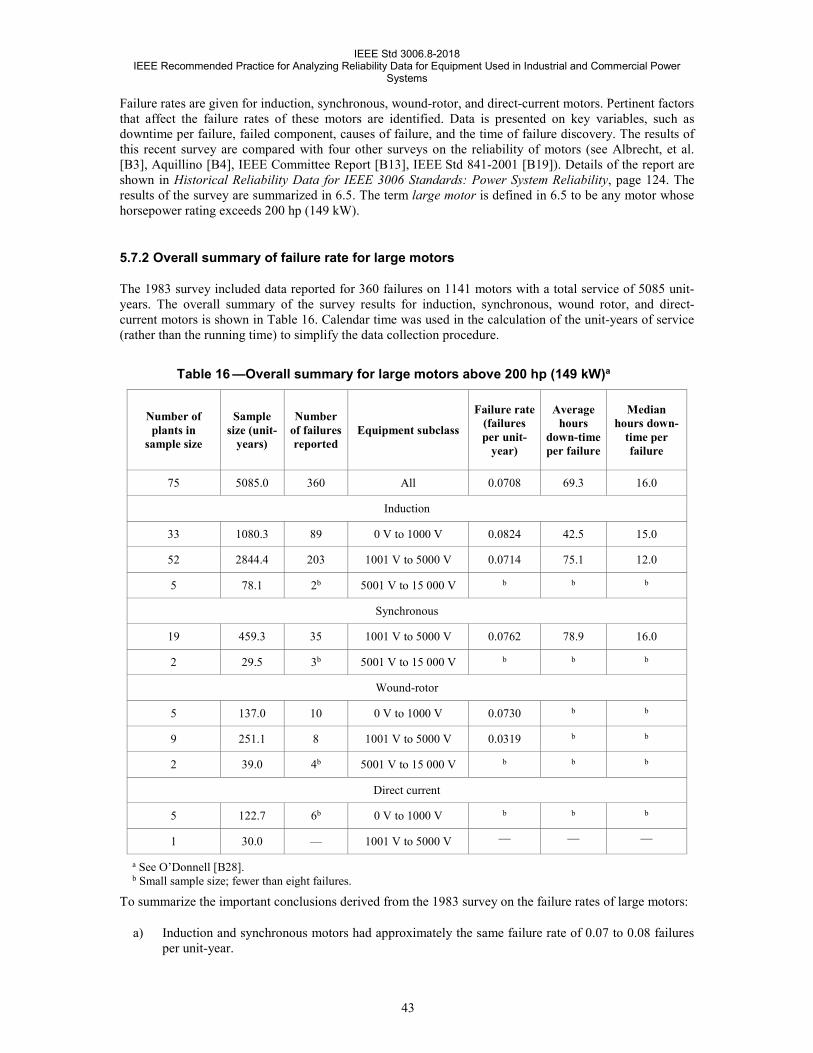
IEEE Std 3006.8-2018 IEEE Recommended Practice for Analyzing Reliability Data for Equipment Used in Industrial and Commercial Power
Systems
Failure rates are given for induction, synchronous, wound-rotor, and direct-current motors. Pertinent factors that affect the failure rates of these motors are identified. Data is presented on key variables, such as downtime per failure, failed component, causes of failure, and the time of failure discovery. The results of this recent survey are compared with four other surveys on the reliability of motors (see Albrecht, et al. [B3], Aquillino [B4], IEEE Committee Report [B13], IEEE Std 841-2001 [B19]). Details of the report are shown in Historical Reliability Data for IEEE 3006 Standards: Power System Reliability, page 124. The results of the survey are summarized in 6.5. The term large motor is defined in 6.5 to be any motor whose horsepower rating exceeds 200 hp (149 kW).
5.7.2 Overall summary of failure rate for large motors
The 1983 survey included data reported for 360 failures on 1141 motors with a total service of 5085 unit-years. The overall summary of the survey results for induction, synchronous, wound rotor, and direct-current motors is shown in Table 16. Calendar time was used in the calculation of the unit-years of service (rather than the running time) to simplify the data collection procedure.
Table 16 —Overall summary for large motors above 200 hp (149 kW)a
Number of plants in
sample size
Sample size (unit-
years)
Number of failures reported
Equipment subclass
Failure rate (failures per unit-
year)
Average hours
down-time per failure
Median hours down-
time per failure
75 5085.0 360 All 0.0708 69.3 16.0
Induction
33 1080.3 89 0 V to 1000 V 0.0824 42.5 15.0
52 2844.4 203 1001 V to 5000 V 0.0714 75.1 12.0
5 78.1 2b 5001 V to 15 000 V b b b
Synchronous
19 459.3 35 1001 V to 5000 V 0.0762 78.9 16.0
2 29.5 3b 5001 V to 15 000 V b b b
Wound-rotor
5 137.0 10 0 V to 1000 V 0.0730 b b
9 251.1 8 1001 V to 5000 V 0.0319 b b
2 39.0 4b 5001 V to 15 000 V b b b
Direct current
5 122.7 6b 0 V to 1000 V b b b
1 30.0 — 1001 V to 5000 V — — —
a See O’Donnell [B28]. b Small sample size; fewer than eight failures.
To summarize the important conclusions derived from the 1983 survey on the failure rates of large motors:
a) Induction and synchronous motors had approximately the same failure rate of 0.07 to 0.08 failuresper unit-year.
43
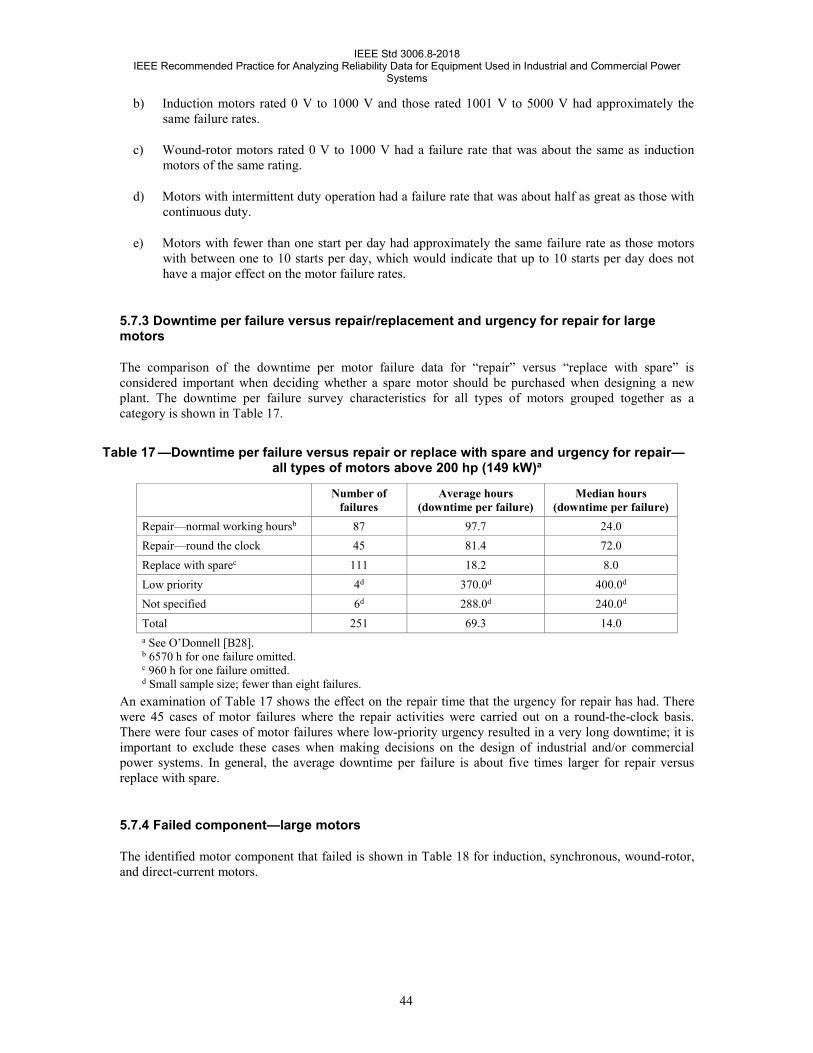
IEEE Std 3006.8-2018 IEEE Recommended Practice for Analyzing Reliability Data for Equipment Used in Industrial and Commercial Power
Systems
b) Induction motors rated 0 V to 1000 V and those rated 1001 V to 5000 V had approximately thesame failure rates.
c) Wound-rotor motors rated 0 V to 1000 V had a failure rate that was about the same as inductionmotors of the same rating.
d) Motors with intermittent duty operation had a failure rate that was about half as great as those withcontinuous duty.
e) Motors with fewer than one start per day had approximately the same failure rate as those motorswith between one to 10 starts per day, which would indicate that up to 10 starts per day does nothave a major effect on the motor failure rates.
5.7.3 Downtime per failure versus repair/replacement and urgency for repair for large motors
The comparison of the downtime per motor failure data for “repair” versus “replace with spare” is considered important when deciding whether a spare motor should be purchased when designing a new plant. The downtime per failure survey characteristics for all types of motors grouped together as a category is shown in Table 17.
Table 17 —Downtime per failure versus repair or replace with spare and urgency for repair— all types of motors above 200 hp (149 kW)a
Number of failures
Average hours (downtime per failure)
Median hours (downtime per failure)
Repair—normal working hoursb 87 97.7 24.0 Repair—round the clock 45 81.4 72.0 Replace with sparec 111 18.2 8.0 Low priority 4d 370.0d 400.0d Not specified 6d 288.0d 240.0d Total 251 69.3 14.0 a See O’Donnell [B28]. b 6570 h for one failure omitted. c 960 h for one failure omitted. d Small sample size; fewer than eight failures.
An examination of Table 17 shows the effect on the repair time that the urgency for repair has had. There were 45 cases of motor failures where the repair activities were carried out on a round-the-clock basis. There were four cases of motor failures where low-priority urgency resulted in a very long downtime; it is important to exclude these cases when making decisions on the design of industrial and/or commercial power systems. In general, the average downtime per failure is about five times larger for repair versus replace with spare.
5.7.4 Failed component—large motors
The identified motor component that failed is shown in Table 18 for induction, synchronous, wound-rotor, and direct-current motors.
44

IEEE Std 3006.8-2018 IEEE Recommended Practice for Analyzing Reliability Data for Equipment Used in Industrial and Commercial Power
Systems
Table 18 —Failed component—Large motors (above 200 hp [149 kW]) (number of failures)
Failed componenta Induction motors
Synchronous motors
Wound rotor motors
Direct-current motors Total (all types)
Bearings 152 2 10 2 166 Windings 75 16 6 97 Rotor 8 1 4 13 Shaft or coupling 19 19 Brushes or slip ring — 6 8 2 16 External devices 10 7 1 18 Not specified 40 9 2 51 Total 304 41 29 6 380 a Some respondents reported more than one failed component per motor failure.
It can be seen that the two largest categories reported are motor bearing and winding failures with 166 and 97 failures, respectively, out of a total of 380 failures. Bearings and windings represent 44% and 26%, respectively, of the total number of motor failures.
5.7.5 Failed component versus time of discovery—large motors
Data on the failed component versus the time the failure was discovered is shown in Table 19. It can be seen that 60.5% of the failures found during maintenance or test are bearings. Many users consider that it is very important to find as many failures as possible during maintenance or test rather than normal operation. Bearings and windings represent 36.6% and 33.1%, respectively, of the failures discovered during normal operation.
Table 19 —Failed component versus time of discovery (all types of motors above 200 hp [149 kW]) (percentage of failures)
Time of discovery
Failed component Normal operation Maintenance or test Other Bearing 36.6 60.5 50.0 Windings 33.1 8.3 28.6 Rotor 5.1 1.8 0.0 Shaft or coupling 5.8 8.3 14.3 Brushes or slip rings 3.1 7.3 0.0 External devices 5.0 3.7 0.0 Not specified 11.3 10.1 7.1 Total percentage of failures 100.0 100.0 100.0 Total number of failures 257 109.0 14.0
5.7.6 Causes of large motor bearing and winding failures
The causes of motor failures categorized according to the failure initiator, the failure contributor, and the failure’s underlying cause are shown in Table 20 for induction, synchronous, and all motors.
45

IEEE Std 3006.8-2018 IEEE Recommended Practice for Analyzing Reliability Data for Equipment Used in Industrial and Commercial Power
Systems
Table 20 —Causes of failure versus motor type and versus bearing and winding failures—motors above 200 hp (149 kW) (percentage of failures)
All motor types—failed component All types of
motors %
Induction motors
%
Synchronous motors
% Causes of failures
Bearings %
Windings %
Failure initiator
0.0 4.1 1.5 1.4 0.0 Transient overvoltage 12.4 21.4 13.2 14.7 0.0 Overheating 1.9 36.7 12.3 11.9 21.1 Other insulation breakdown
50.3 10.2 33.1 37.4 5.2 Mechanical breakage 3.7 11.2 7.6 5.8 23.7 Electrical fault or malfunction 0.0 2.1 0.9 0.7 2.6 Stalled motor
31.7 14.3 31.4 28.1 47.4 Other 100.0 100.0 100.0 100.0 100.0 Total percentage of failures 161.0 98.0 341.0 278.0 38.0 Total number of failures
Failure contributor 1.4 6.5 4.2 4.9 2.7 Persistent overheating 0.7 7.6 3.0 3.4 0.0 High ambient temperature 2.7 18.5 5.8 6.7 2.7 Abnormal moisture 0.0 5.4 1.5 1.5 2.7 Abnormal voltage 0.0 1.1 0.6 0.7 0.0 Abnormal frequency
21.8 8.7 15.5 17.6 5.4 High vibration 5.4 6.5 4.2 4.5 2.7 Aggressive chemicals
31.3 5.4 15.2 16.9 8.1 Poor lubrication 0.0 7.6 3.9 2.2 2.7 Poor ventilation or cooling
20.4 18.5 26.4 24.0 51.4 Normal deterioration from age 16.3 14.2 19.7 17.6 21.6 Other
100.0 100.0 100.0 100.0 100.0 Total percentage of failures 147.0 92.0 330.0 267.0 37.0 Total number of failures
Failure underlying cause 17.8 10.9 20.1 20.3 22.2 Defective component 14.5 10.9 12.9 15.9 0.0 Poor installation/testing 27.6 19.6 21.4 22.8 11.1 Inadequate maintenance 2.0 6.5 3.6 3.3 2.8 Improper operation 0.7 0.0 0.6 0.8 0.0 Improper handling/shipping 7.9 7.6 6.1 6.5 2.8 Inadequate physical protection 2.6 15.2 5.8 5.3 11.1 Inadequate electrical protection 7.2 5.4 6.8 5.7 5.6 Personnel error 2.0 3.3 3.9 2.8 13.9 Outside agency—not personnel 5.9 4.3 4.9 4.9 0.0 Motor-driven equipment
mismatch 11.8 16.3 13.9 11.7 30.5 Other
100.0 100.0 100.0 100.0 100.0 Total percentage of failures 152.0 92.0 309.0 246.0 36.0 Total number of failures
46
IEEE Std 3006.8-2018 IEEE Recommended Practice for Analyzing Reliability Data for Equipment Used in Industrial and Commercial Power
Systems
Mechanical breakage is the largest failure initiator for induction motors. Normal deterioration from age, high vibration, and poor lubrication are the major failure contributors to induction motor failures. Inadequate maintenance and defective component are the largest underlying causes of induction motor failures.
Electrical fault or malfunction and other insulation breakdown are the major failure initiators for synchronous motors. Normal deterioration from age is the major fault contributor of synchronous motors. Defective component is the largest underlying cause of synchronous motor failures.
Table 20 shows a correlation between bearing failures and the causes of failure: 50.3% of bearing failures were initiated by mechanical breakage; 31.3% and 21.8%, respectively, had poor lubrication and high vibration as failure contributors; and 27.6% blamed inadequate maintenance as the underlying cause.
Table 20 also shows a correlation between winding failures and the causes of failure: 36.7% of the winding failures had other insulation breakdown as the initiator; 18.5% and 18.5%, respectively, had normal deterioration from age and abnormal moisture as failure contributors; 19.6% had inadequate maintenance and 15.2% had inadequate electrical protection as the underlying cause.
It is of interest to note that inadequate maintenance was the largest underlying cause of both bearing and winding failures. A special study of the 71 failures attributed to inadequate maintenance is shown in Table 21. It can be clearly seen that 59.1% of the motor components that failed were bearings, 52.1% of thefailures were initiated by mechanical breakage, and 43.7% of the failures had poor lubrication as a failurecontributor.
47

IEEE Std 3006.8-2018 IEEE Recommended Practice for Analyzing Reliability Data for Equipment Used in Industrial and Commercial Power
Systems
Table 21 —Failures caused by inadequate maintenance versus failed component, failure initiator, and failure contributor
(all types of motors above 200 hp [149 kW])a
Percentage Failed component
59.1 Bearing
25.4 Winding
1.4 Rotor
0.0 Shaft or coupling
8.5 Brushes or slip rings
1.4 External device
4.2 Other
100.0 Total percentage (number of failures = 71)
Failed initiator 0.0 Transient overvoltage 4.2 Overheating 14.1 Other insulation breakdown 52.1 Mechanical breakage 2.8 Electrical fault or malfunction 0.0 Stalled motor 26.8 Other
100.0 Total percentage (number of failures = 71) Failed contributor
0.0 Persistent overloading 4.2 High ambient temperature 7.0 Abnormal moisture 0.0 Abnormal voltage 0.0 Abnormal frequency 4.2 High vibration 9.9 Aggressive chemical 43.7 Poor lubrication 1.4 Poor ventilation/cooling 18.3 Normal deterioration from age 11.3 Other
100.0 Total percentage (number of failures = 71) a See O’Donnell [B28].
5.7.7 Other significant results
5.7.7.1 Introduction
Several additional parameters were reported in O’Donnell [B28] in terms of their effect on the failure rate of motors above 200 hp (149 kW). These included the effect of horsepower, speed, enclosure, environment, duty cycle, service factor (S.F.), average number of starts per day, grounding practice, maintenance quality, maintenance cycle, type of maintenance performed, and months since last maintenance prior to the failure.
48

IEEE Std 3006.8-2018 IEEE Recommended Practice for Analyzing Reliability Data for Equipment Used in Industrial and Commercial Power
Systems
Some combinations of these parameters, two at a time, have also been studied and reported (see O’Donnell [B28]).
5.7.7.2 Open versus enclosed motors
The following significant conclusions were reached:
a) Open motors had a higher failure rate than weather-protected or enclosed motors.
b) Outdoor motors had a lower failure rate than indoor motors because most outdoor motors wereweather protected or enclosed, and most indoor motors were open.
5.7.7.3 Service factor
The 1.15 S.F. induction motors had a higher reported failure rate than 1.0 S.F. induction motors, but the opposite was true for synchronous motors.
5.7.7.4 Speed and horsepower
The failure rate for induction motors did not vary significantly among the three speed categories (i.e., 0 RPM to 720 RPM, 721 RPM to 1800 RPM, and 1801 RPM to 3600 RPM). The highest failure rate was in the middle speed category, while the lowest failure rate was in the higher speed category. The 201 hp (150 kW) to 500 hp (373 kW) induction motors had approximately the same failure rate as 501 hp (374 kW) to 5000 hp (3730 kW) induction motors in each of the three speed ranges studied.
Synchronous motors in the speed category 0 RPM to 720 RPM had a higher failure rate than synchronous motors in the 721 RPM to 1800 RPM category. There were no respondents for the 1801 RPM to 3600 RPM category.
5.7.8 Data supports chemical industry motor standard
Reliability data for induction motors from both the 1983 IEEE survey and the 1973-1974 IEEE survey (see Historical Reliability Data for IEEE 3006 Standards: Power System Reliability, pages 1 and 61) supported the need for several of the features incorporated into IEEE Std 841-2001 [B19]. The IEEE surveys show the need for improved reliability of bearings and windings and, in some cases, the need for better physical protection against aggressive chemicals and moisture. Some of the more significant recommendations for an IEEE Std 841-2001 [B19] motor include:
a) Totally enclosed fan-cooled (TEFC) enclosure
b) Maximum 80 °C rise at 1.0 S.F.
c) Contamination protection for bearings and grease reservoirs
d) Three-year continuous L-10 bearing life
e) Maximum bearing temperature of 45 °C rise (50 °C rise on two-pole motors)
f) Cast iron frame construction
g) Nonsparking fan
49

IEEE Std 3006.8-2018 IEEE Recommended Practice for Analyzing Reliability Data for Equipment Used in Industrial and Commercial Power
Systems
h) Single connection point per phase in terminal box
i) Maximum sound power level of 90 dBA
j) Corrosion-resistant paint, internal joints and surfaces, and hardware
IEEE Std 841-2001 [B19] was tailored for the petroleum/chemical industry; however, it can be beneficial for other industries with similar requirements.
5.7.9 Comparison of 1983 motor survey with other motor surveys
5.7.9.1 Introduction
One of the primary purposes of comparing the results of 1983 motor survey with previous surveys and other surveys (see Albrecht, et al. [B2], [B3], and the “Summary of Replies to the 1982 Technical Questionnaire” [B40]) is to attempt to identify trends in the failure characteristics of motors (i.e., changing failure rates with time, varying causes of motor failures, assessing the impact of maintenance practices).
5.7.9.2 1983 EPRI and 1983-1985 IEEE surveys
The size and scope of the IEEE Working Group and EPRI motor surveys is shown in Table 22. The motor failure rate of 0.035 failures per unit-year in the EPRI-sponsored study of the electric utility industry is about half the IEEE failure rate of 0.0708 failures per year.
Table 22 —Size and scope comparison of IEEE1983-1985 motor survey and EPRI-sponsored motor survey in electric utility power plantsa
Parameter IEEE Working Group EPRI Phase I Horsepower (kilowatts) > 200 (149 kW) 100 (75 kW) and up Number of companies/utilities 33 56 Number of plants or units 75 132 Number of motors 114 100 47 970 Total population (unit-years) 508 500 24 914 100 Total failures 3600 871 100 Failure rate (all motors) 0.07 080 0.03 500b a See O’Donnell [B28]. b To first failure.
The percentage of motor failures classified by component in the two surveys is shown in Table 23. Similar results were obtained in these two studies on the failed component, with bearing, winding, and rotor-related percentages that were each about the same.
50
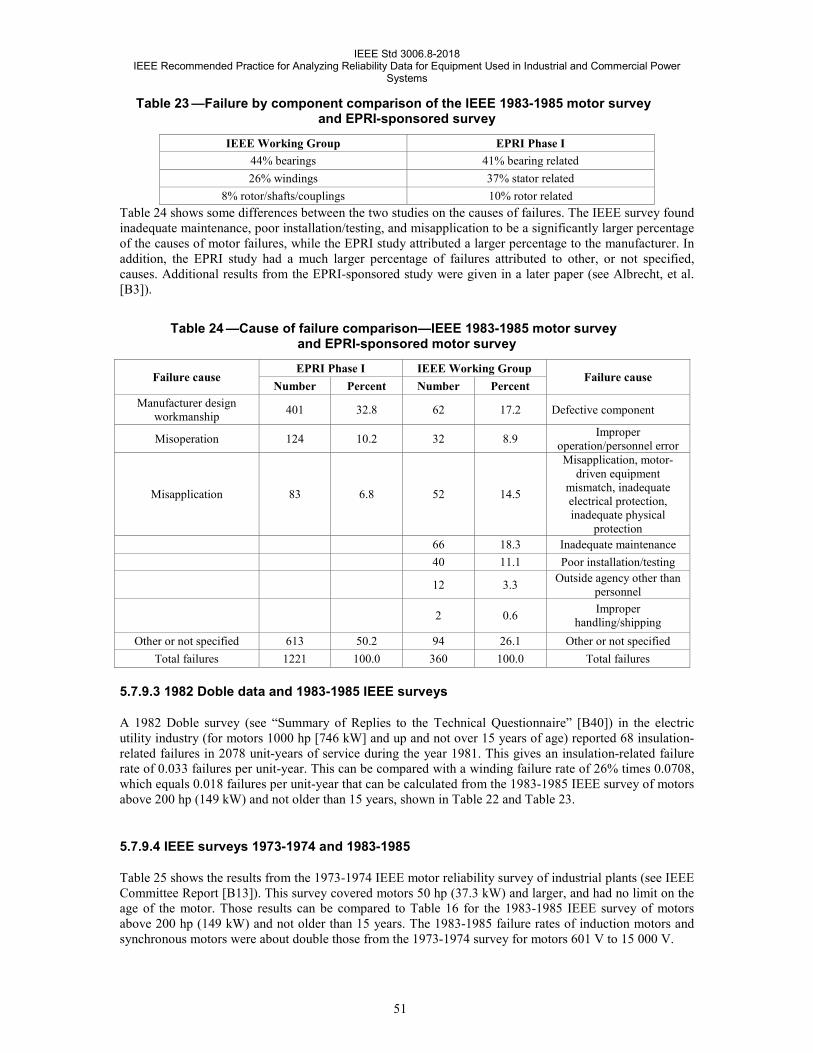
IEEE Std 3006.8-2018 IEEE Recommended Practice for Analyzing Reliability Data for Equipment Used in Industrial and Commercial Power
Systems
Table 23 —Failure by component comparison of the IEEE 1983-1985 motor survey and EPRI-sponsored survey
IEEE Working Group EPRI Phase I 44% bearings 41% bearing related 26% windings 37% stator related
8% rotor/shafts/couplings 10% rotor related Table 24 shows some differences between the two studies on the causes of failures. The IEEE survey found inadequate maintenance, poor installation/testing, and misapplication to be a significantly larger percentage of the causes of motor failures, while the EPRI study attributed a larger percentage to the manufacturer. In addition, the EPRI study had a much larger percentage of failures attributed to other, or not specified, causes. Additional results from the EPRI-sponsored study were given in a later paper (see Albrecht, et al. [B3]).
Table 24 —Cause of failure comparison—IEEE 1983-1985 motor survey and EPRI-sponsored motor survey
Failure cause EPRI Phase I IEEE Working Group
Failure cause Number Percent Number Percent
Manufacturer design workmanship 401 32.8 62 17.2 Defective component
Misoperation 124 10.2 32 8.9 Improper operation/personnel error
Misapplication 83 6.8 52 14.5
Misapplication, motor-driven equipment
mismatch, inadequate electrical protection, inadequate physical
protection 66 18.3 Inadequate maintenance 40 11.1 Poor installation/testing
12 3.3 Outside agency other than personnel
2 0.6 Improper handling/shipping
Other or not specified 613 50.2 94 26.1 Other or not specified Total failures 1221 100.0 360 100.0 Total failures
5.7.9.3 1982 Doble data and 1983-1985 IEEE surveys
A 1982 Doble survey (see “Summary of Replies to the Technical Questionnaire” [B40]) in the electric utility industry (for motors 1000 hp [746 kW] and up and not over 15 years of age) reported 68 insulation-related failures in 2078 unit-years of service during the year 1981. This gives an insulation-related failure rate of 0.033 failures per unit-year. This can be compared with a winding failure rate of 26% times 0.0708, which equals 0.018 failures per unit-year that can be calculated from the 1983-1985 IEEE survey of motors above 200 hp (149 kW) and not older than 15 years, shown in Table 22 and Table 23.
5.7.9.4 IEEE surveys 1973-1974 and 1983-1985
Table 25 shows the results from the 1973-1974 IEEE motor reliability survey of industrial plants (see IEEE Committee Report [B13]). This survey covered motors 50 hp (37.3 kW) and larger, and had no limit on the age of the motor. Those results can be compared to Table 16 for the 1983-1985 IEEE survey of motors above 200 hp (149 kW) and not older than 15 years. The 1983-1985 failure rates of induction motors and synchronous motors were about double those from the 1973-1974 survey for motors 601 V to 15 000 V.
51

IEEE Std 3006.8-2018 IEEE Recommended Practice for Analyzing Reliability Data for Equipment Used in Industrial and Commercial Power
Systems
Table 25 —1973-1974 IEEE overall summary for motors 50 hp (37.3 kW) and larger
Number of plants in sample
size
Sample size
(unit-years)
Number of failures
reported Equipment subclass
Failure rate (failures per unit-year)
Average hours
down-time per failure
Median hours
down-time per failure
— 42 463 561 All 0.0132 111.6 — 17 19 610 213 Induction, 0 V to 600 V 0.0109 114.0 18.3 17 4229 172 Induction, 5001 V to 15 000 V 0.0404 76.0 153.0 2 13 790 10 Synchronous, 1001 V to 5000 V 0.0007 35.3 35.3 11 4276 136 Synchronous, 5001 V to 15 000 V 0.0318 175.0 153.0 6 558 310 Direct current 0.0556 37.5 16.2
5.7.9.5 AIEE 1962 and 1983-1985 IEEE surveys
Table 26 shows the results from the 1962 AIEE motor reliability survey of industrial plants. This survey covered motors 250 hp (187 kW) and larger and had no limit on the age of the motor. The failure rates for both induction motors and synchronous motors from the 1962 AIEE survey are within 30% of those shown in Table 16 for the 1983-1985 IEEE survey of motors above 200 hp (149 kW) and not older than 15 years. The two surveys conducted 21 years apart show remarkably similar results.
Table 26 —AIEE overall summary for motors 250 hp (187 kW) and larger, United States and Canada, 1962
Number of plants in
sample size
Sample size (unit-years)
Number of failures reported
Equipment subclass
Failure rate (failures per unit-year)
Average hours down-time per
failure
Median hours down-time per
failure 46 1420 140 Induction 0.0986 78.0 70.0 53 600 31 Synchronous 0.0650 149.0 68.0
5.7.9.6 1994 IEEE PES survey of overhead transmission lines
The IEEE Power Engineering Society conducted an extensive survey of the outages of overhead transmission lines 230 kV and above in the United States and Canada (see Adler, et al. [B1]). This is included as Historical Reliability Data for IEEE 3006 Standards: Power System Reliability, page 258 and covers 230 kV, 345 kV, 500 kV, and 765 kV and includes both permanent and momentary outages. Line-caused outages have been separated from terminal-caused outages. Data are given on the type of fault that caused the outage. Faults can result in voltage sags at the entrance to industrial and commercial installations.
6. Part 3: Equipment reliability surveys conducted prior to 1976
6.1 Introduction
From 1973 to 1975, the Power Systems Reliability Subcommittee of the IEEE Industrial Power Systems Department conducted and published surveys of electrical equipment reliability in industrial plants (see IEEE Committee Reports [B11], [B13]) including circuit breakers, motor starters, disconnect switches, bus duct, open wire, cable, cable joints, and cable terminations. Those reliability surveys of electrical equipment and electric utility power supplies were extensive, collecting data such as:
52

IEEE Std 3006.8-2018 IEEE Recommended Practice for Analyzing Reliability Data for Equipment Used in Industrial and Commercial Power
Systems
a) Failure rate
b) Failure duration
c) Failure modes
d) Causes of failure
e) Failure repair method and failure repair urgency
f) Loss of motor load versus time of power outage
The section also discusses the maximum length of time of an interruption of electrical service that will not stop plant production, plant restart time after service is restored following a failure that caused a complete plant shutdown, and the cost of power interruptions to industrial plants and commercial buildings. In addition, the data show multiple utility interdependence and equipment failure versus quality of maintenance.
The preceding data was taken from the IEEE surveys of industrial plants (see Albrecht, et al. [B3] and the “Report of Equipment Availability for a 10 Year Period” [B33]) and commercial buildings (see O’Donnell [B28]). The detailed reports are given in Historical Reliability Data for IEEE 3006 Standards: Power System Reliability, pages 1, 61, 87, and 95. A later survey (IEEE Committee Report [B13]) of the reliability of switchgear bus is included in Historical Reliability Data for IEEE 3006 Standards: Power System Reliability. More recent surveys on transformers, large motors, cable, terminations, and splices are included in Historical Reliability Data for IEEE 3006 Standards: Power System Reliability, pages 114, 124, and 151, respectively. Recent surveys on circuit breakers are shown in Historical Reliability Data for IEEE 3006 Standards: Power System Reliability, pages 161 and 170. A 1989 survey on diesel and gas turbine generating units is included in Historical Reliability Data for IEEE 3006 Standards: Power System Reliability, page 187.
Clause 7 presents data for specific types of equipment according to Table 27.
53
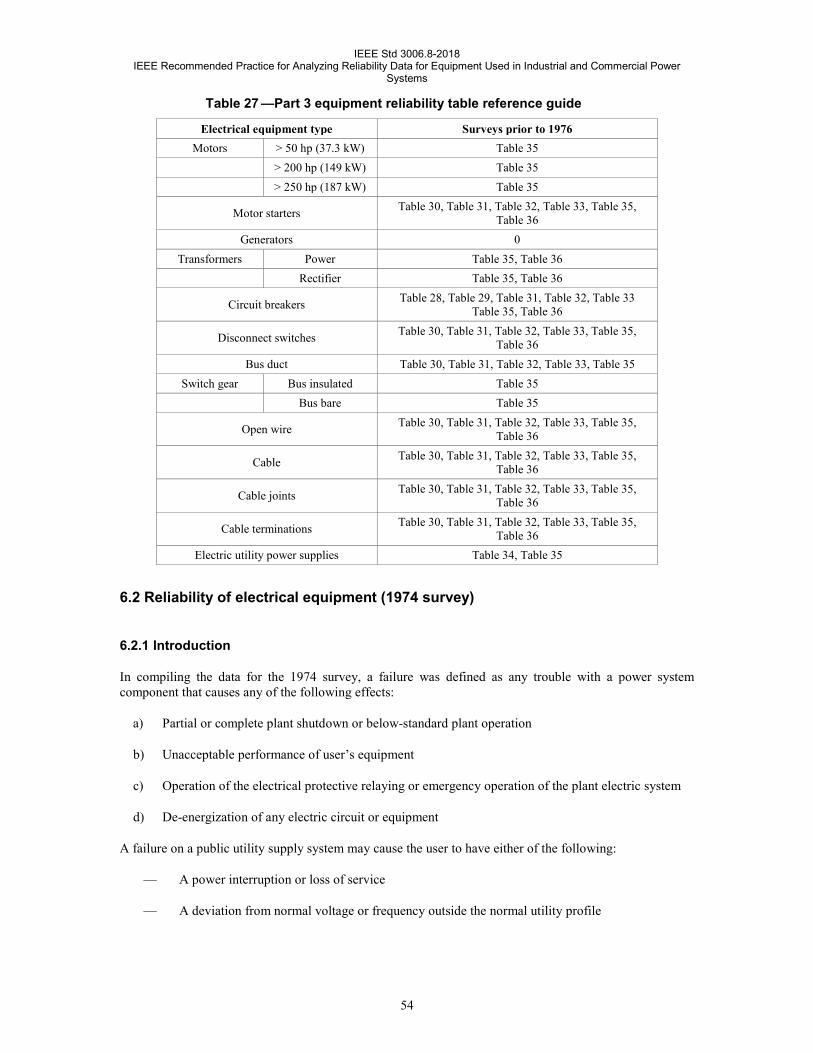
IEEE Std 3006.8-2018 IEEE Recommended Practice for Analyzing Reliability Data for Equipment Used in Industrial and Commercial Power
Systems
Table 27 —Part 3 equipment reliability table reference guide
Electrical equipment type Surveys prior to 1976 Motors > 50 hp (37.3 kW) Table 35
> 200 hp (149 kW) Table 35 > 250 hp (187 kW) Table 35
Motor starters Table 30, Table 31, Table 32, Table 33, Table 35, Table 36
Generators 0 Transformers Power Table 35, Table 36
Rectifier Table 35, Table 36
Circuit breakers Table 28, Table 29, Table 31, Table 32, Table 33 Table 35, Table 36
Disconnect switches Table 30, Table 31, Table 32, Table 33, Table 35, Table 36
Bus duct Table 30, Table 31, Table 32, Table 33, Table 35 Switch gear Bus insulated Table 35
Bus bare Table 35
Open wire Table 30, Table 31, Table 32, Table 33, Table 35, Table 36
Cable Table 30, Table 31, Table 32, Table 33, Table 35, Table 36
Cable joints Table 30, Table 31, Table 32, Table 33, Table 35, Table 36
Cable terminations Table 30, Table 31, Table 32, Table 33, Table 35, Table 36
Electric utility power supplies Table 34, Table 35
6.2 Reliability of electrical equipment (1974 survey)
6.2.1 Introduction
In compiling the data for the 1974 survey, a failure was defined as any trouble with a power system component that causes any of the following effects:
a) Partial or complete plant shutdown or below-standard plant operation
b) Unacceptable performance of user’s equipment
c) Operation of the electrical protective relaying or emergency operation of the plant electric system
d) De-energization of any electric circuit or equipment
A failure on a public utility supply system may cause the user to have either of the following:
— A power interruption or loss of service
— A deviation from normal voltage or frequency outside the normal utility profile
54

IEEE Std 3006.8-2018 IEEE Recommended Practice for Analyzing Reliability Data for Equipment Used in Industrial and Commercial Power
Systems
All of the electrical equipment categories listed in this section have eight or more failures. This is considered an adequate sample size (see Patton [B32]) in order to have a reasonable chance of determining a failure rate within a factor of 2. Failure rate and average downtime per failure data for an additional six categories of equipment are contained in IEEE Committee Report [B13] (Historical Reliability Data for IEEE 3006 Standards: Power System Reliability, page 1).
6.2.2 Failure modes of circuit breakers
6.2.2.1 Introduction
The failure modes of metal-clad drawout and fixed-type circuit breakers are shown in Table 28. Of primary concern to industrial plants is the large percentage of circuit breaker failures (i.e., 42%) that opened when they should not. This type of circuit breaker failure can significantly affect plant processes and may result in a total plant shutdown. Also, a large percentage (32%) of the circuit breakers failed while in service (not while opening or closing). Historical Reliability Data for IEEE 3006 Standards: Power System Reliability, pages 161 and 170, and the “Report on Power Circuit Troubles—1975” [B39] contain additional circuit breaker reliability information.
Table 28 —Failure modes of circuit breakersa (1974 survey)
All circuit
breakers %
Metal-clad drawout Fixed-typeb
Failure characteristics All %
0 V to 600 V 601 V to 15 000 V
%
All sizes %
0 V to 600 V, all
sizes %
All %
5 5 2 7 8 6 Failed to close when it should 9 12 21 0 0 2 Failed while opening
42 58 49 71 5 4 Opened when it should not 7 6 4 9 5 4 Damaged while successfully opening 2 1 0 0 0 4 Damaged while closing
32 16 24 10 77 32 Failed while in service (not while opening or closing)
1 0 0 0 0 2 Failed during testing or maintenance
1 2 0 3 0 0 Damage discovered during testing or maintenance
1 0 0 0 5 5 Other 100 100 100 100 100 100 Total percentage 166 117 53 59 39 48 Number of failures in total percentage
8 7 0 7 1 1 Number not reported 173 124 53 66 40 49 Total failures
a Historical Reliability Data for IEEE 3006 Standards: Power System Reliability, page 170 contains some limited data from a later IEEE survey. Historical Reliability Data for IEEE 3006 Standards: Power System Reliability, page 161 contains data for circuit breakers above 63 kV from a CIGRE 13-06 worldwide survey with a very large population. b Includes molded case.
6.2.2.2 Trip units on low-voltage breakers
Most modern low-voltage power circuit breakers are purchased with a solid-state trip unit rather than an electromechanical trip unit. Many older low-voltage breakers have been retrofitted with a solid-state trip
55

IEEE Std 3006.8-2018 IEEE Recommended Practice for Analyzing Reliability Data for Equipment Used in Industrial and Commercial Power
Systems
that replaced an electromechanical trip unit. A comparison has been made of the reliability of these two types of trip units based on a 1996 IEEE survey of low-voltage breaker operation as found during maintenance (see O’Donnell [B30]).
Electromechanical trip units had an unacceptable operation about twice as often as solid-state units. A summary of the most important results is given in Table 29. The complete results are included in Historical Reliability Data for IEEE 3006 Standards: Power System Reliability, page 266.
Table 29 —Survey of low-voltage power breaker operation as found during maintenance tests—electromechanical versus solid-state trip type unit; new solid state units versus
used (older) solid state units
Trip unit type Electromechanical Solid-state
Number of failures % Number of
failures %
Unacceptable operation Trip unit failed to operate 81 7.7 28 3.0 Trip unit out of specification 60 5.7 24 2.6 Mechanical operations (springs, arms/levers, hardened lubricant) 26 2.5 19 2.0
Power contacts (alignment, incorrect pressure, pitted) 25 2.4 19 2.0
Arc chutes (clean, replace/repair, chipped) 6 0.6 6 0.7 Auxiliary contacts 4 0.4 Total unacceptable 204 19.4% 100 10.7% Acceptable operation 850 80.6% 835 89.3% Total number of tests 1054 100.0% 935 100.0%
6.2.2.3 Failure characteristics of other electrical equipment
The failure characteristics of electrical equipment (excluding transformers and circuit breakers) are shown in Table 30. The dominant failure characteristic for this equipment is that it failed in service. A large percentage of the damage to motor starters (36%), disconnect switches (18%), and cable terminations (12%) was discovered during testing or maintenance.
Table 30 —Failure characteristics of other electrical equipment
Motor starters %
Disconnect switches %
Bus duct %
Open wire %
Cable %
Cable joint %
Cable terminations
% Failure characteristics
37 72 90 68 92 96 80 Failed in service 6 3 5 2 2 4 2 Failed during testing or maintenance
36 18 0 1 2 0 12 Damage discovered during testing or maintenance
20 6 5 6 3 0 6 Partial failure 2 1 0 23 1 0 0 Other
6.2.2.4 Causes and types of failures of electrical equipment
Table 31 shows the breakdown of the reported failures by damaged parts and failure type.
56

IEEE Std 3006.8-2018 IEEE Recommended Practice for Analyzing Reliability Data for Equipment Used in Industrial and Commercial Power
Systems
Table 31 —Failure, damaged part, and failure type (1974 survey)
Circuit breakers
%
Motor starters
%
Disconnect switches
%
Bus duct %
Open wire %
Cable %
Cable joints
%
Cable terminations
%
Failure, damaged part
0 5 0 15 0 5 0 0 Insulation— winding
2 0 1 10 1 0 0 12 Insulation— bushing
19 10 14 65 6 83 91 74 Insulation— other
1 0 0 0 0 3 0 0 Mechanical— bearings
11 16 9 0 0 0 0 0 Mechanical— other moving parts
6 2 30 0 4 1 0 4 Mechanical— other
6 13 8 0 3 1 0 0 Other electric— auxiliary device
28 2 1 0 3 1 0 0 Other electric— protective device
1 0 0 0 0 0 0 0 Tap changer— no load type
0 0 0 0 0 0 0 0 Tap changer— load type
26 52 37 10 83 6 9 10 Other Failure type
33 14 15 70 34 73 70 55 Flashover or arcing involving ground
10 20 4 30 23 1 9 4 All other flashover or arcing
19 55 47 0 25 7 20 37 Other electric defects
11 11 14 0 6 5 0 4 Mechanical defect
27 0 20 0 12 14 0 0 Other The data presented in Table 32 indicate that the respondents suspected inadequate maintenance and manufacturer-defective components were responsible for a significant percentage of the reported failures.
57

IEEE Std 3006.8-2018 IEEE Recommended Practice for Analyzing Reliability Data for Equipment Used in Industrial and Commercial Power
Systems
Table 32 —Suspected failure responsibility, failure-initiating cause, and failure-contributing cause
Circuit breakers
%
Motor starters
%
Disconnect switches
%
Bus duct %
Open wire %
Cable %
Cable joints
%
Cable terminations
%
Suspected failure
responsibility
23 18 29 26 0 16 0 0 Manufacturer- defective component
0 0 0 0 0 0 0 0 Transportation to site—defective handling
4 51 6 16 2 8 0 18 Application engineering— improper application
3 0 4 5 9 14 50 38 Inadequate installation
and testing prior to startup
23 8 13 16 30 10 18 32 Inadequate maintenance
6 3 39 0 2 3 0 0 Inadequate operating procedures
5 0 1 5 5 4 5 0 Outside agency— personnel
1 0 0 0 211 6 2 8 Outside agency— other
35 20 8 32 31 39 25 14 Other Failure-initiating cause
4 0 8 6 0 0 0 0 Persistent overloading
1 0 3 0 0 0 2 0 Above-normal temperature
0 0 1 0 0 0 0 0 Below-normal temperature
2 0 0 0 28 14 13 10 Exposure to
aggressive chemicals or solvents
0 0 0 17 1 8 22 12 Exposure to
abnormal moisture or water
0 0 0 0 3 2 0 0 Exposure to
nonelectrical fire or burning
0 0 0 0 0 1 0 0 Obstruction of
ventilation by objects or material
17 40 5 49 3 30 29 24 Normal deterioration from age
1 0 0 11 30 16 2 16
Severe wind, rain, snow, sleet, or other weather
conditions
2 0 0 0 1 0 0 0 Protective relay improperly set
1 2 0 0 0 0 0 0 Loss or deficiency
58
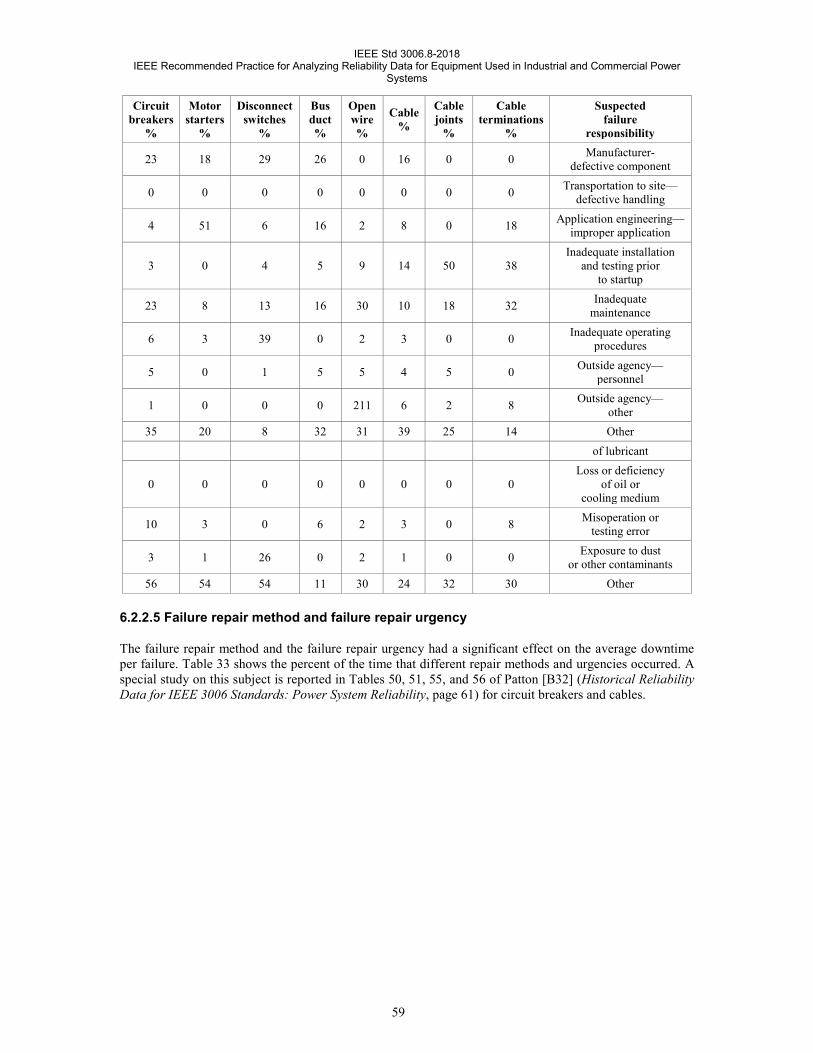
IEEE Std 3006.8-2018 IEEE Recommended Practice for Analyzing Reliability Data for Equipment Used in Industrial and Commercial Power
Systems
Circuit breakers
%
Motor starters
%
Disconnect switches
%
Bus duct %
Open wire %
Cable %
Cable joints
%
Cable terminations
%
Suspected failure
responsibility
23 18 29 26 0 16 0 0 Manufacturer- defective component
0 0 0 0 0 0 0 0 Transportation to site—defective handling
4 51 6 16 2 8 0 18 Application engineering— improper application
3 0 4 5 9 14 50 38 Inadequate installation
and testing prior to startup
23 8 13 16 30 10 18 32 Inadequate maintenance
6 3 39 0 2 3 0 0 Inadequate operating procedures
5 0 1 5 5 4 5 0 Outside agency— personnel
1 0 0 0 211 6 2 8 Outside agency— other
35 20 8 32 31 39 25 14 Other of lubricant
0 0 0 0 0 0 0 0 Loss or deficiency
of oil or cooling medium
10 3 0 6 2 3 0 8 Misoperation or testing error
3 1 26 0 2 1 0 0 Exposure to dust or other contaminants
56 54 54 11 30 24 32 30 Other
6.2.2.5 Failure repair method and failure repair urgency
The failure repair method and the failure repair urgency had a significant effect on the average downtime per failure. Table 33 shows the percent of the time that different repair methods and urgencies occurred. A special study on this subject is reported in Tables 50, 51, 55, and 56 of Patton [B32] (Historical Reliability Data for IEEE 3006 Standards: Power System Reliability, page 61) for circuit breakers and cables.
59

IEEE Std 3006.8-2018 IEEE Recommended Practice for Analyzing Reliability Data for Equipment Used in Industrial and Commercial Power
Systems
Table 33 —Failure repair method and failure repair urgency (1974 survey)
Circuit breaker
%
Motor starters
%
Disconnect switches
%
Bus duct %
Open wire %
Cable %
Cable joints
%
Cable terminations
% Failure repair method
51 33 30 66 70 47 87 60 Repair of failed
component in place or sent out for repair
49 67 70 35 9 53 13 34 Repair by replacement of
failed component with spare
0 0 0 0 21 0 0 0 Other Failure repair urgency
73 66 20 80 55 66 56 53 Requiring round-the-clock all-out efforts
22 34 80 15 26 28 22 31
Requiring repair work only during regular
workday, perhaps with overtime
5 0 0 5 0 6 22 16 Requiring repair work on a non-priority basis
0 0 0 0 19 0 0 0 Other
6.2.2.6 Reliability of electric utility power supplies to industrial plants
The failure rate and the average downtime per failure of electric utility supplies to industrial plants are given in Table 34. Additional details are given in Historical Reliability Data for IEEE 3006 Standards: Power System Reliability, and page 95 of the paper “Report on Equipment Availability for 10 Year Period 1965-74” [B33]. A total of 87 plants participated in the IEEE survey covering the period from 1 January 1968 through October 1974.
60

IEEE Std 3006.8-2018 IEEE Recommended Practice for Analyzing Reliability Data for Equipment Used in Industrial and Commercial Power
Systems
Table 34 —IEEE survey of reliability of electric utility supplies to industrial plants (IEEE Committee report, 1975 survey)
Failures per unit-yeara Average duration (minutes per failure)a
λΣ λΡ λ rS rR r Single-circuit utility supplies
Voltage level V ≤ 15 kV 0.905 2.715 3.621 3.5 165 125 15 kV < V ≤ 35 kV 1.657 1.657 57 57 V > 35 kV 0.527 0.843 1.370 59 37 All 0.556 1.400 1.956 2.3 110 79
Multiple-circuit utility supplies (all voltage levels) Switching scheme All breakers closed 0.255 0.057 0.312 8.5 130 31 Manual throw-over 0.732 0.118b 0.850 8.1 84b 19 Automatic throw-over 1.025 0.171 1.196 0.6 96 14 All 0.453 0.085 0.538 5.2 110 22
Multiple-circuit utility supplies (all switching schemes) Voltage level V ≤ 15 kV 0.640 0.148 0.788 4.7 149 32 15 kV < V ≤ 35 kV 0.500 0.064b 0.564 4.0 115b 17 V > 35 kV 0.357 0.067 0.424 6.1 184 34
Multiple-circuit utility supplies (all circuit breakers closed) Voltage level V ≤ 15 kV 0.175 0.088b 0.263 0.7 335b 112 15 kV < V ≤ 35 kV 0.342 0.019b 0.361 7.0 120b 13 V > 35 kV 0.250 0.061 0.311 11.0 203 49 a Failure rates λS and λR and average durations rS and rR are, respectively, rates and durations of failures terminated by switching and by repair or replacement. Unsubscripted rates and durations are overall values. b Small sample size; fewer than eight failures.
The survey results shown in Table 34 have distinguished between power failures that were terminated by a switching operation and those requiring repair or replacement of equipment. The latter have a much longer outage duration time. Some of the conclusions that can be drawn from the IEEE data are:
a) The failure rate for single-circuit supplies is about 6 times that of multiple-circuit supplies thatoperate with all circuit breakers closed, and the average duration of each outage is about 2.5 timesas long.
b) Failure rates for multiple-circuit supplies that operate with either a manual or an automatic throw-over scheme are comparable to those for single-circuit supplies, but throw-over schemes have asmaller average failure duration than single-circuit supplies.
c) Failure rates are highest for utility supply circuits operated at distribution voltages and lowest forcircuits operated at transmission voltages (greater than 35 kV).
It is important to note that the data in Table 34 shows that the two power sources of a double-circuit utility supply are not completely independent. This is analyzed in an example, where (for the one case analyzed)
61

IEEE Std 3006.8-2018 IEEE Recommended Practice for Analyzing Reliability Data for Equipment Used in Industrial and Commercial Power
Systems
the actual failure rate of a double-circuit utility supply is more than 200 times larger than the calculated value for two completely independent utility power sources.
Utility supply failure rates vary widely in various locations. One of the significant factors in this difference is believed to be different exposures to lightning storms. Thus, average values for the utility supply failure rate may not be appropriate for use at any one location. Local values should be obtained, if possible, from the utility involved, and these values should be used in reliability and availability studies.
An earlier IEEE reliability survey of electric power supplies to industrial plants was published in 1973 and is reported in Table 3 of Albrecht, et al. [B3] (Historical Reliability Data for IEEE 3006 Standards: Power System Reliability, page 1). The earlier survey had a smaller database and is not believed to be as accurate as the one summarized in Table 35.
6.2.2.7 Method of electrical service restoration to plant
The 1973-1975 IEEE data on method of electrical service restoration to plant is shown in Table 35.
The most common methods of service restoration to a plant are replacement of a failed component with a spare or the repair of the failed component. The primary selection or secondary selection is used only 22% of the time. This would indicate that most power distribution systems in this IEEE survey were radial.
62

IEEE Std 3006.8-2018 IEEE Recommended Practice for Analyzing Reliability Data for Equipment Used in Industrial and Commercial Power Systems
Table 35 —Method of service restoration (1974 survey)
Total
Electric utilities power
supplies
Trans-formers
Circuit breakers
Motor starters Motors Generators Disconnect
switches
Switch gear bus: Insulated
Switch gear bus:
Bare
Bus duct
Open wire Cable Cable
joints Cable
terminations
Method of service
restoration
7% 1% 3% 6% 0% 5% 20% 0% 58% 25% 20% 13% 14% 28% 19% Primary selective— manual
2% 8% 0% 1% 0% 0% 0% 0% 0% 5% 0% 4% 5% 8% 0% Primary selective— automatic
11% 1% 25% 6% 0% 14% 33% 0% 17% 10% 10% 2% 20% 32% 23% Secondary selective— manual
2% 1% 3% 8% 0% 0% 0% 0% 0% 0% 0% 1% 0% 8% 4% Secondary selective— automatic
0+% 0% 0% 0% 0% 0% 0% 0% 0% 5% 0% 0% 0% 0% 0%
Network protector operation— automatic
22% 5% 25% 11% 12% 30% 20% 3% 17% 20% 35% 31% 42% 24% 27% Repair of failed component
22% 2% 39% 38% 10% 29% 14% 77% 0% 10% 35% 6% 2% 0% 12% Replacement of failed component
12% 81% 0% 1% 0% 0% 13% 0% 0% 0% 0% 1% 1% 0% 0% Utility service restored
22% 1% 5% 29% 78% 22% 0% 20% 8% 25% 0% 42% 16% 0% 15% Other 100% 100% 100% 100% 100% 100% 100% 100% 100% 100% 100% 100% 100% 100% 100% Total %
1204 171 75 160 68 318 15 69 12 20 20 103 122 25 25 Total number reported
63

IEEE Std 3006.8-2018 IEEE Recommended Practice for Analyzing Reliability Data for Equipment Used in Industrial and Commercial Power
Systems
6.2.2.8 Equipment failure rate multiplier versus maintenance quality
The relationship between maintenance practice and equipment failures for transformers, circuit breakers, and motors is discussed in detail in IEEE Std 3006.4. These multipliers were determined in a special study (Part 6 of Patton [B32]) (Historical Reliability Data for IEEE 3006 Standards: Power System Reliability, page 61). The failure rate of motors is very sensitive to the quality of maintenance.
The percentage of failures due to inadequate maintenance versus the time since maintained is given in IEEE Std 3006.4 for circuit breakers, motors, open wire, transformers, and all electrical equipment classes combined. A high percentage of electrical equipment failures were blamed on inadequate maintenance if there had been no maintenance for more than two years prior to the failure.
6.2.2.9 Reliability improvement of electrical equipment in industrial plants between 1962 and 1973
The failure rates for electrical equipment (except for motor starters) in industrial plants appeared to have improved considerably during the 11-year interval between the 1962 AIEE reliability survey (see Dickinson [B6]) and the 1973-1974 IEEE reliability survey (see IEEE Committee Report [B13]). Table 36 shows how much the failure rates had improved for several equipment categories. These data are calculated from a 1974 report (Albrecht, et al. [B2]). In 1962, circuit breakers had failure rates that were 2.5 to 6.0 times higher than those reported in 1973. The largest improvements in equipment failure rates have occurred on cables and circuit breakers. The authors discussed some of the reasons for the failure rate improvements during the 11-year interval. It would appear that manufacturers, application engineering, installation engineering, and maintenance personnel have all contributed to the overall reliability improvement.
64

IEEE Std 3006.8-2018 IEEE Recommended Practice for Analyzing Reliability Data for Equipment Used in Industrial and Commercial Power
Systems
Table 36 —Failure rate improvement factor of electrical equipment in industrial plants during the 11-year interval between the 1962 AIEE survey and the 1973 IEEE survey
Equipment category Failure rate ratio
AIEE (1962) IEEE (1973)
Cable Nonleaded in underground conduit 9.7 Nonleaded, aerial 5.8 Lead covered in underground conduit 3.4 Nonleaded in aboveground conduit 1.6
Cable joints and terminations Nonleaded 5.3 Leaded 2.0
Circuit breakers Metal-clad drawout, 0 V to 600 V 6.0 Metal-clad drawout, above 600 V 2.9 Fixed 2.4 kV to 15 kV 2.5
Disconnect switches Open, above 600 V 3.4 Enclosed, above 600 V 1.6 Open wire 3.4
Transformers Below 15 kV, 0 kVA to 500 kVAa 2.0 Below 15 kV, above 500 kVA 2.0 Above 15 kV 1.6
Motor starters, contactor type 0 V to 600 V 1.3 Above 600 V 1.3 a 300 kVA to 750 kVA for 1973.
The authors also make a comparison between the surveys of the actual downtime per failure for all the equipment categories shown in the table in IEEE Committee Report [B13]. In general, the actual downtime per failure was larger in 1973 than in 1962.
6.2.2.10 Loss of motor load versus time of power outage
A special study was reported in Table 47 of IEEE Committee Report [B13] (Historical Reliability Data for IEEE 3006 Standards: Power System Reliability, page 61) on loss of motor load versus duration of power outages. When the duration of power outages is longer than 10 cycles, most plants lose motor load. However, when the duration of power outages is between one and 10 cycles, only about one-third of the plants lose their motor load.
Test results of the effect of fast bus transfers on load continuity are reported in Averill [B5]. This includes 4 kV induction and synchronous motors with the following type of loads:
a) Forced draft fan
b) Circulating water pump
65

IEEE Std 3006.8-2018 IEEE Recommended Practice for Analyzing Reliability Data for Equipment Used in Industrial and Commercial Power
Systems
c) Boiler feed booster pump
d) Condensate pump
e) Gas recirculation fan
A list of prior papers on the effect of fast bus transfer on motors is also contained in Albrecht, et al. [B3].
6.2.2.11 Critical service loss duration time
What is the maximum length of time that an interruption of electrical service will not stop plant production? The median value for all plants is 10.0 s. See Table 2-3 in IEEE Std 3006.2-2016 for a summary of the IEEE survey of industrial plants.
What is the maximum length of time before an interruption to electrical service is considered critical in commercial buildings? The median value of all commercial buildings is between 5 min and 30 min. See Table 2-3 in IEEE Std 3006.2-2016 for a summary of the IEEE survey of commercial buildings.
6.2.2.12 Plant restart time
What is the plant restart time after service is restored following a failure that has caused a complete plant shutdown? The median value for all plants is 4.0 h. See Table 2-4 in IEEE Std 3006.2-2016 for a summary of the IEEE survey of industrial plants.
6.2.2.13 Other sources of reliability data
The reliability data from industrial plants that are summarized are based upon IEEE Committee Report [B16], which was published during 1973-1975. Dickinson’s report [B6] is an earlier reliability survey of industrial plants that was published in 1962.
Many sources of reliability data on similar types of electrical equipment exist in the electric utility industry. The Edison Electric Institute (EEI) has collected and published reliability data on power transformers, power circuit breakers, metal-clad switchgear, motors, excitation systems, and generators (see EEI Publications [B33], [B34], [B35], [B36], [B37], [B38], [B39]). Most EEI reliability activities do not collect outage duration time data. The North American Electric Reliability Council (NERC) collects and publishes reliability and availability data on generation prime mover equipment.
Failure rate data and outage duration time data for power transformers, power circuit breakers, and buses are given in Patton [B32]. These data have come from electric utility power systems.
Very little other published data is available on failure modes of power circuit breakers and on the probability of a circuit breaker not operating when called upon to do so. An extensive worldwide reliability survey of the major failure modes of power circuit breakers above 63 kV on utility power systems has been made by the CIGRE 13-06 Working Group as shown in Historical Reliability Data for IEEE 3006 Standards: Power System Reliability, page 161. Failure rate data and failure per operating cycle data have been determined for each of the major failure modes. Outage duration time data has also been collected. In addition, data has been collected on the costs of scheduled preventive maintenance; this includes the hours of labor per circuit breaker per year and the cost of spare parts consumed per circuit breaker per year.
IEEE Std 500-1984 [B18] is a reliability data manual for use in the design of nuclear power generating stations. The equipment failure rates therein cover such equipment as annunciator modules, batteries and chargers, blowers, circuit breakers, switches, relays, motors and generators, heaters, transformers, valve
66

IEEE Std 3006.8-2018 IEEE Recommended Practice for Analyzing Reliability Data for Equipment Used in Industrial and Commercial Power
Systems
operators and actuators, instruments, controls, sensors, cables, raceways, cable joints, and terminations. No information is included on equipment outage duration times.
The Institute of Nuclear Power Operations (INPO) organization operates the Nuclear Plant Reliability Data System (NPRDS), which collects failure data on electrical components in the safety systems of nuclear power plants. Outage duration time data is collected on each failure. The NPRDS database contains more details than IEEE Std 500-1984, but INPO has followed a policy of not publishing its data.
Very extensive reliability data have been collected for electrical and mechanical equipment used on offshore platforms in the North Sea and the Adriatic Sea (see OREDA-92 [B31]). This includes generators, transformers, inverters, rectifiers, circuit breakers, protection equipment, batteries, battery chargers, valves, pumps, heat exchangers, compressors, gas turbines, sensors, cranes, etc. Data have been published on failure rates, number of demands, failures per demand, repair time, and hours of repair labor. Ten oil companies have participated in this data collection over a period of nine years.
67

IEEE Std 3006.8-2018 IEEE Recommended Practice for Analyzing Reliability Data for Equipment Used in Industrial and Commercial Power
Systems
Annex A
(informative)
Bibliography
Bibliographical references are resources that provide additional or helpful material but do not need to be understood or used to implement this standard. Reference to these resources is made for informational use only.
[B1] Adler, R. B., et al., “An IEEE survey of U.S. and Canadian overhead transmission outages at 230 kV and above,” IEEE Transactions on Power Delivery, vol. 9, no. 1, pp. 21-39, January 1994, http://dx.doi.org/10.1109/61.277677.1,2
[B2] Albrecht, P. F., et al., “Assessment of the reliability of motors in utility applications,” IEEE Transactions on Energy Conversion, vol. EC-2, no. 9, pp. 396-406, September 1987, http://dx.doi.org/10.1109/TEC.1987.4765865.
[B3] Albrecht, P. F., et al., “Assessment of the reliability of motors in utility application—updated,” IEEE Transactions on Energy Conversion, vol. EC-1, no. 3, pp. 39-46, March 1986, http://dx.doi.org/10.1109/TEC.1986.4765668.
[B4] Aquilino, J. W., “Report of transformer reliability survey—industrial plants and commercial buildings,” IEEE Transactions on Industry Applications, vol. IA-19, no. 5, pp. 858-866, September/October 1983, http://dx.doi.org/10.1109/TIA.1983.4504299.
[B5] Averill, E. L., “Fast transfer test on power station auxiliaries,” IEEE Transactions on Power Apparatus and Systems, vol. PAS-96, no. 3, pp. 1004-1009, May/June 1977, http://dx.doi.org/10.1109/T-PAS.1977.32415.
[B6] Dickinson, W. H., “Report of reliability of electrical equipment in industrial plants, part II: Application and industry,” Transactions of the American Institute of Electrical Engineers, vol. 81, no. 3, pp. 132-151, July 1962.
[B7] Ekstrom, T. E., “Reliability/availability guarantees of gas turbine and combined cycle generating units,” Proceedings of 1994 IEEE Industry Applications Society Annual Meeting, Oct. 2-5, 1994, Denver, CO, pp. 2209-2225.
[B8] Heising, C. R., et al., “Summary of CIGRE 13-06 Working Group world wide reliability data and maintenance cost data on high voltage circuit breakers above 63 kV,” Proceedings of 1994 IEEE Industry Applications Society Annual Meeting, Oct. 2-5, 1994, Denver, CO, pp. 2226-2234.
[B9] IEEE Committee Report, “Cost of electrical interruptions in commercial buildings,” IEEE-ICPS Technical Conference Record, 75-CH0947-1-1A, Toronto, Canada, May 5-8, 1975, pp. 124-129.
[B10] IEEE Committee Report, “Reasons for conducting a new reliability survey on power, rectifier, and arc-furnace transformers,” IEEE-ICPS Technical Conference Record, May 1979, pp. 70-75.
[B11] IEEE Committee Report. “Reliability of electric utility supplies to industrial plants,” IEEE-ICPS Technical Conference Record, 75-CH0947-1-1A, Toronto, Canada, May 5-8, 1979, pp. 70-75.
[B12] IEEE Committee Report, “Report of generator reliability survey of industrial plants and commercial buildings,” IEEE-ICPS Technical Conference Record, CH1543-8-1A, May 1980, pp. 40-44.
1 The IEEE standards or products referred to in Annex A are trademarks owned by The Institute of Electrical and Electronics Engineers, Incorporated. 2 IEEE publications are available from The Institute of Electrical and Electronics Engineers (http://standards.ieee.org/).
68
IEEE Std 3006.8-2018 IEEE Recommended Practice for Analyzing Reliability Data for Equipment Used in Industrial and Commercial Power
Systems
[B13] IEEE Committee Report, “Report on reliability survey of industrial plants, Parts 1-6,” IEEE Transactions on Industry Applications, Mar./Apr. 1974, pp. 213-252; Jul./Aug. 1974, pp. 456-476; Sep./Oct. 1974, p. 681.
[B14] IEEE Std 141™, IEEE Recommended Practice for Electric Power Distribution for Industrial Plants (IEEE Red Book™).
[B15] IEEE Std 242™, IEEE Recommended Practice for Protection and Coordination of Industrial and Commercial Power Systems (IEEE Buff Book™).
[B16] IEEE Std 315™, IEEE Standard Graphic Symbols for Electrical and Electronics Diagrams.
[B17] IEEE Std 493™, IEEE Recommended Practice for the Design of Reliable Industrial and Commercial Power Systems (IEEE Gold Book™).
[B18] IEEE Std 500™-1984 (Reaff 1991), IEEE Guide to the Collection and Presentation of Electrical, Electronic, Sensing Component, and Mechanical Equipment Reliability Data for Nuclear-Power Generating Stations.
[B19] IEEE Std 841™-2001, IEEE Standard for the Petroleum and Chemical Industry—Severe Duty Totally Enclosed Fan-Cooled (TEFC) Squirrel Cage Induction Motors—Up to and Including 370 kw (500 hp).
[B20] IEEE Std 1366™, IEEE Guide for Electric Power Distribution Reliability Indices.
[B21] IEEE Std 3006.3™-2017, IEEE Recommended Practice for Determining the Impact of Preventative Maintenance on the Reliability of Industrial and Commercial Power Systems.
[B22] IEEE Std 3006.5™, IEEE Recommended Practice for Use of Probability Methods for Conducting Reliability Analysis of Industrial and Commercial Power Systems.
[B23] IEEE Std 3006.9™-2013, IEEE Recommended Practice for Collecting Data for Use in Reliability, Availability, and Maintainability Assessments of Industrial and Commercial Power Systems.
[B24] IEEE Std 3007.1™, Recommended Practice for the Operation and Management of Industrial and Commercial Power Systems.
[B25] IEEE Std 3007.2™, Recommended Practice for the Maintenance of Industrial and Commercial Power Systems.
[B26] McWilliams, D. W., A. D. Patton, and C. R. Heising, “Reliability of electrical equipment in industrial plants—Comparison of results from 1959 survey and 1971 survey,” IEEE-ICPS Technical Conference Record, 74CH0855-71A, Denver, CO, Jun. 2-6, 1974, pp. 105-112.
[B27] NSWC 11, “The Handbook of Reliability Prediction Procedures for Mechanical Equipment,” published by the Naval Surface Warfare Center (Carderock Division), May 2011.
[B28] O’Donnell, P., “Report of large motor reliability survey of industrial plants and commercial buildings,” IEEE Transactions on Industry Applications, Parts 1 and 2, Jul./Aug. 1985, pp. 853-872; Part 3, Jan./Feb. 1987, pp. 153-158.
[B29] O’Donnell, P., “Report of switchgear bus reliability survey of industrial plants,” IEEE Transactions on Industry Applications, vol. IA-15, no. 2, pp. 141-147, March/April 1979, http://dx.doi.org/10.1109/TIA.1979.4503629.
[B30] O’Donnell, P., “Survey of lower voltage breakers as found during maintenance,” IEEE Industrial and Commercial Power Systems Technical Conference, 6-9 May, 1996, New Orleans, LA.
[B31] OREDA-92, Offshore Reliability Data Handbook, 2nd ed. Norway: OREDA, 1992.
[B32] Patton, A. D., “Determination and analysis of data for reliability studies,” IEEE Transactions on Power Apparatus and Systems, vol. PAS-87, no. 1, pp. 84-100, January 1968, http://dx.doi.org/10.1109/TPAS.1968.292260.
69
IEEE Std 3006.8-2018 IEEE Recommended Practice for Analyzing Reliability Data for Equipment Used in Industrial and Commercial Power
Systems
[B33] “Report on Equipment Availability for 10 Year Period 1965-74,” EEI Publication no. 75-50 (Prime Mover Generation Equipment).3
[B34] “Report on Excitation System Troubles—1975,” EEI Publication no. 76-78, Dec. 1976. (Later data have also been published.)
[B35] “Report on Generator Troubles—1975, “EEI Publication no. 76082, Dec. 1976. (Later data have also been published.)
[B36] “Report on Metalclad Switchgear Troubles—1975,” EEI Publication no. 76-82, Dec. 1976. (Later data have also been published.)
[B37] “Report on Motor Troubles—1975,” EEI Publication no. 76-79, Dec. 1976. (Later data have also been published.)
[B38] “Report on Power Transformer Troubles—1975,” EEI Publication no. 76-80, Dec. 1976. (Later data have also been published.)
[B39] “Report on Power Circuit Troubles—1975,” EEI Publication no. 76-81, Dec. 1976. (Later data have also been published.)
[B40] “Summary of Replies to the 1982 Technical Questionnaire on Rotating Machinery (Motors 1000 hp and Up),” unpublished report at Doble Conference, Apr. 1982, Boston, MA.
3 These data are now collected and published by the North American Electric Reliability Council (NERC). NERC publications are available from the North American Electric Reliability Corporation (http://www.nerc.com/).
70

IEEE standards.ieee.orgPhone: +1 732 981 0060 Fax: +1 732 562 1571 © IEEE