IEA HEV “Life Cycle Assessment of Electric Vehicles”...
64
www.joanneum.at/life IEA HEV “Life Cycle Assessment of Electric Vehicles” and “Battery Electric Busses” Strategies to Maximize Environmental Benefits of Electric Vehicles Using Life Cycle Assessment Gerfried Jungmeier International Conference on Electric Mobility and Public Transport Santiago, Chile, May 10 – 11, 2017
Transcript of IEA HEV “Life Cycle Assessment of Electric Vehicles”...

www.joanneum.at/life
IEA HEV “Life Cycle Assessment of Electric Vehicles” and “Battery Electric Busses”
Strategies to Maximize Environmental Benefits
of Electric Vehicles Using Life Cycle
Assessment
Gerfried Jungmeier
International Conference on Electric Mobility and Public Transport
Santiago, Chile, May 10 – 11, 2017

Challenges for the Successful Market Introduction of Electric-Vehicles
Additional
renewable
electricity
Electric-vehicles
1) On the market available
2) Substituting gasoline&diesel
Charging infrastructure
The consumer
Monitoring:
Electricity, emissions

Statement on Environmental Assessment of Electric Vehicles
“There is international consensus that the
environmental effects of electric vehicles can
only be analyzed on the basis of
Life Cycle Assessment (LCA)
including the production, operation and the end
of life treatment of the vehicles”
“….and in comparison to conventional
vehicles”

Assessment of LCA-Aspects over Full Value Chain
Transportation service
„End of life management“
Dismantling of vehicle
Primary Energy
Electricity production
Electricity grid
Charging infrastructure
Electric vehicle
Production
of vehicle
Production
of battery

The 2 Keys: Renewable Energy &Energy Efficiency
0 300 200 100 900 400 500 600 700 800
Energy consumption of bus [kWh/100km]
0
500
1,000
1,500
2,000
2,500
3,000
Gre
en
ho
us
e g
as
em
iss
ion
s
[g C
O2-e
q/k
m]
Diesel,
incl.
biofuel
blending
Electricity hydro power
Electricity
natural gas
Source: LCA of busses, Joanneum Research
Internal combustion engine and battery electric bus
Electricity PV incl. storage
Electricity
coal
Electricity wind

Inventory Analysis
Solid waste
e.g. ash
Liquid emissions
e.g. waste water
Gaseous emissions
e.g. CO, CO2, NOx, PM
Others e.g. noise
odour, radiation
Area: agriculture,
forestry, industry, transport
Resources: renewable,
non renewable
Primery energy: re-
newable, non renewable
construct.
production
operation
use
dismantling
End of life
Products
services
INPUT OUTPUT

Sustainability in the Life Cycle based on Whole Value Chain
Environment Economy Society
Resources
&
raw materials
Products
&
services
Environmental, economic and social assessment of
sustainability based on scientific indicators

Examples of Sustainability Indicators in LCSA
Environment GHG emissions (t CO2-eq/a) Primary energy demand (GJ/a) (biomass, renewable, fossil, others) Area demand (ha/a)
Economy Production costs (€/a) Revenues from products (€/a) Value added (€/a) Employment (persons/a) Trade balance (€/a)
Society Workers Consumers Local community Society Value chain actors (excl. consumers)

Content
9
Introduction
Activities in IEA
HEV
Example Austria
Global EV Fleet
Conclusions

Overview
Introduction
Activities of Task 30 „Assessment of Environmental Effects of Electric Vehicles” (2016 – 2019)
Activities on Special IEA-HEV Project „Facts and Figures on Environmental benefits of EVs“ (2016)
Results of Task 19 „Life Cycle Assessment of Electric Vehicles - From raw material resources to waste management of vehicles with an electric drivetrain” (2011 – 2015)

Task 30 “Assessment of Environmental Effects of
Electric Vehicles”
Water
Air
Land use - resource
consumption - waste
management
Overall environmental effects
and their assessment

Development of Impact Assessment 12
Source: JOANNEUM RESEARCH 2015
2015
> 2020

Results documented in Glossy Brochure
Assessment of
Environmental Effects
of Electric Vehicles
IEA HEV Task xx
2016 - 2018
F. Austria (eds) with contributions from: A. Belgium, M.
Canada, J. Denmark, J. Finland , F. France, H.
Germany, W. Ireland, O. Italy, T. Netherlands, K.
Portugal, S. Switzerland, U. Sweden, R. Turkey, U.
Kingdom, U. States
December 20189
Content 1. Methodologies on assessment on environmental
effects
2. Frequently asked questions
3. Overview on international studies/literature
4. Analyses of current knowledge and future challenges
5. Communication strategies to stakeholders
6. Analyses of necessary and available data
7. Overview & involvement of key actors & stakeholders
8. R&D demand
9. State of current knowledge and future challenges -
methodologies and case studies
Effects of electric vehicles on water
Effects of electric vehicles on Land use –
resources – waste
Effects of electric vehicles on air
Conclusions and outlook “…from LCA to
LCSA…”
Overall environmental effects and their
assessment of EVs
Documentation: proceedings, reports, papers, notes,
presentations

Time Planing of next steps: 2016 – 2019
2016 2017 2018
Kick-off meeting
WS I: „Effects of EVs
on water“, Graz/AUSTRIA 01/2017
WS II: „Effects of EVs on air“,
Stuttgart/GERMANY, 01/2018
WS III: „Effects of EVs on land
use/resources/waste“, Washington/USA 06/2018
Final Results
of Task
2019
WS IV:“Overall environmental assessment
of EVs”, Barcelona/Spain 05/2019
As decided in 2nd internal meeting Graz, January 13, 2017

Activities 2016
Kick-off meeting detailled specification of aims and role of partners
Expert Workshop “Water”
Basis existing methodology&data&case studies
Identification of main issues
Identification of “hot spots” on water issues in process chain of EVs, PHEVs and conventional ICEs
Findings and Recommendations on e.g. Methodology
“Blue & Green Water”: water consumption, water as resource
“Grey Water”: emissions to water and waste water
“Water Footprint” of Evs
Place&date: to be decided – and invitations?

Water Issues of EVs&ICE – Main Issues?
1. Where in the value chain of EVs and ICE are water issues most relevant?
2. What are these most relevant water issues?
3. What are main methodological aspects to judge on water issues?
4. What are main relevant water impact categories? E.g. blue, green?
5. What is the “Water footprint”? And its relevance compared to “Carbon Footprint”?
6. Which data on water do we need to asses these main issues?
7. What are the main research questions on water issues of EVs and ICE?
8. What are main institutions and publications on water issues of EVs and ICE?
9. What could be a common activity on water issues in IEA HEV Task 30?

Cooling water consumption of thermoelectric generation by utility regions in the USA
Source: Elgowainy 2017

Water Consumption of Main Power Production Technologies
Source: Pfister et al. 2011
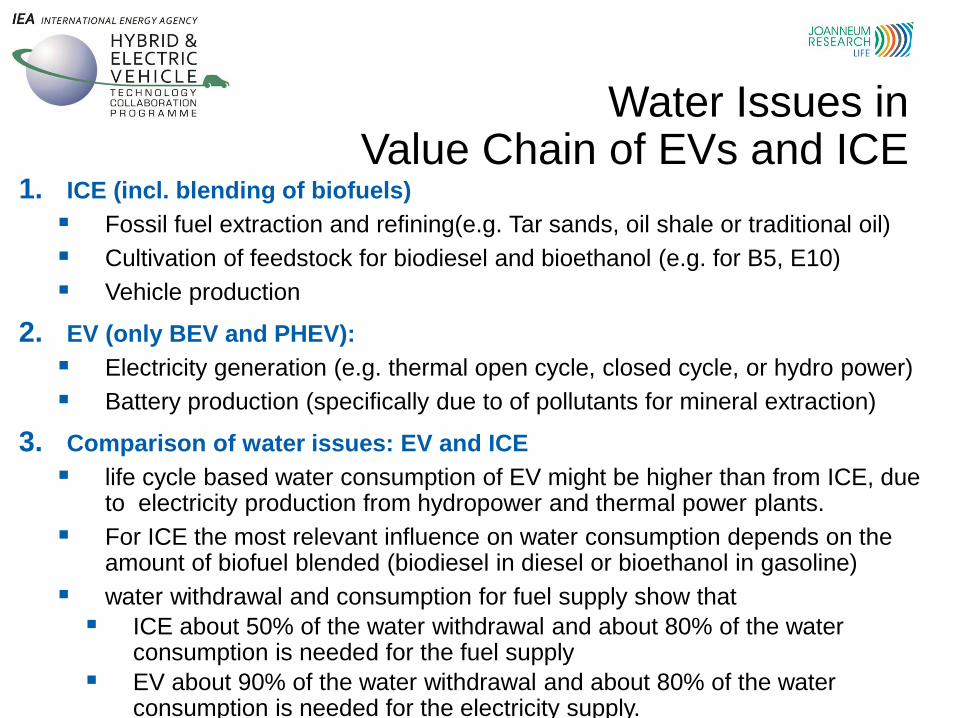
Water Issues in Value Chain of EVs and ICE
1. ICE (incl. blending of biofuels)
Fossil fuel extraction and refining(e.g. Tar sands, oil shale or traditional oil)
Cultivation of feedstock for biodiesel and bioethanol (e.g. for B5, E10)
Vehicle production
2. EV (only BEV and PHEV):
Electricity generation (e.g. thermal open cycle, closed cycle, or hydro power)
Battery production (specifically due to of pollutants for mineral extraction)
3. Comparison of water issues: EV and ICE
life cycle based water consumption of EV might be higher than from ICE, due to electricity production from hydropower and thermal power plants.
For ICE the most relevant influence on water consumption depends on the amount of biofuel blended (biodiesel in diesel or bioethanol in gasoline)
water withdrawal and consumption for fuel supply show that
ICE about 50% of the water withdrawal and about 80% of the water consumption is needed for the fuel supply
EV about 90% of the water withdrawal and about 80% of the water consumption is needed for the electricity supply.

Results of Task 19 „Life Cycle Assessment of Electric Vehicles” (2011 – 2015) 20
5 documented Workshops:
1.LCA Methodology and Case Studies of Electric Vehicles,
Braunschweig, Germany, December 7, 2012
2.LCA of Vehicle and Battery Production, Chicago, Illinois, United
States, April 26, 2013.
3.Recovery of Critical Metals from Vehicles with an Electric
Drivetrain, Davos, Switzerland, 9–10, 2013
4.LCA Aspects of Electricity Production, Distribution and
Charging Infrastructure for Electric Vehicles, Barcelona, Spain,
October 15 - 16, 2014.
5.LCA of Electric Vehicles – Current Status and Future
Perspectives, Vienna, Austria, November 11, 2015

The 7 Key Issues in LCA of EVs
Broad AGREEMENT on methodology
1) General issues: state of technology, heating&cooling of vehicle
2) Life cycle modeling: end of life, data quality, allocation, life time
3) Vehicle Cycle: production–use–end of life e.g. energy demand of vehicle
4) Fuel Cycle (electricity production): PV with storage
5) Inventory analysis: CO2, MJ, kg <-> CSB5 waste water, heavy metals
6) Impact assessment: GHG, primary energy <-> biodiversity, toxicity
7) Reference system: vehicle size, driving range, ≤ 100% substitution?
Source: G. Jungmeier, J. B. Dunn, A. Elgowainy, L. Gaines, S. Ehrenberger, E. D. Özdemir, H. J. Althaus, R.
Widmer: Life cycle assessment of electric vehicles – Key issues of Task 19 of the International Energy
Agency (IEA) on Hybrid and Electric Vehicles (HEV), TRA 2014 – Transport Research Arena 2014, Paris,
France, April 14-17, 2014.
Example: 66,000 BEV in Norway (Norsk elbil forening 2015)
85% substitute „fossil driven“ ICE
kilometres“
15% substitute walking, bicycling, public
transport and additional mobility
9,000 additional vehicles?

Additional Renewable Electricity Production and Electric Vehicles
1. „Direct connection“
2. „Via storage“
3. „Stored in Grid“
4. „Real time charging“
How to
connect?

Charging of EVs with Additional Renewable Electricity
“Direct connection”
“Real time charging” “Stored in grid“
“Via storage”

Emissions for Different Loading Strategies with Additional
Renewable Electricity
24
13
28
73
100

GHG Emissions of Electric Vehicles - Renewable Electricity 25
Source: own calculations using data of ecoinvent
diesel & gasoline
ICE
Average significant GHG reduction
(CO2, CH4, N2O): 74 - 81%
Intermediate
battery storage
assumed
1) PV 20%
2) Wind 10% Ele
ctr
icity c
on
sum
ption E
V a
t cha
rgin
g p
oin
t
for
real dri
vin
g c
ycle
(e.g
. he
ating/c
oo
ling):
15
– 3
0 k
Wh/1
00
km

PM (< 10 µm)-Emissions of Electric Vehicles – Renewable Electricity
Source: own calculations using data of ecoinvent
diesel & gasoline
ICE
Average significant reduction
PM-emissions (< 10 µm): 75 - 87%
Intermediate
battery storage
assumed
1) PV 20%
2) Wind 10%
Ele
ctr
icity c
on
sum
ption E
V a
t cha
rgin
g p
oin
t
for
real dri
vin
g c
ycle
(e.g
. he
ating/c
oo
ling):
15
– 3
0 k
Wh/1
00
km

The 2 Keys: Renewable Energy and Energy Efficiency
0 30 20 10 90 40 50 60 70 80
Fuel consumption [kWh/100km]
0
50
100
150
200
250
300
Gre
en
ho
us
e g
as
em
iss
ion
s
[g C
O2-e
q/k
m]
FT-Biodiesel
wood
Biodiesel
rape*)
Diesel
Ren-H2
hydro power Electricity
hydro power
Electricity
natural gas
Electricity
UCTE mix
Source: LCA of passenger vehicles, Joanneum Research, *) without iLUC
Internal combustion engine and battery electric passenger cars
Electricity PV incl. storage

The 2 Keys: Renewable Energy and Energy Efficiency
0 30 20 10 90 40 50 60 70 80
Fuel consumption [kWh/100km]
0
50
100
150
200
250
300
Gre
en
ho
us
e g
as
em
iss
ion
s
[g C
O2-e
q/k
m]
FT-Biodiesel
wood
Biodiesel
rape*)
Diesel
Ren-H2
hydro power Electricity
hydro power
Electricity
natural gas
Electricity
UCTE mix
Internal combustion engine and battery electric passenger cars
Increase +30%
Source: LCA of passenger vehicles, Joanneum Research, *) without iLUC
Electricity PV incl. storage

Content
29
Introduction
Activities in IEA
HEV
Example Austria
Global EV Fleet
Conclusions

Background
Task 19 “Life Cycle Assessment of Electric Vehicles“ (2011 –
2015) and Task 30 “Assessment of Environmental Effects of
Electric Vehicle” (2016 – 2019) worked on and published
“Estimated Environmental Effects of the
Worldwide Electric Vehicle Fleet in 2014”
using
a harmonized methodology
actual LCA data for electricity&vehicles
actual vehicle performance data
accepted necessary assumptions

Aim of special Project “FACTS&FIGURES”
Provide annually FACTS&FIGURES on life cycle based environmental benefits of EVs worldwide and country specific in
comparison to conventional vehicles
Based on achievements of Task 19 „LCA of EVs“

Objective, Scope&Approach
Objectives
Analyse and document current*) environmental benefits of EVs compared to substituted conventional ICE vehicles
Apply harmonized LCA methodology of finished Task 19 “LCA of EVs” (2011 – 2015)
Use broad set of available country specific (default) LCA data
Scope&Approach
LCA of (inter)national EV&PHEV-Fleets
Emissions to air: CO2, CH4, N2O, SO2, NOx, PM, NMVOC, CO
Cumulated primary energy demand: fossil, renewable, others and nuclear
Strong interaction with IEA HEV countries
Dissemination & Reporting
*) and future (optional: scenario based for policy makers)

World EV-Fleet (2015): 1,234,999 BEV&PHEV of which
684,700 in IEA HEV countries 33

EV-Fleet in 2015: 1,234,999 vehicles (I) 34

EV-Fleet in 2015: 1,234,999 vehicles (II) 35

Country FACT
SHEET 36
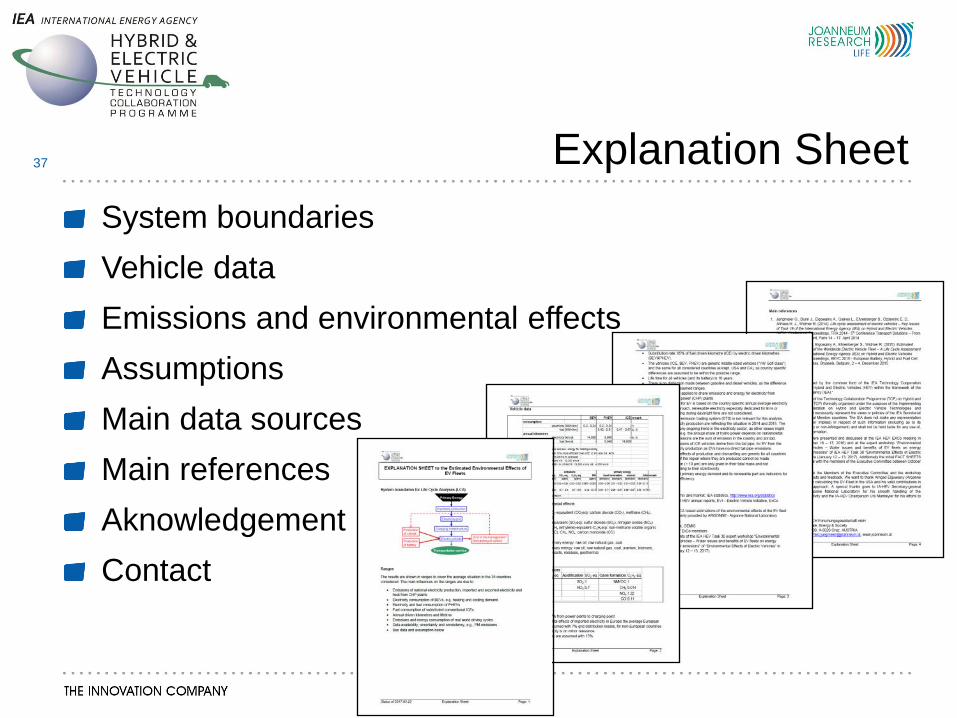
Explanation Sheet
System boundaries
Vehicle data
Emissions and environmental effects
Assumptions
Main data sources
Main references
Aknowledgement
Contact
37

Content
38
Introduction
Activities in IEA
HEV
Example Austria
Global EV Fleet
Conclusions

Country FACT
SHEET 39

BASIC DATA: Share of National Electricity Production 40
Source: IEA statistics http://www.iea.org/statistics/statisticssearch/report/?country=ITALY&product=electricityandheat&year=201x
Austria

BASIC DATA: National Electricity Market 41
Austria
Source: IEA statistics http://www.iea.org/statistics/statisticssearch/report/?country=ITALY&product=electricityandheat&year=201x

BASIC DATA Estimated Environ. Effects of Electricity (I) 42
Source: own calculations using data from ecoinvent and GEMIS
(1) CO2-equivalent: carbon dioxide (CO2), methane (CH4), nitrous oxide (N2O)
(2) SO2-equivalen: sulfur dioxide (SO2), nitrogen oxides (NOx)
(3) C2H4 (ethylene)-eq: non-methane volatile organic compounds (NMVOC), CH4, NOx, carbon monoxide (CO)
(4) sum: raw oil, raw natural gas, coal
(5) sum: raw oil, raw natural gas, coal, uranium, biomass, solar, wind, water, waste, residues, geothermal
(6) energy share of coproduced electricity/heat in CHP plants: 57%/43%
2014 2015
global warming (g CO2eq/kWh) (1) 210 to 262 236 to 294
acidification (g SO2eq/kWh) (2) 0.5 to 0.62 0.56 to 0.7
ozone formation (g C2H4eq/kWh) (3) 0.36 to 0.45 0.4 to 0.5
particles (g/kWh) 0.06 to 0.07 0.06 to 0.08
fossil primary energy (kWh/kWh) (4) 0.86 to 1.1 0.96 to 1.2
nuclear primary energy (kWh/kWh) 0.02 to 0.02 0.02 to 0.02
total primary energy (kWh/kWh) (5) 1.6 to 2 1.7 to 2.1
estimated environmental effects of
electricity at charging point Austria

BASIC DATA: Estimated Environ. Effects of Electricity (II) 43
Source: own calculations using data from ecoinvent and GEMIS
Austria

BASIC DATA: Number of Electric Vehicle 44
Source: IEA HEV annual report, EVI, ExCo members
Austria total number of passenger vehicles in Mio. (2015): 4.7

ENVIRONMENTAL EFFECTS: Estimated Annual Change of national EV Fleet 45
Source: own calculations
Austria

ENVIRONMENTAL EFFECTS: Estimated Change of national EV Fleet 46
So
urc
e: o
wn
ca
lcu
latio
ns
Austria 2014 2015
global warming (kt CO2eq/a) -5.6 to -6.9 -8.2 to -10
acidification (t SO2eq/a) -24 to -29 -35 to -44
ozone formation (t C2H4eq/a) -25 to -31 -38 to -47
particles (t/a) -4.7 to -5.9 -7.2 to -8.9
fossil primary energy (GWh/a) -13 to -16 -18 to -22
nuclear primary energy (GWh/a) <0.01 0.02 to 0.03
total primary energy (GWh/a) -5.5 to -6.8 -7.1 to -8.8
2014 2015
global warming -48 to -60% -45 to -56%
acidification -62 to -77% -59 to -74%
ozone formation -68 to -85% -66 to -82%
particles -71 to -89% -69 to -86%
fossil primary energy -39 to -48% -34 to -43%
nuclear primary energy -1.7 to -2.1% 4.8 to 5.9%
total primary energy -15 to -19% -12 to -16%(1) of national EV fleet subsituting conventional ICE vehicles
(2) reduction is negative value; increase is positive value
estimated annual change of
environmental effects (1), (2)
estimated change of environmental
effects (1), (2)

Main Conclusions Communication strategies are essential: Interaction with stakeholders, show database, explain assumption, communication&thinking in ranges
Environmental effects depend on the national framework condition, e.g., national electricity generation. In most of the countries, a significant reduction of these LCA based emissions of up to 90% is reached
Estimated broad ranges are mainly due to variation in:
Emissions of national electricity production
Electricity consumption of EVs at charging point
Fuel consumption of substituted conventional ICEs
Data availability, uncertainty and consistency, e.g., PM
Maximizes environmental benefits with additional renewable electricity
Adequate loading strategies to optimize the use of renewable electricity are essential for further significant reductions
47

ENVIRONMENTAL EFFECTS: Comparison ICE and BEV&PHEV 48
Source: own calculations
Austria Conventional ICE
EV (BEV & PHEV)

ENVIRONMENTAL EFFECTS: Comparison ICE and BEV&PHEV 49
Source: own calculations
Norway Conventional ICE
EV (BEV & PHEV)

ENVIRONMENTAL EFFECTS: Comparison ICE and BEV&PHEV 50
Source:
USA Conventional ICE
EV (BEV & PHEV)

Content
51
Introduction
Activities in IEA
HEV
Example Austria
Global EV Fleet
Conclusions

BASIC DATA: Number of Electric Vehicle 52
Source: IEA HEV annual report, EVI, ExCo members
Total:
716,908 EV&PHEV (2015) IEA HEV Countries
Total: 684,700

BASIC DATA: Estimated Environ. Effects of Electricity (I) 53
Source: own calculations using data from ecoinvent and GEMIS

BASIC DATA: Estimated Environ.Effects of Electricity (II) 54
Source: own calculations using data from ecoinvent and GEMIS
IEA HEV Countries

ENVIRONMENTAL EFFECTS: Estimated Annual Change of EV Fleet (I) 55
Source: calculated by JOANNEUM RESEARCH and ARGONNE
IEA HEV Countries

ENVIRONMENTAL EFFECTS: Estimated Annual Change of EV Fleet (II) 56
World

ENVIRONMENTAL EFFECTS: Estimated Annual Change of EV Fleet (III) 57
Source: own calculations
IEA HEV Countries

ENVIRONMENTAL EFFECTS: Estimated Annual Change of EV Fleet (IV) 58
Source: own calculations
World

ENVIRONMENTAL EFFECTS: Estimated Change (I) 59
Source: own calculations
IEA HEV Countries

ENVIRONMENTAL EFFECTS: Estimated Change (II) 60
Source: own calculations
IEA HEV Countries

Total Results
Estimation of the average environmental benefits of BEVs and PHEVs substituting diesel and gasoline globally shows
GHG-reduction: - 25% to - 30%
PM < 10 reduction: - 40% to - 50%
Acidification: 0% to - 5%
Ozone reduction: - 50% to - 60%
Fossil primary energy reduction - 25% to - 30%
Renewable primary energy increase + 10% to + 15%
Nuclear primary energy increase + 600% to + 800%
Total primary energy reduction - 15% to - 20%
61

Main Conclusions Communication strategies are essential: Interaction with stakeholders, show database, explain assumption, communication&thinking in ranges
Environmental effects depend on the national framework condition, e.g., national electricity generation. In most of the countries, a significant reduction of these LCA based emissions of up to 90% is reached
Estimated broad ranges are mainly due to variation in:
Emissions of national electricity production
Electricity consumption of EVs at charging point
Fuel consumption of substituted conventional ICEs
Data availability, uncertainty and consistency, e.g., PM
Maximizes environmental benefits with additional renewable electricity
Adequate loading strategies to optimize the use of renewable electricity are essential for further significant reductions
62

Summary
about 1.3 Mio. EVs worldwide (end of 2015):
Main countries US, JP, CN, F, DE, NO
Environmental Assessment of EVs only possible on
Life Cycle Assessment compared to conventional vehicles
Estimation of environmental effects substituting diesel/gasoline
positive environmental effcts
Broad estimated ranges mainly due to
- Emissions of national electricity production
- Electricity consumption of EVs at charging point
- Fuel consumption of substituted conventional ICEs
- Data availability, uncertainty and consistency, e.g. PM
Additional renewable electricity with adequate charging
strategies is essential for further significant reductions

Your Contact Gerfried Jungmeier
JOANNEUM RESEARCH Forschungsgesellschaft mbH.
LIFE – Centre for Climate, Energy and Society
Future Energy Systems and Lifestyles
Elisabethstraße 18
A-8010 Graz
AUSTRIA
+43 316 876-1313
www.joanneum.at/eng
www.ieahev.org/tasks/task-30-assessment-of-environmental-effects-of-
electric-vehicles/
www.ieahev.org/tasks/task-19-life-cycle-assessment-of-evs