2 3 Navistar, Inc. Nations largest combined manufacturer of trucks, busses, engines, recreational...
28
-
Upload
scott-eaton -
Category
Documents
-
view
220 -
download
0
Transcript of 2 3 Navistar, Inc. Nations largest combined manufacturer of trucks, busses, engines, recreational...


2

3
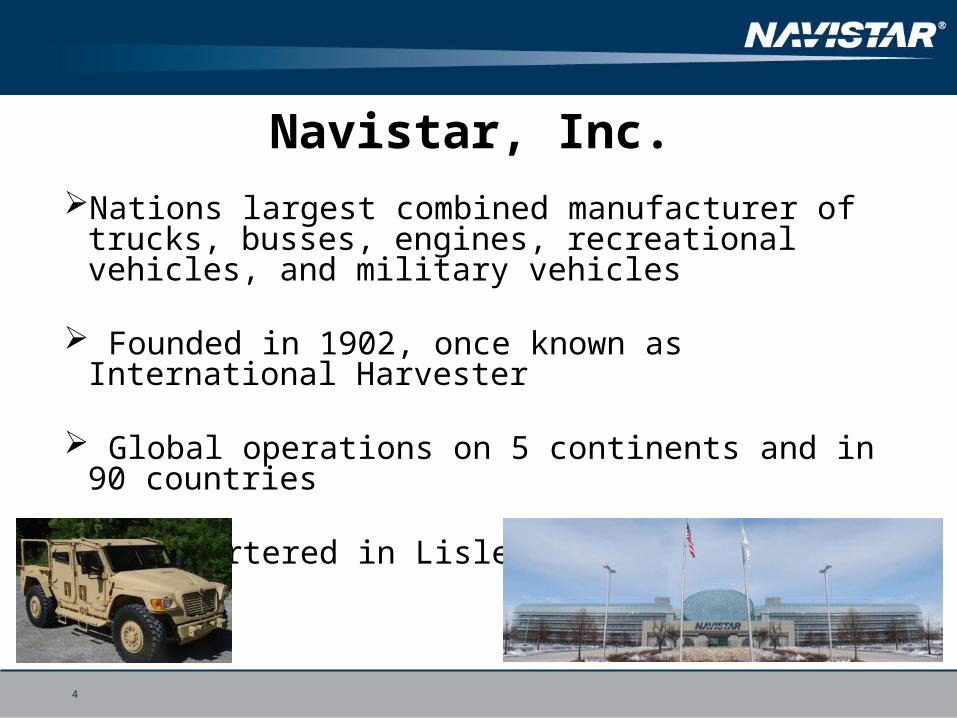
Navistar, Inc. Nations largest combined manufacturer of trucks, busses,
engines, recreational vehicles, and military vehicles
Founded in 1902, once known as International Harvester
Global operations on 5 continents and in 90 countries
Headquartered in Lisle Illinois since 2011
4
Employee Demographics
18,000 employees worldwide
Average age 45
12.5 years average length of service
47% unionized
• Three different UAW populations
• Two separate Steel Worker locals
• Teamsters
• IFPTE
• IUOE
• IAM
• EIEIO
3.5:1 Male-to-female ratio
4
Integrated Disability Program Summary Self insured and self administered in high population states for Workers
Compensation; primary concentrations in Illinois, Indiana, Alabama, Texas, Ohio, Oklahoma, and Arkansas
Excess coverage at $1 million per occurrence
Applying for self insurance in Wisconsin, South Carolina, and Oregon, insured in all other states through a high deductable program with Zurich
Self insure and self administer fourteen of Navistar’s fifteen collectively bargained and employer provided disability Plans
6
HSSP Reporting structure Health, Safety, Security and Productivity (HSSP) is part of Human Resources
Report to the Director of Health and Productivity and ultimately to the Vice President of Health, Safety, Security and Productivity
Integrated groups through corporate HSSP, including all plant medical departments
Monthly monitoring by the Company’s Executive Council of program success via cost, safety, and absenteeism metrics
Monthly metrics reported to the Executive Council include IFR, LTCR, safety audit scores, combined Workers Compensation and disability costs, and sustainability metrics such as energy reduction
7
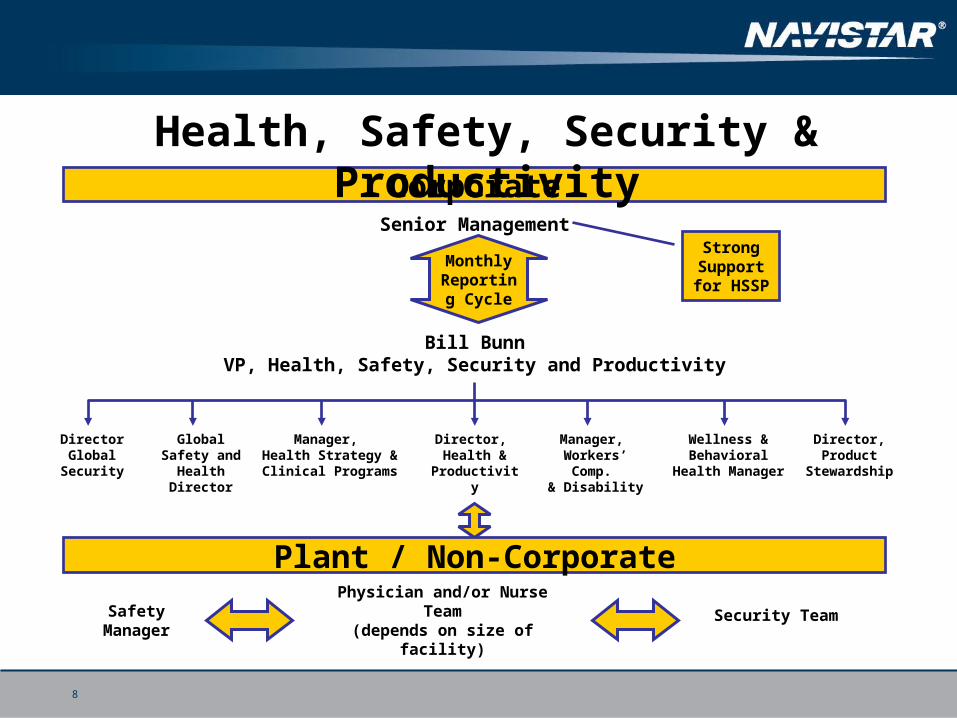
Corporate
Monthly Reporting
Cycle
Senior ManagementStrong
Support for HSSP
Bill BunnVP, Health, Safety, Security and Productivity
Global Safety and Health
Director
Plant / Non-Corporate
SafetyManager
Physician and/or Nurse Team(depends on size of facility)
Security Team
DirectorGlobal
Security
Manager, Health Strategy & Clinical Programs
Manager, Workers’ Comp.
& Disability
Wellness & Behavioral Health
Manager
Director, Product
Stewardship
Director, Health &
Productivity
Health, Safety, Security & Productivity
8
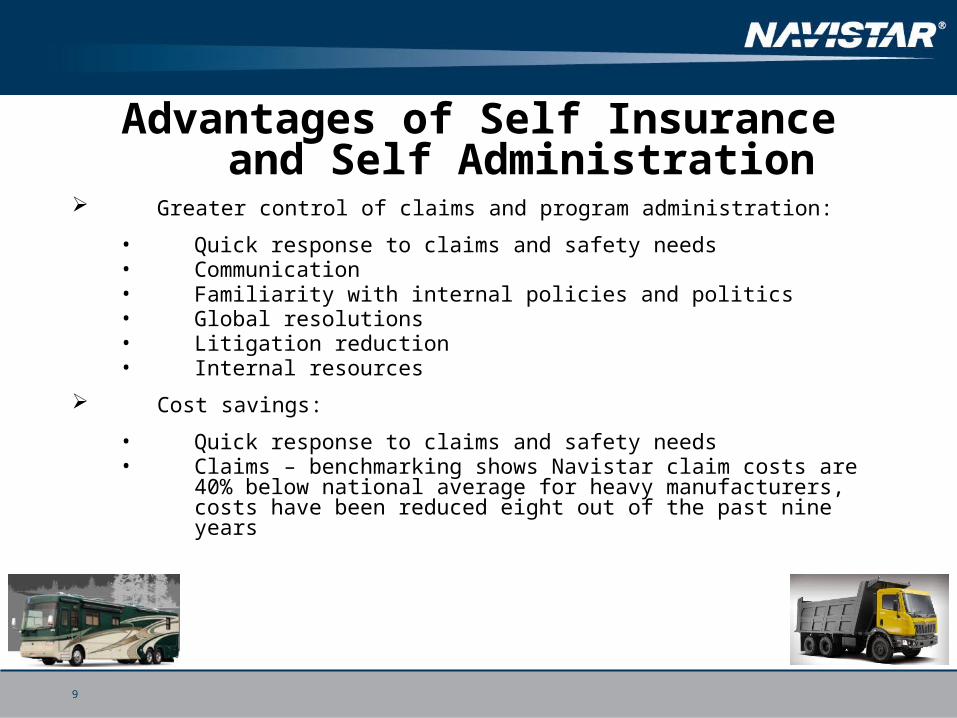
Advantages of Self Insurance and Self Administration
Greater control of claims and program administration:
• Quick response to claims and safety needs• Communication• Familiarity with internal policies and politics• Global resolutions• Litigation reduction• Internal resources
Cost savings:
• Quick response to claims and safety needs• Claims – benchmarking shows Navistar claim costs are 40% below national
average for heavy manufacturers, costs have been reduced eight out of the past nine years
9
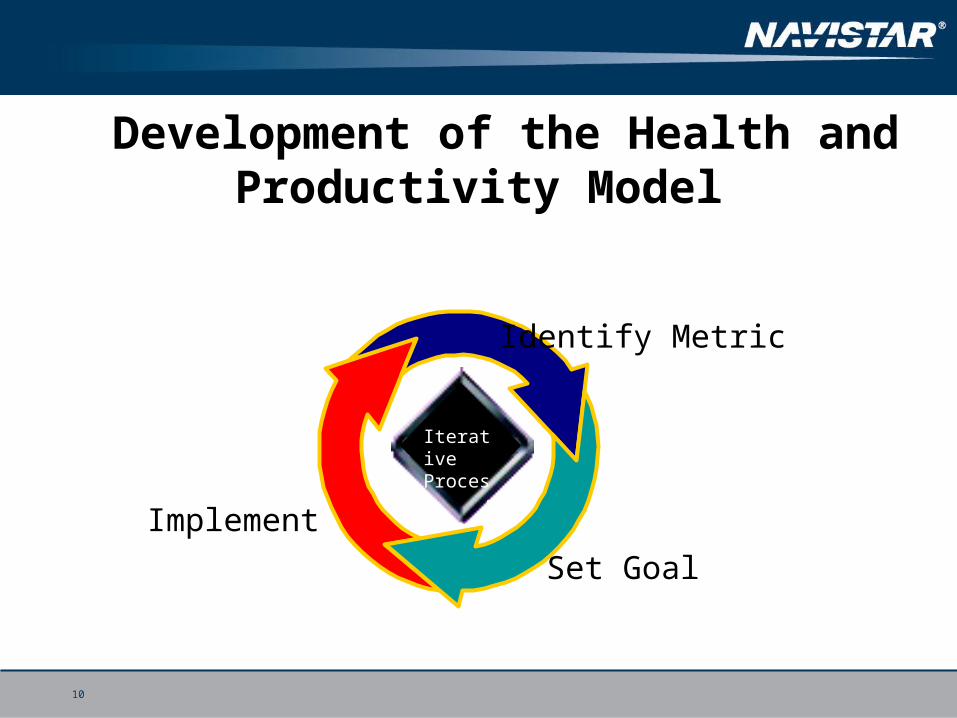
Iterative Process
Identify Metric
Set Goal
Implement
Development of the Health and Productivity Model
10
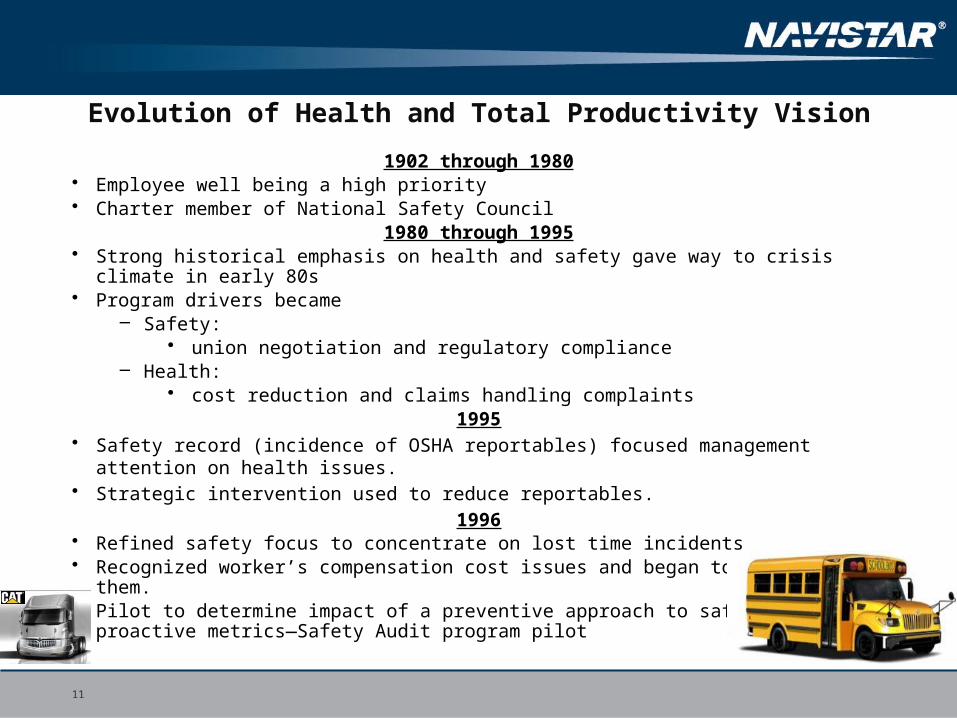
Evolution of Health and Total Productivity Vision
1902 through 1980• Employee well being a high priority• Charter member of National Safety Council
1980 through 1995• Strong historical emphasis on health and safety gave way to crisis climate in early 80s• Program drivers became
– Safety:• union negotiation and regulatory compliance
– Health:• cost reduction and claims handling complaints
1995• Safety record (incidence of OSHA reportables) focused management attention on health issues.• Strategic intervention used to reduce reportables.
1996• Refined safety focus to concentrate on lost time incidents• Recognized worker’s compensation cost issues and began to address them.• Pilot to determine impact of a preventive approach to safety using proactive metrics—Safety Audit
program pilot
11
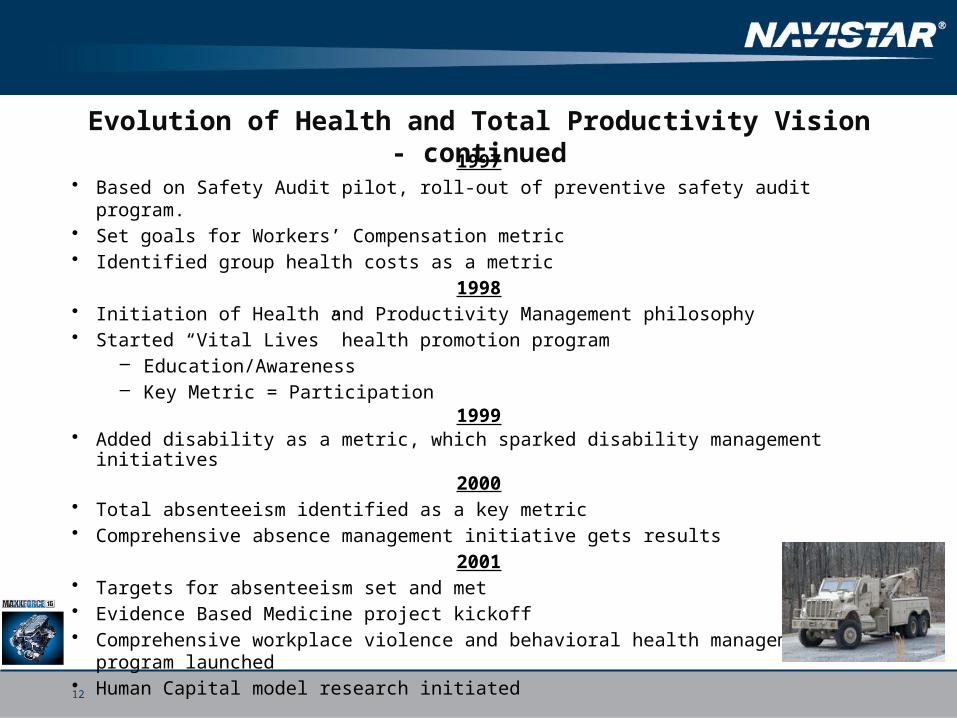
Evolution of Health and Total Productivity Vision - continued
1997• Based on Safety Audit pilot, roll-out of preventive safety audit program.• Set goals for Workers’ Compensation metric• Identified group health costs as a metric
1998• Initiation of Health and Productivity Management philosophy• Started “Vital Lives” health promotion program
– Education/Awareness– Key Metric = Participation
1999• Added disability as a metric, which sparked disability management initiatives
2000• Total absenteeism identified as a key metric• Comprehensive absence management initiative gets results
2001• Targets for absenteeism set and met• Evidence Based Medicine project kickoff• Comprehensive workplace violence and behavioral health management program launched• Human Capital model research initiated
12
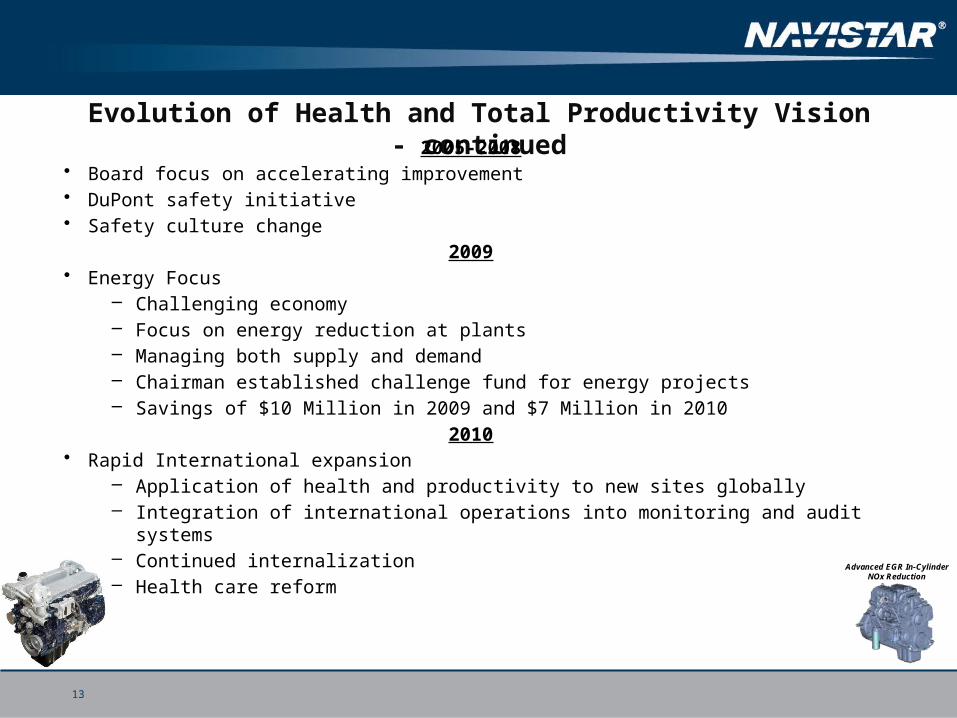
Evolution of Health and Total Productivity Vision - continued2005-2008
• Board focus on accelerating improvement• DuPont safety initiative• Safety culture change
2009• Energy Focus
– Challenging economy– Focus on energy reduction at plants– Managing both supply and demand– Chairman established challenge fund for energy projects – Savings of $10 Million in 2009 and $7 Million in 2010
2010• Rapid International expansion
– Application of health and productivity to new sites globally – Integration of international operations into monitoring and audit systems– Continued internalization– Health care reform Advanced EGR In-Cylinder
NOx Reduction
13
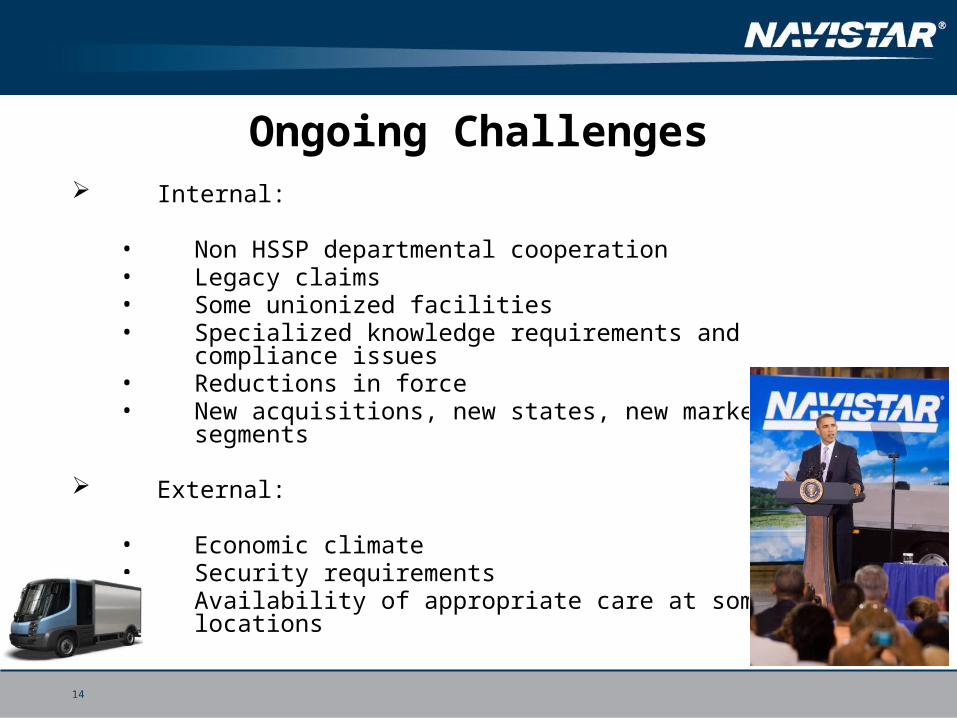
Ongoing Challenges Internal:
• Non HSSP departmental cooperation• Legacy claims• Some unionized facilities• Specialized knowledge requirements and compliance issues• Reductions in force• New acquisitions, new states, new market segments
External:
• Economic climate• Security requirements• Availability of appropriate care at some locations
14
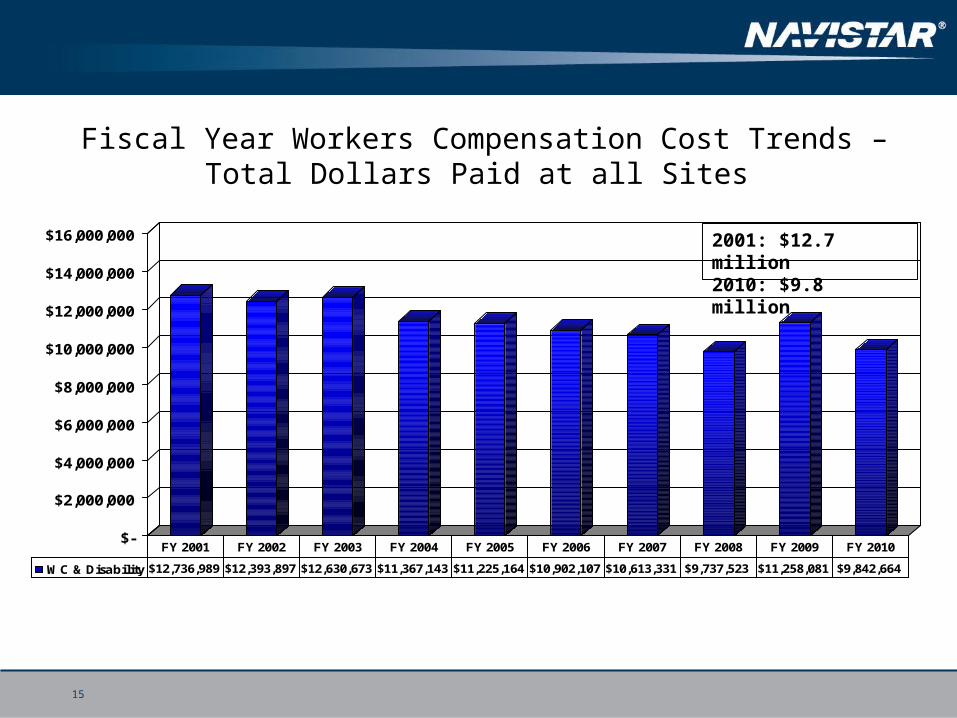
Fiscal Year Workers Compensation Cost Trends – Total Dollars Paid at all Sites
$-
$2,000,000
$4,000,000
$6,000,000
$8,000,000
$10,000,000
$12,000,000
$14,000,000
$16,000,000
WC & Disability $12,736,989 $12,393,897 $12,630,673 $11,367,143 $11,225,164 $10,902,107 $10,613,331 $9,737,523 $11,258,081 $9,842,664
FY 2001 FY 2002 FY 2003 FY 2004 FY 2005 FY 2006 FY 2007 FY 2008 FY 2009 FY 2010
2001: $12.7 million2010: $9.8 million
15

Fiscal Year Disability Cost Trends – Total Dollars Paid at All Sites
$-
$2,000,000
$4,000,000
$6,000,000
$8,000,000
$10,000,000
Disability $9,302,350 $8,614,319 $7,492,437 $5,442,594 $5,238,867 $5,146,931 $5,301,676 $4,314,011 $3,833,150 $4,275,147
FY 2001 FY 2002 FY 2003 FY 2004 FY 2005 FY 2006 FY 2007 FY 2008 FY 2009 FY 2010
2001: $9.3 million2010: $4.2 million
16
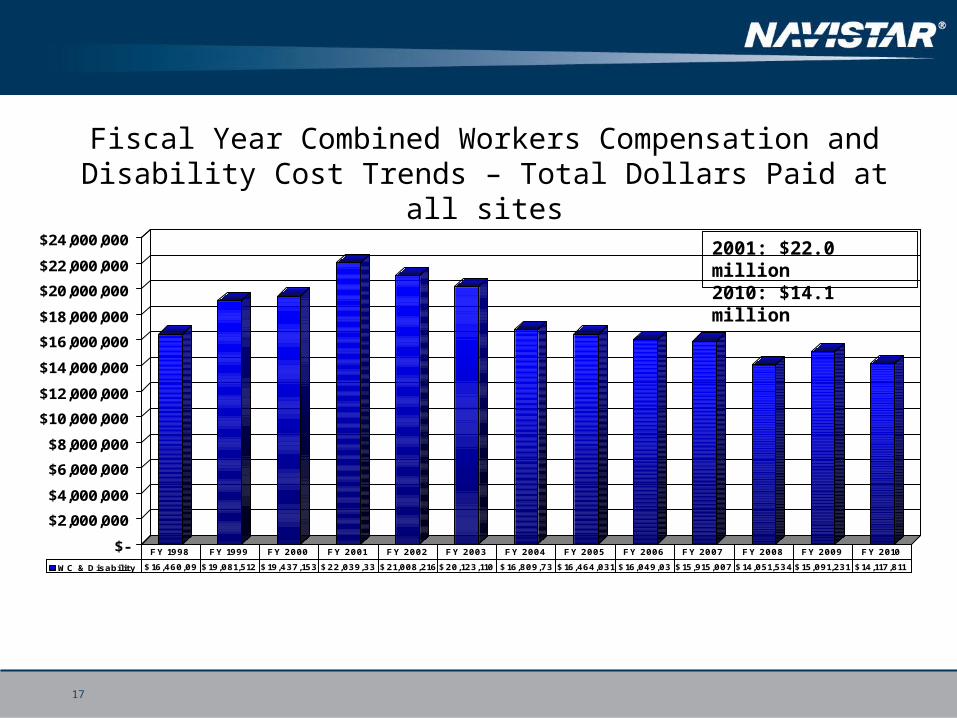
Fiscal Year Combined Workers Compensation and Disability Cost Trends – Total Dollars Paid at all sites
$-
$2,000,000
$4,000,000
$6,000,000
$8,000,000
$10,000,000
$12,000,000
$14,000,000
$16,000,000
$18,000,000
$20,000,000
$22,000,000
$24,000,000
WC & Disability $16,460,09 $19,081,512 $19,437,153 $22,039,33 $21,008,216 $20,123,110 $16,809,73 $16,464,031 $16,049,03 $15,915,007 $14,051,534 $15,091,231 $14,117,811
FY 1998 FY 1999 FY 2000 FY 2001 FY 2002 FY 2003 FY 2004 FY 2005 FY 2006 FY 2007 FY 2008 FY 2009 FY 2010
2001: $22.0 million2010: $14.1 million
17
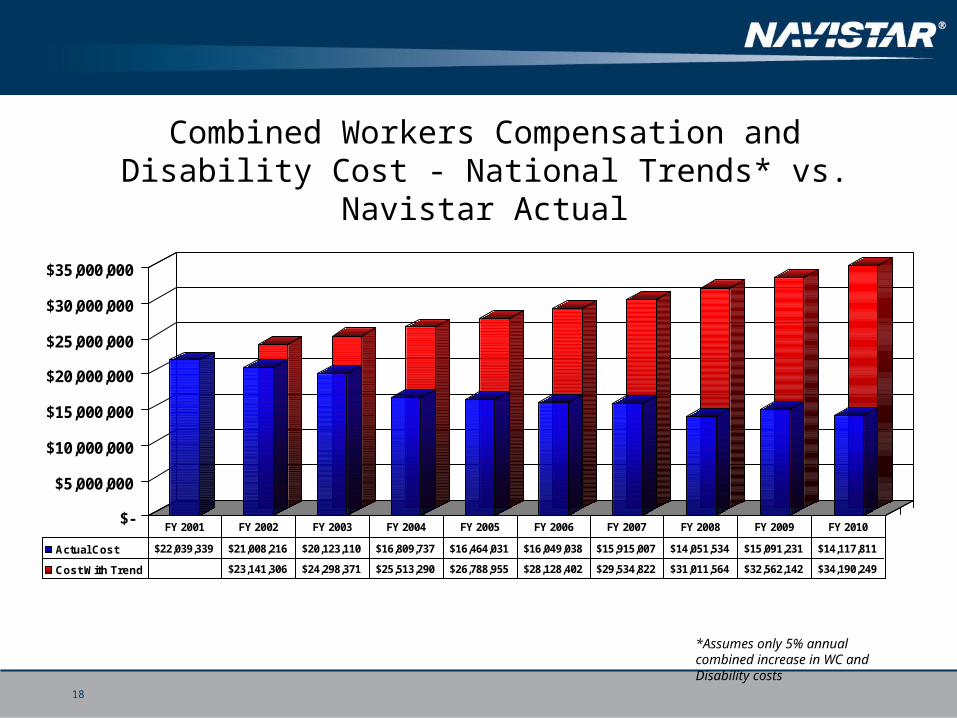
Combined Workers Compensation and Disability Cost - National Trends* vs. Navistar Actual
$-
$5,000,000
$10,000,000
$15,000,000
$20,000,000
$25,000,000
$30,000,000
$35,000,000
Actual Cost $22,039,339 $21,008,216 $20,123,110 $16,809,737 $16,464,031 $16,049,038 $15,915,007 $14,051,534 $15,091,231 $14,117,811
Cost With Trend $23,141,306 $24,298,371 $25,513,290 $26,788,955 $28,128,402 $29,534,822 $31,011,564 $32,562,142 $34,190,249
FY 2001 FY 2002 FY 2003 FY 2004 FY 2005 FY 2006 FY 2007 FY 2008 FY 2009 FY 2010
*Assumes only 5% annual combined increase in WC and Disability costs
18
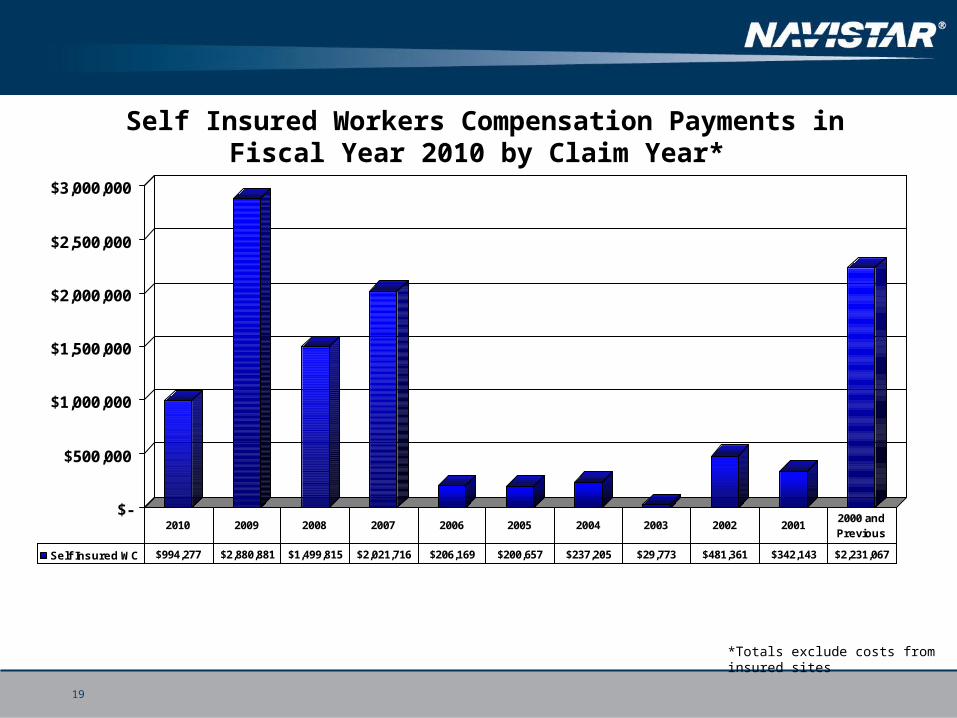
Self Insured Workers Compensation Payments in Fiscal Year 2010 by Claim Year*
$-
$500,000
$1,000,000
$1,500,000
$2,000,000
$2,500,000
$3,000,000
Self Insured WC $994,277 $2,880,881 $1,499,815 $2,021,716 $206,169 $200,657 $237,205 $29,773 $481,361 $342,143 $2,231,067
2010 2009 2008 2007 2006 2005 2004 2003 2002 20012000 and Previous
*Totals exclude costs from insured sites
19
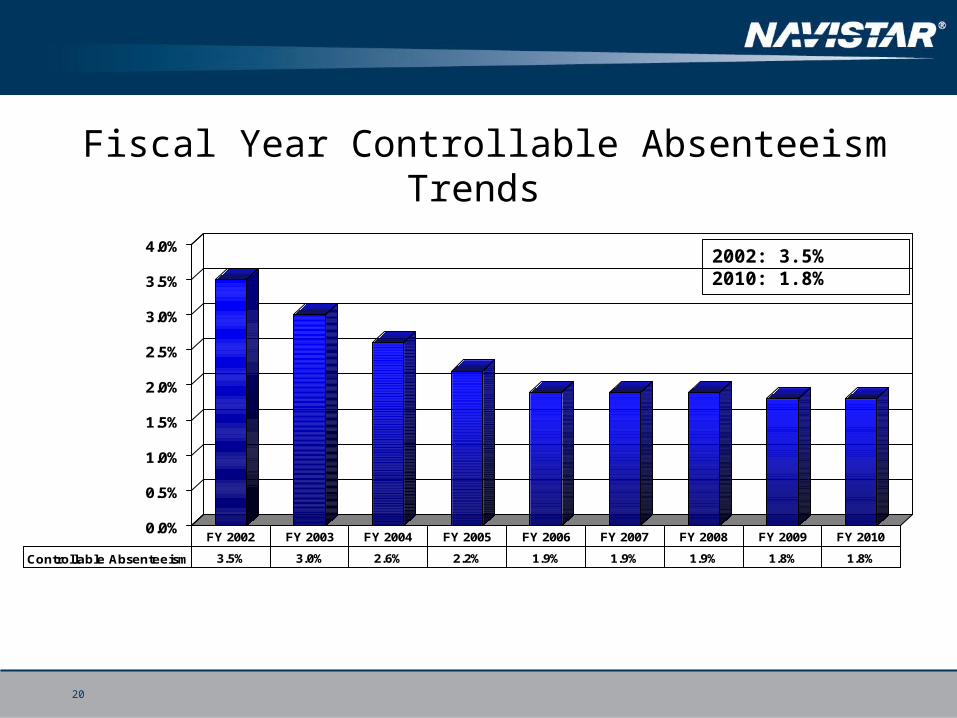
Fiscal Year Controllable Absenteeism Trends
0.0%
0.5%
1.0%
1.5%
2.0%
2.5%
3.0%
3.5%
4.0%
Controllable Absenteeism 3.5% 3.0% 2.6% 2.2% 1.9% 1.9% 1.9% 1.8% 1.8%
FY 2002 FY 2003 FY 2004 FY 2005 FY 2006 FY 2007 FY 2008 FY 2009 FY 2010
2002: 3.5%2010: 1.8%
20
21
0.0 2.0 4.0 6.0 8.0
10.0 12.0 14.0 16.0 18.0 20.0
98 99 00 01 02 03 04 05 06 07 08 09
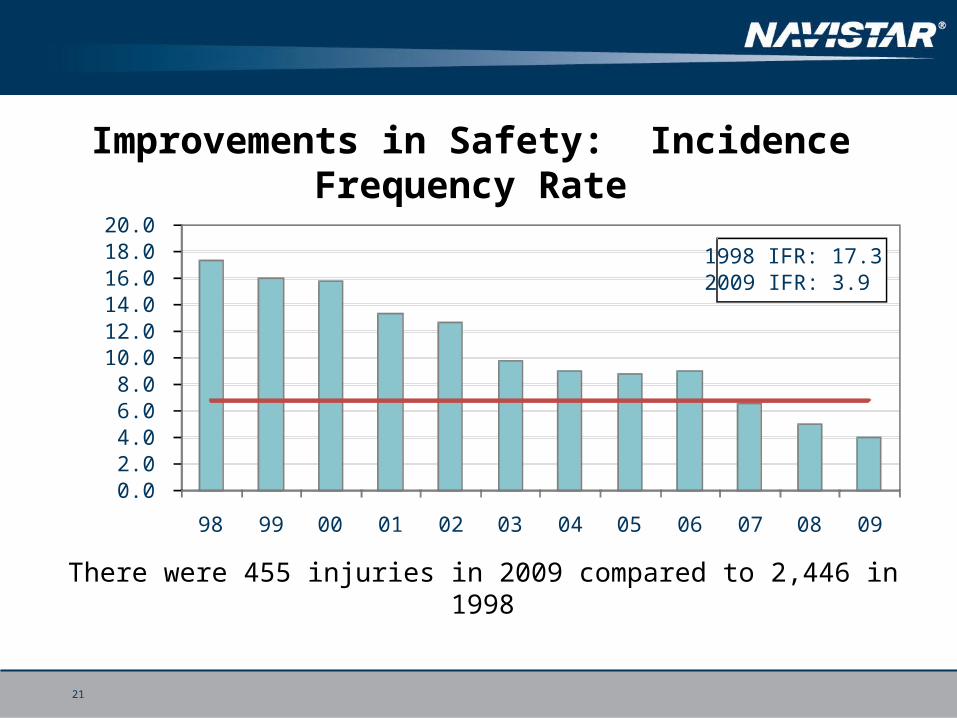
1998 IFR: 17.32009 IFR: 3.9
Improvements in Safety: Incidence Frequency Rate
There were 455 injuries in 2009 compared to 2,446 in 1998
22
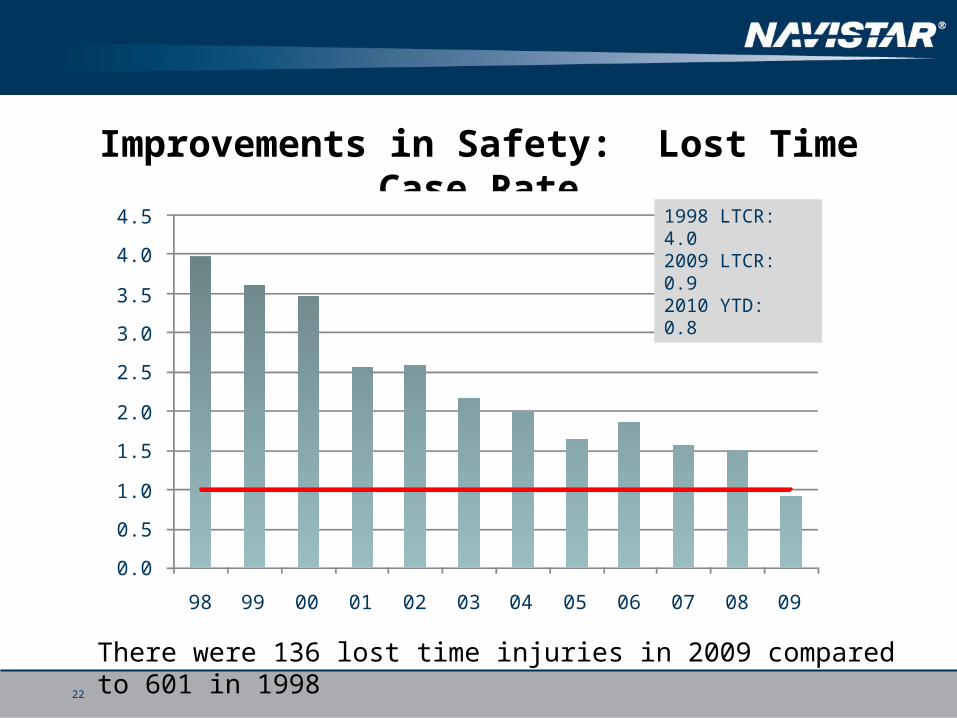
Improvements in Safety: Lost Time Case Rate
There were 136 lost time injuries in 2009 compared to 601 in 1998
0.0
0.5
1.0
1.5
2.0
2.5
3.0
3.5
4.0
4.5
98 99 00 01 02 03 04 05 06 07 08 09
1998 LTCR: 4.02009 LTCR: 0.92010 YTD: 0.8
23
Safety Opportunities
Integrate new additions to Navistar family: Monaco RV, Defense business, Pure Power, Continental Mixers, Joint ventures (India, China, NC2, etc.)
Assure compliance due to OSHA’s increased focus on enforcement and recordkeeping - Especially at newer facilities
Safety improvements gained over the last decade need to be sustained by focusing on risk assessment and effective change management (move beyond preventing injuries to managing risk)
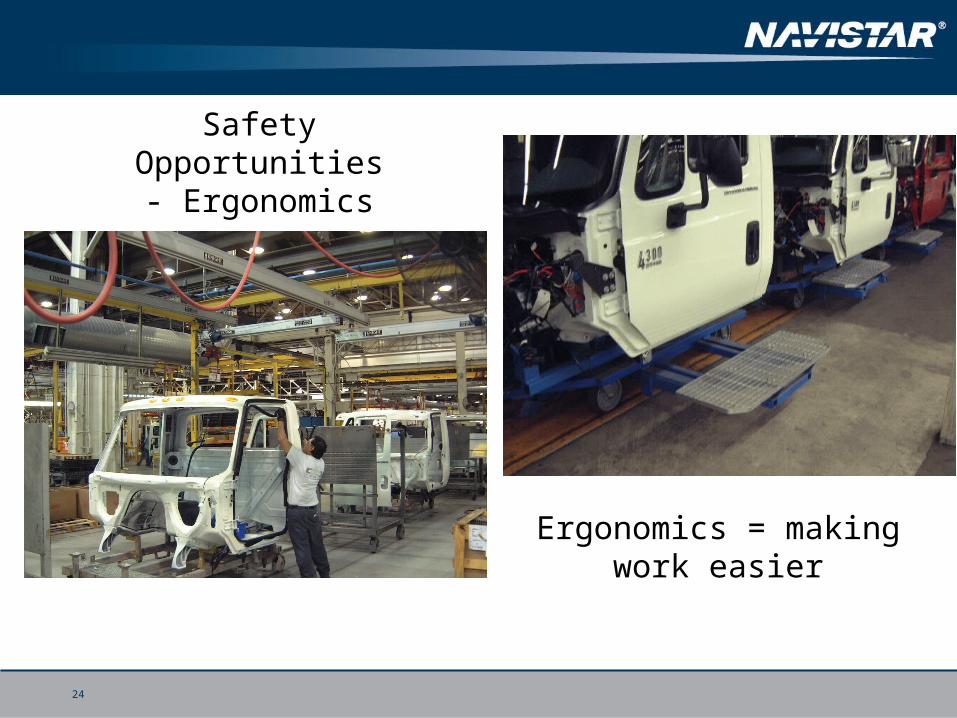
Safety Opportunities -
Ergonomics
Ergonomics = making work easier
24
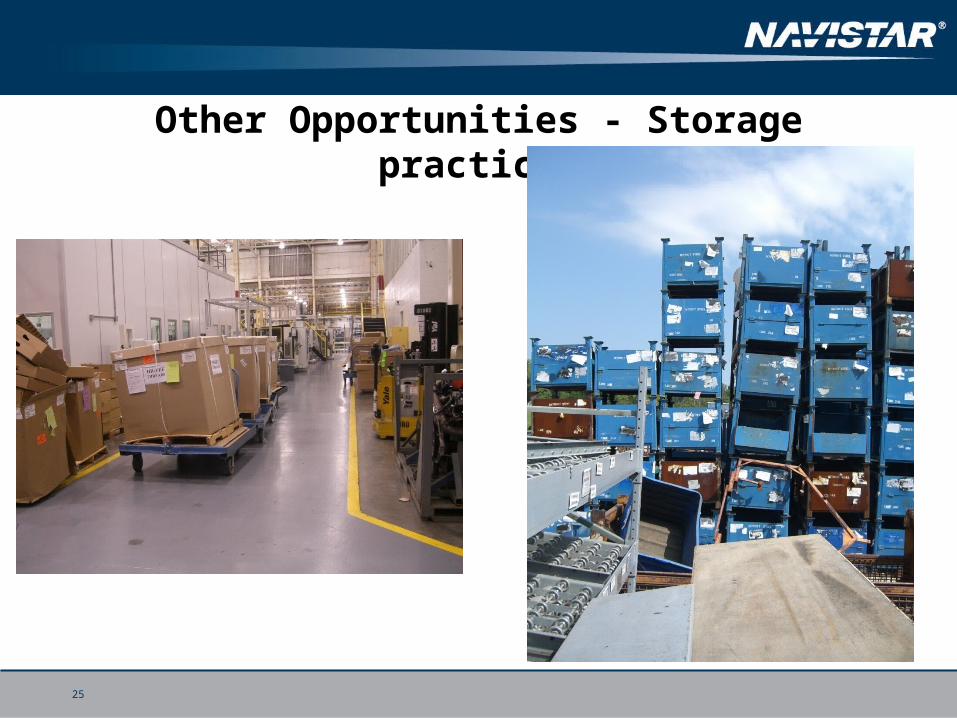
Other Opportunities - Storage practices
25
26
Medical and Integrated Disability Opportunities
Overall Goal - Continue moving from a Culture of Safety to a Culture of Health and Productivity
Explore greater opportunities for safe return to work
Address ergonomic issues to help control cost
Continue to address mental health & stress-related issues
Continue efforts to improve accident prevention
Evaluate any opportunities available through the new health care reforms
Lessons Learned
Senior management support is key
Initial focus on safety expanded to other areas
Measure and manage with accurate data
Sequential approach to health and productivity management
Integration across disciplines to achieve best results
2727
Thank You!
28