Ideology and Retrospection in Electoral Responses to the Great Recession
53
Ideology and Retrospection in Electoral Responses to the Great Recession Larry M. Bartels Working Paper: 04-2013 Research Concentration: Elections and Electoral Rules
Transcript of Ideology and Retrospection in Electoral Responses to the Great Recession

Ideology and Retrospection in Electoral Responses to the Great
Recession
Larry M. Bartels
Working Paper: 04-2013 Research Concentration: Elections and Electoral Rules
Chapter 7
Ideology and Retrospection in Electoral Responses to the Great Recession1
Larry M. Bartels
The global economic crisis triggered by the financial meltdown of 2008 provides a dramatic
setting in which to explore perennial questions of democratic accountability. Dozens of
incumbent governments around the world faced their voters under conditions of significant
economic distress. How did voters respond to these opportunities to help steer the ship of state
through the squall? Did electorates evaluate the performance of their elected leaders on the basis
of sober-minded assessments of the economic situation? Did they compare the ideologies and
proposals of “ins” and “outs” and communicate meaningful preferences regarding the future
course of public policy? Was there a global shift of ideological views to the left or to the right in
response to a broadly shared understanding of the nature of the crisis and appropriate
governmental responses? Or did voters simply and uncritically punish incumbents wherever and
whenever times were hard?
In hopes of shedding some light on these questions, I provide a broad comparative analysis
of 42 elections in 28 OECD countries in the period just before, during, and after the Great
Recession (from 2007 through 2011). By focusing on common patterns across these diverse
electoral settings, I of course ignore much important detail regarding economic conditions,
1 I am grateful to Christopher Achen, Christopher Anderson, Nancy Bermeo, Mark Kayser, Johannes
Lindvall, Markus Prior, Steven Rogers, and participants in the Oxford conference on “Popular Reactions
to the Great Recession” and the Vanderbilt Political Behavior Workshop for helpful discussions and
comments on early versions of this chapter. The work reported here was supported by the Princeton
Institute for International and Regional Studies’ research cluster on “The Politics of Economic Crisis” and
by Vanderbilt University’s May Werthan Shayne Chair in Public Policy and Social Science.

2
policy choices, party strategies, and voting behavior in particular countries. My hope is that this
inevitably superficial comparative analysis will provide a useful starting point for more detailed
studies, which may in turn suggest modifications and elaborations of the empirical
generalizations proposed here. In the meantime, I offer a few very brief case studies of specific
elections; they are intended not as evidence in their own right, but as illustrations of the
empirical generalizations—and of some of the additional complexities shaping specific election
outcomes.
Ideology or Retrospection?
In the past half-century, political scientists have developed two distinct models of electoral
accountability. In the first of these models, voters are supposed to weigh the ideological
commitments and policy platforms of competing parties or candidates and vote so as to further
their own policy preferences (for example, see Downs 1957; Enelow and Hinich 1984; for a
critique, Stokes 1963). The notion that elections provide meaningful judgments on the ideologies
and policies of democratic governments is an enduring—and, for many citizens and political
observers, reassuring—tenet of democratic faith. Thus, analysts called upon to explain or
interpret specific election outcomes often do so in ideological terms. The fall of a left-wing
government is taken to imply that the electorate has shifted to the right; conversely, its reelection
is interpreted as evidence of a continued attachment of the masses to the principles and policies
of socialism.
While this way of thinking about electoral politics is common among sophisticated political
observers in modern democracies, it may be less compelling than it seems. As Converse (1964,
219) put it in a classic essay challenging the empirical veracity of the model, “While it may be

3
taken for granted among well educated and politically involved people that a shift from a
Democratic preference to a Republican one probably represents a change in option from liberal
to conservative, the assumption cannot be extended very far into the electorate as a whole.”
An alternative model of electoral accountability dispenses with the arguably unrealistic
assumption that voters are attentive to ideological commitments and policy promises; instead,
they are merely expected to assess the general performance of the incumbent government, decide
whether it is satisfactory or unsatisfactory, and vote accordingly to retain or replace the
incumbents (for example, see Key 1966; Fiorina 1981; for a critique, Achen and Bartels 2009).
This so-called retrospective voting model is generally less prominent in sophisticated political
discourse than the ideological model; however, it has come to play an increasingly prominent
role in scholarly analyses of electoral politics. For example, in a recent paper on the latest
election in Germany, Rohrschneider, Schmitt-Beck, and Jung (2010, 18) wrote that voters in
competitive party systems “have been socialized to change governments when they are unhappy
with the economic performance of a party because they (rightly or wrongly) have come to
believe that this will in due course help to improve the economy under a new set of governing
parties.” David Mayhew (2002, 161) put it more succinctly: “academics have tended to dismiss
campaign slogans of the past like ‘the full dinner pail’ and ‘a chicken in every pot’ on the
grounds that something deeper must have been going on in these elections. But perhaps it
wasn’t.”
These two alternative models of electoral accountability have both received substantial
scholarly attention, but they have less often been considered in juxtaposition. As a result, it is
easy for observers to mistake one sort of electoral response for the other. Thus, for example,
Achen and Bartels (2005) suggested that the American electorate’s response to the Great
Depression in the 1930s was much less ideological than is often supposed. Employing state-level

4
data on income growth, they showed that Franklin Roosevelt’s historic landslide in 1936—the
pivotal electoral event in what came to be called the New Deal era—was heavily concentrated in
areas where incomes happened to be growing in the year of the election. If the recession of 1938
had occurred two years earlier, they suggested, Roosevelt would probably have been a one-term
president and the “New Deal era” would have amounted to a brief interlude in American political
history.
In support of this interpretation, Achen and Bartels (2005, 2) noted “the impressive
consistency with which electorates around the world deposed incumbent governments during the
worst days of the Depression, regardless of their ideologies.” They argued that “what looks to the
American eye like a triumph of both democratic responsiveness and Democratic ideology may
instead be an illusion produced by a specific configuration of election dates, partisan alterations,
and economic vicissitudes in a world where policies are, in fact, largely irrelevant and voters are
blindly and myopically retrospective.”
Murillo, Oliveros, and Vaishnav (2010) offered a parallel reinterpretation of the rise of the
left in Latin America in the first decade of the new millennium. They argued (2010, 87-88) that
the “rising tide of leftist political movements across Central and South America” discerned by
“journalists, policy makers, and academics” was primarily due not to “structural conditions, such
as poverty and inequality,” “globalization and disenchantment with neoliberal market reforms,”
or a “crisis of representation,” but to “the disenchantment of voters with underperforming right-
wing governments.” Analyzing the outcomes of 106 elections in 18 countries over a period of
three decades (1978-2008), they found that voters routinely punished incumbents of both the
right and the left for high levels of price inflation. Moreover, the estimated sensitivity of voters
to economic performance was fairly symmetric; a ten-fold increase in prices in the year before

5
the election was associated with a decline of about eight percentage points in the expected vote
share of left-wing governments and with a decline of about five percentage points in the
expected vote share of right-wing governments.
The impact of economic conditions on election outcomes has been a prime focus of
investigation by scholars of retrospective voting, first in the United States (Kramer 1971; Tufte
1978) and more recently in a wide variety of other countries (Lewis-Beck 1988; Anderson 1995;
Duch and Stevenson 2008). Economic conditions have the virtue of being (relatively) easy to
measure, and their impact has proved to be sufficiently large and consistent to provide powerful
leverage for explaining and predicting election outcomes (Rosenstone 1983; Hibbs 2006).
While the general importance of economic voting is widely recognized by scholars of
electoral politics and public opinion, the precise nature and normative significance of the
phenomenon are matters of debate. At one extreme, theorists have developed elaborate models of
economic voting in which voters make sophisticated calculations regarding the implications of
observed economic performance for their future utility streams (Hibbs 2006). For example, Duch
and Stevenson (2008, 339) posited that “Voters observe shocks to the macro-economy but cannot
observe the mix of exogenous and competence components that comprise these shocks. Voters
do, however, know the variances of the distributions of these different kinds of shocks and so are
able to solve a well-defined signal-extraction problem that produces a competence signal.” At the
opposite extreme, scholars have suggested that retrospective voting is often short-sighted (Achen
and Bartels 2004; Bartels 2008, chapter 4) and that voters routinely punish incumbents for such
uncontrollable “failures” as droughts, shark attacks, and lost football games (Achen and Bartels
2009; Healy, Malhotra, and Mo 2010). Analyses like these raise the question of whether

6
elections provide meaningful retrospective accountability, much less ideological or policy
“mandates.”
The Impact of Economic Conditions
To what extent have electoral responses to the Great Recession been directly shaped by
economic conditions? Table 1 lists 42 parliamentary elections conducted in 28 OECD countries
between 2007 and 2011. For each election, the table records the ideological profile of the
incumbent party, total real GDP growth in the four quarters leading up to the election, and the
increase or decrease in the incumbent party’s vote share by comparison with the previous
election.2 In most cases the “incumbent party” is the largest party in the government; however, in
seven cases where coalition governments included two roughly equal partners I have totaled the
vote gains or losses for both major incumbent parties.3
2 Election results are for the lower house of each country’s national parliament. In presidential systems, I
treat the president’s party as the incumbent party. I exclude elections in Belgium in 2007 and 2010 (a
prolonged constitutional crisis produced a series of caretaker governments), the Czech Republic in 2010
(an interim government of experts nominated by both major parties had replaced the previous incumbent
government 14 months before the election), Korea in 2008 (partisan turnover in a presidential election
four months earlier blurred responsibility), and Switzerland in 2007 and 2011 (all major parties
participated in a plural executive). Election data are from NSD European Election Database,
supplemented with various national sources for non-European countries.
3 Parallel analyses focusing solely on vote gains or losses for the prime minister’s party produce results
generally similar to those reported here. Coalition governments include Estonia in 2007 (the Centre Party
received 25.4% of the vote in the preceding election, while the Reform Party received 17.7% but included
the incumbent prime minister), Finland in 2007 (Centre Party with 24.7% and Social Democrats with
24.5%), Austria in 2008 (Social Democratic Party with 35.3% and People’s Party with 34.3%), Israel in
2009 (Kadima with 22.0% and Labor with 15.1%), Germany in 2009 (CDU/CSU with 35.2% and SPD
7
[Table 1]
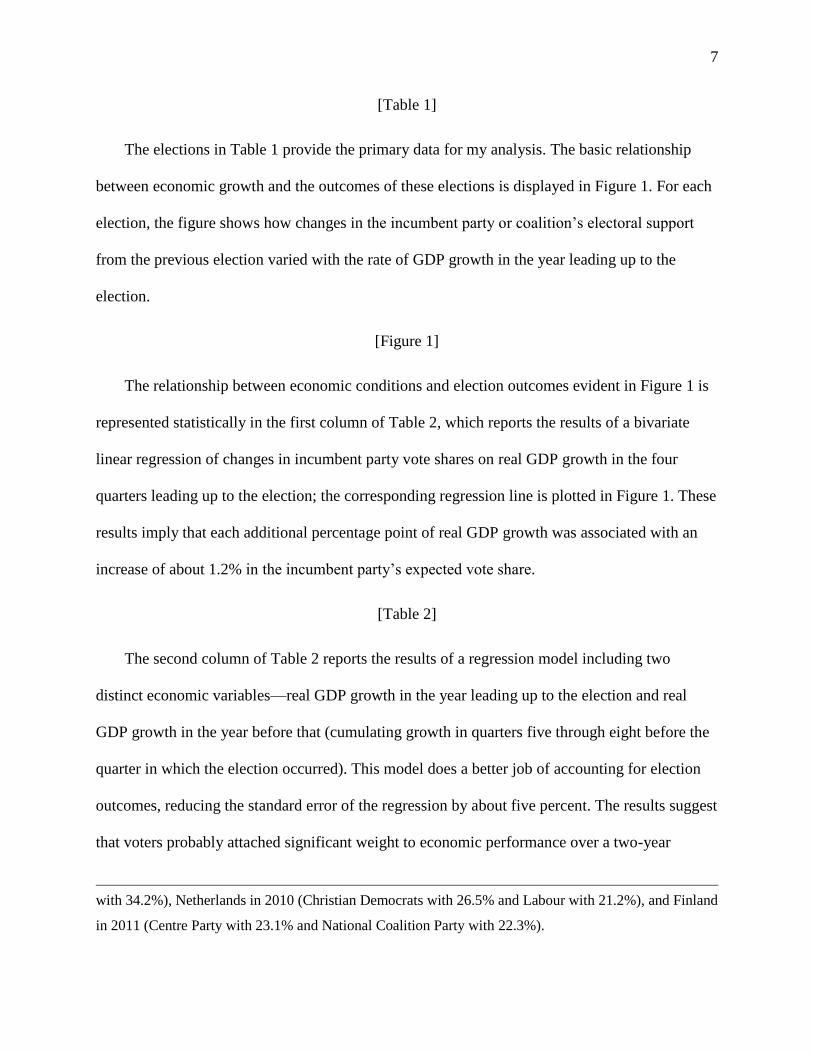
The elections in Table 1 provide the primary data for my analysis. The basic relationship
between economic growth and the outcomes of these elections is displayed in Figure 1. For each
election, the figure shows how changes in the incumbent party or coalition’s electoral support
from the previous election varied with the rate of GDP growth in the year leading up to the
election.
[Figure 1]
The relationship between economic conditions and election outcomes evident in Figure 1 is
represented statistically in the first column of Table 2, which reports the results of a bivariate
linear regression of changes in incumbent party vote shares on real GDP growth in the four
quarters leading up to the election; the corresponding regression line is plotted in Figure 1. These
results imply that each additional percentage point of real GDP growth was associated with an
increase of about 1.2% in the incumbent party’s expected vote share.
[Table 2]
The second column of Table 2 reports the results of a regression model including two
distinct economic variables—real GDP growth in the year leading up to the election and real
GDP growth in the year before that (cumulating growth in quarters five through eight before the
quarter in which the election occurred). This model does a better job of accounting for election
outcomes, reducing the standard error of the regression by about five percent. The results suggest
that voters probably attached significant weight to economic performance over a two-year
with 34.2%), Netherlands in 2010 (Christian Democrats with 26.5% and Labour with 21.2%), and Finland
in 2011 (Centre Party with 23.1% and National Coalition Party with 22.3%).

8
horizon. However, the estimated weight attached to earlier economic growth is only a little more
than half the estimated weight attached to election-year growth, suggesting that voters
significantly discounted earlier growth in favor of growth in the quarters immediately preceding
the election (Achen and Bartels 2004; Bartels 2008, chapter 4). This relationship is presented
graphically in Figure 2.4
[Figure 2]
The third and fourth columns of Table 2 present the results of additional regression analyses
probing the impact on election outcomes of relative economic growth rates. I calculated relative
GDP growth by subtracting from each country’s growth rate in each quarter the OECD-average
growth rate in the same quarter. This would be a more appropriate measure of economic
conditions if voters in each country were comparing their own economy’s performance against
that of other OECD economies—in effect, making rough allowance for the impact of global
economic forces on national performance (Kayser and Peress 2011). However, the statistical
results provide little evidence that voters did use the global economic climate as a benchmark in
assessing the performance of their own governments. The regression analysis employing relative
GDP growth rates (reported in the third column of Table 2) accounts for election outcomes rather
less well than the analysis (in the second column) employing unadjusted growth rates. Even the
analysis reported in the fourth column, which includes both relative and absolute growth rates,
does not improve upon the fit of the simpler model employing only absolute growth rates. While
the parameter estimates for the more complex specification are too imprecise to rule out the
4 “Weighted GDP growth” in Figure 2 combines growth in quarters 1-4 before the election and growth in
quarters 5-8 before the election, each weighted by the associated parameter estimate in the second column
of Table 2: (1.02×(ΔGDP(1-4Q))+.56×(ΔGDP(5-8Q)))/(1.02+.56).

9
possibility that relative economic performance had some independent impact on election
outcomes, the weight of the evidence—such as it is—clearly suggests that absolute growth rather
than relative growth is what mattered to voters.5
The analysis presented in the fifth column of Table 2 adds another measure of economic
performance, the unemployment rate at the time of the election.6 The estimated effect of
unemployment on the incumbent party’s vote share is negative, but rather modest, and
incorporating it does little to improve the statistical fit of the model. Additional analyses (not
shown) failed to uncover any greater effect of unemployment among the 16 cases with left-of-
center governments, which might be more likely than right-of-center governments to be punished
for high unemployment.7 Nor did changes in unemployment in the year leading up to each
election have any reliable electoral impact, once GDP growth was taken into account.8
The sixth column of Table 2 reports regression results for the same model as in the second
column, but excluding the three biggest outliers in Figures 1 and 2—the elections in Hungary in
2010 and Ireland and Slovenia in 2011. In the first two cases, the effects of poor economic
performance were compounded by draconian austerity programs and by major political scandals,
producing disastrous electoral losses for the incumbent parties—the Socialist Party (MSZP) in
5 I also looked for effects of relative economic performance within the narrower confines of the Euro area
(using the average growth of Euro-area economies over the same period as the relevant benchmark) and
among the “old OECD” economies (excluding the United States) studied by Kayser and Peress (2011). In
both cases, election results were more strongly related to absolute economic performance than to relative
economic performance.
6 “Labour Force Statistics (MEI): Harmonized Unemployment Rates and Levels (HURs),” quarterly data
seasonally adjusted, OECD (http://stats.oecd.org).
7 The estimated effect of unemployment was −.53 (with a standard error of .44).
8 The estimated effect of the change in unemployment was −.93 (with a standard error of .81).

10
Hungary (−23.9%) and Fianna Fail in Ireland (−24.1%). In Slovenia, a no-confidence vote in the
National Assembly triggered an early election, and the incumbent Social Democrats lost two-
thirds of their previous electoral support (−20.4%) to a brand new party, Positive Slovenia, led
by the popular mayor of Ljubljana. Excluding these cases from the analysis reduces the
estimated impact of GDP growth in the year before the election by seven percent, while the
estimated impact of GDP growth in the preceding year is cut in half; nevertheless, it is clear from
these results that the apparent impact of economic conditions on election outcomes is not simply
an artifact of rare conjunctions of economic and political crises.9
Taken as a whole, the regression analyses in Table 2 provide empirical support for a rather
simple model of retrospective voting. Citizens in OECD countries generally rewarded their
governments when their economies grew robustly and punished their governments when
economic growth slowed.10
The magnitude of these rewards and punishments was substantial,
with differences in expected vote shares of 24 percentage points over the observed range of GDP
growth.
9 Omitting these three outliers from the analysis of relative growth reported in the third column of Table 2
reinforces the conclusion that relative growth matters less than absolute growth. The adjusted R2 statistic
falls from .29 to .15, whereas the comparable statistic for the analysis of absolute growth only falls from
.35 (in the second column of Table 2) to .33 (in the sixth column). The absolute growth model clearly fits
these data better than the relative growth model.
10 The parameter estimates in Table 2 imply that real GDP growth of about 4.5% per year would be
required for an incumbent government to maintain its vote share. The average real GDP growth rate in
OECD countries before the onset of the Great Recession (in 2005, 2006, and 2007) was a bit less than
3%. This discrepancy suggests that, even in normal economic times, incumbent governments are likely to
experience a gradually erosion of electoral support.

11
Not surprisingly, these statistical relationships between economic growth and election
outcomes leave a great deal of electoral politics unaccounted for. Much of this residual variation
presumably reflects the impact of a wide array of other considerations voters brought to the
polls—social concerns, wars and international crises, evaluations of the competence and
charisma of party leaders, stirring speeches, scandals, and on and on. In addition, the impact of
economic conditions themselves may have varied significantly from one election to another due
to variation in “the extent of political (or electoral) control of the economy; the concentration and
distribution of policy-making responsibility over parties; and the pattern of contention among the
parties for future policy-making responsibility” (Duch and Stevenson 2008, 338), among other
factors. Those variations are beyond the scope of the rudimentary analysis presented here.
Nevertheless, it is clear even from rudimentary analysis that elections in the wake of the Great
Recession were significantly influenced by voters’ consistent inclination to reward or punish
incumbent governments based on economic growth rates in the months leading up to an election.
Accidents of Timing: Spain and Portugal
One important implication of the results presented in Table 2 is that incumbent governments
are, to a significant degree, at the mercy of the electoral calendar. A reelection campaign in the
midst of an economic boom may provide a convenient opportunity for an incumbent government
to renew its popular mandate; conversely, facing the voters in the midst of an economic
downturn is likely to be hazardous to an incumbent government’s survival, even if the downturn
is global in scope.
The political significance of electoral timing may be illustrated by comparing the likely fate
of a government presiding over typical (OECD-average) economic conditions in early 2007,

12
before the onset of the Great Recession, with the likely fate of an otherwise similar government
presiding over typical economic conditions at the bottom of the recession, in the spring of 2009.
Applying the regression parameter estimates in the second column of Table 2 to the average
OECD growth rates in the first case suggests that a typical incumbent OECD government facing
the voters in early 2007 might have expected its vote share to decline by a modest 2.3 percentage
points. In contrast, an incumbent government facing the voters with an OECD-average growth
trajectory in the spring of 2009 could expect its vote share to decline by a disastrous 11.2
percentage points.
The contrasting electoral fates of the Socialist governments of Spain and Portugal during the
period covered by my analysis provide a more concrete illustration of the political ramifications
of election timing. The Spanish government led by Socialist Workers’ Party (PSOE) prime
minister José Luis Rodriguez Zapatero faced the voters in March 2008, just before slowing
economic growth in Spain (and in the OECD as a whole) slid into full-blown recession. The
Portuguese Socialist government of José Sócrates was less fortunate; its four-year mandate
expired in September 2009, just months after the Great Recession reached its nadir in Portugal
(and in the OECD as a whole). The result in Spain was a slight increase in the governing party’s
vote share, while the Portuguese Socialists suffered a substantial loss—and the loss of their
parliamentary majority.
In Spain, the governing PSOE began the three-month campaign period leading up to the
March 2008 election with a small—but dwindling—lead in the polls over the conservative
People’s Party. According to a report in The Times of London, “The economy expanded rapidly
during Mr Zapatero's four-year term in office, extending an uninterrupted, 15-year growth spurt.
But dark clouds are forming on the horizon, something the Opposition is doing its best to exploit.

13
Inflation is picking up, hurting household budgets; house prices are also starting to slip after a
decade-long boom.”11
The dark clouds on the horizon were not enough to derail the Socialist government in the
election. The opposition People’s Party gained 1.1% of the vote, but with an erosion of support
for minor parties, the PSOE also gained slightly (0.6%), producing a 4.5% popular vote margin.
The PSOE gained five seats in the 350-seat Congress of Deputies, maintaining a narrow plurality
that allowed Zapatero to continue as prime minister for up to four more years. Nevertheless, the
shadow hanging over the Socialists’ reelection was evident in a morning-after report in The
Economist , which noted that Zapatero “must turn his attention to the mounting economic
problems facing Spain. … Inflation is running at 4.3%, a housing boom has bust, unemployment
is growing and once robust growth is slowing rapidly. … And with global financial turmoil
adding to Spain’s woes, the difficult bit is just starting.”12
For the Zapatero government, the “difficult bit” was indeed “just starting.” Spain’s economy
was stagnant in the first quarter following the election, then experienced six consecutive quarters
of declining real GDP and steadily escalating unemployment.13
Had an election been held in the
fall of 2009, when voters in Portugal went to the polls, the statistical analysis reported in the
second column of Table 2 suggests that the deterioration in economic conditions since early 2008
11 Thomas Catan, “Spain Gets March Election as Zapatero Struggles to Stay in Office,” The Sunday
Times, January 15, 2008 (http://www.timesonline.co.uk/tol/news/world/europe/article3187271.ece).
12 “Spain’s Election: Back for More,” The Economist, March 10, 2008
(http://www.economist.com/node/10833787).
13 The unemployment rate doubled in the 18 months following the election, from 9.4% to 18.9%, and has
since increased even further, reaching 23% by the time of the November 2011 election.

14
would have cost the PSOE an additional 8.8% of the vote—more than enough to doom the
Socialist government.
The narrow window of political survival for the Spanish Socialists is evident in opinion
surveys conducted by the Centro de Investigaciones Sociológicas (CIS) in Madrid. In July
2008—just four months after the election—CIS’s “vote estimate” showed the PSOE and the
People’s Party in a dead heat. By October 2009 the People’s Party held a slim (3.3%) lead. By
early 2011 that lead had swelled to ten percentage points.14
With Zapatero’s popularity having “plummeted close to historic lows for a Spanish head of
government,” the prime minister first announced that he would step down upon completion of
his term, then acceded to mounting pressure to call an early election despite the likelihood that
the PSOE would lose its parliamentary majority.15
In the November 2011 election the party’s
vote share declined by almost 15 percentage points, resulting in the loss of 59 of its 169 seats in
the Congress of Deputies. The People’s Party won an absolute majority of seats. Nevertheless,
the Socialist government had had 44 months of its original 48-month term in which to attempt to
engineer an economic rebound before facing the verdict of the electorate.
The electoral calendar was less kind to the Socialist government of Portugal, which had to
face the voters in September 2009, just as the Portuguese economy was emerging from a year-
long recession in which real GDP contracted by 4%. Economic conditions in Portugal were no
14 Centro de Investigaciones Sociológicas, “Indicadores Electorales”
(http://www.cis.es/cis/opencms/EN/11_barometros/Indicadores_PI/electorales.html); “Estimación de
Voto” (http://www.cis.es/cis/opencms/-Archivos/Indicadores/documentos_html/sB606050020.html).
15 Raphael Minder, “Spanish Premier Says He Won’t Seek a New Term,” New York Times, April 4, 2011,
page A11. Raphael Minder, “Spanish Premier, Under Pressure, Calls Election for November,” New York
Times, July 30, 2011, page A5.

15
worse—indeed, they were somewhat less bad—than elsewhere at this point in the global
economic downturn.16
Thus, voters assessing the incumbent government’s performance in
comparative context might have been inclined to reward the Socialists for preventing a worse
downturn. But that is not what happened. The Socialist Party’s vote share declined by 8.5% from
2005 to 2009, producing a loss of 24 seats—and majority status—in the 230-seat Assembly.
Most of the votes lost by the Socialists did not go to the opposition Social Democrats, but to
two smaller parties—the Left Bloc and the People’s Party, a conservative Christian democratic
party. These results suggest that there was no consistent ideological basis for the turn against the
Socialists, but a general disaffection with the party in power when the economy plunged.
Only the Socialists’ substantial cushion of electoral support (reflected in a 16% vote margin
over the Social Democrats in the 2005 parliamentary election) allowed Sócrates to carry on as
prime minister for another 18 months, albeit without a majority in the Assembly. In March 2011,
when none of the five opposition parties proved willing to support the austerity program
demanded by the European Union in exchange for a bailout—the last in a year-long series of
austerity measures in response to Portugal’s burgeoning debt crisis—Sócrates was forced to
resign and an early election was scheduled for June 2011.
The Socialists’ 8.5% loss in the 2009 Portuguese election nearly matches the expected loss
of 10.3% implied by the statistical results presented in the second column of Table 2. However,
the same statistical results suggest that if the Socialist government had faced the voters in early
16 Portugal’s real GDP grew by 0.8% in the second quarter of 2009, while the rest of the Euro area was
still contracting. The cumulative decline in real GDP over the two years leading up to the election
amounted to 2.3% in Portugal, 3.8% in the Euro area, and 3.5% in the OECD as a whole. Portuguese
unemployment stood at 11.1% at the time of the election—slightly higher than the Euro-area average of
10%, but far below the 18.9% level in neighboring Spain.

16
2008, as the Zapatero government did in Spain, it probably would have lost only one or two
percentage points, and its absolute majority in the Assembly would have been comfortably
preserved for another four years—long enough to adopt prime minister Sócrates’s austerity
program and, perhaps, begin to see its effects before the next election.
Instead, Portuguese voters went to the polls once again in June 2011 with their economy
stagnant, unemployment rising, and a steady diet of painful austerity measures on the horizon.
The Socialists garnered only about 28% of the vote—another 8.6% loss on top of the 8.5% loss
they had suffered in 2009. Sócrates conceded defeat halfway through the vote-counting, and the
Social Democratic leader, Pedro Passos Coelho, prepared to lead a new center-right coalition
government including the conservative People’s Party. One voter, a social worker quoted by the
New York Times, “said that he continued to feel ‘ideologically on the left,’ but had voted for the
first time for the Social Democrats on Sunday. ‘When you have hit the wall like our economy
has, you have to accept that it’s time to gamble on a change of direction and give somebody new
a chance,’ he said.”17
Ideology: A Turn to the Right?
A variety of political observers have seemed to find “something surprising about the failure
of center-left parties to benefit from the crisis of financial capitalism” that triggered the Great
Recession (Lindvall 2011, 1). For example, The Economist observed that in elections to the
European Parliament in June 2009, at the bottom of the economic downturn, parties of the left
17 Raphael Minder, “Social Democrats Claim a Strong Victory in Portugal,” New York Times, June 6,
2011, page A9.

17
had “failed to capitalise on an economic crisis tailor-made for critics of the free market.”18
Two
years (and more than a dozen national elections) later, prominent American political consultant
Stanley Greenberg wrote that “During this period of economic crisis and uncertainty, voters are
generally turning to conservative and right-wing political parties, most notably in Europe and
Canada. It’s perplexing. When unemployment is high, and the rich are getting richer, you would
think that voters of average means would flock to progressives, who are supposed to have their
interests in mind—and who historically have delivered for them.” Instead, he suggested, “many
voters in the developed world are turning away from Democrats, Socialists, liberals and
progressives.”19
Greenberg’s perplexity is understandable if one supposes that voters are animated by the
same ideological understandings that are commonplace among political elites, including most
journalists, political scientists, and activists. However, if average voters are mostly inattentive to
the manifestos of “critics of the free market” and skeptical of assertions about which parties
“historically have delivered for them,” it may not be so surprising to find them behaving in ways
that confound conventional ideological expectations.
One virtue of systematic comparative electoral analysis is that it can help to suggest
alternative explanations for observed election outcomes. Table 3 reports the results of a variety
of statistical analyses intended to test whether voters in OECD countries in the midst of the Great
Recession displayed any consistent preference for left-wing or right-wing governments. I classify
the incumbent government in each country as Left (+1), Center (0), or Right (−1), or (in a few
18 “The European Elections: Swing Low, Swing Right.” The Economist, June 11, 2009 (quoted by
Lindvall 2011).
19 Stanley B. Greenberg, “Why Voters Tune Out Democrats,” New York Times, July 31, 2011, page SR1.

18
cases of coalition governments) Center/Left (+.5) or Center/Right (−.5). This simple
classification is not intended to reflect the absolute ideological position of each government, but
to characterize its relative position in the political context of its own country.20
[Table 3]
The results presented in the first column of Table 3 indicate that, on average, left-wing
governments did do less well at the polls than right-wing governments did over the period
covered by my analysis.21
However, adding the GDP growth variables from Table 2 to the
analysis (in the second column of Table 3) produces a considerably smaller ideological
difference, suggesting that much of the apparent effect of ideology in the simpler regression
analysis reflected worse economic conditions at election time under left-wing governments than
under right-wing governments. Omitting the three most significant outlier elections—Hungary
(2010), Ireland (2011), and Slovenia (2011)—from the analysis in the third column further
reduces the apparent impact of ideology. Limiting the analysis to the 35 cases in which a single
party governed alone or was clearly a senior coalition partner (in the fourth column) leaves the
results essentially unchanged. Taken together, these results imply that retrospective voting was a
stronger and more consistent factor than ideology in accounting for election outcomes in OECD
countries during the five years covered by my analysis.
20 Since my interest is in economic ideology, I classify governing parties based on that dimension. For
example, Poland’s Law and Justice Party and Civic Platform Party are classified as centrist and right-
wing, respectively, despite the fact that the former is more conservative on social issues. See Ben Stanley,
“Party Placement in Two-Dimensional Issue Space, 2011,” at Polish Party Politics
(http://polishpartypolitics.com/2012/03/23/party-placement-in-two-dimensional-issue-space-2011/).
21 The average vote losses for Left and Right incumbents were 6.9% and 0.6%, respectively.

19
The analyses reported in the fifth and sixth columns of Table 3 test two alternative
specifications representing slightly more subtle ways in which ideology might influence voters’
responses to the crisis. The interaction between Government Left-Ideology and the timing of each
election (measured in years elapsed since the beginning of 2007) allows for the possibility that
ideological preferences gradually shifted in favor of left-wing (or right-wing) governments as the
economic crisis evolved. For example, Lindvall (2012, 514) argued that “the political
consequences of the Great Recession and the Great Depression were remarkably similar: in the
first phase of both crises, right-wing parties did significantly better than left-wing parties; after
approximately three years, left-wing parties began to recover.” That pattern would be reflected
by a larger negative coefficient for Government Left-Ideology in the fifth column of Table 3
(reflecting the “significantly better” performance of right-wing parties early in the crisis), and a
positive coefficient for the interaction between Left-Ideology and Year (reflecting the recovery of
left-wing parties with the passage of time). In fact, the temporal pattern here turns out to be the
opposite of Lindvall’s—left-wing governments did worse in later elections than in earlier ones,
holding economic conditions constant—though the statistical results are far too imprecise to be
reliable.
Finally, the interaction between Government Left-Ideology and GDP growth over the year
leading up to the election, in the sixth column of Table 3, allows for the possibility that voters’
sensitivity to economic conditions was greater for left-wing governments than for right-wing
governments or vice versa. However, there is no evidence in the data for this possibility either.
On the whole, the statistical results reported in Table 3 provide little evidence that voters
reacting to the Great Recession made any meaningful ideological distinctions between left-wing
and right-wing governments. Of course, that does not imply that voters did not bring ideological

20
values to bear in casting their votes. For one thing, the distribution of durable ideological
commitments in each country’s electorate was presumably already reflected in the previous vote
share of the incumbent party or parties, which serves as a baseline for my analysis of shifts in
vote shares from one election to the next. Moreover, cross-national analysis of the sort presented
here can only detect a consistent shift in ideological predilections across the diverse set of
countries included in my analysis. If some electorates shifted to the left in response to the crisis
while others shifted to the right, there may be no clear ideological pattern in the cross-national
data—as there is no clear ideological pattern in the statistical results reported in Table 3. More
detailed analysis of specific elections in specific countries might nevertheless provide evidence
of consequential ideological shifts.
Germany: Diffusion of Responsibility
Germany held a federal election on 27 September 2009—the same day as Portugal. As in
Portugal, the timing looked inauspicious for the incumbent government, a “grand coalition”
pairing chancellor Angela Merkel’s Christian Democratic Union (and its Bavarian sister party,
the Christian Social Union) with its largest competitor, the Social Democratic Party (SPD).
Economic conditions in Germany at the time of the election were in some respects even worse
than in Portugal; real GDP had declined by a disastrous 5.6% over the previous year, and the
OECD consumer confidence index stood at 95.7, well below the European and OECD averages
at the time.
At first glance, the German election outcome was exactly what might have been expected
given these dire economic conditions. The governing parties lost a combined 12.6% of the
popular vote, putting the outcome right on the regression lines in Figures 1 and 2. However, the

21
two coalition partners did not share equally in this electoral rout. The SPD’s vote share declined
by 11.2% (from 34.2% in 2005 to 23.0%), while the CDU/CSU vote share declined by only
1.4% (from 35.2% to 33.8%). Chancellor Merkel jettisoned her chastened left-wing partner in
favor of a new governing coalition with the smaller, center-right Free Democratic Party (FDP)—
precisely the result she had angled for during the campaign.
This result seems puzzling from either of the perspectives considered here. If Germans were
simply engaging in retrospective voting, as the close fit with the overall patterns in Figures 1 and
2 might suggest, why did they choose to punish the SPD but not the CDU/CSU for the country’s
economic distress? On the other hand, if they were voting for an ideological shift to the right,
spurning the SPD and endorsing the FDP as a new coalition partner, what basis did they have for
thinking that the new coalition’s economic policies would be any more successful than the old
coalition’s policies had been?
The puzzle is reinforced by survey data suggesting that Germans were less in the mood to
punish their leaders than might have been expected given the dire economic situation. In a cross-
national opinion survey conducted by WorldPublicOpinion.org in May—just four months before
the election—only 27% of Germans said that their own country’s economic policies contributed
“a lot” to the economic downturn.22
Germans were less likely than citizens in any other country
except China and India to say that their own government’s efforts to address the crisis did not go
far enough. This relative satisfaction with the government’s handling of the crisis is striking in
light of the fact that Germany’s GDP had declined by 6.8% in the year leading up to the survey.
22 “Public Opinion on the Global Economic Crisis,” July 21, 2009
(http://www.worldpublicopinion.org/pipa/pdf/jul09/WPO_FinCrisis_Jul09_quaire.pdf).

22
Responses to some other questions in the same survey shed some additional light on this
seemingly anomalous German popular response to the crisis. While only 27% of Germans said
that Germany’s economic policies contributed “a lot” to the economic downturn, 68% (more
than in any country other than South Korea) said that the economic policies of the United States
contributed a lot; 78% blamed their own country’s bankers taking excessive risks; and 88%
(more than in any other country in the survey) blamed international bankers taking excessive
risks. These results suggest that citizens in Germany, perhaps more than anyplace else in the
developed world, interpreted the economic downturn as symptomatic of an external financial
shock rather than a domestic political failure.
The concrete impact of the crisis on citizens was ameliorated by the existing German
welfare state, and also by a variety of extraordinary measures intended “to ease workers’ pain
ahead of the election. The government launched a $116 billion stimulus package, subsidized the
wages of workers on short hours, boosted welfare payments, and instituted a popular cash-for-
clunkers program to spur auto production and purchases. Employers privately admit to business
publications that they’ve held off on mass layoffs prior to the election.”23
Thus, while the
proportion of Germans who said that national economic conditions were “bad” peaked at almost
50% in March 2009, the proportion who said that their own economic circumstances were bad
“fluctuated between 10 and 15 percent … through the ups and downs of the greatest economic
crisis since the Great Depression” (Anderson and Hecht 2011, 5).
For his part, the leader of the SPD, foreign minister Frank-Walter Steinmeier, launched his
party’s election campaign by promising new policies to address the crisis, including raising the
23 Folko Mueller and Lee Sustar, “The Left in the German Elections,” SocialistWorker.org, September 25,
2009 (http://socialistworker.org/2009/09/25/left-german-elections).

23
top tax rate, bolstering the minimum wage, and supporting the struggling German carmaker
Opel. However, the dissonance between this platform and the policies the SPD had been
supporting as part of the grand coalition generated swift simultaneous attacks from the right and
from the left. The general secretary of the CDU “dubbed Steinmeier ‘Wobbly Walter’ and said
that the SPD ‘shift to the left is now a done deal.’” The SPD’s prospective coalition partner on
the left, the Greens, responded equally critically: “What the SPD is proposing today is the
opposite of what they did during four years in the grand coalition. So we have to ask them: ‘Are
you really serious?’”24
Perhaps as a result, while only 40% of respondents in a pre-election
survey trusted Merkel to handle the continuing economic crisis, vastly fewer—a mere 9%—
expressed similar confidence in Steinmeier.25
While the “awkward yoking” of “historically bitter rivals” in the grand coalition clearly
created a strategic dilemma for the SPD, it also seems to have made for a campaign devoid of
drama.26
According to one press report, the CDU and SPD “tended to defend their government’s
record rather than challenge one another. A televised debate September 13 found Merkel and
Steinmeier agreeing more often than not.”27
“Despite the difficult issues and choices that lie
ahead,” another said, “the race has largely steered clear of substantive discussion and debate.”
24 “Steinmeier Determined to Topple Merkel in German Elections,” Deutsche Welle, 19 April, 2009
(http:// www.dw-world.de/dw/article/0,,4190864,00.html).
25 Nicholas Kulish, “Before Election, Not a Voter Was Stirring,” New York Times, August 20, 2009, page
A6.
26 Henry Chu, “German Election a Yawner for Voters,” Los Angeles Times, September 27, 2009
(http://articles.latimes.com/2009/sep/27/world/fg-germany-election27).
27 Folko Mueller and Lee Sustar, “The Left in the German Elections,” SocialistWorker.org, September 25,
2009 (http://socialistworker.org/2009/09/25/left-german-elections).

24
Chancellor Merkel’s high approval ratings “have encouraged her to play it safe and sedate in the
campaign” while hoping that the pro-business Free Democratic Party would gain enough support
to emerge as a feasible coalition partner.28
The reality of German coalition politics produced yet another barrier to electoral
accountability. A voter disinclined to support either of the current governing parties would be
forced to choose among a variety of minor parties, the largest of which (FDP, The Left, and the
Greens) had received less than 10% of the vote in the last election. But, as Anderson and Hecht
(2011, 7) noted, “whichever of the smaller parties such a voter chose would inevitably be forced
into a coalition with one of the existing governing parties, given the necessity to achieve a
majority in parliament to form a government.” Thus, one or the other of the partners in the grand
coalition—Merkel or Steinmeier—would be the next chancellor regardless of what German
voters thought of the coalition’s performance over the previous four years.
In short, as Anderson and Hecht (2011, 1) put it, “several factors mitigated against strong
economic voting effects: voters did not experience much personal economic hardship, the
problems produced by the crisis were not homemade, and the alternatives to the incumbent
government [were] muddled.” Nevertheless, their detailed analysis of voting behavior based on
data from the German Longitudinal Election Study (GLES) found that voters’ assessments of
how their own economic circumstances had changed over the past two years did have a
significant impact on which party they supported—though not on which of the governing parties
they supported. Voters who said they had fared badly during the recession were slightly more
likely to choose the SPD over the CDU; but they were much more likely to choose the FDP or
28 Henry Chu, “German Election a Yawner for Voters,” Los Angeles Times, September 27, 2009
(http://articles.latimes.com/2009/sep/27/world/fg-germany-election27).

25
(especially) the Left Party over either of the coalition partners (Anderson and Hecht 2011, 9). As
the authors put it (2011, 12), “voters who personally had suffered during the crisis deserted the
two governing parties in almost equal measure.”
The fact that voters directly affected by the Great Recession seem to have punished both
governing parties similarly at the polls—and defected to smaller parties on both the left and the
right—suggests that retrospective voting in this instance was, to a good approximation,
ideologically neutral. However, the fact remains that the SPD’s vote share fell much more
precipitously than the CDU/CSU’s. Anderson and Hecht’s analysis leaves that striking
asymmetry unaccounted for. Perhaps it reflected a preference among German voters for the tax
cuts and labor market reforms promised by the CDU/CSU (and FDP) over the conventional
leftist policies proposed by the SPD?
Another analysis of the GLES survey data sheds additional light on the relative electoral
fortunes of the two partners in Germany’s grand coalition. Rohrschneider, Schmitt-Beck, and
Jung (2010, 23, 22) argued that because the coalition between the two largest parties “precluded
a campaign that offered clear choices” on policy grounds, voters were “particularly prone to rely
on simple shortcuts such as candidate personality to arrive at decisions”—and that these simple
shortcuts strongly favored Merkel over Steinmeier. The authors’ statistical analysis
(Rohrschneider, Schmitt-Beck, and Jung 2010, Table 1) provided support for their interpretation.
Voters’ choices were most strongly influenced by their preferences for Merkel or Steinmeier as
chancellor, and somewhat less affected by evaluations of the CDU/CSU and SPD. Once these
personal and party evaluations were taken into account, vote choices were virtually unaffected by
ideological self-placements, specific policy positions, or other political values.

26
This analysis suggests that the “muddle” of accountability produced by Germany’s grand
coalition resulted in a personal victory for Chancellor Merkel rather than an ideological mandate.
In the days after the election, The Economist suggested hopefully that the outcome would allow
Merkel to “escape from the cage of the ‘grand coalition’” and pursue “many of the reforms that
Germany needs, including to its tax and welfare systems, and to health care and the labour
market.”29
However, the New York Times was a good deal more cautious, noting that German
voters had “shown little appetite for drastic change in the midst of the economic crisis.”30
The Electoral Impact of Policy Choices
The statistical analyses reported in Table 3 provide little evidence of any consistent
ideological impulse in election outcomes in the wake of the Great Recession. However, the broad
ideological classification of incumbent governments employed in those analyses may not be
indicative of the specific policies governments adopted in response to the economic crisis. If left-
of-center governments generally did not pursue conventional left-of-center policies, such as
Keynesian fiscal stimulus measures and deficit spending—or if centrist and right-of-center
governments also pursued those policies, as seems to have been the case in Germany—then
voters might have little reason to be swayed one way or the other by conventional ideological
labels.
The statistical analyses reported in Table 4 explore the relationship between broad
ideologies and specific policy choices in response to the Great Recession. As it turns out, that
29 “Merkel’s Moment,” The Economist, October 1, 2009 (http://www.economist.com/node/14548863).
30 Nicholas Kulish, “Merkel’s Party Claims Victory in Germany,” New York Times, September 27, 2009
(http://www.nytimes.com/2009/09/28/world/europe/28germany.html).

27
relationship is very modest, revealing almost no connection between ideologies and policies.
Indeed, the statistical analyses suggest that major policy choices in the wake of the economic
crisis were mostly unrelated to a variety of fundamental political and economic indicators,
including the ideology of the governing party or coalition, wealth, prior indebtedness, and the
severity of the recession in each country.
[Table 4]
The regression analysis reported in the first column of Table 4 focuses on government
debt.31
The cumulative growth in central government debt from 2007 to 2010 exceeded 40% of
GDP in Iceland (58.1%), Britain, Greece and Ireland. The United States, Japan, Spain and
Portugal saw increases in debt ranging from 20% to 26% of GDP. The level of debt increased by
5% to15% of GDP in most other OECD countries, with the exception of Sweden and Israel,
which slightly reduced their outstanding debt.
The parameter estimates in Table 4 indicate that left-wing governments accumulated only
slightly more debt over the course of the economic crisis than right-wing governments did—an
additional 1% of GDP, other things being equal.32
Nor is there any evidence that incremental
debt was driven by the depth of the recession in a given country (the estimated effect of 2008
GDP growth is actually positive, though quite imprecise) or its level of economic development
31 “Central Government Debt: Total central government debt (% GDP),” OECD (http://stats.oecd.org). I
have tabulated the growth in outstanding debt from 2007 to 2010 (extrapolating Japan in 2010).
32 Allowing for a statistical interaction between ideology and the severity of the recession suggests that
left-wing governments may have been more sensitive to economic conditions in accumulating debt than
right-wing governments were; but this difference is far from being statistically “significant,” and mostly
reflects the anomalous case of Greece, where a substantial debt crisis coincided with a relatively modest
decline in GDP in 2008.
28
(as measured by GDP per capita in 2007). Finally, the expectation that debt accumulation might
be constrained by existing indebtedness is confounded by a modest (and also quite imprecise)
positive coefficient on prior debt (as measured by total debt in 2007 relative to GDP).
The regression analyses reported in the remaining columns of Table 4 focus on three more
specific aspects of governments’ fiscal policies at the height of the crisis, in 2009: (1) cyclical
deficits resulting from declines in tax revenues and increased spending on “automatic stabilizers”
such as unemployment insurance; (2) discretionary stimulus spending; and (3) other
discretionary spending such as bailouts and nationalizations.33
Here, too, there is surprisingly
little evidence of systematic connections between ideologies and economic conditions on one
hand and policy choices in response to the Great Recession on the other.
Cyclical deficits were substantial in every OECD country, ranging from 3% of GDP in the
United States to 8.7% in Sweden. Some of this variation no doubt reflects differences in the
structure of welfare states resulting from durable ideological differences among countries (as the
examples of the U.S. and Sweden suggest). However, the ideological complexion of the
incumbent government in each country seems to have had little or no bearing on the magnitude
of the cyclical deficit it incurred in 2009. Rather, the statistical results presented in the second
column of Table 4 suggest that the magnitude of each country’s cyclical deficit mostly reflected
the severity of its recession—as we would expect if this spending was an automatic response to
the downturn rather than a fiscal policy choice. There is also some evidence that preexisting debt
moderated cyclical responses to the recession, with an 18% increase in 2007 indebtedness
(roughly, the difference between a typical country like Germany or Britain and a low-debt
country like Canada or New Zealand) counterbalancing an additional 1% decline in GDP.
33 Projected spending data from OECD June 2009 Economic Outlook tabulated by Ansell (2010, Table 2).

29
Discretionary stimulus programs were smaller in magnitude, ranging from less than 1% of
GDP in Italy, Switzerland, France, and Portugal to 4.5% in Japan—though in Hungary, Iceland,
and Ireland, draconian austerity programs produced substantial declines in discretionary
spending (ranging from 6.5% to 7.7% of GDP) in 2009. Again, the results in Table 4 reveal no
consistent relationship between the ideological complexion of each country’s government and its
fiscal policy—if anything, left-wing governments may have spent slightly less on stimulus
programs than right-wing governments did, other things being equal. However, once cases of
significant fiscal contraction are set aside, there is some indication that ideology influenced the
relationship between GDP growth and discretionary stimulus spending, with left-wing
governments spending more in countries with mild recessions and right-wing governments
spending more in countries with more severe downturns.34
Other discretionary spending also varied substantially across OECD countries, with major
bailouts in all of the English-speaking democracies (ranging from 4.5% of GDP in the United
States to 8.8% in the United Kingdom). Here, too, the statistical analysis (summarized in the
fourth column of Table 4) suggests that the cross-national differences are not easily explained by
differences in ideology or economic circumstances. Richer countries and those with left-wing
34 Altering the regression model in the third column of Table 4 to include an interaction between ideology
and GDP change produces a coefficient of 1.16 (with a standard error of 1.78) for the main effect of
ideology and a coefficient of .42 (with a standard error of .35) for the interaction term. Excluding the
three cases with substantial fiscal contractions—Hungary, Iceland, and Ireland—the corresponding
parameter estimates are .60 (with a standard error of .42) and .30 (with a standard error of .09). The latter
estimates suggest that a mild recession like Norway’s (GDP growth of −1.1%) would produce an
expected discretionary stimulus amounting to 2.3% of GDP under a left-wing government and 1.8%
under a right-wing government, while a more severe downturn like Germany’s (−6.8%) would produce an
expected stimulus of only 0.8% under a left-wing government but 3.7% under a right-wing government.

30
governments may have been slightly more prone to bailouts, other things being equal, but the
differences are fairly small and statistically unreliable.
Did voters reward or punish their political leaders for engaging in Keynesian fiscal policies
in response to the Great Recession? The regression analyses reported in Table 5 explore the
electoral impact of the policy choices of incumbent governments. Since the OECD spending data
employed here are projections for 2009, the analyses are limited to elections from 2009 through
2011.
[Table 5]
The regression analyses reported in the first three columns of Table 5 focus on the electoral
impact of government debt. The simple bivariate regression of incumbent electoral performance
on incremental debt, presented in the first column of the table, suggests that each additional
percentage point of debt accumulated by a government over the three years of the crisis (2008,
2009, and 2010) reduced the incumbent government’s vote share by a quarter of a percentage
point. This is a fairly strong relationship, suggesting, for example, that the ballooning debts of
Greece, Ireland, and the United Kingdom depressed electoral support for their incumbent
governments by as much as 10 percentage points. However, part of that relationship is spurious,
reflecting the fact that governments in worse economic circumstances were more likely to resort
to substantial increases in debt. When real GDP growth rates in the year leading up to each
election are added to the analysis (in the second column of Table 5) the apparent effect of
incremental government debt is cut almost in half. This estimate implies that the debt increases
in Greece, Ireland, and the United Kingdom probably cost their incumbent governments five or
six percentage points at the polls, while a typical accumulation of debt—about 12% of GDP—

31
would have cost an incumbent government only one or two percentage points.35
Excluding the
three countries that pursued stringent austerity programs—Hungary, Iceland, and Ireland—from
the analysis (reported in the third column of Table 5) reduces the apparent electoral impact of
debt still further.
The regression analyses reported in the last three columns of Table 5 focus on the electoral
impact of specific aspects of governments’ fiscal policies at the height of the recession, in 2009.
The analysis in the fourth column relates each incumbent party’s vote share (in the 17 countries
with elections after 2008 for which the relevant data are available) to the magnitude of the
cyclical deficit, discretionary stimulus spending, and bailouts and nationalizations. This analysis
suggests that, even after allowing for the electoral impact of overall GDP growth, discretionary
stimulus spending had a significant electoral payoff—while cyclical deficit spending and
bailouts and nationalizations, if they had any effect at all, were probably harmful to incumbents’
electoral prospects.
The parameter estimate for discretionary spending suggests that robust stimulus programs in
Japan, Sweden, Australia, Denmark, Germany, Finland, and New Zealand (ranging from 3.0% to
4.5% of GDP) probably netted incumbent governments an extra four to six percentage points at
the polls, whereas severe retrenchments in Iceland, Hungary, and Ireland (ranging from 6.5% to
7.7% of GDP) cost the incumbent governments in those countries nine or ten percentage points
when they stood for reelection. Analyses excluding the three countries with stringent austerity
35 Separate analyses for left-wing and right-wing governments suggest that the latter may have been more
severely punished by voters for accumulating debt; but .8% under a right-wing government, while a more
severe downturn like Germany’s (−6.8%) would produce an expected stimulus of only 0.8% under a left-
wing government but 3.7% under a right-wing government.

32
programs—in the fifth and sixth columns of Table 5—suggest an even larger electoral impact of
stimulus spending, though the parameter estimates are much less precise.
The apparent impact of discretionary stimulus spending provides the strongest evidence I
have found of a significant electoral response to governments’ fiscal policy choices during the
Great Recession. However, even this evidence is unavoidably fragile, given the limitations of the
data on which it is based. The basic relationship between incumbents’ vote shares and
discretionary stimulus spending is displayed in Figure 3. While the relationship is clearly
positive (and the slope of the bivariate regression closely matches the corresponding parameter
estimate in the fourth column of Table 5), the disparity in policies between the 14 countries with
modest stimulus programs and the three with severe austerity programs provides rather little
statistical leverage for assessing the electoral effects of less drastic policy differences. However,
excluding the three austerity cases leaves the bivariate relationship between stimulus spending
and election outcomes (represented by the dotted line in Figure 3) virtually unchanged. Thus, it
seems likely—though by no means certain—that voters did punish incumbent governments for
austerity and rewarded them for stimulating their economies in a period of crisis.
[Figure 3]
The United States: A Rejection, But of What?
Barack Obama’s historic victory in the 2008 U.S. presidential election was portrayed by
enthusiastic pundits as a “rebirth of American liberalism,” “the culmination of a Democratic
realignment that began in the 1990s,” and the advent of a “transformative” progressive
presidency. The atmosphere of crisis in which Obama took office reinforced expectations of
swift action on an ambitious and, presumably, popular progressive legislative agenda. One

33
prominent political observer argued not only that “liberal views have re-emerged … with a
vengeance,” but also that those views “can be expected to shift further leftward—especially on
economic questions—in the face of coming recession.” Comparisons with Franklin Roosevelt
and the famous first 100 days of the New Deal era abounded.36
However, as with many new political orders proclaimed by pundits, America’s “New
Liberal Order” (as Time magazine dubbed it) proved to be remarkably short-lived. A slow
rebound of economic growth, high unemployment, and partisan rancor drove Obama’s
popularity steadily lower through most of his first two years in office. When his Democratic
allies in Congress faced the voters in November 2010 they suffered a substantial defeat, losing
8.4% of the popular vote and 63 seats in the 435-seat House of Representatives—an even worse
showing than might have been expected given the state of the U.S. economy at the time. With the
Republican opposition back in control of the House, Americans faced a return to “divided
government” and legislative gridlock.
Unlike the 2009 federal election in Germany, the 2010 midterm election in the U.S. was
widely interpreted as an adverse judgment by voters on the policies of the incumbent
government. In the New York Daily News, for example, the election result was presented as “a
stinging rebuke to President Obama.”37
In his election night victory speech, new Speaker of the
House John Boehner argued that the American people had sent an “unmistakable message” to the
36 Peter Beinart, “The New Liberal Order,” Time, November 13, 2008. John B. Judis, “America the
Liberal,” The New Republic, November 19, 2008. Robert Kuttner, Obama’s Challenge: America’s
Economic Crisis and the Power of a Transformative Presidency (Chelsea Green, 2008), 1. Quotations are
from Beinart, Judis, Kuttner, and Judis, respectively.
37 Thomas M. DeFrank, “Midterm Election Results Show Voters Unhappy with President Obama’s
Leadership,” New York Daily News, November 3, 2010.

34
president, “and that message is: ‘change course.’ We hope President Obama will now respect the
will of the people, change course, and commit to making the changes they are demanding.”
According to Boehner, voters had rejected “the spending sprees, the bailouts, the backroom
deals, the takeovers and all the nonsense” in favor of cutting spending, reducing the size of
government, and “helping small businesses get people back to work.”38
In his own post-election press conference, Obama resisted the notion that voters had rejected
his policies, preferring to interpret the outcome as merely a reflection of economic frustration.
Voters, the president said,
are not satisfied with the outcomes. If right now we had 5 percent unemployment
instead of 9.6 percent unemployment, then people would have more confidence in those
policy choices. The fact is, is that for most folks, proof of whether they work or not is
has the economy gotten back to where it needs to be. And it hasn’t. … And ultimately,
I’ll be judged as President as to the bottom line, results.39
In a television interview the next day, Obama was pressed once again regarding the meaning
of the election. He replied by ticking off a variety of popular policy initiatives, then added a
grudging concession that voters may have misinterpreted his administration’s responses to the
economic crisis as reflecting an ideological agenda. “I think that what happened over the course
of two years,” he said,
was that we had to take a series of big, emergency steps quickly. And most of them in
the first six months of my administration. Each of them had a big price tag. You got
38 “Midterms 2010: John Boehner’s Victory Speech in Full.” The Telegraph, November 3, 2010
(http://www.telegraph.co.uk/news/worldnews/us-politics/8106711/Midterms-2010-John-Boehners-
victory-speech-in-full.html).
39 “Press Conference by the President, November 03, 2010” (http://www.whitehouse.gov/the-press-
office/2010/11/03/press-conference-president).

35
intervention in the banks. You’ve got the auto bailout. You’ve got a stimulus package.
Each one with a lot of zeroes behind it. And people looked at that and they said, ‘Boy,
this feels as if there’s a huge expansion of government.’40
A national survey of voters leaving their polling places seemed to bolster the notion that the
election outcome was shaped not only by adverse economic conditions, but also by adverse
assessments of the policies and priorities of the Obama administration. For example, 56% of the
exit poll respondents said that the government was “doing too much,” and they supported
Republican candidates by a margin of almost four to one; on the other hand, 38% said that the
government “should do more,” and they supported Democratic candidates by about the same
margin. Similarly, 58% said that the “highest priority” for the next Congress should be reducing
the deficit (40%) or cutting taxes (18%); they voted Republican by a 67-30 margin, while the
37% who said the highest priority should be “spending to create jobs” supported Democratic
candidates by a 68-30 margin.41
Results like these suggested that voters on both sides were animated by policy concerns
related to the government’s response to the economic crisis—and that many more of them were
animated to oppose the policies of the president and the Democratic majority in Congress than to
support those policies. However, a different—and perhaps more reliable—way to assess the
political significance of specific policy choices in the American setting is to estimate the direct
electoral impact of major roll call votes on the electoral fortunes of individual members of
40 “Transcript: President Barack Obama, Part 1. ‘60 Minutes’ Correspondent Steve Kroft Interviewed The
President Nov. 4, 2010”
(http://www.cbsnews.com/stories/2010/11/07/60minutes/main7032276.shtml?tag=contentMain;contentBo
dy).
41 “U.S. House: National Exit Poll, 17,504 Respondents”
(http://www.cnn.com/ELECTION/2010/results/polls/#val=USH00p1).

36
Congress (Jacobson 1996). In this spirit, McGhee (2010) estimated the electoral cost to
Democratic incumbents of supporting each of four controversial bills: the 2008 Troubled Assets
Relief Program (TARP); the $787 billion stimulus package passed a few weeks after President
Obama took office; a cap-and-trade energy bill which later died in the Senate; and the Affordable
Care Act, which substantially reformed the American health care system. His estimates suggest
that the cost of supporting TARP was “small and insignificant,” while the cost of supporting the
stimulus package was 2.8%, cap-and-trade 2.1%, and health care reform 4.5%. The cap-and-
trade and health care votes seem to have been more ideologically charged, with Democratic
supporters punished much more in more Republican districts, while support for the stimulus
“seems to [have] hurt everyone.” A simulation based on these estimates suggested that, if every
vulnerable Democrat had refrained from supporting the cap-and-trade and health care bills, the
party would have lost 24 fewer seats, bringing the election outcome into close agreement with
forecasts based primarily on the state of the economy.42
McGhee’s estimates of the effects of Democratic support for cap-and-trade (2.1%) and
health care reform (4.5%) are just large enough (bearing in mind that only about half the districts
in the country had Democratic incumbents who supported those bills running for reelection) to
account for the discrepancy between the Democrats’ aggregate vote loss (8.4%) and their
expected vote loss based on the statistical relationship in Figure 3 (5.2%). While the exactness of
this correspondence is no doubt coincidental, it does suggest that the Democrats’ apparent under-
42 A similar analysis by Brady, Fiorina and Wilkins (2011) only focused on the cap-and-trade and health
care votes; their results implied that by opposing these bills Democrats could have saved somewhere
between 22 and 40 seats, “strongly suggesting that the votes in question cost the Democrats their
majority” (Brady, Fiorina and Wilkins (2011, 249).

37
performance in the 2010 election may have been attributable to policy choices largely unrelated
to the economic crisis.
While individual Democrats in Congress seem to have been punished for supporting health
care reform and cap-and-trade legislation, their support for legislative initiatives more directly
related to the economic crisis probably bolstered their electoral support. Even if we accept
McGhee’s estimate that supporting the Obama stimulus package cost Democratic incumbents
2.8% of the vote, this electoral penalty was almost certainly more than offset by the political
benefit of improved economic conditions resulting from the implementation of the stimulus
program. Economists Alan Blinder and Mark Zandi (2010, Table 9) estimated that the stimulus
package added 1.3% to real GDP in 2009 and 1.9% in 2010.43
Combining those estimates with
my own estimates of electoral responses suggests that the economic benefit of the stimulus
package probably reduced the Democrats’ national vote loss by somewhere between 2.7% and
4.9%—enough to offset the direct electoral cost to specific Democratic incumbents who voted
for the stimulus bill, while leaving the party as a whole distinctly better off.44
Thus, while many observers seemed to believe that the 2010 election constituted a rejection
by American voters of the president’s response to the economic crisis, the truth of the matter is
43 More broadly, Blinder and Zandi (2010, Table 4) estimated that the entire portfolio of policy responses
to the Great Recession by the Federal Reserve, Congress, and the Bush and Obama administrations
boosted real GDP by 4.9% in 2009 and 6.6% in 2010.
44 Based on the parameter estimates reported in the second column of Table 2, the combined effect of an
additional 1.9% real GDP growth in 2010 and an additional 1.3% growth in 2009 would be to increase the
Democratic vote share in the 2010 election by 2.7%. The analysis presented in the fourth column of Table
5 implies that the direct effect of a stimulus amounting to $309 billion (approximately 2.2% of GDP) in
2009 would be to increase the Democratic vote share by about 3%, while the additional impact of greater
overall GDP growth would increase the Democratic vote share by an additional 1.9%.

38
that that response almost certainly staved off an even worse electoral debacle—because it staved
off an even worse economic debacle. If Obama and his party overreached, it was in other areas—
most notably, by forcing through Congress an historic overhaul of health care reform and by
trying but failing to pass a major energy bill. By rebuking Democrats for what may have felt like
“a huge expansion of government” in these areas, voters also seemed to be rejecting the huge
expansion of government that forestalled a much longer and deeper Great Recession. The ironic
result, as one observer noted, was that “the electorate has now restored to power in the House the
same crowd they repudiated only two years ago—and whose policies, by any honest reckoning,
wrecked the economy.”45
Conclusion
Interpreting election outcomes is not merely a scholarly pursuit. Specific understandings of
what voters had in mind, individually and collectively, in casting their ballots can shape practical
political thought, discourse, and action for better or worse (Grossback, Peterson, and Stimson
2006). American political culture in the 20th century was significantly shaped by the
conventional belief that the 1936 election constituted a referendum on the New Deal and, more
broadly, on the role of the federal government in the American economy and society. More
recently, the notion that the outcome of the 2010 midterm election represented “a stinging rebuke
to President Obama” and that the American people had sent an “unmistakable message” to
“change course” has seemed to alter the political standing and strategies of both the president
and his Republican opponents.
45 Thomas M. DeFrank, “Midterm Election Results Show Voters Unhappy with President Obama’s
Leadership.”

39
When understandings of this sort are mistaken, political trouble may ensue. For example,
British Conservative Party leader David Cameron interpreted his party’s 2010 election victory as
a mandate for “new economic management” and “the most radical decentralization of power this
country has seen for generations.”46
However, polls at the time found solid majorities of Britons
in favor of aiding troubled major industries and companies, significantly increasing government
spending, and even providing financial support to troubled banks.47
And a detailed study of
British public opinion found that “public satisfaction with health and education improved
dramatically” under the Labour government, “leaving the researchers asking why Labour did not
fight the election on its social policy record—and warning that the [Conservative-led] coalition is
now risking a significant backlash against its reforms and cuts to public services that people are
happy with.”48
Placing the outcome of any particular election in a broader comparative perspective may
help to restrain the tendency of election observers—and especially of election winners—to over-
interpret the ideological significance of the result. Americans in the Great Depression repudiated
Herbert Hoover and then reelected Franklin Roosevelt in a landslide; but voters in other
46 David Batty, “David Cameron Launches Election Campaign with Economy Pledge,” The Guardian, 2
January 2010 (http://www.guardian.co.uk/politics/2010/jan/02/david-cameron-election-campaign-
economy).
47 Britons favored “financial support to troubled major industries and companies” by a margin of 73% to
23%, “significantly increasing government spending” by a margin of 60% to 35%, and “financial support
to troubled banks” by a margin of 55% to 42%. “Global Poll Shows Support for Increased Government
Spending and Regulation,” September 13, 2009
(http://www.worldpublicopinion.org/pipa/pdf/sep09/BBCEcon_Sep09_rpt_final.pdf).
48 Polly Curtis, “Britain ‘More Thatcherite Now than in the 80s’ Says Survey,” The Guardian, 13
December 2010 (http://www.guardian.co.uk/education/2010/dec/13/social-survey-thatcherite-britain).

40
democracies in the same period repudiated left-wing governments when times were bad and
reelected right-wing governments when economic conditions improved. By the same token, John
Boehner and David Cameron led conservative opposition parties to significant victories at the
polls in the wake of the Great Recession, but they—and we—might do well to bear in mind that
at the same time, conservative governments in countries as diverse as Iceland and Japan were
even more decisively repudiated after presiding over significant economic downturns.49
In
periods of economic crisis, as in more normal times, voters have a strong tendency to support
any policies that seem to work, and to punish leaders regardless of their ideology when economic
growth is slow.
49 Iceland and Japan experienced declines in real GDP of 6.1% and 7.0%, respectively, in the run-ups to
their 2009 elections; their right-of-center governments suffered vote losses of 12.9% and 9.1%.

41
References
Achen, Christopher H., and Larry M. Bartels. 2004. “Musical Chairs: Pocketbook Voting and the
Limits of Democratic Accountability.” Annual Meeting of the American Political Science
Association, Chicago (http://www.princeton.edu/~bartels/chairs.pdf).
Achen, Christopher H., and Larry M. Bartels. 2005. “Partisan Hearts and Gall Bladders:
Retrospection and Realignment in the Wake of the Great Depression.” Annual Meeting of
the Midwest Political Science Association, Chicago
(http://www.princeton.edu/~bartels/depress3.pdf).
Achen, Christopher H., and Larry M. Bartels. 2009. “Blind Retrospection: Electoral Responses
to Droughts, Floods, and Shark Attacks.” Department of Political Science, University of
North Carolina at Chapel Hill
(http://www.unc.edu/polisci/aprg/pdfs/Achen%20APRG%20Talk.pdf).
Anderson, Christopher J. 1995. Blaming the Government: Citizens and the Economy in Five
European Democracies. Armonk, NY: M. E. Sharpe.
Anderson, Christopher J., and Jason D. Hecht. 2011. “Voting When the Economy Goes Bad,
Everyone is in Charge, and No One is to Blame: The Case of the 2009 German Election.”
Electoral Studies, forthcoming.
Ansell, Ben W. 2010. “Crisis as Political Opportunity? Partisan Politics, Housing Cycles, and the
Credit Crisis.” Conference on Government Responses to the Economic Crisis, Russell Sage
Foundation, New York
(http://www.princeton.edu/~piirs/projects/Ben%20Ansell%20Crisis%20as%20Political%20
Opportunity%20Russell%20Sage.pdf).
Bartels, Larry M. 2008. Unequal Democracy: The Political Economy of the New Gilded Age.
New York and Princeton, NJ: Russell Sage Foundation and Princeton University Press.
Blinder, Alan S., and Mark Zandi. 2010. “How the Great Recession Was Brought to an End.”
Princeton University and Moody’s Analytics (http://www.economy.com/mark-
zandi/documents/End-of-Great-Recession.pdf).

42
Brady, David W., Morris P. Fiorina, and Arjun S. Wilkins. 2011. “The 2010 Elections: Why Did
Political Science Forecasts Go Awry?” PS, April, 247-250.
Converse, Philip E. 1964. “The Nature of Belief Systems in Mass Publics.” In David E. Apter,
ed., Ideology and Discontent. New York: Free Press.
Downs, Anthony. 1957. An Economic Theory of Democracy. New York: Harper and Brothers.
Duch, Raymond M., and Randolph T. Stevenson. 2008. The Economic Vote: How Political and
Economic Institutions Condition Election Results. New York: Cambridge University Press.
Enelow, James M., and Melvin J. Hinich. The Spatial Theory of Voting: An Introduction.
Cambridge: Cambridge University Press.
Fiorina, Morris P. 1981. Retrospective Voting in American National Elections. New Haven, CT:
Yale University Press.
Grossback, Lawrence J., David A. M. Peterson, and James A. Stimson. 2006. Mandate Politics.
Cambridge: Cambridge University Press.
Healy, Andrew J., Neil Malhotra, and Cecilia Hyunjung Mo. 2010. “Irrelevant Events Affect
Voters’ Evaluation of Government Performance.” Proceedings of the National Academy of
Sciences 107:29, 12804-12809.
Hibbs, Douglas A., Jr. 2006. “Voting and the Macroeconomy.” In Barry R. Weingast and Donald
A. Wittman, eds., The Oxford Handbook of Political Economy, 565-586. Oxford: Oxford
University Press.
Kayser, Mark Andreas, and Michael Peress. 2011. “Benchmarking across Borders: Electoral
Accountability and the Necessity of Comparison.” Presented at the annual meeting of the
European Political Science Association, Dublin.
Jacobson, Gary C. 1996. “The 1994 House Elections in Perspective.” Political Science Quarterly
111:2, 203-223.
Key, V. O., Jr. 1966. The Responsible Electorate: Rationality in Presidential Voting, 1936-1960.
Cambridge, MA: Harvard University Press.

43
Kramer, Gerald H. 1971. “Short-Term Fluctuations in U.S. Voting Behavior, 1896-1964.”
American Political Science Review 71:1, 131-143.
Lewis-Beck, Michael S. 1988. Economics and Elections: The Major Western Democracies. Ann
Arbor: University of Michigan Press.
Lindvall, Johannes. 2012. “The Political Consequences of The Great Depression and the Great
Recession: Remarkably Similar.” Swiss Political Science Review 18:4, 514-517.
Mayhew, David R. 2002. Electoral Realignments: A Critique of an American Genre. New
Haven, CT: Yale University Press.
McGhee, Eric. 2010. “Which Roll Call Votes Hurt the Democrats?” The Monkey Cage,
November 9 (http://themonkeycage.org/blog/2010/11/09/which_roll_call_votes_hurt_the/).
Murillo, Maria Victoria, Virginia Oliveros, and Milan Vaishnav. 2010. “Electoral Revolution or
Democratic Alternation?” Latin American Research Review 45, 87-114).
Rohrschneider, Robert, Rüdiger Schmitt-Beck, and Franziska Jung. 2010. “Short-Term Factors
versus Long-Term Values: Testing Competing Explanations of Electoral Choice.” German
2009 Election Conference, Lawrence, Kansas
(http://www.dgfw.eu/dok/papers/rohr_schm_jung.pdf).
Rosenstone, Steven J. 1983. Forecasting Presidential Elections. New Haven, CT: Yale
University Press.
Stokes, Donald E. 1963. “Spatial Models of Party Competition.” American Political Science
Review 57:2, 368-377.
Tufte, Edward R. 1978. Political Control of the Economy. Princeton, NJ: Princeton University
Press.

44
Table 1: Elections in OECD Countries, 2007-2011
Country Election
Date
Incumbent
Party
Incumbent
Ideology
GDP
Growth
Vote
Gain/Loss
Estonia 4 March ’07 Reform/Centre Center/Right 9.1 +10.81
Finland 18 March ’07 Centre/Social Dem Center/Left 5.0 −4.61
Iceland 12 May ’07 Independence (SSF) Right 3.2 +2.96
Ireland 24 May ’07 Fianna Fáil Center 6.7 +0.08
France 17 June ’07 UMP Right 2.6 +0.91
Turkey 22 July ’07 Justice and Devlp Right 3.6 +12.38
Greece 16 Sept ’07 New Democracy Right 4.2 −3.52
Poland 21 Oct ’07 Law and Justice Center 6.3 +5.12
Denmark 13 Nov ’07 Liberal (Venstre) Right 1.5 −2.77
Spain 9 March ’08 Socialist (PSOE) Left 3.1 +0.60
Italy 14 April ’08 Democratic (PD) Left 0.4 +1.90
Slovenia 21 Sept ’08 Slov Dem (SDS) Right 4.9 +0.18
Austria 28 Sept ’08 Soc Dem/People’s Center 2.1 −14.43
Canada 14 Oct ’08 Conservative Right 0.7 +1.38
United States 4 Nov ’08 Republican Right −0.6 −1.68
New Zealand 8 Nov ’08 Labour Left −0.6 −7.11
Israel 10 Feb ’09 Kadima/Labor Center/Left 2.0 −4.68
Iceland 25 April ’09 Independence (SSF) Right −5.4 −12.94
Japan 30 Aug ’09 Liberal Dem Right −6.5 −9.09
Norway 14 Sept ’09 Labour (DNA) Left −2.3 +2.68
Germany 27 Sept ’09 CDU/SPD Center −6.2 −12.59
Portugal 27 Sept ’09 Socialist (PS) Left −3.5 −8.47
Greece 4 Oct ’09 New Democracy Right −3.5 −8.36
Chile 13 Dec ’09 Concert (CPD) Left −0.8 −7.41
Hungary 25 April ’10 Socialist (MSZP) Left −0.3 −23.91
United Kingdom 6 May ’10 Labour Left 1.2 −6.19
Netherlands 9 June ’10 Chr Dem/Labour Center 0.3 −14.46

45
Slovak Republic 12 June ’10 Direction−Soc Dem Left 4.9 +5.66
Australia 21 Aug ’10 Labor Left 3.0 −2.58
Sweden 19 Sept ’10 Moderate Right 5.3 +3.83
United States 2 Nov ’10 Democratic Left 3.5 −8.16
Ireland 25 Feb ’11 Fianna Fáil Center 0.1 −24.11
Estonia 6 March ’11 Reform Right 6.0 +0.74
Finland 17 April ’11 Centre/Nat Cltn Center 5.3 −9.23
Canada 2 May ’11 Conservative Right 2.9 +1.97
Portugal 5 June ’11 Socialist (PS) Left −0.6 −8.51
Turkey 12 June ’11 Justice and Dvlpt Right 10.9 +3.25
Denmark 15 Sept ’11 Liberal (Venstre) Right 1.3 +0.47
Poland 9 Oct ’11 Civic Platform Right 4.0 −2.33
Spain 20 Nov ’11 Socialist (PSOE) Left 0.8 −14.71
New Zealand 26 Nov ’11 National Right 1.4 +2.38
Slovenia 4 Dec ’11 Social Democrats Left −0.2 −20.42

46
Table 2: Economic Conditions and Changes in Incumbent Vote Shares, 2007-2011
Ordinary least squares regression parameter estimates (with standard errors in parentheses)
1 2 3 4 5 6
ΔGDP(1-4Q) 1.20 (.30)
1.02 (.29)
--- .75 (.37)
1.05 (.29)
.95 (.24)
ΔGDP(5-8Q) --- .56 (.24)
--- .42 (.36)
.42 (.25)
.26 (.21)
Relative
ΔGDP(1-4Q) --- ---
1.61 (.53)
.75 (.65)
--- ---
Relative
ΔGDP(5-8Q) --- ---
.38 (.42)
−.02 (.54)
--- ---
Unemployment --- --- --- --- −.44 (.30)
---
Intercept −6.33 (1.22)
−7.10 (1.20)
−5.75 (1.15)
−6.92 (1.24)
−3.31 (2.89)
−5.20 (1.06)
Adjusted R2 .27 .35 .29 .34 .36 .33
Std error of reg 7.12 6.75 7.05 6.80 6.66 5.51
N 42 42 42 42 42 39a
a Excluding countries where incumbents lost more than 20 percentage points (Hungary
2010, Ireland 2011, Slovenia 2011).

47
Table 3: Ideology and Changes in Incumbent Vote Shares, 2007-2011
Ordinary least squares regression parameter estimates (with standard errors in parentheses)
1 2 3 4 5 6
Government
Left-Ideology −3.42 (1.38)
−2.05 (1.22)
−1.45 (1.03)
−1.89 (1.27)
−.18 (2.61)
−2.12 (1.30)
Left-Ideology
× Year --- --- --- ---
−.65 (.81)
---
Left-Ideology
× ΔGDP(1-4Q) --- --- --- --- ---
.07 (.40)
ΔGDP(1-4Q) --- .97 (.29)
.92 (.24)
1.01 (.33)
.95 (.29)
1.00 (.33)
ΔGDP(5-8Q) --- .45 (.24)
.19 (.21)
.41 (.26)
.48 (.24)
.46 (.24)
Intercept −4.45 (1.22)
−6.98 (1.18)
−5.18 (1.05)
−6.20 (1.29)
−6.86 (1.19)
−7.00 (1.20)
Adjusted R2 .11 .38 .35 .34 .37 .36
Std error of reg 7.87 6.59 5.44 6.69 6.62 6.68
N 42 42 39a 35
b 42 42
a Excluding countries where incumbents lost more than 20 percentage points (Hungary
2010, Ireland 2011, Slovenia 2011). b Excluding coalition governments (Estonia 2007, Finland 2007, Austria 2008, Israel
2009, Germany 2009, Netherlands 2010, Finland 2011).

48
Table 4: Ideology, Economic Conditions, and Policy Responses to the Crisis
Ordinary least squares regression parameter estimates (with standard errors in parentheses)
Incremental
debt
(2008-10)
Cyclical
deficit
(2009)
Discretionary
stimulus
(2009)
Bailouts and
nationalizations
(2009)
Government
Left-Ideology .51
(3.39)
−.20 (.28)
−.58 (.96)
1.21 (1.01)
ΔGDP (2008:I-2009:I)
.58 (.86)
−.51 (.11)
.49 (.39)
.38 (.40)
GDP/capita (US $1000s, 2007)
−.000 (.001)
−.077 (.037)
.156 (.126)
.142 (.132)
Total Debt (% GDP, 2007)
.097 (.087)
−.028 (.009)
.042 (.032)
.003 (.033)
Intercept 15.42 (6.06)
6.95 (1.35)
−4.18 (4.60)
−.50 (4.82)
Adjusted R2 −.10 .46 −.06 −.02
Std error of reg 15.04 1.09 3.72 3.89
N 27a 20
b 20
b 20
b
a Including only countries with OECD debt data.
b Including only countries with OECD spending data.

49
Table 5: Policies and Changes in Incumbent Vote Shares, 2009-2011
Ordinary least squares regression parameter estimates (with standard errors in parentheses)
1 2 3 4 5 6
Incremental
government debt (% GDP, 2008-10)
−.24 (.11)
−.14 (.12)
−.10 (.12)
--- --- ---
Cyclical deficit (% GDP, 2009)
--- --- --- −.93 (1.00)
−.51 (1.21)
---
Discretionary
stimulus (% GDP, 2009)
--- --- --- 1.36 (.40)
2.39 (1.66)
2.21 (1.48)
Bailouts and
nationalizations (% GDP, 2009)
--- --- --- −.77 (.42)
−.02 (.79)
---
ΔGDP(1-4Q) --- .77 (.44)
.78 (.37)
1.00 (.45)
1.05 (.51)
1.01 (.44)
Intercept −2.82 (2.34)
−5.27 (2.63)
−4.72 (2.37)
−2.70 (6.11)
−10.21 (8.50)
−12.40 (4.19)
Adjusted R2 .15 .22 .21 .54 .10 .24
Std error of reg 7.90 7.56 6.30 5.70 5.99 5.49
N 25a 25
a 22
c 17
b 14
c 14
c
a Including only countries with OECD debt data and elections after 2008.
b Including only countries with OECD spending data and elections after 2008.
c Excluding countries with major austerity programs (Iceland 2009, Hungary 2010,
Ireland 2011).

50
-30
-25
-20
-15
-10
-5
0
5
10
15
-9 -6 -3 0 3 6 9 12
Ch
an
ge in
In
cu
mben
t Part
y V
ote
(%
)
Real GDP Growth (%) in Year Before Election
Figure 1: Election-Year GDP Growth and Incumbent Party Electoral Support, 2007-2011
Hungary 2010
Ireland 2011
Austria 2008
Italy 2008
Slovak Rep 2010
Norway 2009
Japan 2009
Finland 2011
Netherlands 2010
Poland 2007
Estonia 2007
U.S. 2010
Iceland 2009
Ireland 2007
Portugal 2009
Iceland 2007
Germany 2009
Spain 2008
Turkey 2007
Slovenia 2011
Turkey 2011
Spain 2011
U.S. 2008
Portugal 2011

51
-30
-25
-20
-15
-10
-5
0
5
10
15
-6 -3 0 3 6 9 12
Ch
an
ge in
In
cu
mben
t Part
y V
ote
(%
)
Weighted Average GDP Growth (%) in Two Years Before Election
Figure 2: Cumulative Growth and Election Outcomes in OECD Countries, 2007-2011
Hungary 2010
Ireland 2011
Turkey 2011
Slovak Rep 2010
Norway 2009
Japan 2009
Poland 2007
Estonia 2007
U.S. 2010
Slovenia 2011
Ireland 2007
Spain 2011 Austria
2008
Germany 2009
Turkey 2007
Finland 2011
Netherlands 2010
Spain 2008
U.S. 2008 U.K.
2010
Portugal 2009
Portugal 2011

52
-30
-25
-20
-15
-10
-5
0
5
10
15
-9 -6 -3 0 3 6
Ch
an
ge in
In
cu
mben
t Part
y V
ote
(%
)
2009 Discretionary Stimulus (% of GDP)
Figure 3: Discretionary Stimulus Spending and Incumbent Party Electoral Support, 2009-2011
Hungary 2010 Ireland
2011
Australia 2010
Japan 2009
U.S. 2010
United Kingdom 2010
Netherlands 2010
Iceland 2010 Germany
2009
Sweden 2010
Portugal 2011
Spain 2011
Poland 2011
Canada 2011


![Traditional pest contro]: A retrospection](https://static.fdocuments.in/doc/165x107/61b345feb0fb065107790ef8/traditional-pest-contro-a-retrospection.jpg)

![Traditional pest contro]: A retrospection - NISCAIRnopr.niscair.res.in/bitstream/123456789/19367/1/IJTK 1(Inaugural... · Traditional pest contro]: A retrospection ... cope-up with](https://static.fdocuments.in/doc/165x107/5aa18fe57f8b9a80378bd060/traditional-pest-contro-a-retrospection-1inauguraltraditional-pest-contro.jpg)