Identifying the Real Cost of Turnover - hrsoft.com · Turnover Rate Total Number of Exits Total...
44
Identifying the Real Cost of Turnover Guest Presenter: Theresa M. Worman Executive VP, Strategy and Development Compdata Surveys & Consulting TalentTakeaways webinar & podcast series
Transcript of Identifying the Real Cost of Turnover - hrsoft.com · Turnover Rate Total Number of Exits Total...
Identifying the Real
Cost of Turnover
Guest Presenter: Theresa M. WormanExecutive VP, Strategy and Development
Compdata Surveys & Consulting
TalentTakeawayswebinar & podcast series

AGENDAThe Series
TalentTakeawayswebinar & podcast series
Talent Takeaways Series

AGENDAAGENDA
✓ Resource Library
✓ Product Information
✓ Product Tour & Demo
The Sponsor
Talent Takeaways Series
Talent Management Made for Managers
AGENDAWebinar Info
Talent Takeaways Series
✓ We are informal (and fun)
✓ Ask Questions!
✓ Q&A Session at end
✓ HRCI & SHRM Credits
✓ Slides will be available after
AGENDAAbout the Presenter
Talent Takeaways Series
THERESA M. WORMAN
Theresa is a recognized compensation expert with
more than twenty years in the industry. She oversees
business development and works to bring
Compdata’s consulting and survey solutions to the
organizations needing them.
Throughout her career, Theresa has been instrumental
in the creation and evolution of Compdata’s product
offerings and consulting services. Theresa often lends
her expertise to audiences at seminars and webinars
for ASHHRA, WorldatWork and state hospital
associations.
Theresa shares her knowledge with journalists from
media outlets across the country, and has been
quoted by The Wall Street Journal, Inc. and Money
magazines, and numerous newspapers. She has been
published in WorldatWork’s Workspan magazine on
multiple occasions.

-Future Workplace and Kronos
Over 80% of employers say improving
retention is a critical priority for their organization.

Unemployment Hits Record Lows
4.6%
4.1%
2.9%
4.5%2.6%
3.9%
3.6%
3.3%
4.8%
3.8%
2.1%
National Unemployment Rate: 4.1%

Current unemployment rate
for college educated workers
is 2.1%.
-Bureau of Labor Statistics

9.1%
9.8% 9.8%10.4%
11.0%
11.6%
12.8%
13.5%
5.0%
7.0%
9.0%
11.0%
13.0%
15.0%
2010 2011 2012 2013 2014 2015 2016 2017
Voluntary Turnover: All Industries
Turnover: Facts and Trends

Cultural Impact of High Turnover
RisingTurnover
Low Morale
DecliningPerformance

Cultural Impact of High Turnover

Cultural Impact of High Turnover

Financial Impact of High Turnover

Financial Impact of High Turnover

Why Should You Track Turnover?
• Turnover impacts all aspects of the business
• Provides a metric to a problem
• Organizations have a competitive edge when they retain seasoned and well-trained employees
• Helps prioritize areas for improvement
• Better able to validate your proposed solution to leadership
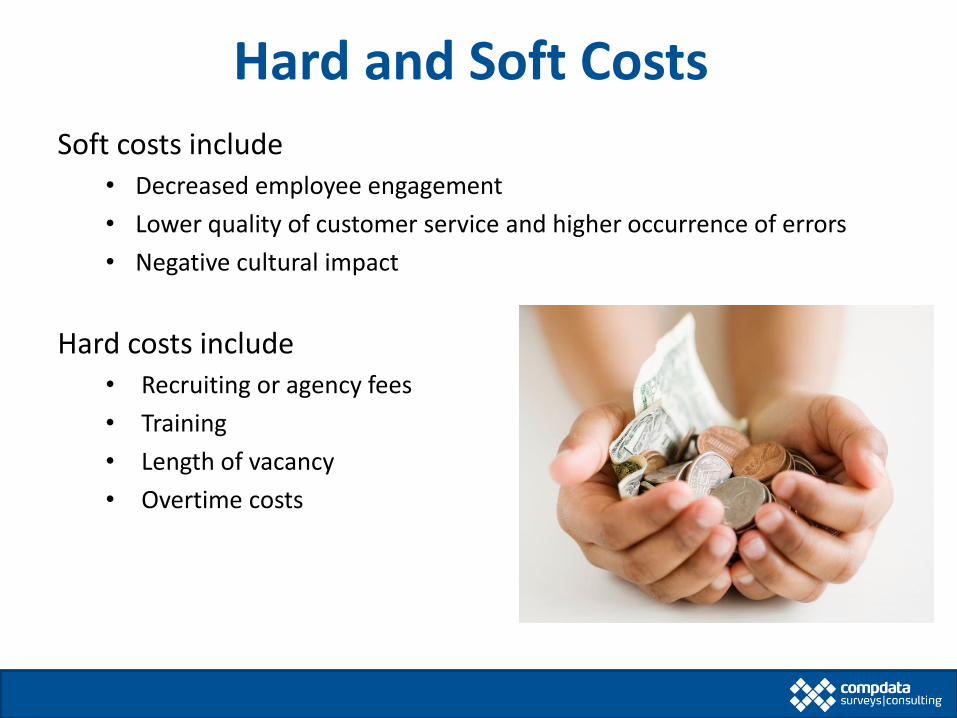
Hard and Soft Costs
Soft costs include• Decreased employee engagement
• Lower quality of customer service and higher occurrence of errors
• Negative cultural impact
Hard costs include• Recruiting or agency fees
• Training
• Length of vacancy
• Overtime costs
Goals for Turnover Costing Model
Include data points that are:
• Measurable• Indisputable • Relevant to operations
It is more important to have leadership agreement thanfor it to be all encompassing.

Factors to Consider for Costing Turnover
Gather a cross-functional team
Determine the data points
Select a job to validate
Calculate the cost of turnover
Gather a Cross-Functional Team
Your team needs representatives from:• Human Resources
− Talent Acquisition, Compensation, HR Business Partners
• CFO/Finance
Also consider:• Affected department heads
• Executives
• Operations employees
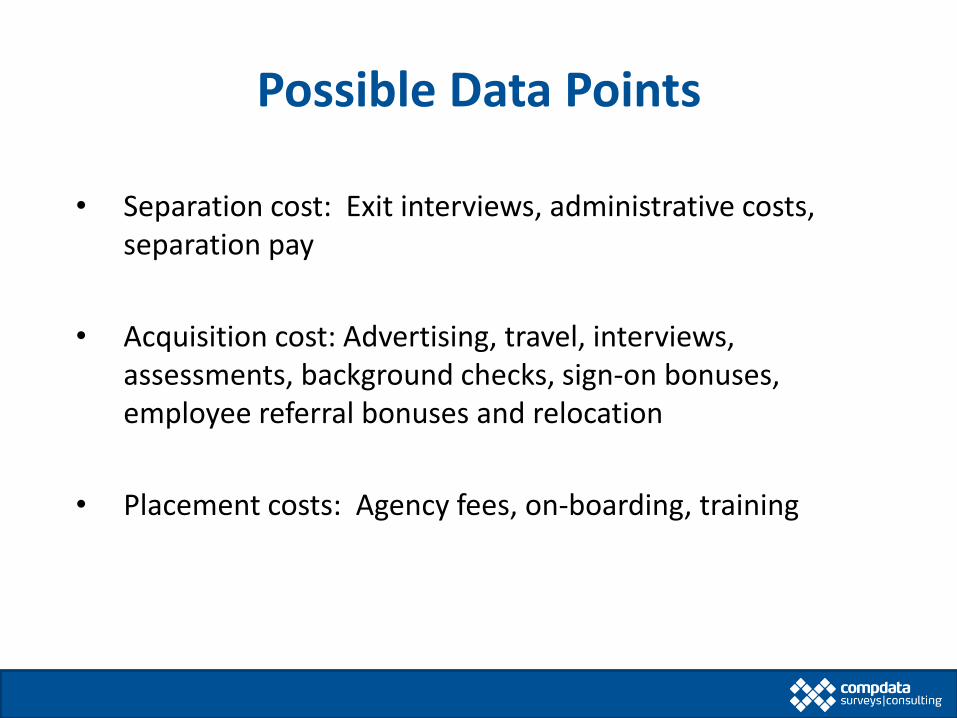
Possible Data Points
• Separation cost: Exit interviews, administrative costs, separation pay
• Acquisition cost: Advertising, travel, interviews, assessments, background checks, sign-on bonuses, employee referral bonuses and relocation
• Placement costs: Agency fees, on-boarding, training

Gather Position & Company Data
• Position’s annual average total cash compensation and benefits
• All positions’ annual average total cash compensation and benefits
• Projected number of exits this year in the position
• Annual revenue
• Number of FTEs

Lost Productivity Data
• Number of days the position is vacant
• Anticipated days new employee needs to become productive

Limitations to Costing Models
• Every costing model has limitations
• Developing a model that accounts for 100% of costs may not be achievable− Trying to account for every dollar reaches a point of diminishing
returns
• Goal is to have executive agreement about measuring turnover costs to the organization

Not everything that counts can be counted, and not everything that can be counted counts.

Select Position(s) to Validate
Select a benchmark job to validate internal and external metrics
Position should be:• Visible across the organization
• Agreed upon by leadership
• A hindrance to success should significant turnover occur
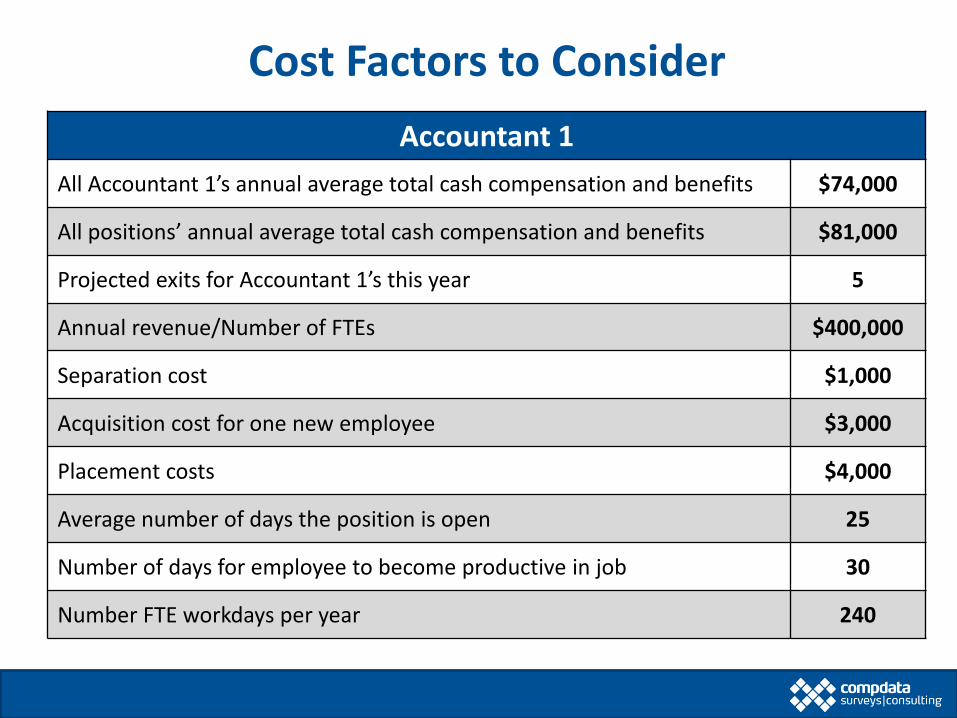
Cost Factors to Consider
Accountant 1
All Accountant 1’s annual average total cash compensation and benefits $74,000
All positions’ annual average total cash compensation and benefits $81,000
Projected exits for Accountant 1’s this year 5
Annual revenue/Number of FTEs $400,000
Separation cost $1,000
Acquisition cost for one new employee $3,000
Placement costs $4,000
Average number of days the position is open 25
Number of days for employee to become productive in job 30
Number FTE workdays per year 240
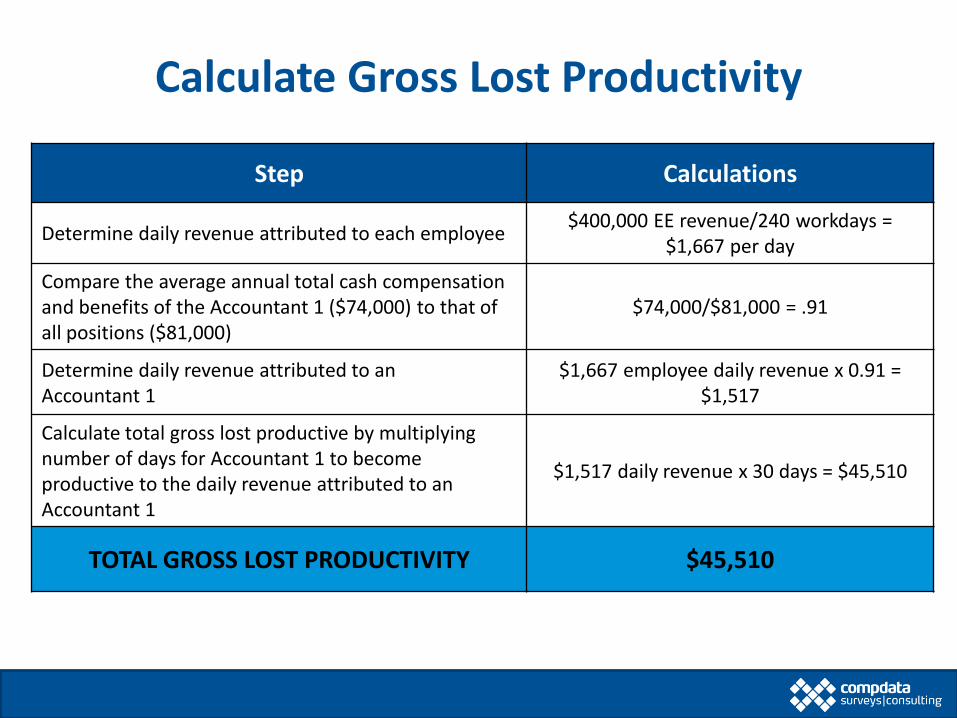
Calculate Gross Lost Productivity
Step Calculations
Determine daily revenue attributed to each employee$400,000 EE revenue/240 workdays =
$1,667 per day
Compare the average annual total cash compensation and benefits of the Accountant 1 ($74,000) to that of all positions ($81,000)
$74,000/$81,000 = .91
Determine daily revenue attributed to an Accountant 1
$1,667 employee daily revenue x 0.91 = $1,517
Calculate total gross lost productive by multiplying number of days for Accountant 1 to become productive to the daily revenue attributed to an Accountant 1
$1,517 daily revenue x 30 days = $45,510
TOTAL GROSS LOST PRODUCTIVITY $45,510
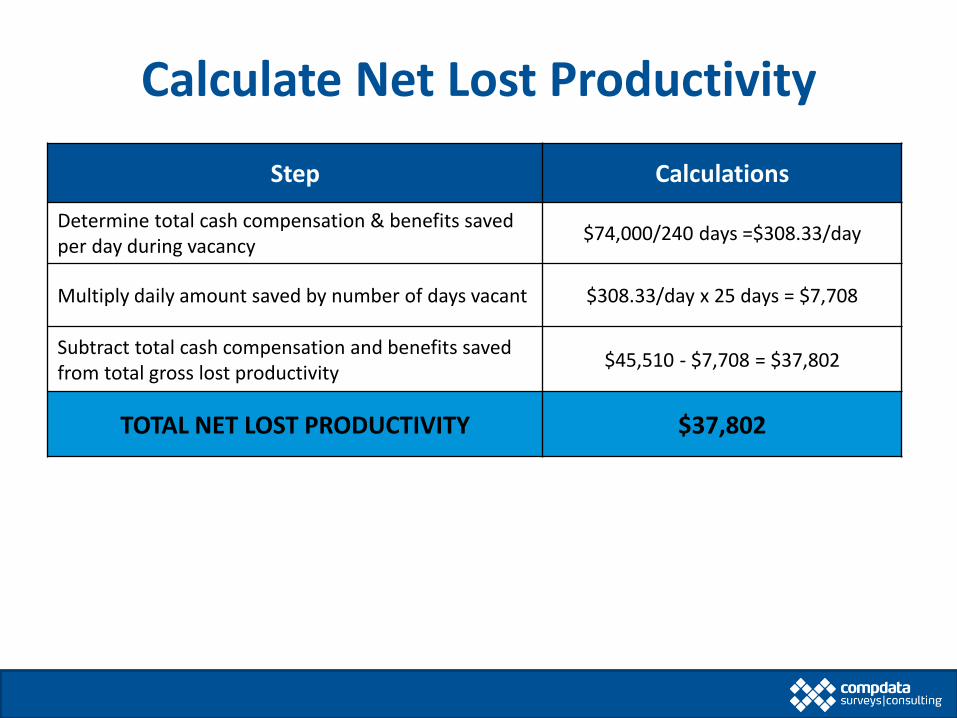
Calculate Net Lost Productivity
Step Calculations
Determine total cash compensation & benefits saved per day during vacancy
$74,000/240 days =$308.33/day
Multiply daily amount saved by number of days vacant $308.33/day x 25 days = $7,708
Subtract total cash compensation and benefits saved from total gross lost productivity
$45,510 - $7,708 = $37,802
TOTAL NET LOST PRODUCTIVITY $37,802
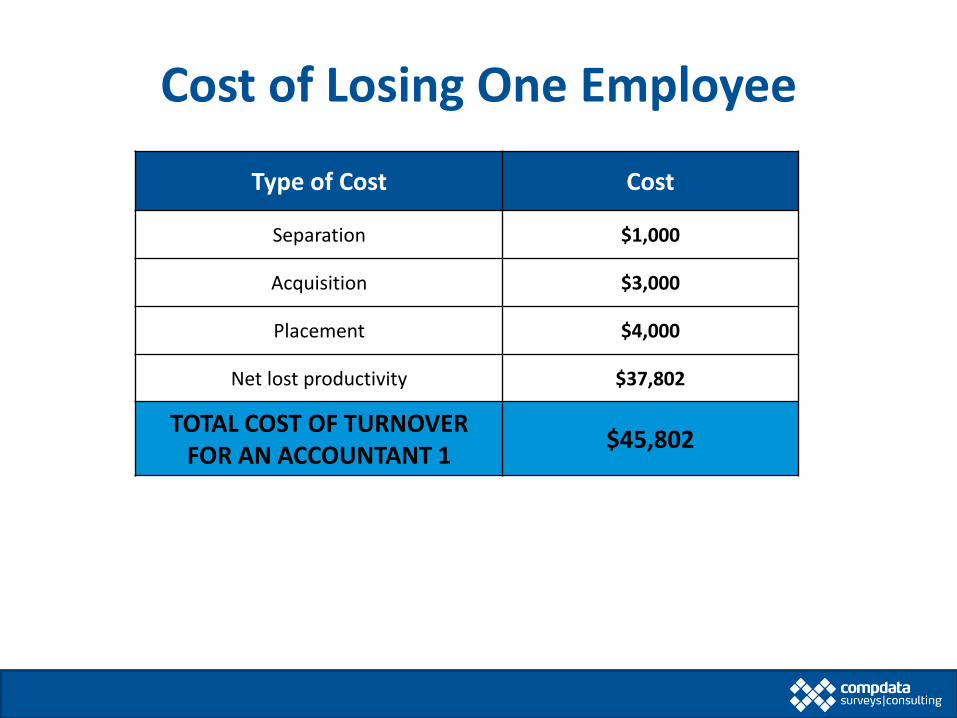
Cost of Losing One Employee
Type of Cost Cost
Separation $1,000
Acquisition $3,000
Placement $4,000
Net lost productivity $37,802
TOTAL COST OF TURNOVER FOR AN ACCOUNTANT 1
$45,802

Total Position Turnover Cost
With 5 projected Accountant 1 exits during the year:
• TOTAL ACCOUNTANT 1 COST OF TURNOVER = $229,010
• SAVINGS FOR REDUCING ACCOUNTANT TURNOVER BY 20% = $45,802
• SAVINGS FOR REDUCING ACCOUNTANT TURNOVER BY 50% = $114,505
Communicating to Leadership
• Effective communication of Human Resource leaders track a number of metrics and must be able to communicate their importance to leadership
− Turnover is one of the most important

Communicating to Leadership
Clearly communicating these metrics to leadership provides relevance for the company as a whole
Relay the information in a way they will understand
• Graphs, charts, financial calculations, etc.
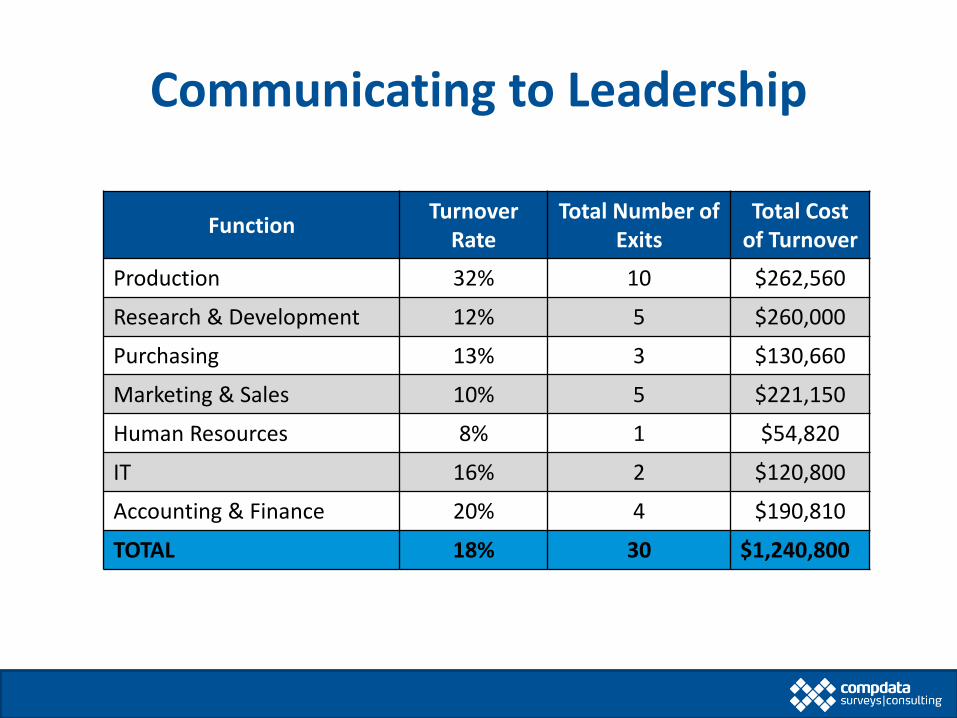
Communicating to Leadership
FunctionTurnover
RateTotal Number of
ExitsTotal Cost
of Turnover
Production 32% 10 $262,560
Research & Development 12% 5 $260,000
Purchasing 13% 3 $130,660
Marketing & Sales 10% 5 $221,150
Human Resources 8% 1 $54,820
IT 16% 2 $120,800
Accounting & Finance 20% 4 $190,810
TOTAL 18% 30 $1,240,800
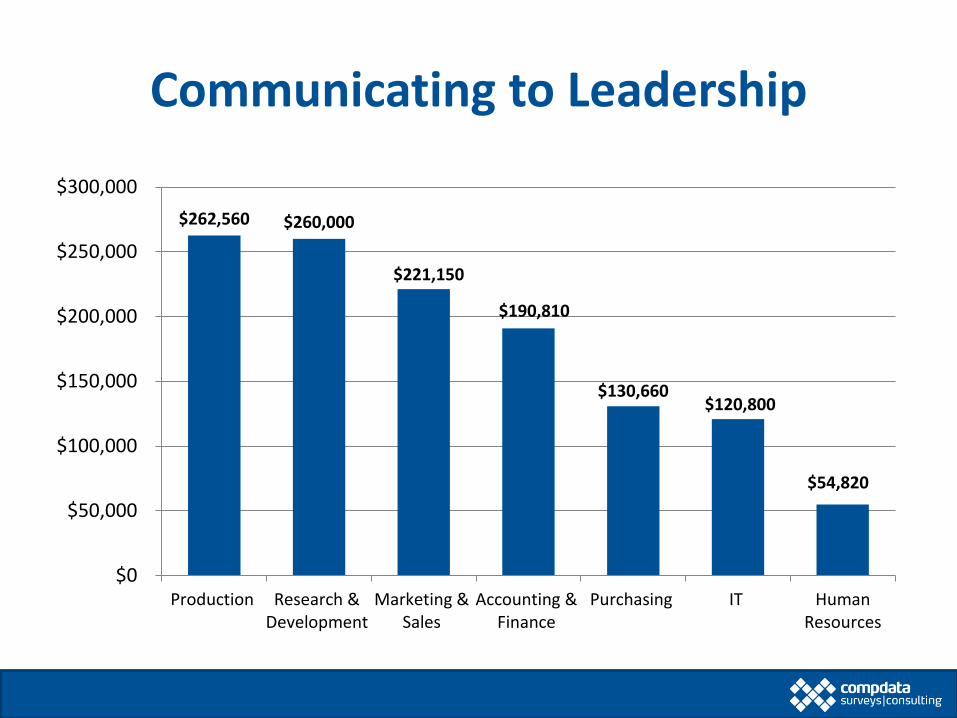
Communicating to Leadership
$262,560 $260,000
$130,660
$221,150
$54,820
$120,800
$190,810
Production Research &Development
Marketing &Sales
Accounting &Finance
Purchasing IT HumanResources
$0
$50,000
$100,000
$150,000
$200,000
$250,000
$300,000

How to Use the Cost of Turnover Metric
Investing in employees helps employers manage turnover• Use the projected cost savings to justify some of these programs
More competitive compensation• Employees have websites to gauge competitive wages
• Pay is openly shared with peers or friends
Promote career advancement opportunities• Offer more career mobility options
• Provide employees with new challenges and assignments

How to Use the Cost of Turnover Metric
Provide employees with flexibility and options• Telecommuting, benefit options, work schedule, etc.
Enrich employees with educational tools• Help employees understand how they can thrive in your organization
• Employers are planning on investing more into direct learning expenditures for employees
• 74% of employees feel that they aren’t achieving their full potential at work due to lack of development opportunities (Middlesex University’s
Institute for Work Based Learning)
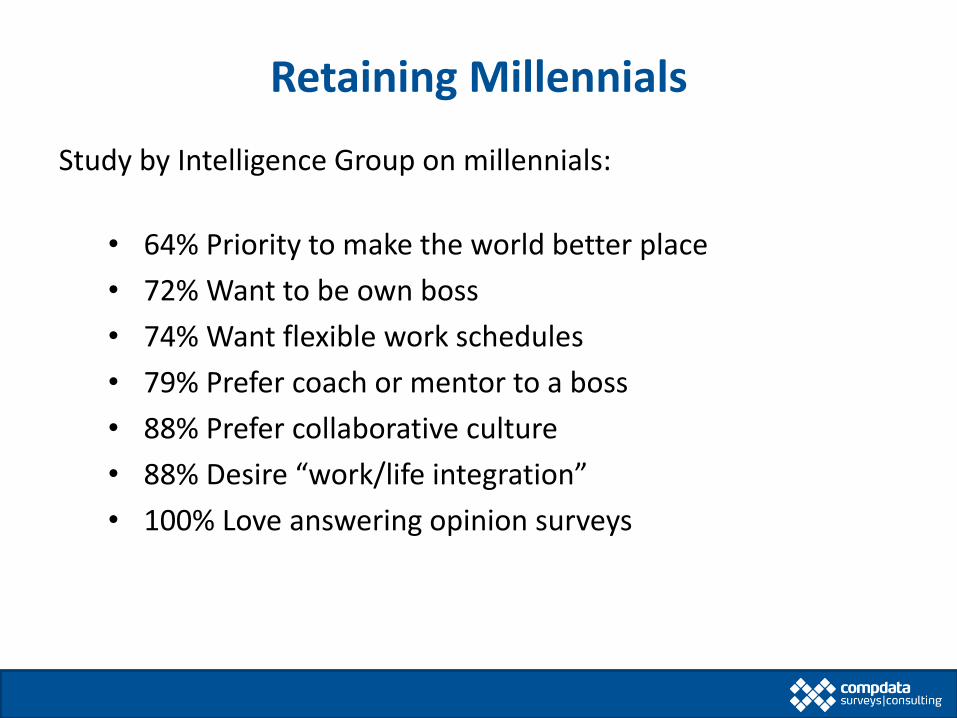
Retaining Millennials
Study by Intelligence Group on millennials:
• 64% Priority to make the world better place
• 72% Want to be own boss
• 74% Want flexible work schedules
• 79% Prefer coach or mentor to a boss
• 88% Prefer collaborative culture
• 88% Desire “work/life integration”
• 100% Love answering opinion surveys
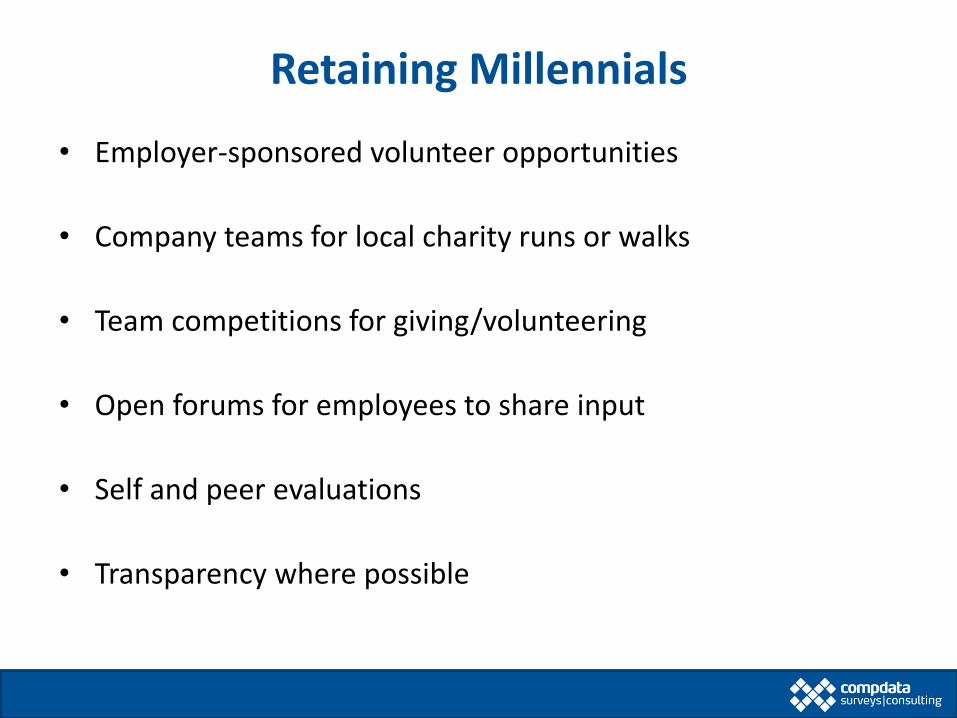
Retaining Millennials
• Employer-sponsored volunteer opportunities
• Company teams for local charity runs or walks
• Team competitions for giving/volunteering
• Open forums for employees to share input
• Self and peer evaluations
• Transparency where possible
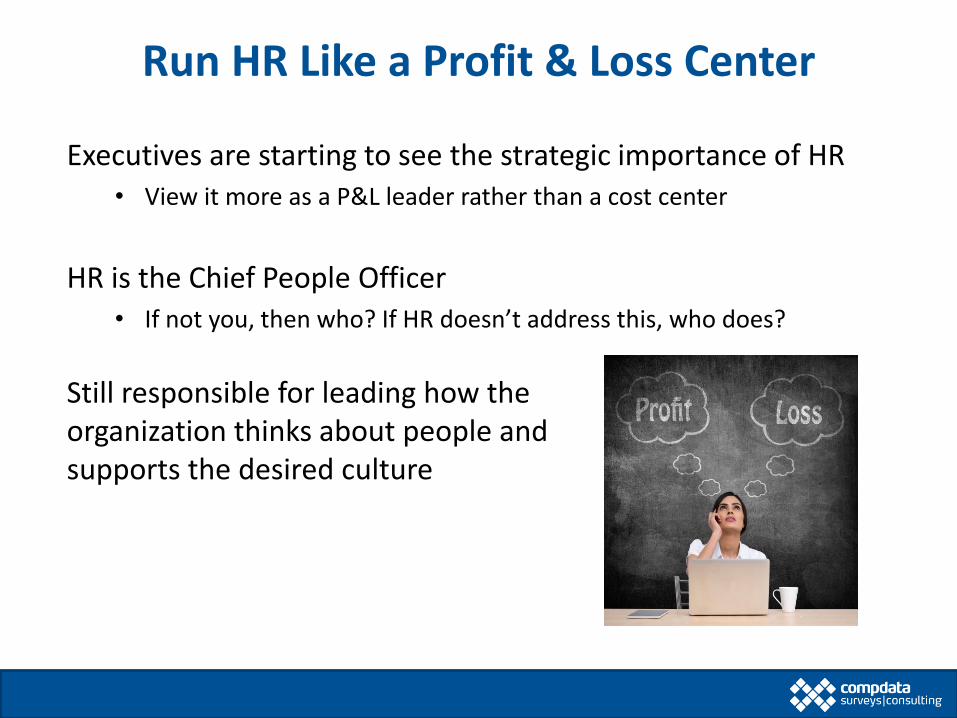
Run HR Like a Profit & Loss Center
Executives are starting to see the strategic importance of HR• View it more as a P&L leader rather than a cost center
HR is the Chief People Officer• If not you, then who? If HR doesn’t address this, who does?
Still responsible for leading how the organization thinks about people and supports the desired culture

Begin a Different Dialogue
• Build the process and gain executive ownership around the cost of turnover.
• Clearly and logically communicate the financial implications.
• Position these HR initiatives in P&L terms.
• Ultimately, make HR a strategic partner.

AGENDAQ & A
Talent Takeaways Series
Live Q&A
AGENDAAGENDAResources & Support
Talent Takeaways Series
✓ Resource Library
✓ Product Information
✓ Product Tour & Demo
HRsoft.com

Questions?Contact us anytime with questions about our data
or our consulting services:Theresa M. Worman
Compdata Surveys & Consulting800.300.9570