Identifying Term Interbank Loans from Fedwire Payments Data · Identifying Term Interbank Loans...
49
This paper presents preliminary findings and is being distributed to economists and other interested readers solely to stimulate discussion and elicit comments. The views expressed in this paper are those of the authors and do not necessarily reflect the position of the Federal Reserve Bank of New York or the Federal Reserve System. Any errors or omissions are the responsibility of the authors. Federal Reserve Bank of New York Staff Reports Identifying Term Interbank Loans from Fedwire Payments Data Dennis Kuo David Skeie James Vickery Thomas Youle Staff Report No. 603 March 2013 Revised August 2014
Transcript of Identifying Term Interbank Loans from Fedwire Payments Data · Identifying Term Interbank Loans...

This paper presents preliminary findings and is being distributed to economists
and other interested readers solely to stimulate discussion and elicit comments.
The views expressed in this paper are those of the authors and do not necessarily
reflect the position of the Federal Reserve Bank of New York or the Federal
Reserve System. Any errors or omissions are the responsibility of the authors.
Federal Reserve Bank of New York
Staff Reports
Identifying Term Interbank Loans from
Fedwire Payments Data
Dennis Kuo
David Skeie
James Vickery
Thomas Youle
Staff Report No. 603
March 2013
Revised August 2014

Identifying Term Interbank Loans from Fedwire Payments Data
Dennis Kuo, David Skeie, James Vickery, and Thomas Youle
Federal Reserve Bank of New York Staff Reports, no. 603
March 2013; revised August 2014
JEL classification: G01, G10, G21
Abstract
Interbank markets for term maturities experienced great stress during the 2007-09 financial crisis,
as illustrated by the behavior of the one- and three-month Libor. Despite widespread interest in
these markets, little data is available on dollar interbank lending for maturities beyond overnight.
We develop a methodology to infer information about individual term dollar interbank loans
settled through the Fedwire® Funds Service, the large-value bank payment system operated by
the Federal Reserve Banks. We find a sharp increase in the dispersion of inferred term interbank
interest rates, a shortening of loan maturities, and a decline in term lending volume following the
failure of Lehman Brothers in September 2008. Several diagnostic tests suggest that our approach
provides a useful source of information about the term interbank market, allowing for a number
of research applications.
Key words: interbank market, loan, Fedwire, algorithm
________________
Kuo: University of California at Los Angeles (e-mail: [email protected]). Skeie: Texas A&M
University (e-mail: [email protected]). Vickery: Federal Reserve Bank of New York (e-mail:
[email protected]). Youle: University of Minnesota (e-mail: [email protected]). For market
insights, the authors thank members of the Federal Reserve Bank of New York’s Markets Group,
particularly Chris Burke, Patrick Dwyer, Spence Hilton, and John McGowan. This paper also
benefited from comments by Olivier Armantier, Alexandre Chailloux, Adam Copeland, Antoine
Martin, Jamie McAndrews, Joao Santos, and Giorgio Topa. The authors also thank Enghin Atalay, Michael Walker, and particularly David Hou, Sha Lu, and Ali Palida for outstanding research
assistance. The views expressed in this paper are those of the authors and do not necessarily reflect the
position of the Federal Reserve Bank of New York or the Federal Reserve System.
1
1. Introduction
Interbank markets experienced enormous stress during the recent 2007-09 financial crisis and were
seen as a driver of contagion throughout the financial system and to the real economy. The disruption
in interbank borrowing conditions for maturities beyond overnight attracted particular attention.
Sharp increases in unsecured term interbank rates, as measured by 1- and 3-month Libor (shown in
Figure 1 as a spread to the overnight indexed swap rate, OIS), were widely followed by market
participants as key indicators of bank funding stress and the severity of the crisis. Perceptions of a
wide dispersion of term interbank rates were reflected in anecdotes of credit-tiering among banks.
Financial commentators and officials claimed that interbank lending markets were frozen, and in
particular, that banks were unable to borrow interbank funds at tenors beyond overnight.1
Despite the importance of US dollar term interbank markets, little data is available to
researchers to measure and analyze term dollar interbank transaction interest rates, volumes, and
maturities.2 No comprehensive measures of term US dollar interbank loan flows are collected, and
regulatory data on outstanding volumes is limited.
This paper develops a methodology to infer information about the volume, rate, and maturity
of term US dollar interbank loans using data on payments settled through the Fedwire® Funds
Service,3 the large-value bank payment system operated by the Federal Reserve. We develop an
algorithm to identify payment pairs matching the properties of the sending and return leg of an
unsecured term interbank loan: a payment from bank A to bank B, and a matching return payment for
1To illustrate: “One professional calls the money markets ‘basically frozen’ except for overnight.” Barrons, 9/12/07. “Bank-to-bank lending freezes,” Reuters, 3/17/08. “‘Today we have banks that no longer lend to each other because they lack confidence – that is what is freezing up the market,’ he [IMF managing director Dominique Strauss-Kahn] said.” Straits Times, 4/4/08. “One major flaw in the global banking system, and a sign that problems extend beyond whether US homeowners can pay their mortgages, is the fact that banks don't trust each other enough to loan beyond an overnight period.” Wall Street Journal, 10/10/08. “There is no longer an interbank market. There are only central banks supplying cash,” Bloomberg, 12/11/08. 2 Libor itself is based on a survey in which a panel of large banks report an estimate of the rate at which they believe they could borrow in the interbank market at various maturities. In recent years allegations have emerged that Libor was misreported or manipulated by reporting banks. The Wheatley Review of Libor (H.M. Treasury, 2012) outlines recommendations for Libor reform. See also Snider and Youle (2013) and Kuo, Skeie and Vickery (2012). 3 “Fedwire” is a registered service mark of the Federal Reserve Banks.

2
a slightly larger amount (reflecting principal plus interest) from bank B to A on a later date, where the
sending and return payment meet a set of criteria consistent with interbank market conventions. This
approach has been used previously to infer overnight interbank loans, starting with seminal research
by Furfine (1999)4, but to our knowledge has not previously been applied to measure term US dollar
interbank lending activity.
Figure 1: Libor – OIS during the 2007-09 financial crisis
We use the algorithm’s inferences to shed light on the maturity structure of interbank
borrowing during the crisis. For example, while measured overnight interbank activity is fairly stable
during 2008, consistent with Afonso et al. (2011), our estimates suggest that maturity-weighted
issuance of term interbank term loans decreased from roughly $150 billion to $90 billion at the crisis
peak around the default of Lehman Brothers, before recovering as the crisis eased. Thus, our
inferences suggest that the crisis peak was associated with a shortening in the maturity of interbank
4 Afonso, Kovner and Schoar (2011) use the Furfine algorithm to study the US overnight federal funds around the Lehman Brothers bankruptcy, finding that the market did not collapse, but that spreads and volumes became more sensitive to borrower characteristics. Furfine (2001) finds earlier evidence that fed fund spreads vary with borrower credit risk. Other papers using the Furfine algorithm to study US interbank markets include Ashcraft, McAndrews and Skeie (2011), Bech and Klee (2011), Bartolini, Hilton and McAndrews (2010), Ashcraft and Duffie (2007), and Demiralp, Preslopsky, and Whitesell (2006). Wetherilt, Soramäki, and Zimmerman, (2009) and Akram and Christophersen (2010) apply the approach to non-US markets. See Kovner and Skeie (2013) for further references.

3
borrowing, consistent with the theoretical predictions of Brunnermeier and Oehmke (2013) and
Acharya and Skeie (2011).
We interpret the results of the algorithm to be a measure of overall interbank market activity;
we do not attempt to draw conclusions about the borrowing of any individual firm, or to distinguish
between term Eurodollar deposits versus term federal funds. Historically, algorithms based on the
work of Furfine have been used as a method of identifying overnight federal funds transactions. The
Research Group of the Federal Reserve Bank of New York has recently concluded that the output of
its algorithm based on the work of Furfine5 may not be a reliable method of identifying federal funds
transactions.6 This paper therefore refers to the transactions that are identified using the Research
Group’s algorithm as overnight or term loans made or intermediated by banks. Use of the term
“overnight or term loans made or intermediated by banks” in this paper to describe the output of the
Research Group’s algorithm is not intended to be and should not be understood to be a substitute for
or to refer to federal funds transactions.
Our estimates suggest that maturity-weighted average issuance of new interbank term loans
decreased by roughly 40% around the default of Lehman Brothers, before rebounding. More
generally, the fraction of term interbank loans and value-weighted average loan maturity are
significantly negatively correlated with measures of funding stress, including spreads between BBB-
AAA bond yields, Libor-OIS, and certificates of deposit (CD)-OIS. The sensitivity of maturity to
funding conditions is higher for inferred loans where the recipient is a domestic bank, rather than a
branch or agency of a foreign banking organization (FBO) or a nonbank such as a government
sponsored enterprise (GSE). One interpretation of this result is that FBOs may have had greater
5 It should be noted that for its calculation of the overnight effective federal funds rate, the Federal Reserve Bank of New York relies on interbank broker-supplied sources of data, not on the algorithm output. 6 The output of the algorithm may include transactions that are not federal funds trades and may discard transactions that are federal funds trades. Some evidence suggests that these types of errors in identifying federal funds trades by some banks may be large.

4
demand for term interbank borrowing during the crisis period given their lack of dollar-denominated
retail deposits (Goldberg, Kennedy and Miu, 2011).
Broadly consistent with movements in Libor, our transaction-level inferences suggest that
interbank term interest rates were significantly elevated relative to OIS during the crisis, particularly
in September and October 2008. We also show that the cross-sectional distribution of term rates also
becomes much more diffuse following the onset of the crisis in August 2007, particularly in the fall
of 2008. Consistent with these trends, in simple regressions, the interquartile range of one month
term rates is positively and significantly correlated with measures of stress in funding markets.
Our methodology infers individual unsecured interbank loans made or intermediated by
banks with maturities from two days to one year, among a broad range of Fedwire members,
including US banks, branches and agencies of FBOs, and GSEs. We use the term “interbank” to refer
broadly to transactions made or intermediated by this set of institutions.
Extending the Furfine matching algorithm to maturities beyond overnight introduces a
number of methodological and computational challenges; we consequently introduce several
refinements to Furfine’s approach to improve the signal-to-noise ratio of the estimates. For example,
we restrict the algorithm to only identify transaction pairs where the implied interest rate is a whole
number of basis points, consistent with market convention. This filter greatly reduces the number of
payment pairs identified by the algorithm. Using a dataset of actual unsecured interbank loans, we
also confirm term interbank loans do indeed generally satisfy the “whole basis point” condition.
As well as using the algorithm to study the crisis period, we also present statistics that shed
light on the approximate magnitude of misclassification and incompleteness errors associated with
the algorithm. A first source of error, statistical in nature, is that the algorithm may by chance match
up two unrelated payments (a “Type I” error) or may fail to identify actual unsecured interbank loans
(a “Type II” error). Our diagnostic tests suggest that the incidence of these statistical
misclassification errors is relatively low. As evidence on Type I statistical errors, we show that

5
implied interest rates on matched transaction pairs are tightly bunched near the prevailing Libor rate
prior to the onset of the financial crisis. This is inconsistent with the hypothesis that the algorithm is
matching unrelated transactions, since in that case we would expect a distribution that is roughly
uniform over a wide range of implied interest rates. As evidence on Type II statistical errors, we
show that the filters applied by our algorithm would screen out only around 30 percent of actual
interbank loans in a dataset of such loans obtained from an interbank broker.
A second source of error is that the algorithm may identify payment pairs that, while related,
are not term interbank loans between the proximate counterparties identified in Fedwire. In
particular, it is difficult to accurately assess the volume of correspondent activity, where the receiver
or sender identified in Fedwire is acting as an agent for another entity. This is an important concern if
the research question at hand requires identifying the final borrower and lender, although is less
relevant for using the algorithm to infer overall interbank market activity. Kovner and Skeie (2013)
find evidence that overnight interbank exposure measured at the firm level by the Furfine algorithm
is statistically and economically significantly correlated with fed funds borrowing and lending
reported in bank quarterly regulatory filings.7 While there are institutional reasons to expect that our
inferences should not reflect secured loans such as repo, we also conduct diagnostic tests to check
this; for example, we compare the distribution of inferred term interest rates to secured and
unsecured funding rates, finding no evidence of clustering in loan rates near secured funding rates.
Finally, we do not capture all dollar denominated interbank activity, since some interbank
loans are settled on CHIPS (previously called The Clearing House Interbank Payments System), or
on a single bank’s balance sheet, if both the borrower and lender have accounts with the common
7 Armantier and Copeland (2012) attempt to assess the size of Type I and Type II errors when using the overnight Furfine algorithm to identify overnight federal funds loans, a subcomponent of the overall overnight interbank market, for two large banks. They find a high incidence of Type I and Type II errors, which could be due to a large volume of correspondent transactions, misclassifications between overnight federal funds loans and Eurodollar deposits, or could reflect other factors. See section 5.2 for a more detailed discussion.

6
clearing bank. Institutional reports suggest however that a large fraction of US dollar interbank loans
are settled on Fedwire (e.g., Stigum and Crescenzi, 2007).
To our knowledge, this paper represents the first attempt to extend the Furfine (1999)
methodology to identify dollar interbank loans beyond overnight. As applications of this approach,
Kuo, Skeie and Vickery (2012) use inferences from this algorithm combined with other data sources
to analyze the behavior of Libor compared to other measures of bank funding costs during the
financial crisis, while Duffie, Skeie and Vickery (2013) use the algorithm inferences to evaluate the
statistical properties of a sampling-window approach to computing a Libor fixing.
Most closely related to this paper, independent work by Arciero et al. (2013) and Heijmans,
Heuver and Walraven (2010) extends the Furfine matching approach to identify and study euro-
denominated term interbank loans settled on TARGET2, the European payment system. Our
approach is also related to literature discussed above using the overnight-loan Furfine (1999)
approach, and to research using alternative data sources to study interbank market behavior.8
2. Institutional Background
The interbank market consists of unsecured loans made from one bank to another, or more broadly,
from one financial institution to another. Interbank borrowing is a subset of bank wholesale funding,
which more broadly also includes money market instruments, such as CDs, commercial paper and
repurchase agreements, and includes borrowing from banks, other financial intermediaries (e.g.,
money market funds) as well as non-financial corporations. Wholesale funding excludes retail
borrowing, such as small insured deposits. Access to unsecured interbank borrowing is important for
many banking firms, because many bank assets are opaque, nonmarketable loans that are difficult to
8 While most interbank loans are negotiated over-the-counter, some euro interbank lending occurs on the Italian market exchange e-MID, over which a small amount of term lending occurs, as studied by Angelini, Nobili and Picillo (2009) and Schwarz (2010). Quarterly bank-reported data on outstanding interbank credit exposures is used to examine interbank lending for German banks (Craig and von Peter, 2010) and Dutch banks (Liedorp et al., 2010).

7
use as collateral. Interbank loans are also sometimes referred to as “trades,” with “buy”
corresponding to borrow and “sell” corresponding to lend.
Banks borrow on the interbank market and broader wholesale markets at a range of maturities
for several reasons. First, many banks use wholesale borrowing as a part of their structural funding,
which refers to borrowing that is part of a bank’s continuing, perpetual funding source. Some banks
have little access to retail deposits and borrow primarily in wholesale funding markets. Second,
banks borrow at multiple maturities and overlap or “ladder” borrowing to manage interest rate risk,
liquidity risk, and rollover risk. Term borrowing can help insulate banks against a sudden inability to
borrow and against unexpected liquidity withdrawals (see Acharya and Skeie, 2011).
Unsecured US dollar interbank loans, the focus of this paper, are negotiated bilaterally over-
the-counter. Many interbank loans are arranged through brokers. Some large money center banks act
as dealers, particularly in the overnight market, providing liquidity and credit and earning profits
from the bid-ask spread and from arbitrage (see Ashcraft and Duffie, 2007). The market also includes
correspondent banks acting as intermediaries. Settlement of interbank loans occurs either over one of
the two large-value payment systems, the Fedwire Funds Service and CHIPS, or on a single bank’s
balance sheet, if both the borrower and lender have accounts with the common clearing bank.
Currently there exists no comprehensive transaction-level data on the US term interbank
market, and relatively little aggregate data is collected or published for rates and volumes on term
dollar interbank loans. Historically, data on term interbank market rates have generally been based on
banks surveys such as Libor and the now-discontinued New York Funding Rate (NYFR), or
reference bid-ask rates from brokers that may or may not correspond to completed or executable
trades. Reference rates include Reuter’s FT Eurodollar quotes, an electronic-screen broker quote for
Eurodollars, and the H.15, a Eurodollar deposit offered rate published by the Federal Reserve based
on a reported broker quote.
8
Significantly more data is collected on the overnight interbank market. The Federal Reserve
publishes the effective federal funds rate based on data from interbank brokers on the rates and
volumes of overnight federal funds transactions that are brokered.9 Even so, the published rate
excludes non-brokered transactions, which may compose a large amount of the interbank market,10
and does not include Eurodollars.11 On April 1, 2014, the Federal Reserve began collecting (but not
publishing) daily transaction data on bank’s overnight and term interbank borrowing, which includes
federal funds and Eurodollars, and on CD issuance, with the FR 2420 Report. Reported data on each
transaction includes the interest rate, size, and maturity, but not counterparty.12
Financial regulatory agencies collect some aggregate measures of dollar interbank volumes.
Call Reports filed by US depository institutions report total overnight federal funds lending and
borrowing, although they do not separately report term interbank borrowing. The Federal Reserve’s
H.8 statistical release also reports weekly estimates of the banking system’s aggregate outstanding
interbank lending volume, although the maturity structure of this lending is not reported.
According to the H.8 report, interbank loans and wholesale deposits represented 4.7% of
aggregate bank liabilities as of December 27th, 2006 (just before the period of this study). While they
represent a relatively small fraction of total bank liabilities, interbank loans play an important role as
the marginal bank funding source both intraday and in the short-term on a weekly and monthly basis.
As the marginal funding source for many banks, rates and volumes of wholesale funding in these
markets are important for understanding the overall availability of finance to banks.
9 Federal funds loans are unsecured loans of immediately available funds between banks and other institutions with accounts at Federal Reserve Banks. The set of institutions with Reserve accounts includes domestic depository institutions, domestic branches of foreign banks, GSEs, foreign central banks, and monetary authorities. 10 See Bech and Klee (2011) and Bartolini et al. (2010). 11 Eurodollars are dollar deposit liabilities of banks domiciled outside the United States. Thus, banks operating in the United States, including branches and agencies of foreign banks, do not, by definition, borrow Eurodollars, although they can do so indirectly through their non-US offices or through International Banking Facilities. See Bartolini, Hilton and Prati (2008) for more details. Federal funds are typically traded during New York market hours (the New York session), while Eurodollars are traded during both London market hours (the London session) and the New York session and are settled over Fedwire and CHIPS. Eurodollar transactions settled over Fedwire are sometimes known as “Eurofeds” (Stigum and Crescenzi, 2007). 12 For details, see http://www.federalreserve.gov/reportforms/formsreview/FR2420_20131216_ffr.pdf and http://www.newyorkfed.org/banking/reportingforms/FR_2420.html.

9
3. Overview of the Term Algorithm
This section summarizes the main steps involved in implementing the term algorithm.
3.1 The Fedwire Funds Service
The source data for the algorithm are the transaction logs of the Fedwire Funds Service, the real-time
large value gross settlement system operated by the Federal Reserve. Fedwire members include
Federal Reserve Banks, US banks and bank holding companies, branches and agencies of FBOs, and
other institutions with Federal Reserve accounts, such as Fannie Mae, Freddie Mac, the Federal
Home Loan Banks and Bank for International Settlements. Our data includes a set of basic
characteristics for every payment settled over the Fedwire Funds Service, including the ABA number
of the sending and receiving entities, the payment date and time, and the dollar amount transferred.
3.2 Example
We develop and apply a generalized version of the overnight algorithm originally developed by
Furfine (1999). Our goal is to identify matching back-and-forth pairs of Fedwire payments with
characteristics consistent with a term unsecured interbank loan. An illustrative example of the type of
payment pair matched by our term algorithm is shown below. In this example, Bank A is assumed to
lend $65m to Bank B on July 7 2008 for one month at an annualized interest rate of 3.04%13. In the
Fedwire Funds Service, this loan appears as a payment of $65m from Bank A to Bank B on 7/7/2008,
and a return payment from Bank B to Bank A one month later for a slightly larger amount,
$65,170,155.56. We refer to the first payment as the “sending leg,” and the second payment as the
“return leg” of the pair.
13 More precisely: in this example, the funds are lent for 31 days. Interest rates in the interbank market are quoted based a 360 day year convention. A return amount of $65,170,155.56 thus implies an annualized interest rate of [($65,170,155.56 / $65,000,000) – 1] x (360/31) = 3.040000%. Note that the interest rate is a whole number of basis points, consistent with interbank market practice (see further discussion below).

10
Figure 2: Payment pair
The algorithm searches the Fedwire Funds Service for payment pairs like the one shown
above. We first identify large round-number payments, which are candidate sending legs. For each
candidate, we then search for return payments for a slightly larger amount with a date up to one year
after the sending leg, sent from the recipient of the initial payment back to the original sender (based
on their account numbers in Fedwire). The sending and return leg, as well as the resulting payment
pair, must satisfy a range of filters designed to screen out spurious matches.
3.3 Steps in the algorithm
The main steps in the algorithm are as follows. A more detailed description of the filters we apply is
provided in the technical Appendix.
Filter 1: Drop any Fedwire payments already identified as being a leg of an overnight
interbank loan by the New York Fed’s version of the Furfine (1999) algorithm. These payments
associated with inferred overnight loans are excluded from the steps below, but are merged back in at
the end to create a consolidated dataset that includes both term and overnight loans.
Filter 2a: Among remaining Fedwire payments, identify all large “round-lot” payments (at
least $10m, in increments of $100,000) that do not involve a clearing institution such as Continuous
Linked Settlement (CLS) or the Depository Trust Company (DTC), an international agency or a
central bank. We also exclude payments from State Street to either of the triparty repo clearing banks
(J.P. Morgan Chase or Bank of New York), and transactions between entities that have the same lead
ABA number or are members of the same regulatory high-holder (e.g. two subsidiaries of the same
Bank A Bank BImplied Rate = 3.0400%
$65,000,000.00 on 7/7/08
$65,170,155.56 on 8/7/08
11
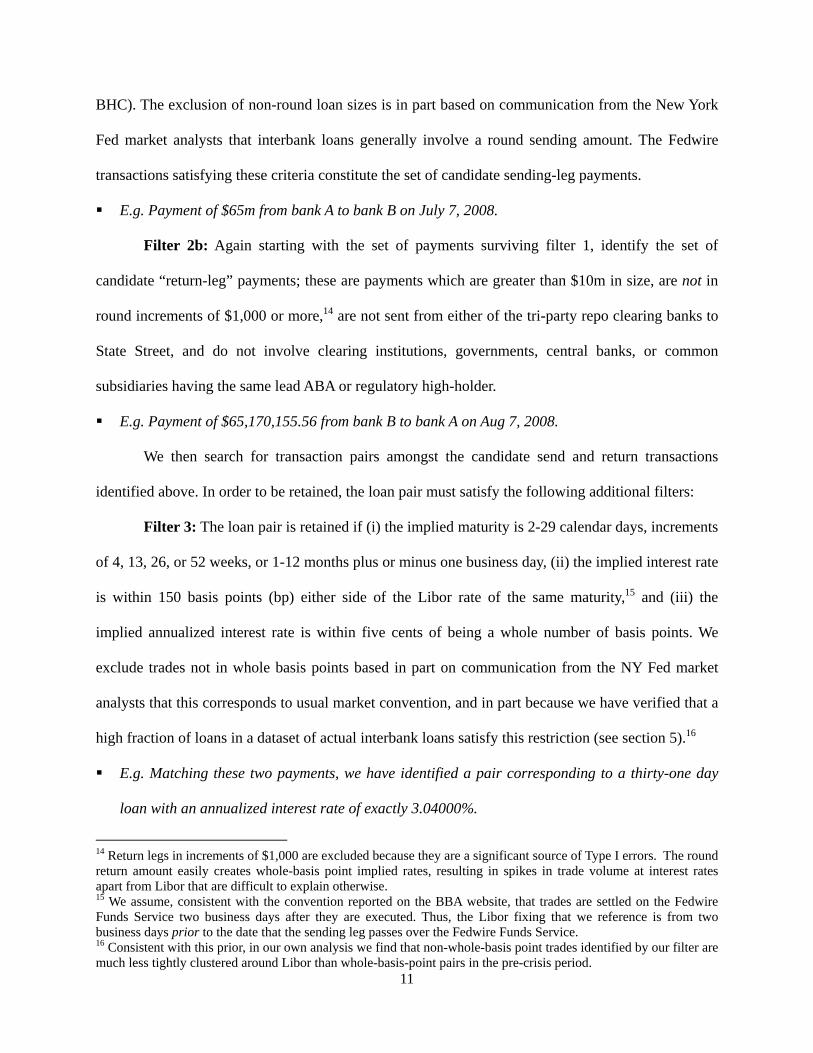
BHC). The exclusion of non-round loan sizes is in part based on communication from the New York
Fed market analysts that interbank loans generally involve a round sending amount. The Fedwire
transactions satisfying these criteria constitute the set of candidate sending-leg payments.
E.g. Payment of $65m from bank A to bank B on July 7, 2008.
Filter 2b: Again starting with the set of payments surviving filter 1, identify the set of
candidate “return-leg” payments; these are payments which are greater than $10m in size, are not in
round increments of $1,000 or more,14 are not sent from either of the tri-party repo clearing banks to
State Street, and do not involve clearing institutions, governments, central banks, or common
subsidiaries having the same lead ABA or regulatory high-holder.
E.g. Payment of $65,170,155.56 from bank B to bank A on Aug 7, 2008.
We then search for transaction pairs amongst the candidate send and return transactions
identified above. In order to be retained, the loan pair must satisfy the following additional filters:
Filter 3: The loan pair is retained if (i) the implied maturity is 2-29 calendar days, increments
of 4, 13, 26, or 52 weeks, or 1-12 months plus or minus one business day, (ii) the implied interest rate
is within 150 basis points (bp) either side of the Libor rate of the same maturity,15 and (iii) the
implied annualized interest rate is within five cents of being a whole number of basis points. We
exclude trades not in whole basis points based in part on communication from the NY Fed market
analysts that this corresponds to usual market convention, and in part because we have verified that a
high fraction of loans in a dataset of actual interbank loans satisfy this restriction (see section 5).16
E.g. Matching these two payments, we have identified a pair corresponding to a thirty-one day
loan with an annualized interest rate of exactly 3.04000%.
14 Return legs in increments of $1,000 are excluded because they are a significant source of Type I errors. The round return amount easily creates whole-basis point implied rates, resulting in spikes in trade volume at interest rates apart from Libor that are difficult to explain otherwise. 15 We assume, consistent with the convention reported on the BBA website, that trades are settled on the Fedwire Funds Service two business days after they are executed. Thus, the Libor fixing that we reference is from two business days prior to the date that the sending leg passes over the Fedwire Funds Service. 16 Consistent with this prior, in our own analysis we find that non-whole-basis point trades identified by our filter are much less tightly clustered around Libor than whole-basis-point pairs in the pre-crisis period.
12
Filter 4: Apply a tiebreaker in situations where the sending leg of the pair matches multiple
return legs, or the return leg matches multiple sending legs, or both. Our default tiebreaker is to keep
the transaction pair of shortest implied maturity.17 This tiebreaker ensures that if anything the
algorithm is biased against identifying loans at long maturities, and that inferred loans are not biased
toward having an interest rate close to the Libor fixing rate, within the search range of Libor +/-
150bp. We have also experimented with other tiebreakers: (i) picking a matched trade at random, and
(ii) keeping the matched trade that has an interest rate closest to the Libor rate of the same maturity,
and (iii) dropping all transactions that involve a tie rather than a unique match. As we document in
section 5, the properties of the set of identified transaction pairs are largely robust to which matching
method is used, with the exception that the number of loans identified by “unique match” approach is
smaller than the other methods, simply because all pairs involving ties are dropped.18
In the results presented here, we winsorize transactions with a sending amount exceeding $1
billion (i.e., we topcode by setting the principal amount equal to $1bn if it exceeds this threshold).
This is done in part to preserve confidentiality, and in part to reduce the influence of extreme outliers.
This topcoding affects 1.2% of inferred payment pairs, and has the effect of modestly reducing the
total measured volume of originations (maturity weighted origination falls by 8%). It does not
materially affect any of our main findings.
We do not attempt to identify loans with non-whole-month maturities beyond one month, to
reduce computational costs, because of feedback from market participants that such loans are
relatively unusual, and because Libor fixings are only reported at whole month maturities beyond one
month. Summary statistics reported below suggest that one and three month loans, as well as term
loans for maturities of less than one month, represent the largest share of measured lending volume.
17 If multiple remaining loan pairs have the same shortest maturity, we select one pair at random. 18 Heijmans et al. (2010) use tiebreaking procedures quite similar to those described above, and provide a useful discussion about the advantages and disadvantages of different tiebreaking approaches.

13
4. The Interbank Market During the 2007-09 Crisis Period
Table 1 presents summary statistics for the term loans inferred by the algorithm originated between
January 2007 and March 2009. 51,087 inferred loans are identified over this period, around 91 per
business day. The table includes statistics for this entire period and four sub-periods: (i) the “pre-
crisis” until August 9, 2007, the date when BNP Paribas suspended convertibility on two hedge
funds, marking the start of illiquidity in interbank and commercial paper markets; (ii) the “early
crisis” period from this date until the bankruptcy of Lehman Brothers on September 15, 2008; (iii)
the “crisis peak,” from the Lehman bankruptcy until November 11, 2008 (the first date when one-
month Libor falls below its peak pre-Lehman level); and (iv) a “crisis easing” period from November
12, 2008 onwards.
About one quarter of the identified term loans have a maturity of one month or more. The
average (mean) maturity is about 34 days, although the median is only 10 days. The high number of
short maturity inferred loans reflects that such loans are, by their nature, refinanced more frequently.
Correspondingly, their share of originations will be higher than their share of total loans outstanding.
As discussed in more detail below, average term loan maturity declines over time.
The distribution of implied loan sizes is right skewed; the average loan size is about $124
million, whereas the median size is $40 million. Surprisingly, the average loan size increases from
pre-crisis to early crisis, only falls off slightly at the crisis peak, and jumps up sharply at the crisis
easing. The median loan size similarly increases from pre-crisis to early crisis, but at crisis peak falls
below the pre-crisis size, and again jumps up at the crisis easing.
The average implied interest rate relative to OIS for the sample increases sharply as the crisis
begins and intensifies, broadly consistent with the behavior of publicly observable measures of
unsecured funding costs (e.g., Libor). For example, the mean spread to OIS for one-month loans
increases from 13bp in the pre-crisis period before August 9, 2007 to 209bp at the crisis peak in fall
14
2008, defined as an approximately two-month period following the failure of Lehman Brothers
(specifically 9/15/2008 to 11/11/2008).
An advantage of our transaction-level data relative to public measures like Libor or NYFR is
that we can go beyond simple averages to compute distributional statistics about term interbank
funding costs during this period. We observe a large increase in the dispersion of borrowing interest
rates as the crisis intensifies. For example, the interquartile range of implied annualized interest rates
for one-month loans (measured as a spread to OIS) increases from 8bp in the pre-crisis period before
August 9, 2007 to 112bp at the financial crisis peak.
The final part of the table documents transactions across four different inferred borrower
types: U.S. commercial and savings banks, foreign banks, defined as branches or agencies of FBOs
as well as other companies with Fedwire accounts organized under the laws of a foreign country,
GSEs, and “other”, a category that includes Edge or Agreement corporations, limited trust
companies, and banker’s banks.19 Although GSEs are active lenders of funds in the interbank market
(e.g., as discussed by Bech and Klee, 2011), they engaged in little term borrowing during our sample
period, according to our Fedwire inferences.
An important caveat on this breakdown by borrower type is that Fedwire records only the
proximate sender and receiver of funds; this will differ from the final sender or recipient if the
proximate party is acting as a correspondent bank for another legal entity, either inside or outside the
same holding company. Primarily for this reason, this paper does not match our inferred term loans
with borrower-level characteristics. We instead focus on an analysis of patterns in aggregate market
activity, or study the broad classes of proximate borrower identified in Table 1.
4.1 Volume and maturity structure during the crisis
19 Note that this classification treats domestic banks and bank holding companies that have an ultimate foreign parent in the “domestic bank” category, not as foreign banks. The “foreign banks” category also includes companies engaged in the business of banking that are organized under territories of the United States, such as Puerto Rico, Guam, American Samoa and the Virgin Islands.
15
Table 2 presents more detail on the maturity structure of interbank lending. For this table, we
append our term algorithm results with the set of inferred overnight loans from the version of the
standard Furfine algorithm maintained by the Federal Reserve Bank of New York. This allows us to
examine market activity for loans with maturity from overnight to one year (in contrast to previous
US work, which has studied only the overnight market; e.g., Afonso et al., 2011).20
The table reports maturity-weighted origination volumes, that is, (daily average volume) x
(loan maturity in business days). We use maturity weights so that loan volumes across maturities can
be compared appropriately; otherwise shorter-term volumes will seem magnified, because they are
rolled over more frequently.21 In steady state, these weighted origination statistics correspond to the
outstanding relative volumes of term loans of each maturity.
The algorithm identifies a significant volume of implied term loans made or intermediated by
banks over this sample period. Inferred term loans represent 33% of total average issuance volume of
$448bn. A broad spectrum of maturities is represented. More than half of the term volume is for a
maturity of one month or more, and 15.7% of total inferred interbank market activity is for maturities
of three months or more. These summary statistics suggest that term borrowing represents a
significant part of the interbank market during this period.
Examining the evolution of transaction activity, similar to Afonso et al. (2011), we find that
there is no significant decline in overnight volume during the financial crisis period (at least prior to
20 Our sample of overnight loans differs slightly from the standard algorithm used by the Federal Reserve Bank of New York. We maintain consistency with the term algorithm by imposing the same set of counterparty filters on overnight loans. The standard overnight algorithm only filters out loans made between entities with the same master ABA. 21 For example, imagine we are comparing two banks, A and B. Bank A rolls over $50m of overnight interbank loans every business day. Bank B rolls over $10m of term loans each day, each with a maturity of 5 business days. Both these banks have $50m of interbank loans outstanding at any point in time. But if we plotted or tabulated unweighted issuance volume, bank A’s volume would be five times larger than bank B ($50m rather than $10m), simply because their loan are rolled over more frequently. To account for this, we compute the maturity-weighted issuance volume, which for bank B is $10m x 5 days = $50m, matching their volume of outstanding loans. An alternative approach would be to instead tabulate volumes of outstanding loans. Although this looks broadly similar to table 2 and our other results, we view this measure as less attractive for studying the financial period, because it responds only sluggishly in response to changes in fundamentals as the old loans mature. In the above example, if bank B experienced a funding freeze, new borrowing would immediately drop to zero, but loans outstanding would only slowly decline over a five day period, as the old loans matured and were not renewed.

16
the introduction of interest on excess reserves on October 8, 2008), even at the peak of the crisis
following the bankruptcy of Lehman Brothers. We do observe a decline in term interbank lending
however. The volume of term loans with a maturity of one month or more drops by nearly half, from
$111.8bn in the early crisis period to only $55.5bn at the crisis peak. A much smaller decline (from
$49.2bn to $48.4bn) is observed for term loans with less than one month maturity.
In other words, the robust volume of overnight lending at the crisis peak discussed in Afonso
et al. (2012) appears in part to be due to a shortening in the maturity structure of interbank lending.
As plotted in Figure 3 below, inferred term lending activity declined across all tenors, although there
is a particularly significant decline in the fraction of term loans with a maturity of 3 months or more.
We also observe volatility in term volume at year-end both in 2007 and 2008, and to a lesser extent
around quarter-ends. This may be due to window-dressing effects or other factors.
Figure 3: Value-weighted Term Interbank Lending Issuance
Figure 4 plots the combined evolution of term and overnight interbank lending. The fraction
of term lending falls from about 30% to 20% over the two weeks leading up to the Lehman
bankruptcy event. The fraction of term lending then remains low until the second week of October,
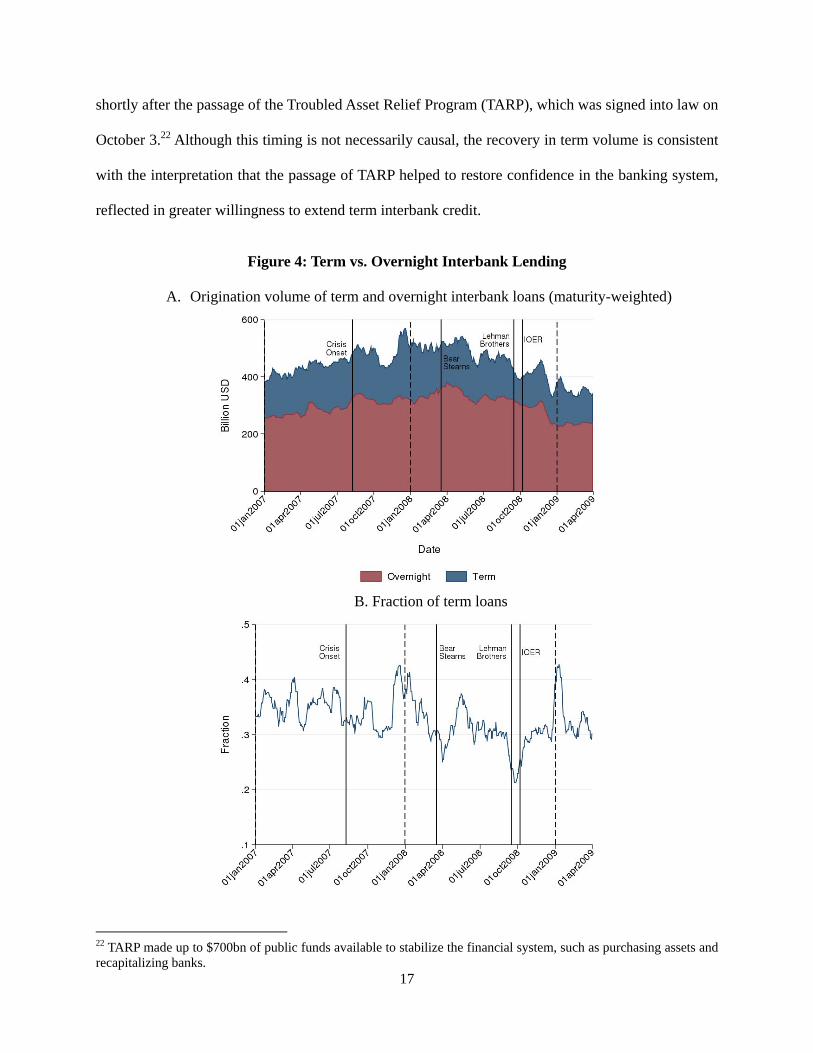
17
shortly after the passage of the Troubled Asset Relief Program (TARP), which was signed into law on
October 3.22 Although this timing is not necessarily causal, the recovery in term volume is consistent
with the interpretation that the passage of TARP helped to restore confidence in the banking system,
reflected in greater willingness to extend term interbank credit.
Figure 4: Term vs. Overnight Interbank Lending
A. Origination volume of term and overnight interbank loans (maturity-weighted)
B. Fraction of term loans
22 TARP made up to $700bn of public funds available to stabilize the financial system, such as purchasing assets and recapitalizing banks.

18
4.2 Statistical analysis of maturities
To augment this descriptive evidence, in Table 3 we estimate time-series regressions of the
relationship between measures of loan maturity and three measures of funding stress or default risk:
(i) the spread between BBB-rated and AAA-rated bonds, (ii) the spread between Libor and OIS, and
(iii) the spread between secondary market CD yields and OIS. Although conceptually distinct, these
three measures of credit and liquidity risk co-moved quite closely during the crisis period, each
peaking in the period following the Lehman bankruptcy. We also estimate similar regressions to
study the determinants of interest rate dispersion in the term interbank market.
The first part of Table 3 studies the time-series determinants of loan maturity, measured by
the fraction of term borrowing (panel A), and the volume-weighted maturity of new originations
(panel B). Both sets of regressions suggest a significant shortening in maturities as funding stresses
intensified. For example, quantitatively, a 100bp increase in the Libor OIS spread is associated with a
3.07 percentage point decline in the fraction of term interbank market activity (equivalent to
approximately a 10% decline in the term share, given that inferred term borrowing represents about
30% of total activity in the data). Columns 1-3 include each funding stress measure individually;
columns 4-6 also include a quadratic term. This term generally has the opposite sign to the linear
term, suggesting that the effect of a given basis point increase in spreads is larger when funding
spreads are low than high.
4.3 Effects on interest rate dispersion
Panel C of Table 3 reports results for interest rate dispersion, measured as the interquartile spread of
interest rates on one-month interbank loans originated in a given calendar week (i.e. we estimate this
regression using weekly rather than daily data). Consistent with our summary statistics, the cross-
sectional dispersion of measured interbank transaction rates widens significantly as the crisis
intensifies. Quantitatively, a 100bp increase in the Libor – OIS spread is associated with a 30.2bp
increase in the interquartile spread of interest rates. The implication of this finding is that average
19
measures of funding costs, such as Libor, became much less informative about the costs of funds
facing any individual bank during the crisis period.
This increase in dispersion is shown graphically in figure 5, which presents a histogram of
transaction interest rates for the four phases of the crisis defined earlier. This figure also indicates the
average value of different funding cost indexes during the four periods, including the reverse repo
rate for MBS, agency bonds and Treasury securities, and Libor. We present this information
separately for one-month and three-month loans, two maturities for which there are a significant
number of transactions. Prior to the onset of the financial crisis, transaction interest rates are tightly
distributed close to Libor. During the early phase of the crisis the distribution is more diffuse, but still
clearly bell-shaped. The distribution is wider and fatter-tailed in the period following the Lehman
Brothers bankruptcy, even after conditions begin to normalize at the end of 2008.
4.4 Differences across borrower types
Table 4 studies the determinants of the maturity of interbank lending separately by borrower
type, split into domestic bank, foreign bank, and “other” (we include GSEs in this “other” category,
given that measured GSE borrowing volumes are so low). Interestingly, the relationship between
funding stress and maturity is stronger for US banks than for branches and agencies of foreign banks,
or nonbanks, for all six regression specifications. For example, in the second row of results, a 100bp
increase in the Libor-OIS spread is associated with a 3.07 percentage point decline in the term loan
share for domestic banks, but has little or no effect on the term share for branches and agencies of
foreign banks, or for GSEs. For each set of regressions, we test the null hypothesis that the
coefficient on domestic banks is equal to the coefficient on the other two borrower types. We reject
this null hypothesis at the 5% level in five of the six specifications shown in the table.

20
Figure 5: Transaction Interest Rate Distribution (spread over OIS)

21
A speculative interpretation of these differences is that FBOs had a structural shortage of
dollar-denominated funding during this period (Goldberg, Kennedy and Miu, 2011). Their continued
borrowing in the term interbank market may have reflected a higher demand for term funds. A more
detailed investigation of this question would be an interesting topic for future research, although
outside the scope of this paper.
5. Validation of Algorithm Output This section examines how well the algorithm identifies term interbank loans from the
underlying payments data in the transaction logs of the Fedwire settlement system. Our primary
challenge is that the Fedwire is used to settle many transactions that are not interbank loans. As
we have little advance knowledge as to the transaction type any particular payment corresponds
to, the algorithm will generate both false positives (Type I errors) and false negatives (Type II
errors) as it attempts to back out interbank loans.
The seriousness of these errors for our algorithm’s output ultimately depends on the
number and characteristics of interbank loans relative to the other transaction types settled over
Fedwire. Fortunately, the market conventions for interbank loans set them apart from most other
sources of wholesale funding and from interbank payments at large. This allows us to use these
institutional features to filter the underlying payments and drastically reduce the number of
payments we have to consider as being possible interbank loans. As a result, our algorithm
begins with hundreds of millions of possible payments but ends with only fifty thousand inferred
interbank loans.
However, we run the risk that our filters are too restrictive, and we eliminate many
payments that correspond to actual interbank loans. To test this, we apply our filters to an actual
historical dataset on brokered interbank term loans obtained from an interbank broker. We find

22
that more than 70% of the term loans in this dataset pass the filters applied by our algorithm. We
also perform several other diagnostic tests, which also suggest that our algorithm successfully
screens out most unrelated payments while retaining the majority of actual interbank loans.
5.1 Sources of error
The algorithm faces three types of potential errors:
(i) Statistical misclassifications. The algorithm may incorrectly match together two unrelated
payments passing over the Fedwire Funds Service, a Type I error. Conversely, the algorithm may fail
to identify an actual round-trip loan passing over the Fedwire Funds Service, because the loan does
not satisfy the algorithm’s filters (e.g. a loan that is not for a round dollar amount), a Type II error.
(ii) Related payment pairs that are not interbank loans. The algorithm may identify a
payment pair that represents another type of transaction other than an unsecured term interbank loan
(e.g. a tri-party or bilateral repurchase agreement, or a dollar roll). Alternatively, the algorithm may
identify an actual interbank loan, but for which the sender (receiver) is acting as a correspondent or
intermediary for another financial institution, rather than being the final lender (borrower) of funds.
(iii) Interbank loans that are not settled via the Fedwire Funds Service. As discussed in
Stigum and Crescenzi (2007), a significant fraction of dollar interbank loans are settled over CHIPS,
rather than over the Fedwire Funds Service. This creates an error of omission; the algorithm will
identify only a subset of total US dollar-denominated interbank lending activity.
5.2 Statistics about match rates
Our algorithm imposes restrictive filters on the initial set of send payments, the initial set of return
payments, and the initial many-to-many match of send and return payments. Each filter reduces the
number of payment pairs matched purely by chance, and thereby reduces the number of false positive
errors. On the other hand, it increases the number of false negatives, as any true interbank loans that
happen to violate the filters are screened out.
23
In particular, the algorithm’s payment filters (filters 2a and 2b, as described in section 3.3)
and matching restrictions (filter 3) each drastically reduce the set of Fedwire payments considered as
candidates for an interbank loan. The following statistics show the progression:
The algorithm begins with 296 million possible send leg payments and 419 million possible
return leg payments.
The filters on the characteristics of the send leg and return leg (filters 1, 2a and 2b) reduce
this to 2.3 million possible send legs and 4.6 million possible return legs.23
The filters on characteristics of the transaction pair (i.e., filter 3) further reduces our focus
down to 131 thousand pre-tiebreaker candidate send-return pairs.
One particularly important filter requires that the implied interest rate of the loan is
denominated in whole basis points. This filter accounts for the largest portion of the reduction in
potential pre-tiebreaker matches. If we execute the algorithm without this filter, instead of having 131
thousand pairs of payments before our tiebreaker is applied, we would have over 15 million.
After applying filter 3, some send legs are matched to multiple returns and some returns are
matched to multiple sends, as is possible in a many-to-many match. We consider several alternative
tiebreaking rules to produce the final output of interbank loans. Our preferred rule breaks ties by
selecting the matched pair with the shortest maturity. This generates an output of 51 thousand
inferred loans, 64% of which were initially uniquely matched to each other. Another 15% of these
inferred loans were initially part of what we call a “redundant multiple match.’’ In such a match there
are multiple send legs and/or return legs matched to one another, but all the tied legs are on same
dates and in the same amounts. The resulting inferred interbank loan will have the same maturity,
size, and interest rate no matter how such a tie is resolved. For the remaining 21% of the inferred
23 A negligible portion of this reduction is accounted for by the removal of overnight interbank loans from the set of candidate payments (filter 1).

24
loans, the way in which we resolved the tie had a material effect on the resulting loan characteristics.
Table 5 shows a decomposition of the resulting match types.
We consider four tiebreaking rules: (1) resolving ties by choosing the send-return pair with
the shortest implied maturity (our preferred approach), (2) resolving ties by choosing the pair with
the closest implied interest rate to the corresponding-maturity Libor rate, (3) resolving ties randomly,
and (4) keeping only those pairs which are uniquely matched.
Table 6 compares the characteristics of the final sample for each of these tiebreaking
procedures. The four approaches yield similar results for the average value per loan, the inter-quartile
range of the spread to Libor (using the inferred loan’s implied interest rate), average maturity, and the
percentage of unusual maturity (i.e. 12-day, etc.) loans. This is because nearly 80% of our final
sample came from either a unique match, or a redundant multiple match where the characteristics of
the final inferred loan do not depend on the tiebreaker. The unique-only tiebreaker is the most
different from the others, with roughly two-thirds the number of loans found using the other methods.
We adopt the shortest maturity tiebreaker for the remainder of the paper, which is the most
conservative regarding the number and maturity of the longer term loans we identify.
5.2 Tests of Type I and Type II statistical errors
Our first test of the incidence of “false positives” is to examine the distribution of implied interest
rates. If the algorithm’s results represent actual term loans made or intermediated by banks, we would
expect to observe a tight distribution of loan rates around Libor in the pre-crisis period. If the
algorithm is noisy, and primarily identifies pairs of unrelated payments, one would expect to observe
a roughly uniform distribution of loan interest rates, since nothing about the design of our algorithm
biases it towards finding trades close to the Libor fixing rate (recall that the default tiebreaker is to
select the shortest-maturity loan).
The histogram of inferred one-month and three-month loan rates during this pre-crisis period
is presented in Figure 6. There is indeed a tightly bunched distribution of loan rates around Libor,
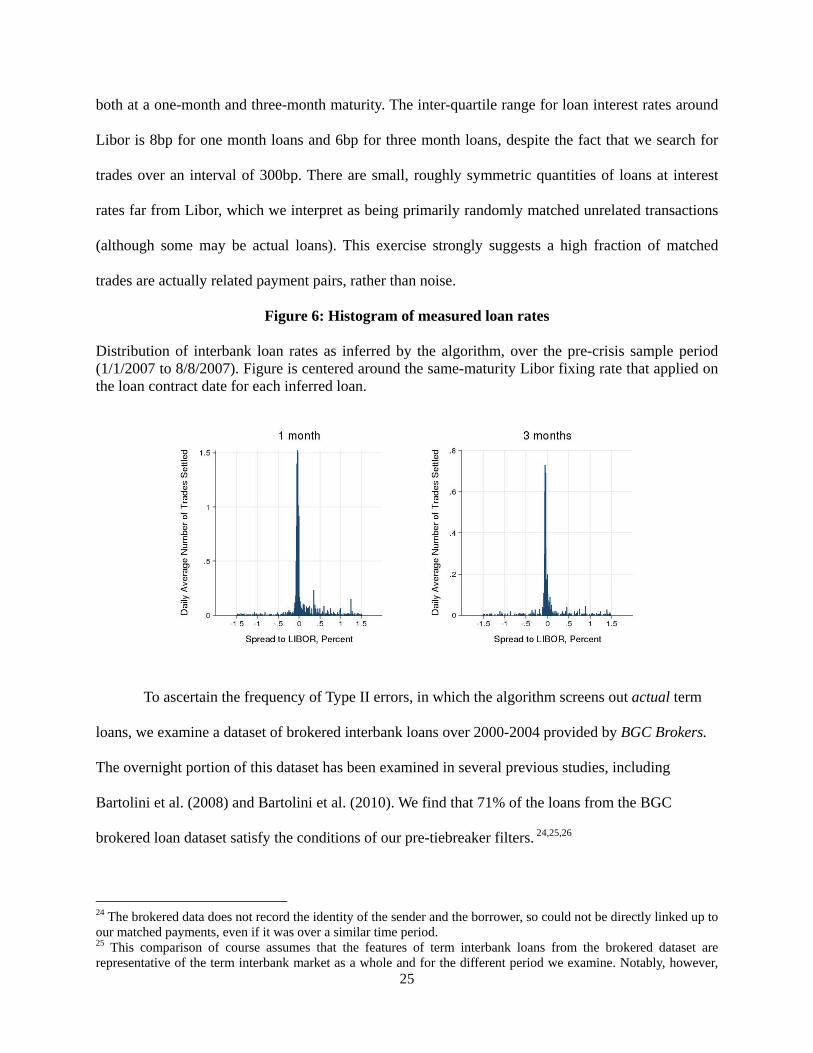
25
both at a one-month and three-month maturity. The inter-quartile range for loan interest rates around
Libor is 8bp for one month loans and 6bp for three month loans, despite the fact that we search for
trades over an interval of 300bp. There are small, roughly symmetric quantities of loans at interest
rates far from Libor, which we interpret as being primarily randomly matched unrelated transactions
(although some may be actual loans). This exercise strongly suggests a high fraction of matched
trades are actually related payment pairs, rather than noise.
Figure 6: Histogram of measured loan rates Distribution of interbank loan rates as inferred by the algorithm, over the pre-crisis sample period (1/1/2007 to 8/8/2007). Figure is centered around the same-maturity Libor fixing rate that applied on the loan contract date for each inferred loan.
To ascertain the frequency of Type II errors, in which the algorithm screens out actual term
loans, we examine a dataset of brokered interbank loans over 2000-2004 provided by BGC Brokers.
The overnight portion of this dataset has been examined in several previous studies, including
Bartolini et al. (2008) and Bartolini et al. (2010). We find that 71% of the loans from the BGC
brokered loan dataset satisfy the conditions of our pre-tiebreaker filters. 24,25,26
24 The brokered data does not record the identity of the sender and the borrower, so could not be directly linked up to our matched payments, even if it was over a similar time period. 25 This comparison of course assumes that the features of term interbank loans from the brokered dataset are representative of the term interbank market as a whole and for the different period we examine. Notably, however,

26
Putting this in perspective, these filters are restrictive enough to reduce hundreds of millions
of send and return legs to just 131 thousand pre-tiebreaker matches, but are permissive enough that a
large majority of a sample of actual interbank loans satisfy them. For this reason, we view this set of
filters as providing a reasonable balance between Type I and Type II statistical misclassifications.
5.4. What types of transactions are identified by the algorithm?
The evidence above suggests only a small fraction of the matched payment pairs represent random
statistical noise. The rest represent round-trip transactions between the proximate counterparties
identified in the Fedwire Funds Service. However, two (non-mutually-exclusive) cases are
considered, in which these round-trip transactions would constitute something other than unsecured
term loans between those counterparties. First, the payment pair may reflects a different type of
lending transaction, such as a repurchase agreement (repo) or secured term loan. Second, the sender
(recipient) identified in the Fedwire Funds Service may not be the ultimate provider (beneficiary) of
funds, but instead is acting as a correspondent or agent for another party.
5.4.1 Potential transaction types
Table 7 lists a range of common short-term secured and unsecured funding instruments used by US
financial institutions. Below we consider whether these instruments are likely to be settled over the
Fedwire Funds Service, and/or to be identified by our algorithm as an interbank loan.
Interbank loans settled over CHIPS and book transfers. CHIPS is an alternative
electronic payment system for large US dollar transactions. A significant volume of interbank loans
are settled over CHIPS. Others may also be settled directly by a book transfer, in cases where the
depositor and borrower have accounts at a common institution. Since our algorithm identifies only
key features of the brokered data corroborate independent reports received by us that term loans primarily occur at whole basis point interest rates and in “round lot” payments. 26 The percentage of brokered trades that survive is not a direct estimate of the final Type II error rate, because the tiebreaking step could potentially have a substantive impact on this rate. Tiebreaking methods which are less likely to select the correct pairing out of a non-redundant many-to-many match will deliver inferior Type II error rates relative to the brokered data rates we report. Assessing the exact Type II error rate is difficult and attempts to do so for the standard overnight Furfine algorithm have not been successful to this point.

27
Fedwire-settled transactions, volumes estimated by the algorithm represent only a subset of the total
dollar-denominated interbank market. This is an unavoidable limitation of our approach. Future
research could, however, apply our approach to other payment systems.
Money market instruments. It is possible that part of the algorithm’s output reflects the
issuance, sale and/or maturing of other money market instruments such as certificates of deposit
(CDs), commercial paper (CP), and short-term government securities (T-bills). CP and T-bills are
issued on a discount basis, implying that the initial sending leg is likely to be slightly less than a
round amount (e.g. $99.98m). Such transactions would be discarded by our algorithm, which requires
the sending leg to be a round number.27
A further consideration is that DTC (2002) and BIS (2003) note that the cash and securities
leg of the sale of these securities is normally settled on a delivery-versus-payment (DVP) basis
through a securities settlement system, such as the DTC (a subsidiary of the Depository Trust and
Clearing Corporation, DTCC), or the Fedwire® Securities Services.28 While operated by the Federal
Reserve, the Fedwire Securities Services are entirely separate from the Fedwire Funds Service data
used as the basis for our algorithm. As a precaution, we exclude from the final set of payment pairs
any payments to or from a settlement institution, including the DTC, CLS or CHIPS, or those
involving the US government, or the Federal Reserve System. We also exclude inferred loans that
involve an international agency or foreign central bank.
Despite these considerations, to our knowledge we are unable to entirely rule out the
possibility that a CD issued by a bank may be identified by the algorithm. A large CD is a wholesale
27 Commercial paper data used in Acharya, Schnabl and Suarez (2011) confirms this convention for CP transactions. (Thanks to Philipp Schnabl for confirming this stylized fact). 28 In this case, the clearing and settlement platform undertakes both the transfer of securities, through its role as a custodian, and the transfer of funds on a book-entry basis between accounts held by members of the system (hence the term “delivery versus payment”). Fedwire Securities Service provides these services for a subset of security types, including marketable US Treasury securities, securities issued by government agencies and GSEs, and securities issued by certain international organizations.

28
funding instrument similar in economic substance to a term interbank loan, with the distinction that it
has secondary market liquidity.
Repurchase agreements. Repos are short-term secured loans collateralized by Treasury or
agency securities, corporate bonds, equities or other securities. While many repos have an overnight
maturity, some are for longer terms, and many are “open,” in the sense that they roll over
automatically unless one party explicitly chooses to cancel the transaction.
An important segment of the repo market is the “tri-party” repo market, in which a clearing
bank provides intermediation services to the cash investor and collateral provider.29 Settlement of tri-
party repo transactions themselves occurs on the books of the relevant tri-party clearing bank, and
thus would not be expected to be settled over the Fedwire Funds Service. As a precaution, however,
we exclude inferred loans from State Street to either JP Morgan Chase or the Bank of New York.
State Street is a large custodian for money market mutual funds that lend in the tri-party market, and
JP Morgan Chase and Bank of New York are the two clearing banks for tri-party repo.
In bilateral repo markets, funds and collateral are swapped directly between two
counterparties, and settlement of these transactions normally occurs on a DVP basis via a securities
settlement system such as the DTC or the Fedwire Securities Service.
Related party transactions. Some payments in the Fedwire Funds Service are likely to
reflect non-market transactions between related parties, such as subsidiaries of the same parent
holding company. To screen out such transactions, we exclude transactions between institutions with
the same lead ABA or regulatory high-holder.
Correspondent transactions. A final possibility is that our algorithm identifies transactions
where the sending (receiving) institution is acting as a correspondent on behalf of the financial
provider (beneficiary) of funds. In some cases, the ultimate counterparty may be a related party of the
correspondent bank that is not a Fedwire member (e.g. a nonbank or non-US subsidiary). In other
29 See Copeland, Martin and Walker (2010) for a detailed analysis of this market.

29
cases it may be an unrelated third party. Our interpretation is that our matched dataset is likely to
include a nontrivial quantity of correspondent loans.30 We speculate that correspondent activity is
likely to be larger in cases where the sender or receiver are large firms, or are US branches or
subsidiaries of foreign banking institutions. The presence of correspondent transactions may be
beneficial for research that seeks to measure overall interbank activity. However, it is likely to be of
greater concern if the research strategy relies on correctly identifying the identity of the ultimate
counterparties to the trade.
5.4.2 The distribution of implied interest rates
The algorithm’s filters and differences in settlement convention both serve to restrict the algorithm to
identify only unsecured interbank loans and possibly CDs. However, as a further robustness measure,
we return to the distribution of implied interest rates shown in Figure 5. Our prior is that, prior to the
peak of the financial crisis, unsecured transactions should be centered close to Libor, since it is the
most widely-used measure of term interbank borrowing costs. Alternatively, if the algorithm instead
identifies secured transactions, we should observe a distribution of implied interest rates centered on
repo rates.31
As we saw in Figure 5, prior to the peak of the financial crisis the distribution of interest rates
is unimodal and centered near the Libor fixing rate, and notably, does not exhibit volume spikes at
repo rates or the OIS rate. This is particularly clear in the early part of the crisis, when inferred
interbank rates are more dispersed, allowing their relation to different index rates to be distinguished
more easily. Moreover, during each of the four sub-periods shown in this histogram, the set of
secured interest rates lie in a band whose upper limit reaches only ever as high as the center of the
distribution of transaction interest rates. The plot is consistent with our earlier argument that repo
30 See Armantier and Copeland (2013) for a discussion of correspondent loans for inferred overnight loans settled over the Fedwire Funds Service. 31 Some market observers have argued that Libor survey responses may have understated actual unsecured cost of funds at particular times during the financial crisis. For a discussion of this issue which makes use of the algorithm described here as well as other data sources, see Kuo, Skeie and Vickery (2012).

30
agreements or other types of secured loans would be expected to settle on other payment systems or
through excluded tri-party repo players. Secured loans would also be at lower interest rates, a
prediction borne out by Figure 5. We believe that we cannot rule out, however, that non-interbank
unsecured transactions, such as CDs, are present in our data.
5.5 Term lending in the BGC Brokers dataset
As a final test, we compute the maturity-weighted fraction of term issuance in the BGC Brokers
dataset described above. Although this dataset relates to a different time period (2000-2004), and
represents a selected sample since it only includes brokered loans, our interest is in seeing whether
there is a significant volume of term interbank activity, consistent with what we find using the
algorithm. In fact, computed on a maturity-weighted basis, 68% of the aggregate volume of loan
originations in the BGC Brokers data are term loans, which is even higher than the 35% of term
activity identified by the algorithm over the 2007-2009 sample period. More than half of this BGC
Brokers maturity-weighted issuance is for a maturity of at least one month. (More detailed statistics
available upon request). Consistent with our algorithm, this stylized fact independently suggests that,
at least historically, term lending has been a significant part of the overall interbank market, in terms
of outstanding volume. (The number of loan observations is comparatively small, however, because
each loan is rolled over less frequently).
5.6 Summary
Our overall interpretation from these specification tests is that the algorithm strikes a reasonable
balance between type I and type II errors, and that the results of the algorithm represent a new and
useful source of information about interbank loan market activity. We emphasize, however, that the
results of the algorithm reflect noisy inferences, not direct loan records. Consequently, caution should
be exercised when analyzing these inferences. It seems like good empirical practice for researchers
making use of this or other Furfine-type algorithms to attempt to corroborate results against other
data sources where possible, as we do in this paper, and to conduct robustness checks on subsets of

31
the sample that may be less likely to be subject to inference problems, such as inferred loans
originated by GSEs or by small banks.
6. Conclusions
Despite the importance of the interbank market, little data is available to measure and analyze
unsecured term dollar interbank lending activity. This paper develops a new methodology, building
on Furfine (1999), to infer the size, interest rate, date and maturity of term interbank loans at the
transaction level by identifying the lending and repayment of interbank loans settled on the Fedwire
Funds Service both before and during the 2007-09 financial crisis.
We use the results of the algorithm to study how the maturity structure of dollar interbank
lending responds to market stress. We find a sharp drop in term interbank lending volume, and a
shortening of interbank loan maturity, around the bankruptcy of Lehman Brothers. More generally,
the maturity of interbank lending decreases with several public measures of debt market stress.
Periods of stress are also associated with a rise in transaction interest rates, and a large increase in the
cross-sectional dispersion of interest rates. The implication of this finding is that market reference
rates such as Libor or NYFR become increasingly unreliable as a measure of the cost of funds for
any individual bank during periods of stress. We find no evidence, however, of a complete freeze in
the term interbank market, even at the crisis peak, and term volume and maturity improved relatively
quickly after the Lehman failure.
We also conduct a range of diagnostic tests of the errors and signal-to-noise ratio associated
with the algorithm. These exercises suggest that our approach provides a useful source of
information about the term interbank market, allowing for a number of research applications. For
example, we show that the distribution of implied loan interest rates is very tightly bunched around
the Libor fixing rate prior to the onset of the financial crisis, suggesting that the algorithm’s
inferences contain few payment pairs matched together purely by statistical chance. Conversely,
32
more than 70 percent of actual term loans from an interbank broker dataset satisfy the algorithm’s
filters imposed by the algorithm. While we view the diagnostic checks in this paper as encouraging,
we also note that, as with the original overnight matching algorithm of Furfine (1999), caution should
still be exercised given that the results of the algorithm reflect inferences about underlying loans, not
direct data. While we believe our analysis represents a useful step forward, improving access to
direct loan-level data on US interbank loans and other money market instruments remains an
important topic for future research and policy analysis.
33
References
Acharya, Viral, Philipp Schnabl and Gustavo Suarez (2011) “Securitization without Risk Transfer,” Journal of Financial Economics, forthcoming. Acharya, Viral and David Skeie (2011). “A Model of Liquidity Hoarding and Term Premia in Inter-Bank Markets,” Journal of Monetary Economics 58(5), 436 – 447. Afonso, Gara, Anna Kovner and Antoinette Schoar (2011). “Stressed, Not Frozen: The Federal Funds Market in the Financial Crisis,” Journal of Finance 66(4), 1109–1139. Akram, Farooq and Casper Christophersen (2010). “Interbank Overnight Interest Rates – Gains from Systemic Importance,” working paper. Angelini, Paolo, Andrea Nobili and Cristina Picillo (2009). “The Interbank Market After August 2007: What Has Changed, and Why?” Temi Di Discussione (Economic Working Papers) 731. Arciero, Luca, Ronald Heijmans, Richard Heuver, Marco Massarenti, Cristina Picillo and Francesco Vacirca (2013). “How To Measure the Unsecured Money Market? The Eurosystem’s Implementation and Validation Using TARGET2 Data,” working paper. Armantier, Olivier and Adam Copeland (2012). “Assessing the Quality of “Furfine-based” Algorithms,” Federal Reserve Bank of New York Staff Report No. 575, October 2012. Ashcraft, Adam and Hoyt Bleakley (2006). “On the Market Discipline of Informationally Opaque Firms: Evidence from Bank Borrowers in the Federal Funds Market,” Federal Reserve Bank of New York Staff Reports, No. 257. Ashcraft, Adam and Darrell Duffie (2007). “Systemic Illiquidity in the Federal Funds Market,” American Economic Review 97(2), 221-225. Ashcraft, Adam, James McAndrews and David Skeie (2011). “Precautionary Reserves and the Interbank Market,” Journal of Money, Credit, and Banking 43(7, Suppl.), 311 – 348. Bartolini, Leonardo, Spence Hilton and Alessandro Prati (2008). “Money Market Integration,” Journal of Money, Credit, and Banking 40(1), 193-213. Bartolini, Leonardo, Spence Hilton and James McAndrews (2010). “Settlement Delays in the Money Market,” Journal of Banking & Finance 34(5), 934-945. Bartolini, Leonardo, Svenja Gudell, Spence Hilton and Krista Schwarz (2005). “Intraday Trading in the Overnight Federal Funds Market,” Federal Reserve Bank of New York Current Issues in Economics and Finance 11(11).

34
Bech, Morten L. and Enghin Atalay (2010). “The Topology of the Federal Funds Market,” Physica A: Statistical Mechanics and Its Applications, 389(22): 5223-46. Bech, Morten L. and Elizabeth Klee (2011). “The Mechanics of a Graceful Exit: Interest on Reserves and Segmentation in the Federal Funds Market,” Journal of Monetary Economics 58(5), 415-431. The Depository Trust Company (2002). “Response to the Disclosure Framework for Securities Settlement Systems”, BIS Committee on Payment and Settlement Systems”. June. Bank for International Settlements (2003). “Payment Systems in the United States”, in Payment and Settlement Systems in Selected Countries, BIS Committee on Payment and Settlement Systems Publications No 53, April. Brunnermeier, Markus, and Martin Oehmke (2013). “The Maturity Rat Race” Journal of Finance 68(2), 483-581. Copeland, Adam, Antoine Martin and Michael Walker (2010). “The Tri-Party Repo Market before the 2010 Reforms,” Federal Reserve Bank of New York Staff Report No. 477. Craig, Ben and Goetz von Peter (2010). “Interbank Tiering and Money Center Banks,” BIS Working Papers No. 322. Demiralp, Selva, Brian Preslopsky and William Whitesell (2006). “Overnight Interbank Loan Markets,” Journal of Economics and Business 58(1), 67–83. Duffie, Darrell, David Skeie and James Vickery (2013). “A Sampling-Window Approach to Transactions-Based Libor Fixing”, Federal Reserve Bank of New York Staff Report No. 596. Furfine, Craig (1999). “The Microstructure of the Federal Funds Market,” Financial Markets, Institutions & Instruments 8, 24-44. Furfine, Craig (2001). “Banks Monitoring Banks: Evidence From the Overnight Federal Funds Market.” Journal of Business 74(1): 33-58. Goldberg, Linda, Craig Kennedy and Jason Miu (2011). “Central Bank Dollar Swap Lines and Overseas Dollar Funding Costs,” Federal Reserve Bank of New York Economic Policy Review, May 2011 Gyntelberg, Jacob and Philip Wooldridge (2008). “Interbank Rate Fixings During the Recent Turmoil,” BIS Quarterly Review. Heijmans, Ronald, Richard Heuver and Daniëlle Walraven (2010). “Monitoring the unsecured interbank money market using TARGET2 data,” DNB Working Papers, No 276.
35
H.M. Treasury (2012). “The Wheatley Review of Libor: Final Report,” H.M. Treasury, London, September, 2012. Keister, Todd and James McAndrews (2009). “Why are Banks Holding So Many Excess Reserves?” Federal Reserve Bank of New York Staff Reports No. 380. Kovner, Anna and David Skeie (2013). “Evaluating the Quality of Fed Funds Lending Estimates Produced from Fedwire Payments Data,” Federal Reserve Bank of New York Staff Report No. 629. Kuo, Dennis, David Skeie and James Vickery (2012), “A Comparison of Libor to Other Measures of Bank Borrowing Costs,” work in progress, Federal Reserve Bank of New York. Liedorp, F.R., L. Medema, M. Koetter, R.H. Koning and I. van Lelyveld (2010). “Peer Monitoring or Contagion? Interbank Market Exposure and Bank Risk,” DNB working paper No. 248. Michaud, François-Louis and Christian Upper (2009), “What Drives Interbank Rates? Evidence From the Libor Panel,” BIS Quarterly Review. Schwarz, Krista (2009). “Mind the Gap: Disentangling Credit and Liquidity in Risk Spreads,” working paper. Snider, Connan and Thomas Youle (2013). “The Fix Is In: Detecting Portfolio Driven Manipulation of the Libor”, working paper. Stigum, Marcia and Anthony Crescenzi (2007). Stigum’s Money Market. New York: McGraw-Hill. Wetherilt, A., K. Soramäki and P. Zimmerman (2009). “The Sterling Unsecured Loan Market During 2006–2008: Insights from Network Topology,” Bank of England Working Paper No. 398.

36
Tables
Table 1: Characteristics of Fedwire settled term interbank loans
Pre-crisis Early crisis Crisis peak Crisis easing
Dates1/1/2007 to 3/31/2009
Prior to 8/9/07
8/9/07 to 9/12/08
9/15/08 to 11/11/08
11/12/08 onwards
Number of trading days 564 153 276 40 95
Number of observations 51087 14755 25382 3263 7687
Loan maturity Average 33.9 35.3 34.4 32.3 30.5 25th percentile 6.0 7.0 6.0 5.0 5.0 Median 10.0 11.0 10.0 9.0 8.0 75th percentile 29.0 29.0 30.0 25.0 24.0
Loan size (Millions $) Average 123.7 96.0 124.9 123.9 172.8 25th percentile 17.0 15.0 18.7 15.0 19.9 Median 40.0 35.0 40.5 31.0 40.0 75th percentile 100.0 100.0 100.0 100.0 110.0
Interest rate spread, relative to OIS One month loans: Mean 0.511 0.130 0.553 2.087 0.653 Standard deviation 0.632 0.375 0.436 0.833 0.639 Interquartile range 0.692 0.084 0.461 1.119 0.954 Three month loans: Mean 0.611 0.099 0.672 2.382 1.109 Standard deviation 0.683 0.388 0.464 0.869 0.731 Interquartile range 0.804 0.072 0.379 1.197 1.086
Interest rate spread, relative to Libor One month loans: Mean 0.051 0.067 0.046 0.000 0.053 Standard deviation 0.419 0.375 0.394 0.648 0.515 Interquartile range 0.235 0.080 0.266 0.771 0.476 Three month loans: Mean -0.017 0.015 -0.019 0.041 -0.105 Standard deviation 0.454 0.388 0.433 0.627 0.610 Interquartile range 0.159 0.060 0.184 0.771 0.618
Number of observations by receiver type: Domestic-owned bank 38415 11438 18905 2402 5670 Foreign bank 12144 3237 6133 834 1940 GSE 100 22 77 0 1
Other 428 58 267 27 76
Summary statistics apply to inferred loans with maturity between two days and one year that meet the filters described in the text. Statistics are unweighted unless otherwise indicated. Sample period 1/2/2007 to 3/31/2009.
Full sampleTime Period

37
Table 2. Maturity composition of Fedwire-settled interbank loans
Pre-crisis Early crisis Crisis peak Crisis easing
Dates1/1/2007 to 3/31/2009
Prior to 8/9/07
8/9/07 to 9/12/08
9/15/08 to 11/11/08
11/12/08 onwards
Number of trading days 564 153 276 40 95
Issuance by maturity (Billions $) Overnight 300.4 278.5 330.3 301.9 248.1 Term < 1 month 48.3 41.5 49.2 48.4 56.7 Term, one month or more 99.4 110.5 111.8 55.5 64.1 Total 448.2 430.6 491.4 405.7 368.9
Maturity of New Issuance 32.9 38.1 32.4 23.5 29.5
Issuance by maturity (%) Overnight 67.0% 64.7% 67.2% 74.4% 67.2% 2-7 days 3.8% 3.7% 3.5% 3.6% 5.3% 8-14 days 2.9% 2.6% 2.7% 3.4% 3.7% > 14 days but < 1 month 4.1% 3.3% 3.8% 5.0% 6.4% One month 4.7% 4.7% 5.3% 2.3% 3.7% Two months 1.8% 2.0% 1.8% 1.1% 1.7% Three months 5.4% 7.1% 5.6% 2.0% 3.1% 4-5 months 2.7% 3.4% 2.7% 2.6% 1.5% 6 months 2.6% 2.7% 2.8% 2.1% 1.8% 7-11 months 3.6% 3.9% 3.3% 2.9% 4.1% One year 1.4% 1.9% 1.2% 0.7% 1.4%
Issuance by receiver type (Billions $) Domestic-owned bank 350.4 341.7 389.1 302.9 271.8 Foreign bank 95.8 88.1 99.8 100.1 94.4 GSE 0.3 0.2 0.2 0.3 0.3 Other 1.7 0.5 2.2 2.3 2.2
Table includes both overnight and term loans. Table is based on maturity-weighted issuance volume, calculated for each maturity as loan amount x maturity in trading days. Sample period is 1/1/2007 to 3/31/2009.
Full sample Time Period

38
Table 3. Loan volume and maturity results
A. Dependent variable: fraction term
BBB - AAA bond yields -0.0192*** -0.129***
(0.00520) (0.0415)
BBB - AAA bond yields2
0.0277***
(0.0101)
Libor-OIS Spread -0.0307*** -0.0619***
(0.00693) (0.0182)
Libor-OIS Spread2
0.0123**
(0.00597)
CD-OIS Spread -0.0297*** -0.0529***
(0.00626) (0.0160)
CD-OIS Spread2
0.00801*
(0.00479)
N 532 532 532 532 532 532
R2
0.043 0.063 0.073 0.061 0.071 0.079
B. Dependent variable: weighted average maturity
BBB - AAA bond yields -6.168*** -35.41***
(1.078) (6.943)
BBB - AAA bond yields2
7.394***
(1.648)
Libor-OIS Spread -6.525*** -16.94***
(1.439) (3.107)
Libor-OIS Spread2
4.118***
(1.020)
CD-OIS Spread -5.793*** -15.06***
(1.238) (2.775)
CD-OIS Spread2
3.211***
(0.822)
N 532 532 532 532 532 532
R2
0.072 0.060 0.063 0.104 0.083 0.085
Regressions of loan volume and maturity structure on stress variables for whole sample and different classes of receivers. All regressions include a constant and end of year dummies for two weeks prior to, and two weeks after the end of 2007 and 2008.
Baseline Include quadratic terms
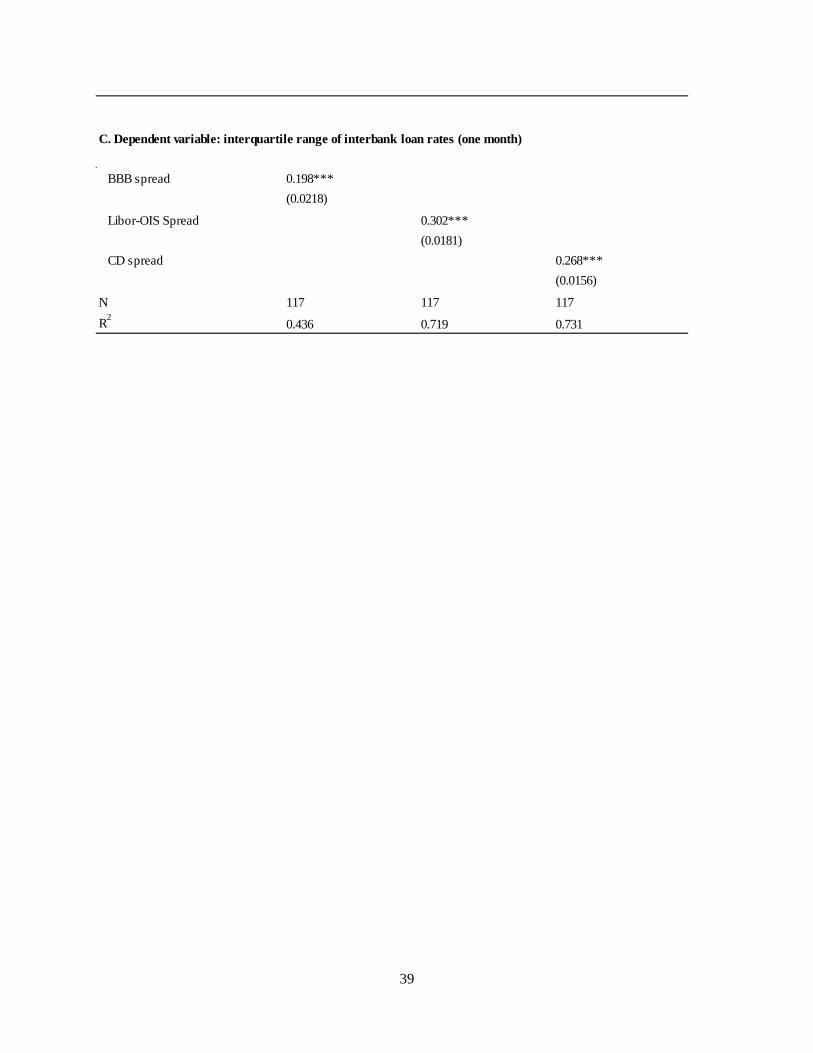
39
BBB spread 0.198***
(0.0218)
Libor-OIS Spread 0.302***
(0.0181)
CD spread 0.268***
(0.0156)
N 117 117 117
R2
0.436 0.719 0.731
C. Dependent variable: interquartile range of interbank loan rates (one month)

Table 4. Loan volume and maturity results by borrower type
A. Determinants of fraction of term loans
BBB - AAA bond yields -0.0182*** -0.0101 -0.0142(0.00695) (0.00828) (0.0215)
Libor-OIS Spread -0.0373*** 0.00325 -0.0328(0.00727) (0.0105) (0.0369)
CD-OIS Spread -0.0357*** -8.43e-05 -0.0295(0.00655) (0.00963) (0.0327)
N 532 532 532 532 532 532 297 297 297
R2
0.039 0.074 0.086 0.044 0.041 0.040 0.086 0.090 0.090F-test: Domestic = other [p-val] 0.5918 0.0450 0.0321
B. Dependent variable: weighted average maturity
BBB - AAA bond yields -7.018*** -1.306 -1.055**(1.359) (0.835) (0.505)
Libor-OIS Spread -7.640*** -0.815 -1.374**(1.783) (0.944) (0.674)
CD-OIS Spread -6.720*** -0.964 -1.264**(1.525) (0.776) (0.552)
N 532 532 532 532 532 532 532 532 532
R2
0.066 0.058 0.059 0.013 0.010 0.011 0.056 0.057 0.057F-test: Domestic = other [p-val] 0.0001 0.0003 0.0002
Payment receiver typeDomestic bank or BHC Foreign bank Nonbank
Regressions of loan volume and maturity structure on stress variables for whole sample and different classes of receivers. All regressions include a constant and end of year dummies for two weeks prior to, and after the end of years 2007 and 2008.
Payment receiver typeDomestic bank or BHC Foreign bank Nonbank

Table 5: The Initial Match
Total
Same-day and same-amount
Same-day but not same-amount
Not same day and not same amount
32,629 6,616 0 5,044 44,289
Same-day and same-amount
133 776 0 165 1,074
Same-day but not same-amount
81 398 0 132 611
Not same day and not same amount
1,069 2,289 0 1,755 5,113
33,912 10,079 0 7,096 51,087
Summary statistics apply to inferred loans with maturity between two days and one year that meet the filters described in the text. Statistics are unweighted unless otherwise indicated. Sample period 1/2/2007 to 3/31/2009.
Send leg matched to Unique Return leg
Multiple Return Legs
Total
Multiple Send LegsUnique Send
Leg
Return Leg Matched To:
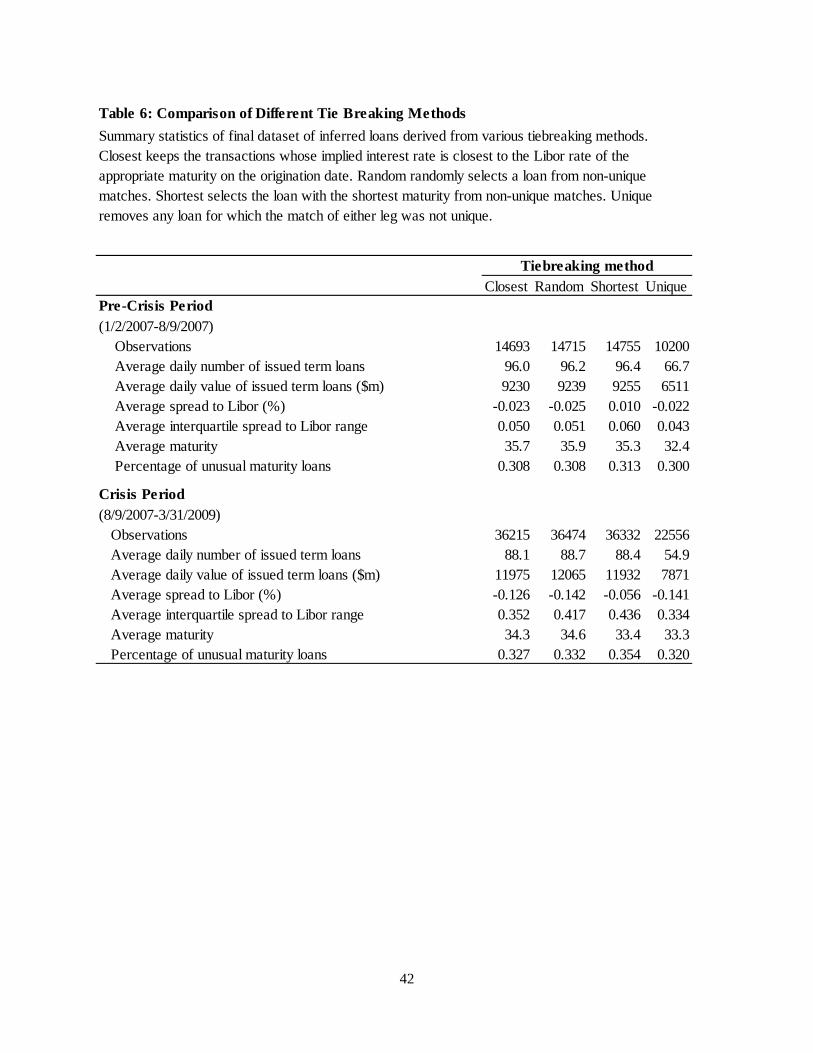
42
Table 6: Comparison of Different Tie Breaking Methods
Closest Random Shortest UniquePre-Crisis Period(1/2/2007-8/9/2007) Observations 14693 14715 14755 10200 Average daily number of issued term loans 96.0 96.2 96.4 66.7 Average daily value of issued term loans ($m) 9230 9239 9255 6511 Average spread to Libor (%) -0.023 -0.025 0.010 -0.022 Average interquartile spread to Libor range 0.050 0.051 0.060 0.043 Average maturity 35.7 35.9 35.3 32.4 Percentage of unusual maturity loans 0.308 0.308 0.313 0.300
Crisis Period(8/9/2007-3/31/2009) Observations 36215 36474 36332 22556 Average daily number of issued term loans 88.1 88.7 88.4 54.9 Average daily value of issued term loans ($m) 11975 12065 11932 7871 Average spread to Libor (%) -0.126 -0.142 -0.056 -0.141 Average interquartile spread to Libor range 0.352 0.417 0.436 0.334 Average maturity 34.3 34.6 33.4 33.3 Percentage of unusual maturity loans 0.327 0.332 0.354 0.320
Tiebreaking method
Summary statistics of final dataset of inferred loans derived from various tiebreaking methods. Closest keeps the transactions whose implied interest rate is closest to the Libor rate of the appropriate maturity on the origination date. Random randomly selects a loan from non-unique matches. Shortest selects the loan with the shortest maturity from non-unique matches. Unique removes any loan for which the match of either leg was not unique.

43
Table 7: Short-term Secured and Unsecured Funding Instruments
List of funding instruments along with their settlement method, instrument pricing on delivery/return, and whether or not they are included in the ouput of our algorithm. Instrument Settlement
method Instrument Pricing on Delivery/Return
In our results?
Evidence
Term federal funds Fedwire Funds
face value/face value plus interest
Yes Stigum's Money Market
Eurofeds Fedwire Funds
face value/face value plus interest
Yes Stigum's Money Market
CHIPS-settled Eurodollars CHIPS face value/face value plus interest
No Stigum's Money Market and different settlement system
Certificate of Deposit (CD) DTC face value/face value plus interest
Unlikely Different settlement system
Commercial paper DTC discounted face value/face value
No Different pricing convention and different settlement system
Treasuries and Agencies Fedwire Securities
discounted face value/face value
No Different pricing convention and different settlement system
Triparty repo JPMC and BoNY, Fedwire Securities, DTC
face value/face value plus interest
Unlikely No associated peak in our results; triparty transactions settle on books of clearing banks
Non triparty repo DTC, Fedwire Securities
face value/face value plus interest
Unlikely No associated peak in our results, likely different settlement system
Related-party transactions Various Various Unlikely We drop transaction pairs within the same lead ABA or same holding company

Technical Appendix: Algorithm filters
This technical appendix describes in more detail the filters we apply in order to construct the dataset of inferred term loans made or intermediated by banks. We begin with a record of all payments passing over the Fedwire Funds Service. Fedwire is a large-value, real-time gross settlement system in the United States that is used by around seven thousand financial institutions, Federal Reserve Banks, and government agencies to send and receive US dollar payments of funds. The sender of the payment initiates the transaction, which is final and irrevocable.32 The fields from the transaction journal that were used in this project are as follows:
1. Transfer amount 2. Business day 3. Sender ABA (Routing Transit) number 4. Receiver ABA (Routing Transit) number 5. Transaction ID: This is an ID assigned by the Money and Payments Studies Function that is
unique to each transaction within the same business day Filter 1: No overnight loans. We do not consider any Fedwire payments that are part of an overnight loan. We define overnight loans as those identified by the FRB-NY version of the Furfine algorithm (developed in Furfine 1999, and used or refined in numerous subsequent research papers) but subject to additional counterparty filters consistent with Filters 2a and 2b below. In particular, these additional filters consist of:
Neither counterparty is a settlement institution: CLS, CHIPS, or DTC Not lent by State Street to borrowers J.P. Morgan Chase (JPMC) or Bank of New York
(BoNY). These three entities are identified at the lead ABA level. Neither counterparty is the Federal Reserve, US government (we keep GSEs), an
international agency, or a foreign central bank Both counterparties are not member entities of the same lead ABA or regulatory high holder
Filter 2a: Sending legs. Each potential sending leg must satisfy the following criteria:
Greater than or equal to $10m In whole multiples of $100,000. Not to or from a settlement institution: CLS, CHIPS, or DTC Not sent from State Street to J.P. Morgan Chase (JPMC) or Bank of New York (BoNY).
These three entities are identified at the lead ABA level. Not sent or received by the Federal Reserve, US government (we keep GSEs), international
agency, or foreign central bank Not sent and received by member entities of the same lead ABA or regulatory high holder
e.g. Payment of $65m from bank A to bank B on July 7, 2008. Filter 2b: Return legs. Each potential return leg must satisfy the following criteria:
Greater than $10m
32The Fedwire Funds Service is owned and operated by the Federal Reserve System. The Federal Reserve Wholesale Product Office keeps daily journals of all transactions that pass over the Fedwire Funds Service. In the first quarter of 2007, there was an average of 535 thousand transactions per day, making up a daily average of $2.44 trillion in interbank payments.

45
NOT in round multiples of $1,000 or more Not to or from a settlement institution: CLS, CHIPS, or DTC Not sent by either JPMC or BoNY to State Street. These three entities are identified at the
lead ABA level. Not sent or received by the Federal Reserve, US government (we keep GSEs), international
agency, or foreign central bank Not sent to and received by member entities of the same lead ABA or regulatory top holder
e.g. Payment of $65,170,155.56 from bank B to bank A on Aug 7, 2008. Note that we omit transactions between State Street and either J.P. Morgan Chase (JPMC) or the Bank of New York (BoNY) in which State Street is the implied lender of funds. We do this because it may be possible that such transactions are part of a tri-party repurchase agreement where State Street is acting on behalf of a money market fund or another institutional investor. (State Street provides services for many money market and institutional funds that invest heavily in tri-party repo agreements serviced by the clearing banks JPMC and BoNY. Our understanding is that funds to and from State Street to the clearing banks are often settled over Fedwire Funds Service.) We then match together sending and return legs that satisfy these filters, as long as the payment pair satisfies the properties described below. Filter 3: Matched payment pairs. Payment pairs are retained if the sending and return legs satisfy the filters described above, and the maturity and imputed interest rate of the loan implied by the payment pair satisfy the criteria described below. Allowable maturities:
2 – 29 days 4, 13, 26, 52 weeks: following business day rule for maturity date 1-12 months: modified following business day rule for maturity date.33 For 1-12 months we
include loans with a maturity date falling one business day before and after the proper maturity date. We do this to accommodate occasional deviations from the maturity date convention.
Allowable interest rates:
o Rate is greater than 1 basis point and within +/- 150 bp of Libor fixing o 2 – 5 days falls within Libor overnight bucket o 6 – 10 days falls within Libor 1 week bucket o 11 – 17 days falls within Libor 2 week bucket o 18 – 24 days falls within Libor 3 week bucket:
Libor 3 week generated by averaging Libor 2 week and Libor 1 month fixings o 25 – 29 days, 4 week, and 1 month +/- 1 business day falls into the Libor 1 month
bucket o 2 – 12 month +/- 1 business day fall within the respective Libor 2-12 month buckets
33Please refer to the bbalibor site http://www.bbalibor.com/technical-aspects/fixing-value-and-maturity for an explanation of the modified following business day rule. Note that entry into the website is now governed by a disclaimer. We depart from their description by only accounting for US holidays whereas bbalibor would account for both US and London holidays.

46
Rate is in basis point increments; rounding of +/- 5 cents on the return leg is permitted For simplicity, the analysis in the paper treats maturities of 27 days through 1 month +/- 1 business day as being 1 month loans. Note that to implement this interest rate filter, we use the following rules:
The imputed interest rate in percent is calculated as 100 x [(repayment - principal)/principal] x (360/calendar days).
Market convention is that trades are executed two business days before they are settled over Fedwire. Therefore the reference Libor fixing for our algorithm is taken from two business days prior to the Fedwire settlement date. Holidays are accounted for in the following manner:
o Holiday in US but none in London: Assume that term trades continue to be dealt in London. Trades settled on the business day after a US holiday will reference the
average of the Libor rate from two and three business days prior34. o Holiday in London but none in US:
Assume that term trades continue to be dealt in the US. Trades dealt on a London holiday reference the most recent Libor fixing prior
to that London holiday. e.g. Payment of $65m from bank A to bank B on Jul 7, 2008. Payment of $65,170,155.56 from bank B to bank A on Aug 7, 2008. This corresponds to a 31 day (1 month) loan with an annualized interest rate of 3.04000%. Filter 4. Tiebreaking. As discussed in the text, the sample of transaction pairs surviving the filters described above contains a subset of loan deliveries that are matched to several different loan returns, and a subset of loan returns that are matched to several different loan deliveries. We apply four different methods to select between duplicate matching situations. Our default method is Option A: Choose the shortest maturity. Option D, which chooses only uniquely matched pairs, generates roughly two-thirds the number of loans compared to the other methods. Otherwise, the properties of the resulting set of transactions are largely robust to whichever method is used, as discussed in the text35. Option A: Choose the shortest maturity If the duplicate matches represent different maturities, choose the shortest possible maturity. Among duplicate matches of the same maturity, choose randomly.
34 If a trade settlement date falls on a US holiday, it is pushed forward to the next business day. Accordingly, if we see trades settled on the business day following a US holiday, we then are not sure if they were dealt two business days prior as usual or if they were dealt three days prior because of the holiday. That is why we average. 35Given the importance of maturity in tiebreaking, it is important that there be no systematic, unintended maturity bias. Suppose we examine inferred loans with send legs between start date A and end date B. This then implies a set of potential return legs roughly between A+2 and B + 365. Notice that a return on A+2 is not presented with sends greater than 2 days prior to match with. Similarly, a return on B+ 365 is not presented with any sends less than one year prior to match with. To correct this bias, we provide each return leg with a full set of send legs up through one year prior as competing potential matches. However, we only keep inferred loans with send legs between date A and B in the post tiebreaking analysis.

47
Option B: Choose to minimize imputed rate distance from Libor fixing Choose between all duplicate matches based on shortest absolute value of distance from Libor fixing. Among duplicate matches of the same absolute value of distance from Libor fixing, choose randomly. Option C: Choose randomly Choose between all duplicate matches randomly. Option D: Choose only uniquely matched pairs.