Materi grand priview aston pangandaran condotel hubungi 0816608779
Upload
truongphucCategory
view
214download
0
AACL Bioflux, 2017, Volume 10, Issue 4. http://www.bioflux.com.ro/aacl 922
Identifying Penaeus merguiensis de Man, 1888 stocks in Indonesian Fisheries Management Area 573: a truss network analysis approach 1Melfa Marini, 2Ali Suman, 3Achmad Farajallah, 4Yusli Wardiatno
1 Master Program in Aquatic Resources Management, Graduate School of Bogor Agricultural University, Jalan Raya Dramaga, Kampus IPB Darmaga, Bogor 16680,
West Java, Indonesia; 2 Marine Fishery Research Institute, Ministry of Marine Affairs and Fisheries, Jl. Muara Baru Ujung, Kompleks Pelabuhan Perikanan Nizam Zachman,
Penjaringan - Jakarta 14440, Indonesia; 3 Department of Biology, Faculty of Mathematic and Natural Sciences, Bogor Agricultural University, Jalan Raya Dramaga, Kampus IPB Dramaga, Bogor 16680, West Java, Indonesia; 4 Department of Aquatic Resources Management, Faculty of Fisheries and Marine Sciences, Bogor Agricultural University, Jalan Raya Dramaga, Kampus IPB, Bogor 16680, West Java, Indonesia.
Corresponding author: M. Marini, [email protected]
Abstract. Banana shrimp (Penaeus merguiensis de Man, 1888) is a high valuable penaeid shrimp which occurs widely in Fisheries Management Area (FMA) 573 of Indonesia. Until now there is no report on stock structure of banana shrimp in the area. This study was aimed to identify stock structure of the banana shrimp based on morphometric characters using truss network analysis. The shrimps were collected from four locations, namely Pangandaran, Cilacap, Kebumen, and Kupang. A total of 295 shrimps were used in the analysis. The analysis was constructed by interconnecting 19 landmarks to form a total of 43 distance variables extracted from sample digital images using tps Dig2 and PAST software platforms. The transformed truss measurements were subjected to factor analysis and classification by cross-validation of discriminant analysis. The results of factor analysis showed a significance first factor is a variable that describes one part of the body from the rostrum bottom until the fifth segment of the abdomen and second factor describes the rostrum upper sixth segment of shrimp and shrimp body. Canonical variance analysis revealed two stock units of banana shrimp in FMA 573. Discriminant analysis indicated the analyzed data for grouping of four populations are able to represent the group of the actual population. Based on this finding, it is recommended to restructure the FMA 573 into two management areas, i.e. southern part of Java and Bali, and south Nusa Tenggara including Sawu Sea and west part of Timor Sea. Key Words: banana shrimp, crustacean fishery, Indian Ocean, morphology characters, Penaeidae.
Introduction. In fishery point of view, Indonesia is rich of valuable crustacean resources with relatively high demand in local, regional and global market, such as mud crab, blue swimming crab, hippoid crab, lobster, mantis shrimp, penaeid shrimps, crayfish, etc. Among them, there are current numerous studies in Indonesian crustaceans, such as mud crab (Tahmid et al 2015a, b), blue swimming crab (Prabawa et al 2014; Zairion et al 2014; Hamid & Wardiatno 2015; Hamid et al 2015a, b; Zairion et al 2015a, b; Hamid et al 2016a, b, c, d; Zairion et al 2016), hippoid crabs (Mashar & Wardiatno 2013a, b; Sarong & Wardiatno 2013; Mashar et al 2014; Wardiatno et al 2014; Ardika et al 2015; Mashar et al 2015; Muzammil et al 2015; Santoso et al 2015; Wardiatno et al 2015a, b; Edritanti et al 2016; Mashar & Wardiatno 2016; Wardiatno et al 2016a; Pramithasari et al 2017), lobster (Wahyudin et al 2017a, b; Wahyudin et al 2016; Wardiatno et al 2016b, c, d), mantis shrimp (Wardiatno 2012, 2014; Wardiatno & Mashar 2010, 2011, 2013; Wardiatno et al 2012), but only few about crayfish (Patoka et al 2016) and penaeid shrimp (Saputra et al 2013).
Banana shrimp (Penaeus merguiensis de Man, 1888), one of economical penaeid shrimps, is widely distributed in the western part of the Indo-Pacific from the Persian Gulf

AACL Bioflux, 2017, Volume 10, Issue 4. http://www.bioflux.com.ro/aacl 923
up to Thailand, Hong Kong, the Philippines, Indonesia, Papua New Guinea, New Caledonia and Northern Australia (Phongdara et al 1999; Chu et al 2003; Wanna et al 2004; Aziz et al 2009; FAO 2017). In terms of fishery, Indonesian territory is divided into 11 Fishery Management Area (FMA), and the banana shrimp can be found in most FMA except in FMA 713 and 714 (Suman et al 2014). According to Ministry of Marine Affairs and Fishery Decree no. 47/2016 the utilization level of the penaeid shrimps (including the banana shrimp) is over-exploited, except in FMA 717 (Pacific Ocean). Subdivision of 11 FMA are based on similarity in characteristics and dynamics of the waters as well as its coverage area, so-called eco-region (Prof. Indra Jaya 2017, personal communication), but are not based on stock boundaries. In fact, stock base subdivision would be more practical and helpful for sustainable and effective management in fishery resources (Begg et al 1999).
Stock and the population are often interpreted as the same thing; leading to the use of these two terms are becoming confusing. In general, the stock is defined as a portion of population or a subpopulation at a particular location. A group of individuals of the same species or subspecies that are spatially, genetically, or demographically separated from other groups is the difinition of population (Wells & Richmond 1995). Fishery scientists distinguish fishery stocks and the population more definitely, that the stock owns an archetype of migration and particular spawning sites. Stock more leads to abundance and management of fishery resources. Effendie (1979) defines stock as a population or part of the population in which all members are characterized by certain characters that cannot be inherited, but they are most likely influenced by the environment; a group of specific species that are exploited in a certain area or a certain way (Smith et al 1990). In addition, Sparre et al (1989) stated that the stock is a group of individuals or a member of a species that has the same characters and occupying a certain geographical area.
In fisheries management philosophy, if there is more one stock in FMA each stock must be managed separately to optimize their catch (Grimes et al 1987). Identification of the stock is a way to obtain information about the condition of the stock. It is needed for the most part to maintain a balance between utilization and conservation. According to Thorpe et al (1995) stock identification is a prerequisite in fisheries management, at the same time as population structure is considered a fundamental component of conservation biology. Several methods for identifying stocks are available, such as based on their population parameters, physiological characters and behaviour, meristic and morphometric, calcareous characters, cytogenetic and biological marker, and otolith (Ihssen et al 1981; Swain et al 2005; Cadrin et al 2005, 2014).
Analysis of morphometric diversity is one of the most frequently used methods to identify stocks with fairly low cost (Cadrin 2005). Morphometric variance between the stocks of a species can be used as a basis in determining the structure of the stock since it is easier to be done and learned in a short time (Begg et al 1999). Currently truss networking system has been developed as a new system for morphometric measurement (Sathianandan 2003; Cadrin et al 2005, 2014). Morphometric identification with truss network systems constructed with the help of landmark points are proved to be effective and powerful tools for capturing information about the shape of an organism and for stock identification (Strauss & Bookstein 1982; Cavalcanti et al 1999; Sathianandan 2003). This method is used to improve the traditional methods to identify the stock (Turan 1999; Akbarzadeh et al 2009; Sajina et al 2011; Sen et al 2011; Remya et al 2014; Pazhayamadom et al 2015).
In Indonesia, research on stock of a fishery resource in connecting with FMA is rarely done. In banana shrimp case, it is stated that the penaeid shrimp in FMA 573 is categorized as over-exploited in Ministry of Marine Affairs and Fishery Decree no. 47/2016. However, the number of unit stocks in the area has not been assessed. In fact, as mentioned above, the biological information on unit stocks is needed for better management. The study was aimed to reveal the unit stock of banana shrimp in FMA 573. The results can be a recommendation for stakeholders to restructure the subdivision of the area.

AACL Bioflux, 2017, Volume 10, Issue 4. http://www.bioflux.com.ro/aacl 924
Material and Method Description of the study sites. Sampling collections were conducted in FMA 573 covering Pangandaran, Cilacap, Kebumen, and Kupang (Figure 1). Detail of sampling location and time is presented in Table 1. Morphometric and meristic analysis were performed at the Fish Biology Laboratory of the Marine Fisheries Research Institute in Jakarta, Indonesia.
Figure 1. Sampling locations of the banana shrimp (Penaeus merguiensis de Mann 1888), as
indicated by numbers (1 = Pangandaran, 2 = Cilacap, 3 = Kebumen, 4 = Kupang).
Table 1 The location, sample number, sampling site GPS position, and time of sample collection
Location No. of sample Latitude Longitude Sampling time
Pangandaran 95 S 07º37’.166” E 108º45’.926” Jul and Dec 2016 Cilacap 63 S 07º43’.737” E 109º01’.417” Jul and Nov 2016
Kebumen 70 S 07º43’.228” E 109º23’.651” Aug and Nov 2016 Kupang 67 S 10º8’.27.856” E 123º36’.0.354” Oct and Dec 2016
Shrimp collection. Shrimp specimens were obtained from the fish landing, while the specimens were caught by local fishermen using trammel net. The collected shrimps were placed in a jar, and preserved with 70-96% alcohol prior to laboratory works. Sample digitizing. Prior to digitizing, shrimp samples were first cleaned in running water, dried and placed on a flat platform with vertical and horizontal grids. The distance between the vertical and horizontal grids was defined as one square unit covers the area of one cm2 for calibrating the final stages of image processing and data accuracy. Each individual shrimp was labelled with a specific code to identify the picture. For individual image digitizing shrimp, a series of digital cameras Sony Cybershot DSC H300 was mounted on a tripod. After the shooting process was completed, the shrimp sample was observed for its sex and if the sex could not be determined, disecting on reproduction organ was carried out (Balasubramanian & Natarajan 2000). Truss morphometric data measurements. In this research morphometric characters was analyzed the structure of the stock in banana shrimp using truss network analysis. Nine-teen landmark points were determined (Table 2), and from the 19 points was obtained 43 variables landmark truss network. Forty three (43) variables are formed following the formula of Strauss & Bookstein (1982). To ensure whether there are differences between the four populations, multivariate analysis of variance (MANOVA) was performed. A linear combination of two software program, namely tpsDig2 V 2.1

AACL Bioflux, 2017, Volume 10, Issue 4. http://www.bioflux.com.ro/aacl 925
(Rohlf 2006) and paleontological Statistics (PAST) (Hammer et al 2001) was used to retrieve data from the morphometric image of each specimen. All images were first converted from JPEG (*.jpg) format to TPS (*.tps) using utility programs, tpsUtil V1.38 (Rohlf 2006). Data description tps image file format of tpsDig used as the input source in the PAST and the data on the distance between the coordinate was extracted. The result of morphometric truss network system was presented in Figure 2 (Rebello et al 2013; Munasinghe 2014).
Table 2
Landmarks for extract measurements of truss in P. merguiensis collected from four locations in Indonesian Fisheries Management Area 573, i.e. Pangandaran, Cilacap, Kebumen, and Kupang
Number of landmark Position of landmark
1 Base of the rostrum 2 The upper teeth the first rostrum 3 The upper of the first segment base 4 The upper of the second segment base 5 The upper of the third segment base 6 The upper of the fourth segment base 7 The upper of the fifth segment base 8 The upper of the sixth segment base 9 The upper of the final segment base 10 Caudal base 11 End of the sixth segment bottom 12 End of the fifth segment bottom 13 End of the fourth segment bottom 14 End of the third segment bottom 15 End of the second segment bottom 16 End of the first segment bottom 17 The base of the first walk leg 18 The base of the antenna 19 The base of carapace
Figure 2. Position of truss network and conventional dimensions measured for initial regression
analysis in the banana shrimp (Penaeus merguiensis) collected from four locations in Indonesian Fisheries Management Area 573, i.e. Pangandaran, Cilacap, Kebumen, and Kupang.
Data analysis. All of truss measurement were transformed, tested for their normalities and outliers and if the outliers were recorded, they were removed prior the further analysis as suggested by Jolicoeur (1963), Sen et al (2011), Remya et al (2014) and Pazhayamadom et al (2015). After eliminating the outliers, all selected measurements were 295. Furthermore, the depended size effect was removed by using allometric
AACL Bioflux, 2017, Volume 10, Issue 4. http://www.bioflux.com.ro/aacl 926
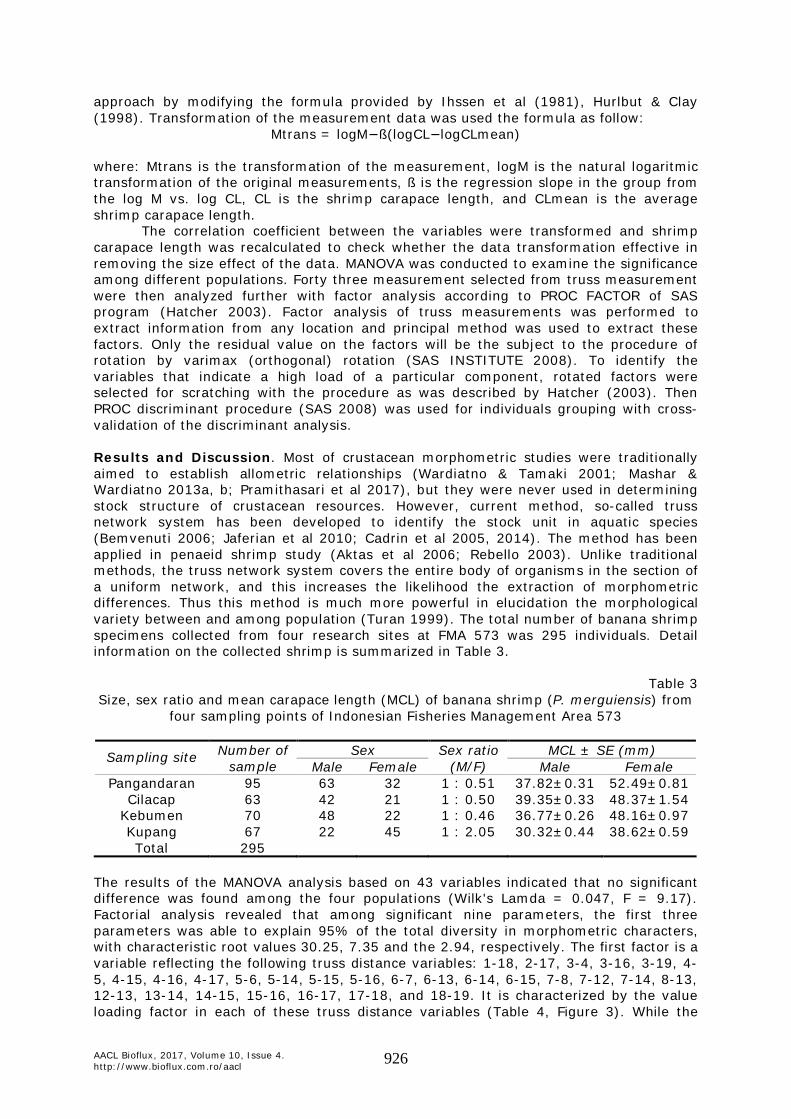
approach by modifying the formula provided by Ihssen et al (1981), Hurlbut & Clay (1998). Transformation of the measurement data was used the formula as follow:
Mtrans = logM−ß(logCL−logCLmean) where: Mtrans is the transformation of the measurement, logM is the natural logaritmic transformation of the original measurements, ß is the regression slope in the group from the log M vs. log CL, CL is the shrimp carapace length, and CLmean is the average shrimp carapace length.
The correlation coefficient between the variables were transformed and shrimp carapace length was recalculated to check whether the data transformation effective in removing the size effect of the data. MANOVA was conducted to examine the significance among different populations. Forty three measurement selected from truss measurement were then analyzed further with factor analysis according to PROC FACTOR of SAS program (Hatcher 2003). Factor analysis of truss measurements was performed to extract information from any location and principal method was used to extract these factors. Only the residual value on the factors will be the subject to the procedure of rotation by varimax (orthogonal) rotation (SAS INSTITUTE 2008). To identify the variables that indicate a high load of a particular component, rotated factors were selected for scratching with the procedure as was described by Hatcher (2003). Then PROC discriminant procedure (SAS 2008) was used for individuals grouping with cross-validation of the discriminant analysis.
Results and Discussion. Most of crustacean morphometric studies were traditionally aimed to establish allometric relationships (Wardiatno & Tamaki 2001; Mashar & Wardiatno 2013a, b; Pramithasari et al 2017), but they were never used in determining stock structure of crustacean resources. However, current method, so-called truss network system has been developed to identify the stock unit in aquatic species (Bemvenuti 2006; Jaferian et al 2010; Cadrin et al 2005, 2014). The method has been applied in penaeid shrimp study (Aktas et al 2006; Rebello 2003). Unlike traditional methods, the truss network system covers the entire body of organisms in the section of a uniform network, and this increases the likelihood the extraction of morphometric differences. Thus this method is much more powerful in elucidation the morphological variety between and among population (Turan 1999). The total number of banana shrimp specimens collected from four research sites at FMA 573 was 295 individuals. Detail information on the collected shrimp is summarized in Table 3.
Table 3 Size, sex ratio and mean carapace length (MCL) of banana shrimp (P. merguiensis) from
four sampling points of Indonesian Fisheries Management Area 573
Sex MCL ± SE (mm) Sampling site Number of sample Male Female
Sex ratio (M/F) Male Female
Pangandaran 95 63 32 1 : 0.51 37.82±0.31 52.49±0.81 Cilacap 63 42 21 1 : 0.50 39.35±0.33 48.37±1.54
Kebumen 70 48 22 1 : 0.46 36.77±0.26 48.16±0.97 Kupang 67 22 45 1 : 2.05 30.32±0.44 38.62±0.59 Total 295
The results of the MANOVA analysis based on 43 variables indicated that no significant difference was found among the four populations (Wilk's Lamda = 0.047, F = 9.17). Factorial analysis revealed that among significant nine parameters, the first three parameters was able to explain 95% of the total diversity in morphometric characters, with characteristic root values 30.25, 7.35 and the 2.94, respectively. The first factor is a variable reflecting the following truss distance variables: 1-18, 2-17, 3-4, 3-16, 3-19, 4-5, 4-15, 4-16, 4-17, 5-6, 5-14, 5-15, 5-16, 6-7, 6-13, 6-14, 6-15, 7-8, 7-12, 7-14, 8-13, 12-13, 13-14, 14-15, 15-16, 16-17, 17-18, and 18-19. It is characterized by the value loading factor in each of these truss distance variables (Table 4, Figure 3). While the

AACL Bioflux, 2017, Volume 10, Issue 4. http://www.bioflux.com.ro/aacl 927
second factor is a variable that explains the truss distance variables of 1-2, 1-19, 8-9, 8-11, 9-11, 9-12 and 11-12 and the third factors as indicators of truss distance variables of 8-12, 9-10 and 17-19.
Figure 3. High correlation truss variables of the first three factors in Truss Network Analysis of
banana shrimp (Penaeus merguiensis) collected from Indonesian Fisheries Management Area 573.

AACL Bioflux, 2017, Volume 10, Issue 4. http://www.bioflux.com.ro/aacl 928
Table 4 Variables for data loading truss of rotation factor
Truss
distance Factor 1 Factor 2 Factor 3 Truss distance Factor 1 Factor 2 Factor 3
1-2 -0.6203 0.77767 0.06658 6-15 -0.9106 -0.3181 -0.0978 1-18 -0.8702 0.41184 0.25113 7-8 -0.8732 -0.3426 0.30922 1-19 0.69235 -0.7102 -0.1107 7-12 0.8664 0.37046 -0.2918 2-3 -0.7867 0.50237 -0.2563 7-13 -0.589 -0.6037 0.45671 2-17 0.85219 -0.3636 0.16549 7-14 -0.942 0.29356 -0.1412 2-19 -0.756 0.16882 -0.5095 8-9 0.67343 0.72568 0.11548 3-4 0.98849 -0.0204 -0.0041 8-11 -0.7153 -0.6837 -0.124 3-16 -0.9749 0.11113 0.0109 8-12 -0.6644 -0.0208 0.6929 3-17 0.75415 0.41427 0.03117 8-13 0.88442 0.31031 -0.3012 3-19 0.80297 -0.4711 0.26275 9-10 -0.0598 0.14723 0.70356 4-5 0.91177 -0.4021 -0.0686 9-11 0.75602 0.64296 0.10772 4-15 -0.9142 0.40089 0.04254 9-12 -0.7099 -0.6927 -0.0973 4-16 0.94915 -0.2958 -0.0496 10-11 0.67834 0.52285 0.142 4-17 -0.9877 -0.0251 -0.0095 11-12 0.72881 0.66877 0.13017 5-6 0.87697 0.40308 0.12255 12-13 -0.8504 -0.3492 0.3478 5-14 -0.8946 -0.3627 -0.1371 13-14 0.95955 -0.1708 0.19538 5-15 0.98688 -0.1137 0.0391 14-15 0.91238 0.37473 0.0877 5-16 -0.9001 0.4259 0.07465 15-16 0.89461 -0.4404 -0.0419 6-7 0.96382 -0.1823 0.14201 16-17 0.9846 -0.1051 -0.0088 6-13 -0.9568 0.24967 -0.1017 17-18 -0.8083 0.46956 0.34199 6-14 0.97601 0.00439 0.15332 17-19 -0.4934 0.03163 -0.6601
18-19 -0.9502 0.07559 0.21249
In this study the first, second and third factor is a collection of truss distance variables that are correlated, but there is no correlation between factors. This indicates that the size of the shrimp on the truss distance variables of the same factors will have a comparable size change. Variables with a positive score indicate that they will amend in line with the changes the shrimp body, while the variable with a negative score will amend otherwise. From the factor analysis showed that first factor is the variable describing the shrimp body portion from the rostrum to the bottom of the fifth segment of the shrimp body as a whole. The second factor describes parts of shrimp body from the rostrum to the upper sixth segment of shrimp and shrimp abdomen. Third factor only shows the distance from the base of the sixth segment to the bottom of the sixth segment, the distance from the base of the caudal to the end of the caudal, and the distance between the first walk legs to the base of the rostrum.
To discriminate shrimp populations in four sampling points, canonical variance analysis using the morphometric characters was conducted by plotting them to the first and second axis. The analysis results revealed that banana shrimp population from Kupang (East Nusa Tenggara) were clearly different from those in South Java (Pangandaran, Cilacap and Kebumen) (Figure 4). It means that banana shrimp in FMA 573 derived from two stocks. Recent study by Sun et al (2013) showed that the population of the east coast of the Indian Ocean and the Pacific Ocean are morphologically almost identical so it is considered as one stock. Study the structure of the stock with morphological approach to shrimp is still very limited, especially in Indonesia. Kusrini et al (2009) studied morphology of banana shrimp and found that there were differences in morphology of banana shrimp among populations in five native habitats. They concluded that the shrimp population were divided into two groups, i.e. the first group is Pontianak, Lombok Strait – Bengkulu, and the second group is the Sunda Strait Cilacap. However, these findings are different from what has been reported from the results of previous studies conducted for the population of tiger shrimp (Penaeus monodon) (Rebello 2003; Rebello et al 2013; Munasinghe 2014).

AACL Bioflux, 2017, Volume 10, Issue 4. http://www.bioflux.com.ro/aacl 929
Figure 4. Analysis of the canonical variance on two axes extracted from 43 truss points
measurement in banana shrimp (P. merguiensis) collected from four locations in Indonesian Fishery Management Area 573, i.e. Pangandaran, Cilacap, Kebumen and Kupang.
Discriminant analysis to find the membership of a particular individual in the population based on 43 banana shrimp truss characters found that the clump percentage of Cilacap and Kebumen banana shrimp was not much different, i.e. 58.73% and 50.75%, respectively, whereas in Kupang and Pangandaran population was 97.01% and 81.43% (Table 5). Almost half of Cilacap shrimp population constructed Kebumen shrimp population, and also half of Kebumen shrimp population is at Cilacap and Pangandaran shrimp population. This indicates the morphological similarities between these three populations. In other way around, shrimp population of Kupang is 97% characterized originally from Kupang. In other words, the morphological structure of Kupang shrimp bears no resemblance to the structure of other shrimp populations of South Java. It is supported by the result of discriminant analysis that 72% sample data used correctly classified the shrimp population and only 28% misclassification. It can be concluded that the data sample used to group four banana shrimp populations has been able to represent the grouping of the actual population. Changes in morphology between populations in different sampling points are probably due to the genetic structures and different environmental conditions. Therefore, animals that have the same morphological characters are often thought to form a single stock and assessments have been used extensively in distinguishing the stock in the fishing industry (Dwivedi & Dubey 2013).

AACL Bioflux, 2017, Volume 10, Issue 4. http://www.bioflux.com.ro/aacl 930
Table 5 Discriminant analysis of shrimp percentage from each sampling point (row) grouped into
location (pool)
Location Cilacap Kebumen Kupang Pangandaran Cilacap 37 21 1 4
Kebumen 14 34 1 18 Kupang 0 1 65 1
Pangandaran 3 9 1 57 Total degree classified (%)
Total degree unclassified (%) 72 28
Proportion 0.5873 0.5075 0.9701 0.8143
Conclusions. Banana shrimp (P. merguiensis) in Indonesian Fisheries Management Area 573 consisted of two different stocks. It is recommended to restructure the FMA 573 into two management areas, i.e. southern part of Java and Bali, and south Nusa Tenggara including Sawu Sea and west part of Timor Sea. The subdivision of the FMA would help stakeholders to establish methods, strategies or scenarios for sustainable use of the shrimp. Acknowledgements. This paper is one of contribution of Fisheries Biology Characteristic, Habitat Resources and Fish Resource Potency Research in Indian Ocean and South Java, FMA 573 funded by Marine Capture Fisheries Research Institute, the Indonesian Ministry of Marine Affairs and Fisheries in 2016 and from research collaboration between Ehime and Bogor Agriculture University. The first author would like to thank the Director of the Research Institute of Marine Capture Fisheries and staffs for the financial assistance, laboratory facilities, and encouragement. She also thank to Bogor Agricultural University for excellent facilities during her master study. References Akbarzadeh A., Farahmand H., Shabani A. A., Karami M., Kaboli M., Abbasi K., Rafiee G.
R., 2009 Morphological variation of the pikeperch Sander lucioperca (L.) in the Southern Caspian Sea, using a truss system. Journal of Applied Ichthyology 25: 576-582.
Aktas M., Turan C., Bozkurt A., 2006 Taxonomic description of three shrimp species (Melicertus kerathurus, Metapenaeus monoceros, Penaeus semisulcatus) using multivariate morphometric analysis. Journal of Animal and Veterinary Advances 5(3):172-175.
Ardika P. U., Farajallah A., Wardiatno Y., 2015 First record of Hippa adactyla (Fabricius, 1787; Crustacea, Anomura, Hippidae) from Indonesian waters. Tropical Life Sciences Research 26(2):105-110.
Aziz D., Siraj S. S., Azmi F. R., Daud S. K., Panandam J. M., Othman M. F., 2009 Genetic diversity of banana prawns Fenneropenaeus merguiensis using micro satellite markers. Proceedings of the 8th Malaysia Congress on Genetics 4-6 August, Genting Highland, Malaysia.
Balasubramanian N. K., Natarajan P., 2000 Studies on the biology of the scads Decapterus russelli and Decapterus macrosoma at Vizhinjam, southwest coast of India. Indian Journal of Fisheries 47(4):291-300.
Begg G. A., Friedlank K. D., Pearce J. B., 1999 Stock identification and its role in stock assessment and fisheries management: an overview. Fisheries Research 43:1-8.
Bemvenuti M. A., 2006 Silversides in South Brazil: morphological and ecological aspects. BIOCELL 30(1):111-118.
Cadrin S. X., 2005 Morphometric landmarks. In: Stock identification methods: applications in fishery science. Cadrin S. X., Friedland K. D., Waldman J. R. (eds), Elsevier Academic Press, Amsterdam, pp. 153-172.

AACL Bioflux, 2017, Volume 10, Issue 4. http://www.bioflux.com.ro/aacl 931
Cadrin S. X. Friedland K. D., Waldman J.R., 2005 Stock identification methods: applications in fishery science. Elsevier Academic Press, Amsterdam, 719 pp.
Cadrin S. X., Kerr L. A., Mariani S., 2014 Stock identification methods: applications in fishery science. Second edition, Elsevier Academic Press, Amsterdam, 566 pp.
Cavalcanti M. J., Monteiro L. R., Lopez P. R. D., 1999 Landmark based morphometric analysis in selected species of serranid fishes (Perciformes. Teleostei). Zoological Studies 38:287-294.
Chu K. H., Li C. P., Tam Y. K., Lavery S., 2003 Application of mitochondrial control region in population genetic studies of the shrimp Penaeus. Molecular Ecology Notes 3: 120-122.
Dwivedi A. K., Dubey V. K., 2013 Advancements in morphometric differentiation: a review on stock identification among fish populations. Reviews in Fish Biology and Fisheries 23:23-39.
Edritanti Q., Farajallah A., Wardiatno Y., 2016 Reproductive biology of ovigerous female Emerita emeritus (Crustacea, Decapoda) in Bengkulu coastal waters, Indonesia: egg production and reproductive ouput. Croatian Journal of Fisheries 74(3):163-175.
Effendie M. I., 1979 [Methods in fisheries biology]. Yayasan Dewi Sri, Bogor. [in Indonesian]
[FAO] Food and Agriculture Organization, 2017 Species fact sheets Penaeus merguiensis (de Man 1888). Fisheries and Aquaculture Department, United Nations, 4 pp.
Grimes C. B., Johnson A. G., Fable Jr. W. A., 1987 Delineation of king mackerel (Scomberomorus cavalla) stocks along the US east coast and in the Gulf of Mexico. In: Proceedings of the Stock Identification Workshop. 5-7 November 1985, Panama City Beach, FL NOAA Technical Memorandum NMFS-SEFC-199. Kumpf H. E., Vaught R. N., Grimes C. B., Johnson A. G., Nakamura E. L. (eds), US Government Printing Office, pp. 186-187.
Hamid A., Wardiatno Y., 2015 Population dynamics of the blue swimming crab (Portunus pelagicus Linnaeus, 1758) in Lasongko Bay, Central Buton, Indonesia. AACL Bioflux 8(5):729-739.
Hamid A., Wardiatno Y., Lumban Batu D. T. F., Riani E., 2015a [Fecundity and gonad maturity stages of ovigerous female blue swimming crab (Portunus pelagicus) in Lasongko Bay, Southeast Sulawesi]. BAWAL 7(1):43-50. [in Indonesian]
Hamid A., Wardiatno Y., Lumban Batu D. T. F., Riani E., 2015b Changes in proximate and fatty acids of the eggs during embryo development in the blue swimming crab, Portunus pelagicus (Linnaeus 1758) at Lasongko Bay, Southeast Sulawesi, Indonesia. Indian Journal of Science and Technology 8(6):501-509.
Hamid A., Wardiatno Y., Lumban Batu D. T. F., Riani E., 2016a Stock status and fisheries exploitation of blue swimming crab Portunus pelagicus (Linnaeus 1758) in Lasongko Bay, Central Buton, Indonesia. Asian Fisheries Science 29(4):206-219.
Hamid A., Wardiatno Y., Lumban Batu D. T. F., Riani E., 2016b [Spatial-temporal distribution based on size and gonad maturity of blue swimming crab (Portunus pelagicus Linnaeus 1758) in Lasongko Bay, central Buton, South-east Sulawesi]. OmniAkuatika 12(2):77-91. [in Indonesian]
Hamid A., Lumban Batu D. T. F., Riani E., Wardiatno Y., 2016c Reproductive biology of blue swimming crab (Portunus pelagicus Linnaeus, 1758) in Lasongko Bay, Southeast Sulawesi-Indonesia. AACL Bioflux 9(5):1053-1066.
Hamid A., Wardiatno Y., Lumban Batu D. T. F., Riani E., 2016d Distribution, body size, and eggs of ovigerous swimming crab (Portunus pelagicus Linnaeus 1758) at various habitats in Lasongko Bay, Central Buton, Indonesia. International Journal of Aquatic Biology 4(2):108-116.
Hammer O., Harper D. A. T, Ryan P. D., 2001 PAST: Paleontological statistics software package for education and data analysis. Palaeontologia Electronica 4(1):1-9.
Hatcher L., 2003 A step-by-step approach to using the SAS system for factor analysis and structural equation modeling. SAS Institute, Cary NC, 588 pp.

AACL Bioflux, 2017, Volume 10, Issue 4. http://www.bioflux.com.ro/aacl 932
Hurlbut T., Clay D., 1998 Morphometric and meristic differences between shallow- and deep-water populations of white hake (Urophycis tenuis) in the southern Gulf of St. Lawrence. Canadian Journal of Fisheries and Aquatic Sciences 55:2274-2282.
Ihssen P. E., Booke H. E., Casselman J. M., McGlade J. M., Payne N. R., Utter F. M., 1981 Stock identification: materials and methods. Canadian Journal of Fisheries and Aquatic Sciences 38:1838-1855.
Jaferian A., Zolgharnein H., Mohammadi M., Salari-Aliabadi M. A., Hossini S. J., 2010 Morphometric study of Eleutheronema tetradactylum in Persian Gulf based on the truss network. World Journal of Fish and Marine Sciences 2:499-504.
Jolicoeur P., 1963 The multivariate generalization of the allometry equation. Biometrics 19:497-499.
Kusrini E., Hadie W., Alimuddin, Sumantadinata K., Sudrajat A., 2009 [Morphological study of several populations of banana prawn (Fenneropenaeus merguiensis de Man) from Indonesian waters]. Jurnal Riset Akuakultur 4(1):15-21. [in Indonesian]
Mashar A., Wardiatno Y., 2013a [Growth aspect of the mole crab, Emerita emeritus in sandy coast of District Kebumen]. Jurnal Biologi Tropis 13(1):29-38. [in Indonesian]
Mashar A., Wardiatno Y., 2013b [Growth aspect of the mole crab, Hippa adactyla in sandy coast of District Kebumen]. Jurnal Biologi Tropis 13(2):119-127. [in Indonesian]
Mashar A., Wardiatno Y., 2016 [Standing biomass of the mole crab resources (Crustacea: Decapoda: Hippidae) in Cilacap and Kebumen sandy beaches, Central Java]. Marine Fisheries 7(2):211-218. [in Indonesian]
Mashar A., Wardiatno Y., Boer M., Butet N. A., Farajallah A., 2014 [Diversity and abundance of sand crabs on the south coast of Central Java]. Ilmu Kelautan 19(4): 226-232. [in Indonesian]
Mashar A., Wardiatno Y., Boer M., Butet N.A., Farajallah A., Ardika P. U., 2015 First record of Albunea symmysta (Crustacea: Decapoda: Albuneidae) from Sumatra and Java, Indonesia. AACL Bioflux 8(4): 611-615.
Ministry of Marine Affairs and Fishery Decree, PMKP. No. 47, Year 2016. [in Indonesian] Munasinghe D. H. N., 2014 Availability of morphologically similar, genetically diverge
Penaeus monodon population in Sri Lanka. Proceedings Book of ICETSR Malaysia. Handbook on the Emerging Trends in Scientific Research, PAK Publishing Group, Malaysia, pp. 690-698.
Muzammil W., Wardiatno Y., Butet N. A., 2015 [Carapace length-width ratio, relative growth, condition factor, and relative condition factor of the mole crab (Hippa adactyla) in Cilacap and Kebumen sandy beach]. Jurnal Ilmu Pertanian Indonesia 20(1):78-84. [in Indonesian]
Patoka J., Wardiatno Y., Yonvitner, Kuříková P., Petrtyl M., Kalous L., 2016 Cherax quadricarinatus (von Martens) has invaded Indonesian territory west of the Wallace Line: evidences from Java. Knowledge and Management of Aquatic Ecosystems 417:39.
Pazhayamadom D. G., Chakraborty S. K., Jaiswar A. K., Sudheesan D., Sajina A. M., Jahageerdar S., 2015 Stock structure analysis of ‘Bombay duck’ (Harpadon nehereus Hamilton, 1822) along the Indian coast using truss network morphometrics. Journal of Applied Ichthyology 31:37-44.
Phongdara A., Chotigeat W., Chandumpai A., Tanthana C., Duangtong P., 1999 Identification of Penaeus merguiensis and Penaeus indicus by RAPD-PCR derived DNA markers. ScienceAsia 25:143-151.
Prabawa A., Riani E., Wardiatno Y., 2014 [The effect of heavy metal pollution on structure and inside organ of blue swimming crab (Portunus pelagicus, LINN)]. Jurnal Pengelolaan Sumberdaya Alam dan Lingkungan 4(1):17-23. [in Indonesian]
Pramithasari F. A., Butet N. A., Wardiatno Y., 2017 Variation in morphometric characters in four sand crab (Albunea symmysta) populations collected from Sumatra and Java Island, Indonesia. Tropical Life Sciences Research 28(1):103-115.
Rebello V. T., 2003 Genetic studies of the marine penaeid prawn Penaeus monodon Fabricius, 1798. PhD Thesis, The Cochin University of Science and Technology Kochi, Kerala, India, 80 pp.

AACL Bioflux, 2017, Volume 10, Issue 4. http://www.bioflux.com.ro/aacl 933
Rebello V. T., George M. K., Paulton M. P., Sathianandan T. V., 2013 Morphometric
structure of the jumbo tiger prawn, Penaeus monodon Fabricius, 1798 from southeast and southwest coasts of India. Journal of the Marine Biological Association of India 55 (2):11-15.
Remya R., Vivekanandan E., Sreekanth G. B., Ambrose T. V, Nair P. G., Manjusha U., Thomas S., Mohamed K. S., 2014 Stock structure analysis of Indian mackerel Rastrelliger kanagurta (Cuvier, 1817) from south-east and south-west coasts of India using truss network system. Indian Journal of Fisheries 61(3):16-19.
Rohlf F. J., 2006 tpsDig2,version 2.1. State University of New York Stony Brook, NY. Available at: http.//life.bio.sunysb.edu/morph.
Sajina A. M., Chakraborty S. K., Jaiswar A. K., Pazhayamadam D. G., Sudheesan D., 2011 Stock structure analysis of Megalaspis cordyla (Linnaeus, 1758) along the Indian coast based on truss network analysis. Fisheries Reseearch 108:100-105.
Santoso J., Hanifa Y. N., Indariani S., Wardiatno Y., Mashar A., 2015 Nutritional values of the Indonesian mole crab, Emerita emeritus: are they affected by processing methods? AACL Bioflux 8(4):579-587.
Saputra S. W., Djuwito, Rutiyaningsih A., 2013 [Some biological aspects of banana shrimp (Penaeus merguiensis) in Cilacap coastal waters, Central Java]. Journal of Management of Aquatic Resources 2(3):47-55. [in Indonesian]
Sarong A., Wardiatno Y., 2013 [Habitat characteristics and morphology of the burrow of sand crab (Albunea) in littoral zone of Leupung coastal area, Aceh Besar District]. Jurnal EduBio Tropika 1(1):34-37. [in Indonesian]
SAS Institute, 2008 SAS/STAT. User’s guide, version 9.1. SAS Institute, Cary. pp. 1-943. Sathianandan T. V., 2003 Truss network analysis for fish genetic stock discrimination. In:
Winter school on recent advances in mariculture genetics and biotechnology, 4-24 November 2003, Cochin, 10 pp.
Sen S., Jahageerdar S., Jaiswar A. K., Chakraborty S. K., Sajina A. M., Dash G. R., 2011 Stock structure analysis of Decapterus russelli (Ruppell, 1830) from east and west coast of India using truss network analysis. Fisheries Research 112:38-43.
Smith P. J., Jamieson A., Birley A. J., 1990 Electrophoretic studies and the stock concept in marine teleosts. ICES Journal of Marine Science 47(2):231-245.
Sparre P., Ursin E., Venema S. C., 1989 Introduction to tropical fish stock assessment. Part 1 - Manual. FAO Fisheries Technical paper 306/1, Food and Agriculture Organization of the United Nations, Rome.
Strauss R. E., Bookstein F. L., 1982 The truss: body form reconstructions in morphometrics. Systematic Zoology 31:113-135.
Suman A., Wudianto, Sumarno B., Irianto H. E., Badrudin, Amri K., 2014 [Potency and utilization level of fish resources in Fisheries Management Area of Republic Indonesia]. Jakarta: Ref Graphika, 199 pp. [in Indonesian]
Sun M. M., Huang J. H., Jiang S. G., Yang Q. B., Zhou F. L., Zhu C. Y., Yang L. S., Su T. F., 2013 Morphometric analysis of four different populations of Penaeus monodon (Crustacea, Decapoda, Penaeidae). Aquaculture Research 45:113-123.
Swain D. P., Hutchings J. A., Foote C. J., 2005 Environmental and genetic influences on stock identification characters. In: Stock identification methods: applications in fishery science. Cadrin S. X., Friedland K. D., Waldman J. R. (eds), Elsevier Academic Press, Amsterdam, pp.45-85.
Tahmid M., Fahrudin A., Wardiatno Y., 2015a [Study of size structure and population mud crab (Scylla serrata) in mangrove ecosystem Bintan Gulf, Riau Islands]. Jurnal Biologi Tropis 15(2):93-106. [in Indonesian]
Tahmid M., Fahrudin A., Wardiatno Y., 2015b [Habitat quality mud crab (Scylla serrata) in mangrove ecosystem of Bintan Bay, Bintan District, Riau Islands]. Jurnal Ilmu Teknologi dan Kelautan Tropis 7(2):535-551. [in Indonesian]
Thorpe J. E., Gall G. A. E., Lannan J. E., Nash C. E., 1995 Conservation of fish and shelfish resources: managing diversity. Academic Press, San Diego, USA, 195 pp.

AACL Bioflux, 2017, Volume 10, Issue 4. http://www.bioflux.com.ro/aacl 934
Turan C., 1999 A note on the examination of morphometric differentiation among fish populations: the truss system. Turkish Journal of Zoology 23:259-263.
Wahyudin R. A., Hakim A. A., Boer M., Farajallah A., Wardiatno Y., 2016 New records of Panulirus femoristriga von Martens, 1872 (Crustacea Achelata Palinuridae) from Celebes and Seram Islands, Indonesia. Biodiversity Journal 7(4):901-906.
Wahyudin R. A., Hakim A. A., Qonita Y., Boer M., Farajallah A., Mashar A., Wardiatno Y., 2017a Lobster diversity of Palabuhanratu Bay, South Java, Indonesia with new distribution record of Panulirus ornatus, P. polyphagus and Parribacus antarcticus. AACL Bioflux 10(2):308-327.
Wahyudin R. A., Wardiatno Y., Boer M., Farajallah A., Hakim A. A., 2017b Short communication: a new distribution record of the mud-spiny lobster, Panulirus polyphagus (Herbst, 1793) (Crustacea, Achelata, Palinuridae) in Mayalibit Bay, West Papua, Indonesia. Biodiversitas 18(2):780-783.
Wanna W., Rolland J. L., Bonhomme F., Phongdara A., 2004 Population genetic structure of Penaeus merguiensis in Thailand based on nuclear DNA variation. Journal of Experimental Marine Biology and Ecology 311(1):63-78.
Wardiatno Y., 2012 Vibrio sp. attack on domesticated mantis shrimp, Harpiosquilla raphidea. Buletin PSP 20(3):311-318.
Wardiatno Y., 2014 [Mantis shrimp Harpiosquilla raphidea (Fabricius 1798) of Kuala Tungkal, Province Jambi: biology, domestication effort and biochemical composition]. IPB Press, Bogor, 89 pp. [in Indonesian]
Wardiatno Y., Mashar A., 2010 Biological information on the mantis shrimp, Harpiosquilla raphidea (Fabricius 1798) (Stomatopoda, Crustacea) in Indonesia with a highlight of its reproductive aspects. Journal of Tropical Biology and Conservation 7:65-73.
Wardiatno Y., Mashar A., 2011 Population dynamics of the Indonesian mantis shrimp, Harpiosquilla raphidea (Fabricius 1798) (Crustacea: Stomatopoda) collected from a mud flat in Kuala Tungkal, Jambi Province, Sumatera Island. Ilmu Kelautan 16(2): 111-118.
Wardiatno Y., Mashar A., 2013 Morphometric study of two Indonesian mantis shrimp (Harpiosquilla raphidea and Oratosquillina gravieri). Buletin PSP 21(1):19-30.
Wardiatno Y., Tamaki A., 2001 Bivariate discriminant analysis for the identification of Nihonotrypaea japonica and N. harmandi (Decapoda: Thalassinidea: Callianassidae). Journal of Crustacean Biology 21(4):1042-1048.
Wardiatno Y., Santoso J., Mashar A., 2012 Biochemical composition in two populations of the mantis shrimp, Harpiosquilla raphidea (Fabricius 1798) (Stomatopoda, Crustacea). Ilmu Kelautan 17(1):49-58.
Wardiatno Y., Nurjaya I. W., Mashar A., 2014 [Habitat characteristics of the sand crabs (Family Hippidae) in sandy coast of Cilacap District]. Jurnal Biologi Tropis 14(1):1-8. [in Indonesian]
Wardiatno Y., Ardika P. U., Farajallah A., Mashar A., Ismail, 2015a The mole crab Hippa marmorata (Hombron et Jacquinot, 1846) (Crustacea Anomura Hippidae): a first record from Indonesian waters. Biodiversity Journal 6(2):517-520.
Wardiatno Y., Ardika P. U., Farajallah A., Butet N. A., Mashar A., Kamal M. M., Renjaan E. A., Sarong M. A., 2015b Biodiversity of Indonesian sand crabs (Crustacea, Anomura, Hippidae) and assessment of their phylogenetic relationships. AACL Bioflux 8(2):224-235
Wardiatno Y., Qonita Y., Hakim A. A., 2016a Burrowing time of the three Indonesian hippoid crabs after artificial dislodgment. Ilmu Kelautan 21(3):135-142.
Wardiatno Y., Hakim A. A., Mashar A., Butet N. A., Adrianto L., 2016b Two newly recorded species of the lobster Family Scyllaridae (Thenus indicus and Scyllarides haanii) from South of Java, Indonesia. HAYATI Journal of Biosciences 23(3):101-105.
Wardiatno Y., Hakim A. A., Mashar A., Butet N. A., Adrianto L., Farajallah A., 2016c On the presence of the Andaman lobster, Metanephrops andamanicus (Wood-Mason, 1891) (Crustacea Astacidea Nephropidae) in Palabuhanratu bay (S-Java, Indonesia). Biodiversity Journal 7(1):17-20.

AACL Bioflux, 2017, Volume 10, Issue 4. http://www.bioflux.com.ro/aacl 935
Wardiatno Y., Hakim A. A., Mashar A., Butet N. A., Adrianto L., Farajallah A., 2016d, First
record of Puerulus mesodontus Chan, Ma and Chu, 2013 (Crustacea, Decapoda, Achelata, Palinuridae) from south of Java, Indonesia. Biodiversity Data Journal 4: e8069.
Wells J. V., Richmond M. E., 1995 Populations, metapopulations, and species populations: what are they and who should care? Wildlife Society Bulletin 23:458-462.
Zairion, Wardiatno Y., Fahrudin A., Boer M., 2014 [Spatial temporal distribution of Portunus pelagicus breeding population in east lampung coastal waters]. BAWAL 6(2):95-102. [in Indonesian]
Zairion, Wardiatno Y., Boer M., Fahrudin A., 2015a Reproductive biology of the blue swimming crab Portunus pelagicus (Brachyura: Portunidae) in east Lampung waters, Indonesia: fecundity and reproductive potential. Tropical Life Sciences Research 26(1):67-85.
Zairion, Wardiatno Y., Fahrudin A., 2015b Sexual maturity, reproductive pattern and spawning female population of the blue swimming crab, Portunus pelagicus (Brachyura: Portunidae) in east Lampung coastal waters, Indonesia. Indian Journal of Science and Technology 8(7):596-607.
Zairion, Boer M., Wardiatno Y., Fahrudin A., 2016 [Composition and size of blue swimming crab (Portunus pelagicus) caught at several bathymetri stratification in east Lampung waters]. Jurnal Penelitian Perikanan Indonesia 20(4):199-206. [in Indonesian]
Received: 03 June 2017. Accepted: 18 July 2017. Published online: 13 August 2017. Authors: Melfa Marini, Master Program in Aquatic Resources Management, Graduate School of Bogor Agricultural University, Jalan Raya Darmaga, Kampus IPB Darmaga, Bogor 16680, West Java, Indonesia, e-mail: [email protected] Ali Suman, Marine Fishery Research Institute, Ministry of Marine Affairs and Fisheries, Jl. Muara Baru Ujung, Kompleks Pelabuhan Perikanan Nizam Zachman, Penjaringan - Jakarta 14440, Indonesia, e-mail: [email protected] Achmad Farajallah, Department of Biology, Faculty of Mathematic and Natural Sciences, Bogor Agricultural University, Jalan Raya Darmaga, Kampus IPB Darmaga, Bogor 16680, West Java, Indonesia, e-mail: [email protected] Yusli Wardiatno, Department of Aquatic Resources Management, Faculty of Fisheries and Marine Sciences, Bogor Agricultural University, Jalan Raya Darmaga, Kampus IPB, 16680 Dramaga, West Java, Indonesia, e-mail: [email protected] This is an open-access article distributed under the terms of the Creative Commons Attribution License, which permits unrestricted use, distribution and reproduction in any medium, provided the original author and source are credited. How to cite this article: Marini M., Suman A., Farajallah A., Wardiatno Y., 2017 Identifying Penaeus merguiensis de Man, 1888 stocks in Indonesian Fisheries Management Area 573: a truss network analysis approach. AACL Bioflux 10(4):922-935.