
Identifying Foreign Suppliers in U.S. Import Data · We first describe the method for identifying...
36
K.7 Identifying Foreign Suppliers in U.S. Import Data Kamal, Fariha and Ryan Monarch International Finance Discussion Papers Board of Governors of the Federal Reserve System Number 1142r October 2017 Please cite paper as: Kamal, Fariha and Ryan Monarch (2017). Identifying Foreign Suppliers in U.S. Import Data. International Finance Discussion Papers 1142r. https://doi.org/10.17016/IFDP.2017.1142r
Transcript of Identifying Foreign Suppliers in U.S. Import Data · We first describe the method for identifying...

K.7
Identifying Foreign Suppliers in U.S. Import Data Kamal, Fariha and Ryan Monarch
International Finance Discussion Papers Board of Governors of the Federal Reserve System
Number 1142r October 2017
Please cite paper as: Kamal, Fariha and Ryan Monarch (2017). Identifying Foreign Suppliers in U.S. Import Data. International Finance Discussion Papers 1142r. https://doi.org/10.17016/IFDP.2017.1142r
Board of Governors of the Federal Reserve System
International Finance Discussion Papers
Number 1142r
October 2017
Identifying Foreign Suppliers in U.S. Import Data
Fariha Kamal and Ryan Monarch NOTE: International Finance Discussion Papers are preliminary materials circulated to stimulate discussion and critical comment. References in publications to International Finance Discussion Papers (other than an acknowledgment that the writer has had access to unpublished material) should be cleared with the author or authors. Recent IFDPs are available on the Web at https://www.federalreserve.gov/econres/ifdp/. This paper can be downloaded without charge from Social Science Research Network electronic library at http://www.sssrn.com.

Identifying Foreign Suppliers in U.S. Import Data
Fariha Kamal* Ryan Monarch**
Relationships between firms and their foreign suppliers are the foundation of international trade, but data limitations and reliability concerns make studying such relationships challenging. We evaluate and enhance supplier information in U.S. import data and present new facts about importer–exporter relationships. Count of foreign exporters from U.S. import data tends to exceed those from source country data, especially from China. The pattern of U.S. imports from origin countries changes substantially by tracing trade back to the supplier's location instead. Related-party relationships trade more, while larger countries have more relationships. Keywords: International Trade, Transactional Relationships JEL classifications: F1, L14;
*Center for Economic Studies, U.S. Census Bureau. Contact: [email protected] **The author is a staff economist in the Division of International Finance, Board of Governors of the Federal Reserve System, Washington, D.C. 20551 U.S.A. The views in this paper are solely the responsibility of the author(s) and should not be interpreted as reflecting the views of the Board of Governors of the Federal Reserve System or of any other person associated with the Federal Reserve System. Contact: [email protected] Any opinions and conclusions expressed herein are those of the authors and do not necessarily represent the views of the U.S. Census Bureau, the Board of Governors of the Federal Reserve System, or of any other person associated with the Federal Reserve System. All results have been reviewed to ensure that no confidential information is disclosed. We thank Kyle Handley, C.J. Krizan, Javier Miranda, Tim Schmidt-Eisenlohr, Christian Volpe, and two anonymous referees for valuable comments. We have benefitted immensely from conversations with David Dickerson and Glenn Barresse of the U.S. Census Bureau Economic Statistical Methods Division, Kristen Nespoli of the U.S. Census Bureau International Trade Management Division, and Diana Wyman from Statistics Canada. Clint Carter and William Wisniewski were extremely helpful with data requests and disclosure processes. All errors are ours.

1 Introduction
Every international trade transaction is an agreement between two firms, an importer (buyer)
and an exporter (supplier), located in two different countries. For this reason, the recent
availability of datasets that provide the identity of both importers and exporters for individual
transactions has fundamental appeal for the field of international trade. Indeed, the existence of
such “two-sided” data has the potential to establish novel facts about traders that can augment
the heterogeneous firm framework widely used throughout the literature (Melitz (2003)). To
the best of our knowledge, two-sided trade transactions data has been analyzed for Colombia
(Benguria (2014)), Chile and Colombia (Blum et al. (2013)), Costa Rica, Ecuador, and Uruguay
(Carballo et al. (2013)), Norway (Bernard et al. (2014)), and the United States (Pierce and
Schott (2012); Dragusanu (2014); Eaton et al. (2014); Monarch (2014); Kamal and Sundaram
(2016), (2017); Heise (2016); Monarch and Schmidt-Eisenlohr (2016) ).
One of the primary concerns about two-sided trade transactions data is reliability: in order
to have individual transactions that include both importing and exporting entities, one data
source must identify individual traders in both countries. While it may be in the best interest
of governments to collect reliable information about firms located in their jurisdiction for tax-
ation purposes, it is not obvious that the same governments would have the incentive, or even
the authority, to maintain accurate statistics on firms located outside their national borders.
Subsequently, two-sided trade data will by definition be more susceptible to issues related to the
identification of “foreign” buyers or suppliers. This paper describes data representing foreign
suppliers to the U.S., discusses potential concerns about the quality of the data as well as some
suggested refinements, and presents new findings about relationships between U.S. buyers and
their foreign suppliers.
We first describe the method for identifying foreign suppliers in U.S. merchandise import
transactions.1 U.S. importing firms with shipments above $2,000 are required to complete
U.S. Customs and Border Protection (CBP) Form 7501, part of which entails constructing
and reporting a code- known as the Manufacturer ID or MID- for the foreign supplier in the
transaction. The MID is widely used by both the U.S. and Canadian governments for official
purposes. We explore the potential for errors that may arise in completing the MID, and note
1We use the Linked Firm Trade Transaction Database (LFTTD) is maintained by the U.S. Census Bureau.See http://www.census.gov/ces/dataproducts/datasets/imp.html for further description.
4

that 13% of U.S. import value is associated with transactions with no MID. Additionally, we
show using external data that following the rules of MID creation, as outlined by CBP, tends
to generate unique identifiers for suppliers within sectors.
After this investigation, we describe our efforts to update the MID in U.S. merchandise
import transactions. We correct for possible clerical errors that may arise as importers construct
this variable. Then, we collapse very similar MIDs into a single MID using string similarity
scores. Following this, we perform various “stress tests” of our changes, showing both that our
foreign supplier identifier improves the reliability of related-party relationships, and that MIDs
we group together share very similar characteristics, such as sectors or buyers.
In the last part of the paper, we present five empirical patterns derived from our refined
data on foreign suppliers selling to U.S. importers. First, U.S. import data tends to identify
more exporters to the U.S. than foreign export data (especially in the case of China) on average.
However, exporter counts match well within broad sectors. Second, there is significant churning
in the population of suppliers to the U.S., with rampant exit each year. Third, there are sizable
discrepancies between the “exporting country” recorded on a customs form and a supplier’s
location, and we show that the pattern of U.S. imports would change significantly were exports
assigned to the original location of production. Fourth, related-party relationships exhibit higher
trade volumes and higher prices. Finally, we find that larger countries, as well as countries in a
trade agreement with the U.S., tend to have more relationships with U.S. importers and higher
value per relationship.
The paper proceeds as follows. Section 2 describes the MID in greater detail, including
the institutional reasons it is included on customs forms and assessing uniqueness. Section 3
presents our grouping methodology and related stress tests. Section 4 uses the updated data to
establish our core set of stylized facts, and the last section concludes.
2 Background and History
2.1 MID Creation
U.S. importers are required to fill out CBP Form 7501 (see Figure 1) in order to complete
importation of goods into the United States. Importing firms must record information about
the value, quantity, and 10-digit HTSUS product category of the imported merchandise, as well
5

as, in Box 13, the “Manufacturer ID” (MID) for each product. This field will contain information
about the identity of the plant that produced the exported good. In general, CBP requires that
the Manufacturer ID constitute the supplier, not trading companies or other trading agents:2
“For the purposes of this code, the manufacturer should be construed to refer to the invoicing
party or parties (manufacturers or other direct suppliers). The name and address of the invoic-
ing party, whose invoice accompanies the CBP entry, should be used to construct the MID.”
(U.S. Department of Homeland Security (2012)).
Customs Directive No. 3550-055 lays out the current method for deriving the MID for
manufacturers and shippers.3 The MID consists of an alphanumeric code that is constructed
according to a pre-specified algorithm, using information on the seller’s name and address from
the importer’s official invoice. The derivation (known as “keylining”) is as follows: the first two
characters of the MID must contain the two-digit ISO country code of the supplier, the next
three characters the start of the first word of the exporter’s name, the next three characters
the start of the second word, the next four characters the beginning of the largest number of
the street address of the foreign exporter, and the last three characters the start of the foreign
exporter’s city (see Table 1 for stylized examples).4 The MID has a maximum length of fifteen
characters.
The multi-step process for constructing the MID described above may raise concerns about
potential for erroneous data entry. There are some mitigating factors, though. First, 96%
of all entries are filed electronically through the CBP’s Automated Broker Interface, which
reduces the probability of misspellings, illegibility or incorrectly filed MIDs. Second, it is very
common to either employ in-house licensed customs brokers to facilitate the import process
or use outside customs brokerage service providers to handle the shipment clearance process.
Customs Broker License Examinations administered by CBP (passage of which is required
if transacting customs business on behalf of others) typically include questions about MID
construction.5 Third, customs brokers utilize specialized software that includes validation checks
2Due to strict rules-of-origin requirements, the MID for textile shipments represents “the entity performingthe origin-conferring operations”, based on Title 19 Code of Federal Regulations (CFR). See http://www.gpo.gov/
fdsys/pkg/CFR-2011-title19-vol1/pdf/CFR-2011-title19-vol1-sec102-23.pdf. Textile products include both textileor apparel products as defined under Section 102.21, Title 19, CFR.
3See http://www.cbp.gov/document/directives/3550-055-instructions-deriving-manufacturershipper-identification-code.4See page 7 at http://forms.cbp.gov/pdf/7501_instructions.pdf for a description of the MID and Ap-
pendix 2 at the same link for more detailed instructions on constructing MIDs.5See http://www.cbp.gov/trade/broker/exam/announcement for details about the exam. http://www.cbp.
6

on entry data to prepare and transmit invoices electronically to CBP, such as SmartBorder.6 In
particular, SmartBorder software can store customer information that auto-populates, thereby
further reducing errors due to manual data entry.
2.2 Official Uses of the MID
Why does the MID exist? We have found that the MID field was included on U.S. CBP forms
pursuant to the program of exchanging trade data for statistical purposes between the U.S. and
Canadian governments: Canada uses the MID to augment its domestic data on establishment
activity with export information. The Government of Canada does not independently collect
export filings to the United States. Instead, they substitute U.S. import statistics for Canadian
exports to the U.S. in accordance with a 1987 Memorandum of Understanding, signed by the
U.S. Census Bureau, U.S. CBP, Canadian Customs, and Statistics Canada.7 Based on extensive
discussions with employees at the U.S. Census Bureau and Statistics Canada, we believe that
the data exchange provided the main impetus for the generation of the MID. Filling out the
MID was made a requirement for U.S. imports from all countries soon after.
What does the U.S. government use the MID for, and why would it have the incentive to
ensure U.S. firms are writing down the identity of their foreign partners correctly? According to
U.S. law, there are two apparent reasons. First, the MID is utilized in national security programs
such as the Customs-Trade Partnership Against Terrorism (C-TPAT). An active MID is required
to be qualified for the program. Companies that join C-TPAT “sign an agreement to work
with CBP to protect the supply chain, identify security gaps, and implement specific security
measures and best practices.8 C-TPAT members are less likely to be subject to examinations at
the port since they are considered “low-risk”. The CBP reports that the program covers about
10,000 companies, accounting for over 50 percent of U.S. import value.
Second, the United States enforces trade-related regulatory requirements that rely on the
identity of foreign suppliers to the U.S. For instance, anti-dumping measures are foreign-firm
specific in nature. Furthermore, it is clear from U.S. regulations that the MID is used to track
compliance with U.S. restrictions for textile shipments. MID criteria for textiles are the most
gov/document/publications/past-customs-broker-license-examinations-answer-keys includes sample exam questionsand answer keys. Questions 5 and 12 on the April 2014 examinations ask about MID construction.
6See http://www.smartborder.com/newsb2/ProductsSmartBorderABI.aspx.7This is a reciprocal data exchange, designed to reduce respondent burden, where Canada provides U.S.
Canadian merchandise import shipments from the U.S. that the U.S. substitutes for exports to Canada.8http://www.cbp.gov/border-security/ports-entry/cargo-security/c-tpat-customs-trade-partnership-against-terrorism
7

stringent, since non-textile products typically do not have the rule-of-origin restrictions that
exist for textile and apparel products. If an entry filed for textile shipments fails to include the
MID properly constructed from the name and address of the manufacturer, the port director
may reject the entry or take other appropriate action. The preceding discussion highlights the
regulatory imperatives to provide an accurate MID and the incentives for U.S. importers to
accurately identify the foreign manufacturers from whom they are importing.
2.3 Missing MIDs
The previous sections described the construction of the MID on the part of the U.S. importing
firm as mandatory, thus providing a window into the universe of suppliers exporting to the
United States. The field is not always populated, however: MIDs are missing in 1.9 percent of
the 59 million import transactions in 2011. On a value-weighted basis, 13 percent are missing
an MID, indicating that transactions without MIDs tend to be large.
Why might an MID be missing? We report coefficients from regressing a dummy variable
equal to one for a missing MID on a host of covariates and report the results in Table 2. The
first column- based on importer size bins- shows that bigger buyers are more likely to be missing
MIDs. One possible explanation for this is that 98.8 percent of missing MIDs (and thus, some
big importers) are associated with foreign-trade zone transactions. A foreign-trade zone is a
designated location in the United States where companies are allowed to delay or reduce duty
payments on foreign merchandise and have access to streamlined customs procedures.9 Since
firms that import in high volumes at a regular frequency are the main participants in FTZs,
they tend to be larger firms.
Table 2 also shows that related party transactions are less likely to be missing an MID,
while broad sectors such as “footwear/headgear”, “hides/skins/furs/leather”, and “machin-
ery/electrical” are more likely to be found without an MID.10 Transactions with European
source countries tend to have a higher likelihood of missing MIDs on average, while the Amer-
icas tend to have a lower likelihood. Our takeaway is that transactions without MIDs tend to
be conducted by larger importers, but do not vary systematically across sectors or countries.11
9There are about 250 foreign-trade zones in the United States. See http://enforcement.trade.gov/ftzpage/info/ftzstart.html.
10“Related parties” refer to transactions with shared ownership or interest (see Section 3.2). The “broadsector” classification contains 15 sectoral groupings derived from grouping similar HS2 categories (see AppendixB).
11These patterns suggest an area for further research on using probabilistic matching to assign a MID to such
8

2.4 Checking Exporter Identification under MID Rules
Even if U.S. importers are completing the MID correctly, there remains the possibility that
the information collected is too limited to uniquely identify distinct suppliers.12 Foreign pro-
duction data can be used to construct “MID”s according to the rules laid out above, allowing
determination of how often this identifier uniquely identifies the foreign country’s suppliers.13
We carry out this exercise using Chinese production data, translating the universe of exporter
names and addresses from the Chinese Annual Survey of Industrial Firms (ASIF) in 2005
and constructing “MID”s following the algorithms set forth by CBP. This allows us to assess
(indirectly): How common is it for an MID to uniquely identify an exporter, both overall and
within a sector? Are different cities combined into a single city when only identified with three
letters? The firm-level data is collected by the Chinese National Bureau of Statistics (NBS), and
we romanize Chinese characters according to the Hanyu Pinyin system.14 We use the 4-digit
China Industrial Classification (CIC) to report sectoral results.
This is not an attempt to link Chinese exporter information in the ASIF to the actual MIDs
reported in U.S. import data; rather, the results below are only a general test of MID rules.
We highlight three caveats that our findings are premised on. One, observations of Chinese
production data are at the firm level, while the MID is meant to capture manufacturers. Second,
it is possible that a single supplier appears multiple times by different filers in the U.S. import
data, while the information on the manufacturing census is a year-end snapshot, presenting
additional opportunity for discrepancies. Finally, we note the possibility that our concordance
between Chinese characters and English may differ from what reporting firms use, or that
Chinese firms may not use a direct translation of their name on their invoices.
We begin with results on uniqueness. Overall, the ASIF reports approximately 75,000
exporters in 2005. The “MID” is unique for 63.4 percent of the reported exporters. This
raises a non-negligible possibility of MID duplication when used in a vacuum without any other
transactions. Large importers have more transactions. If an importer in a FTZ imports a similar product fromthe same country from a non-FTZ location and reports the MID in the non-FTZ transaction, it may be possibleto assign a likely MID to the missing transactions.
12Using the MID to study supplier switching across or within cities may also pose challenges as countries mayhave multiple cities that begin with the same three letters. City codes have been used to study buyer-supplierrelationships within and across countries in conjuction with country-specific knowledge (Kamal and Sundaram(2016); Kamal and Sundaram (2017); Monarch (2014))
13Note this exercise simply checks how capable the MID coding procedure is for uniquely identifying suppliersand does not require linking directly to U.S. import data.
14In general, we take two to three Chinese characters to be one word of the company name. More detail isprovided in Appendix C.
9

identifying information. The first line of Table 3 Panel (a) shows that out of 515 total CIC-4
sectors, the average sector has 95.7 percent of its exporters uniquely identified by an “MID”,
a major improvement. Limiting to sectors with large numbers of exporters still shows greater
uniqueness- among sectors with over 1000 exporters, 84.7 percent of exporters are uniquely
identified by an “MID”. Even adding 2-digit sectors significantly improves the identification,
as shown in the bottom half of Panel (a). Thus a supplier identifier combined with industry
information greatly increases the likelihood of generating unique identification.15 That said,
there is a large discrepancy between the number of Chinese exporters according to the Chinese
data and that calculated according to the U.S. data- there were about 173,000 MIDs from
China in 2005, over twice as many as in the NBS data.16 As we will show in Section 4.1, this is
large compared to other country sources, so where necessary, we present our empirical results
excluding China in order to establish robustness of our findings.
Table 3 Panel (b) uses the same augmented Chinese production data, but illustrates how
common it is for a sector to have multiple cities with the same three-letter city code. With 145
cities of over 1 million people in 2010, China represents a difficult country for trying to identify
cities uniquely with only three letters. The table shows that the more cities that export a
particular CIC-4 category, the smaller the share of unique city identification within that CIC-4
category. Even so, in the average CIC-4 sector, cities are uniquely identified by their code 86.8
percent of the time.
3 Cleaning Methodology and Summary Statistics
For the reasons laid out above, we believe that even in its raw form, the MID is likely to provide
a useful foundation for identifying foreign suppliers to the U.S. Nonetheless, we undertake both
probabilistic matching methods and basic checks in order to increase the reliability of the data.
In this section, we describe our methodology for cleaning the MID and offer some summary
measures of the resulting supplier data. We use the 2011 LFTTD in our main empirical analyses.
The first stage of our cleaning implements a number of common sense adjustments to the
MID. We exclude MIDs that do not conform to the algorithm outlined in the CBP Form 7501
15Although the CIC classification system also comes from non-U.S. data, it is similar to the U.S. SIC classi-fication (Brandt et al. (2012)). This is why SIC/NIACS industry classifications (or the even more detailed HSclassification) are likely to strengthen identification of foreign suppliers in U.S. data.
16We discuss reasons why counts from U.S. data often exceed those of source country data in Section 4.1.
10

Instructions, including MIDs that are a series of numbers, MIDs that do not have three letters
for the city code (one common mistake is for suppliers from New Territories, Hong Kong to
have their city code written NT, resulting in a misspecified city code), and the like. We also
exclude MIDs that have a country code corresponding to no known ISO2 code.
3.1 Bigram Matching
We use a character matching protocol known as bigram matching to combine very similar MIDs
into a single MID. A bigram is an approximate string comparator, computed from the ratio of
the number of common two-letter combinations within the two different strings and the average
string length minus one. We use the STATA-based bigram matching algorithm developed by
Wasi and Flaaen (2015). All possible MID pairs within a country are assigned a field similarity
score in order to set a standard for determining if any MID is “similar enough” to another
MID.17 Appendix A provides examples of pairs and their associated field-similarity score.
How similar should two MIDs be in order to consider them the same supplier? We identify
a few rules of thumb for field-similarity (where 1 means a 100 percent match): a score of 0.98
or higher tends to match MIDs with a few characters being different, while scores between 0.97
and 0.98 tend to match MIDs that are identical in all aspects, other than one has a numeric
address field and the other does not. A score of 0.99 or higher typically has only a single
character being different. For our main results, we adopted a field-similarity score of 0.98, such
that we are likely to combine MIDs that differ due to simple typographical errors (for instance,
one character differences or one MID only using the first name of a company), but we will
consider similar MIDs with different addresses as different suppliers. We believe this standard
is sufficiently conservative, so as to allow for the possibility of simple coding errors, while still
being stringent enough to not combine two distinct suppliers.18
The implementation procedure is as follows: within a country, we match each MID to every
other MID, and generate a field similarity score. If the field similarity score for a match is 0.98
or above, then we will consider those MIDs to be the same. If multiple MIDs are found to be
similar to the same MID, then all of those MIDs will be considered to be the same supplier.19
17Other papers that use bigram matching include Anderson et al. (2015), Ernstberger and Gruning (2013),Flaaen (2014), Green and Jame (2013),Chodorow-Reich (2014), and Braun and Raddatz (2010).
18We also implement a match score of 0.99 for some of the analysis in the web appendix.19For example, if supplier A and supplier B are both similar to supplier C, then we consider supplier A, B,
and C to be the same supplier, even if A and B are not found to be similar to each other (a situation that is
11

Retaining one MID per group leaves a “best MID” (or BMID) variant for each MID in the
underlying data, which enables us to generate relationships and other supplier-specific variables
(such as size) at the BMID level.20 All told, these changes together with the above methodology
end up reducing the total number of suppliers in 2011 from 1,287,630 to 911,765, a 29% decrease.
3.2 Cross-validation Tests of the BMID
In this section, we offer two tests in order to assess how well the bigram matching procedure
is capable of grouping together similar MIDs and hence the extent to which the BMID can be
viewed as a valid identifier of foreign suppliers to the United States.
First, we examine related party trade relationships. U.S. firms are required to write down
(in Column 32C, Form 7501) whether the transaction took place between “related parties”
according to Section 105.102(g), Title 19 CFR, meaning one party has a 5% controlling interest
in the other, or the parties have an employer/employee relationship, share offices or directors,
or are family members or partners. In theory (excluding within-year ownership changes), a U.S.
firm and its supplier should either have all of their transactions classified as related, or none.
This implies that when examining the raw MID in relation to the BMID, we would expect a
smaller fraction of total relationships that are marked as being related in one transaction while
having a missing or unrelated indicator in another. Consistent with our hypothesis, when using
the BMID, we find a decrease, from 5.8 to 5.5 percent, in the share of relationships that mix
the related and non-related indicators across transactions.
Second, we examine if the changes are consistent with other information in the U.S. import
data, including sector, product and buyer information.21 The exercise is as follows: Suppose
the bigram matching method designates Supplier A to be the same as Supplier B in 2011, and
thus Supplier A’s MID is replaced with Supplier B’s. How often do Supplier A and Supplier B
share all the same sectors, products, or buyers? How often do they share any sector, product,
or buyer?22 Table 4 presents the results. At our preferred score of 0.98, 64 percent of changed
MIDs have any “broad sector” in common with the MID they are being changed to, 40.1 percent
exceedingly rare). In this work, we are agnostic about which variant of the MID (in this example, A,B, or C)should be retained, choosing randomly.
20The related party status of a BMID relationship with both related and non-related party transactions willbe random.
21We thank two anonymous referees for this suggestion.22We examine these categories in 2010 for matches made in 2011.
12

share the same HS2 code, 26.5 percent share the same HS10 code, and 30.4 percent share the
same buyer (U.S. importer). In comparison, if an MID is randomly matched to some other MID
within its country, the probability the two MIDs share any broad sector is 4.1 percent, any HS2
category is 2.3 percent, any HS10 category is 0.3 percent, and any buyer is 0.6 percent.23 This
comparison highlights that the bigram matching method groups MIDs that share characteristics
other than the identifier itself, even though the routine does not require matches within products
or buyers. We thus believe that our probabilistic matching routine, resulting in the BMID, is
capable of identifying “similar ” MIDs, providing an improved identifier of foreign suppliers.
3.3 Describing the MID Sample
We next illustrate some of the properties of our sample, using the BMID. The minimum length
of any BMID in the data is 11 characters, and the maximum is 15 characters. Table 5 shows
that BMIDs are almost evenly split between 11,12,13,14 and 15 characters. 19 percent of these
codes are the maximum length allowable- 15 characters. Table 6a shows how often the address
component of the BMID is populated: the vast majority of BMIDs (89 percent) have at least
some address information included.24
A potential issue concerning the address component of the MID is the presence of non-
numeric address conventions in Latin America. For example, according to a 2007 Los Angeles
Times article, “most Costa Rican address are expressed in relation to the closest community
landmark”.25 Theoretically, this could result in fewer fully-populated address codes.26 Table 6b
shows that BMIDs from South America and “Mexico and Central America” do not actually
exhibit lower rates of numeric address components compared to other regions. Europe, Asia,
and Africa all have larger fractions with no address information. However, Costa Rica (Table 6c)
is an exception, as about 18 percent of Costa Rican MIDs have no address information. Table 6b
also shows that North American MIDs (predominantly Canada) have full address information
for almost half of all MIDs, not surprising given that Statistics Canada successfully matches
23These probabilities are calculated by repeating the following procedure 50,000 times: select a random MIDin 2011, assign it another random MID in the same country, and calculate the frequency that they share thesame broad sector, HS2, HS10 or buyer.
24Leading zeroes are not allowed in the address component- since the preceding and following fields can onlybe based on letters, we can isolate how many numbers (if any) the address field of the MID contains.
25“With Costa Rica’s mail, it’s address unknown”, by Marla Dickerson. November 5, 2007 http://articles.
latimes.com/2007/nov/05/business/fi-crmail5.26Some of the examples from the article- such as “125 meters west of the Pizza Hut” or “200 meters south of
the cemetery, cross the train tracks, white two-story house”- do have numeric characters, though it is impossibleto tell if suppliers actually include this information on their invoice.
13

MIDs to their domestic establishments.
An additional concern may be that the direct supplier of the good is not being used to
generate the MID, with the U.S. importing firm instead simply writing down an MID corre-
sponding to its intermediary or trading firm. Even though CBP expressly warns against doing
so, we know that intermediaries play an integral role in facilitating international trade, so there
is certainly some possibility of it occurring. One way to assess this is to examine the number of
product or industry categories an MID-identified supplier is shipping. Intermediaries are more
likely to export products spanning different industries (Ahn et al. (2011)), while manufacturers
are more likely to possess a core competency- there may be few benefits from producing apples,
socks, and vacuum cleaners at the same facility. Table 7 shows that 96 percent of BMIDs export
5 or fewer HS2 codes, and 97 percent of BMIDs export 10 or fewer HS10 codes. In subsequent
analysis, we exclude BMIDs with more than 10 HS2 codes from our sample.
4 Findings from Relationship-Level Trade Data
In this section, we present a set of empirical regularities, relying on our BMID variable and the
1,579,983 importer-exporter relationships formed by the combination of a BMID and a U.S.firm
identifier.
4.1 Comparisons with Foreign Export Data
We use foreign data on the number of exporters exporting to the U.S. in 2011, and compare the
total to the number of exporters calculated using U.S. data, stratifying by both country and
sector. We use the World Bank’s public-use Exporter Dynamics Database (EDD) that contains
destination-specific information on exporting firms for 70 countries between 1997 through 2014
(Cebeci et al. (2012)). The source of the underlying micro data, which is not publicly available,
varies from national government statistics (such as in Peru) to figures collected by private
companies (such as in Chile) and are thus wholly different sources than the U.S. customs data.
The idea is to compare statistics from the two distinct sources and analyze how closely they
align, keeping in mind that the definition of what exactly constitutes a foreign exporter is
specific to the U.S., and need not match across different countries.
The country comparison is presented in Table 8. The table contains 41 countries, a num-
14

ber determined by both the availability of destination specific data and official Census Bureau
disclosure rules. The total number of exporters calculated from the EDD is 73% of the total
using U.S. data.27 For some countries, such as Mexico and Spain, the exporter counts match
particularly well, while others, such as Germany and Portugal, show much less agreement. Why
might using the Manufacturer ID to generate counts of firms exporting to the U.S. result in too
many exporters relative to source country data? One answer rests on one of CBPs requirements
in constructing the Manufacturer ID: trading companies, sellers other than manufacturers, and
similar trading agents cannot be used to create MIDs. Since source countries may count in-
termediaries (who purchased from multiple manufacturers) as exporters in their customs data,
origin-country data compared to the U.S. data is likely to yield lower counts of exporters. An-
other reason for differences is that MIDs are potentially written down multiple times by different
importing firms throughout a year, while firm-level export data is collected only a single time.
Thus if firm names change over time, or importing firms construct the MID differently, U.S.
data will report a greater number of foreign exporters.
Next, we show a comparison of different exporter counts by “broad sector”.28 The EDD
contains the number of exporters to the U.S. in a HS2 category for each country in Table 8.
We sum these counts across countries by HS2 sector, aggregate to the “broad sector” level,
then compare it to the same object in the U.S. data.29 Table 9 shows that counts within
sector groupings match fairly well on average, with a few exceptions- the number of “Chemical
and Allied Industries” exporters in the U.S. data exceeds the number in the EDD data by a
factor of 4, and “Wood & Wood Products” by a factor of 3. The EDD/LFTTD count ratio for
textiles- which we had described earlier as being a likely candidate for well-constructed MIDs-
is extremely close to one, as are sectors such as Plastics, Footwear/Headgear, and others.
4.2 Dynamic Behavior of Suppliers
One key feature of the import data is that importer-exporter relationships are extremely short-
lived. Monarch and Schmidt-Eisenlohr (2016) find that close to half of all U.S.-foreign supplier
relationships in 2011 are newly created. We use BMIDs to demonstrate that exporter exit is,
27Section 2.4 showed that exporter counts from Chinese data (not in the EDD) are also substantially smallerthan the same count from U.S. data.
28We thank two anonymous referees for suggesting this analysis.29This exercise uses the number of exporter-HS2 combinations (not the number of unique exporters) within
each “broad sector”, since we cannot eliminate exporters who export more than one HS2 sector within a “broadsector” in the EDD. Thus the results of this exercise are not directly comparable to Table 8.
15

in fact, extremely high. Table 10 shows that of all BMIDs found in 2011, only 54 percent are
found in the U.S. data in 2010, while only 56 percent are found in 2012. The similarity to the
relationship numbers in previous work shows that exporter exit accounts for a large share of
relationship dissolution over time, as fewer and fewer exporters manage to survive into later
years. Importantly, as the second row of the table demonstrates, this stylized fact is unchanged
when considering simply the raw MID variable in place of our BMID variable, meaning that
collapsing similar MIDs does not alter dynamic features of the supplier data. One other salient
fact about suppliers over time is they do occasionally change their exported product: about 68
percent of MIDs have the same HS2 category or set of categories in 2011 that they had in 2010.
4.3 Exporting Country can differ from Producer Country
Returning again to the Form 7501 shown in Figure 1, note that in addition to the Manufacturer
ID (Box 13), importers also have to complete a field for the exporting country of a product
(Box 14). We find that in 17 percent of relationships (accounting for 29 percent of total U.S.
imports), the exporting country does not match the supplier’s “country of origin” as denoted
by the first two characters of the MID.
Why might the exporting country differ from the origin country? CBP Instructions state
that “[t]he country of exportation is the country of which the merchandise was last part of the
commerce and from which the merchandise was shipped to the U.S. without contingency of
diversion.” (U.S. Department of Homeland Security (2012)). In practice, based on discussions
with U.S. Census Bureau staff, such a discrepancy likely means that the “exporting country”
is re-exporting the goods. In other words, if already-produced goods were not substantially
transformed, but instead repackaged or re-sold from a second country, then the second country
would be listed as the official exporting country.
Given that aggregate trade statistics for the U.S. are calculated using the exporting country,
rather than the “country of origin” derived from the MID, one can see how different U.S. trade
patterns may look if goods were traced all the way back to their actual production location.
Table 11 presents the top 10 exporters to the U.S. in 2011 by both origin and production
countries. Interestingly, although China is the top source by either measure, its share of total
U.S. imports drops when measured by the country of origin. This fits with the general intuition
laid out above, as China is a major re-exporter with a comparatively low value-added to export
16

ratio (Johnson and Noguera (2012)). It is also apparent that more exports to the U.S. originate
in Mexico than indicated by aggregate data, while the reverse is true for Canada.
4.4 Related Party Relationships
According to official Census Bureau trade statistics, trade within related parties typically ac-
counts for about 40 percent of all U.S. annual merchandise imports. Since we can use the
BMID to identify related-party relationships in the data, we can contrast them to arm’s-length
relationships. We find that related-party relationships occupy a very small share of total rela-
tionships, only 6.6 percent. In order for such a small share of total relationships to account for
a much larger share of trade, it must be the case that these relationships are associated with
high-value transactions. Indeed, a simple regression with product and source country fixed
effects shows that related party relationships- at the buyer-supplier-product level- trade more
than non-related parties (Table 12 Column 1). We also find that related party relationships
tend to have higher unit values (Table 12 Column 2). This effect is precisely estimated, as we
use trade and unit values at the relationship-level, rather than at the firm level only.
As we documented in Section 2.4, there is a substantial difference in the number of Chinese
exporters to the U.S. across datasets. Therefore, as a robustness check, we run the same
specification as above, excluding China. The results remain qualitatively similar- related parties
have higher trade values and higher prices compared to non-related party trade relationships.
4.5 Relationships and Country Characteristics
Using our BMID measure, Table 13 shows which countries have the most supplier relationships
with the U.S. in 2011. Over a quarter of all importer-exporter relationships in 2011 were
between U.S. buyers and mainland Chinese suppliers, a share that bumps up to one-third of all
relationships if we include Hong Kong. The rankings are not significantly altered by restricting
only to MIDs found in both 2010 and 2011, or by using 2010 data alone, as shown in Panels
(b) and (c).
We next examine why some source countries have more U.S. relationships than others. We
estimate a gravity-like specification, regressing a host of country attributes on the (log) number
of supplier relationships and the average trade value per relationship. Table 14 shows that
larger countries (measured by log GDP) tend to have more relationships, and also have more
17

value per relationship. Farther away locations and source countries without a common language
with the U.S. have fewer relationships, while being in a regional trade agreement with the U.S.
strongly predicts both more relationships and higher trade per relationship.
As described above, the textile industry is one where we believe MIDs are particularly likely
to represent the manufacturer, given the importance in U.S. law of establishing a proper country
of origin for textile products. For this reason, we also conduct our gravity specification using
only products that are classified as textiles in the HS system- HS2 50 through 63. As can be
seen in the right side of Table 14, the key results of a positive effect of GDP on the number
of supplier relationships with the U.S. holds, as does the effect of being in a regional trade
agreement.
5 Summary
This paper investigates the properties of the Manufacturer ID variable that identifies the foreign
supplier in a U.S. merchandise import transaction, and uses it to study U.S. importer- foreign
exporter relationships. We document the rules and laws that govern the generation of the MID,
then propose a set of cleaning algorithms and procedures meant to augment the reliability of the
MID as a measure of unique foreign suppliers. This includes collapsing very similar MIDs into
one, as well as common-sense checks for erroneous entries. Finally, we illustrate new findings
about foreign buyers and their relationships with U.S. buyers.
In any national dataset attempting to measure information on foreign firms, there are bound
to be questions about the underlying reliability. The results of our study indicate that when
used appropriately, the Manufacturer ID can be an important part of deeper investigations
of buyer and supplier relationships in international trade. Our findings offer the first set of
systematic evidence in identifying potential issues with using the MID and methods to modify
the MID in order to address pertinent concerns. One aspect we have not addressed in this
paper is the dynamic nature of buyer-supplier relationships: combining similar MIDs into one
is relatively straightforward in a single year, but becomes extremely computationally intensive
when trying to implement the procedure over time. We see this as the next step in continuing
to refine and improve foreign supplier identification in U.S. merchandise import data.
18

References
Ahn, JaeBin, Amit K. Khandelwal, and Shang-Jin Wei, “The role of intermediaries in
facilitating trade,” Journal of International Economics, 2011, 84 (1), 73–85.
Anderson, Michael A., Martin H. Davies, Jose E. Signoret, and Stephen L.S. Smith,
“Firm Heterogeneity and Export Pricing in India,” 2015.
Benguria, Felipe, “Production and Distribution in International Trade: Evidence from
Matched Exporter-Importer Data,” 2014. Mimeo.
Bernard, Andrew B., Andreas Moxnes, and Karen Helene Ulltveit-Moe, “Two-sided
Heterogeneity and Trade,” Working Paper 20136, National Bureau of Economic Research
2014.
Blum, Bernardo S., Sebastian Claro, and Ignatius J. Horstmann, “Occasional and
Perennial Exporters,” Journal of International Economics, 2013, 90 (1), 65–74.
Brandt, Loren, Johannes Van Biesebroeck, and Yifan Zhang, “Creative accounting or
creative destruction? Firm-level productivity growth in Chinese manufacturing,” Journal of
Development Economics, 2012, 97 (2), 339–351.
Braun, Matıas and Claudio Raddatz, “Banking on politics: when former high-ranking
politicians become bank directors,” The World Bank Economic Review, 2010, pp. 1–46.
Carballo, Jeronimo, Gianmarco IP Ottaviano, and Christian Volpe Martincus, “The
Buyer Margins of Firms’ Exports,” Discussion Paper 9584, CEPR 2013.
Cebeci, Tolga, Ana Fernandes, Caroline Freund, and Martha Pierola, “Exporter
Dynamics Database,” Policy Research Working Paper 6229, World Bank 2012.
Chodorow-Reich, Gabriel, “The employment effects of credit market disruptions: Firm-level
evidence from the 2008–9 financial crisis,” The Quarterly Journal of Economics, 2014, 129
(1), 1–59.
Dragusanu, Raluca, “Firm-to-Firm Matching Along the Supply Chain,” 2014. Harvard Uni-
versity, mimeo.
Eaton, Jonathan, Marcela Eslava, Cornell J. Krizan, Maurice Kugler, and James
Tybout, “A Search and Learning Model of Export Dynamics,” 2014.
19

Ernstberger, Jurgen and Michael Gruning, “How do firm-and country-level governance
mechanisms affect firms disclosure?,” Journal of Accounting and Public Policy, 2013, 32 (3),
50–67.
Flaaen, Aaron, “Multinational Firms in Context,” Working Paper, University of Michigan
2014.
Green, T. Clifton and Russell Jame, “Company name fluency, investor recognition, and
firm value,” Journal of Financial Economics, 2013, 109 (3), 813–834.
Heise, Sebastian, “Firm-to-Firm Relationships and Price Rigidity: Theory and Evidence,”
2016. SSRN Working Paper 2898148.
Johnson, Robert and Guillermo Noguera, “Accounting for intermediates: Production
sharing and trade in value added,” Journal of International Economics, 2012, 86, 224–236.
Kamal, Fariha and Asha Sundaram, “Buyer-Seller Relationships in International Trade:
Do Your Neighbors Matter?,” Journal of International Economics, 2016, 102, 128–140.
and , “Spatial Concentration of Sourcing in International Trade: The Role of Institutions,”
2017. Mimeo.
Melitz, Marc, “The Impact of Trade on Intra-Industry Reallocations and Aggregate Industry
Productivity,” Econometrica, 2003, 71 (6), 1695–1725.
Monarch, Ryan, “It’s Not You, It’s Me: Breakups in U.S.-China Trade Relationships,” Work-
ing Paper 14-08, U.S. Census Center for Economic Studies 2014.
and Tim Schmidt-Eisenlohr, “Learning and the Value of Trade Relationships,” 2016.
Pierce, Justin R. and Peter K. Schott, “The Surprisingly Swift Decline of U.S. Manufac-
turing Employment,” Working Paper 18655, National Bureau of Economic Research 2012.
U.S. Department of Homeland Security, “CBP Form 7501 Instructions,” 2012.
Wasi, Nada and Aaron Flaaen, “Record Linkage using STATA: Preprocessing, Linking and
Reviewing Utilities,” The Stata Journal, 2015, 15 (3), 672–697.
20

Figures and Tables
Figure 1: CBP Form 7501
DEPARTMENT OF HOMELAND SECURITY U.S. Customs and Border Protection
3. Summary Date
4. Surety No. 7. Entry DateENTRY SUMMARY9. Mode of Transport 10. Country of Origin 11. Import Date
12. B/L or AWB No. 13. Manufacturer ID 14. Exporting Country 15. Export Date
16. I.T. No. 17. I.T. Date 18. Missing Docs 19. Foreign Port of Lading 20. U.S. Port of Unlading
21. Location of Goods/G.O. No. 22. Consignee No. 23. Importer No. 24. Reference No.
25. Ultimate Consignee Name and Address 26. Importer of Record Name and Address
27. 28. Description of Merchandise 32. 33. 34.
29. 30. 31.Duty and I.R. Tax
Line No.
Dollars Cents
35. Total Entered Value CBP USE ONLY TOTALSOther Fee Summary for Block 39
A. LIQ CODE B. Ascertained Duty 37. Duty
REASON CODE C. Ascertained Tax 38. Tax
D. Ascertained Other 39. Other
E. Ascertained Total 40. Total
SIGNATURE DATE
42. Broker/Filer Information (Name, address, phone number) 43. Broker/Importer File No.
CBP Form 7501 (06/09)
8. Importing Carrier
TITLE41. DECLARANT NAME
1. Filer Code/Entry No. 2. Entry Type
36. DECLARATION OF IMPORTER OF RECORD (OWNEROR PURCHASER) OR AUTHORIZED AGENT
Form Approved OMB No. 1651-0022 EXP. 10-31-2017
City State Zip City State Zip
$Total Other Fees
$
I declare that I am the
I also declare that the statements in the documents herein filed fully disclose to the best of my knowledge and belief the true prices, values, quantities, rebates, drawbacks, fees, commissions, and royalties and are true and correct, and that all goods or services provided to the seller of the merchandise either free or at reduced cost are fully disclosed.
Importer of record and that the actual owner,
was not obtained pursuant to a purchase or agreement to purchase and the statements in the invoices asto value or price are true to the best of my knowledge and belief.
I will immediately furnish to the appropriate CBP officer any information showing a different statement of facts.
or purchaser or agent thereof.purchaser, or consignee for CBP purposes is as shown above, owner
I further declare that the merchandise was obtained pursuant to a purchase or agreement to purchase and that the OR
ORprices set forth in the invoices are true,
5. Bond Type 6. Port Code
A. HTSUS No. B. ADA/CVD No.
A. Grossweight B. Manifest Qty.
Net Quantity in HTSUS Units
A. Entered Value B. CHGS C. Relationship
A. HTSUS Rate B. ADA/CVD Rate C. IRC Rate D. Visa No.
21

Table 1: Stylized Examples of Manufacturer ID
Country Exporter Name Address City MIDBangladesh Red Fabrics 1234 Curry Road Dhaka BDREDFAB1234DHA
France Green Chemicals 555 Baguette Lane, #1111 Paris FRGRECHE1111PARRepublic of Korea Blue Umbrellas 88 Kimchi Street Seoul KRBLUUMB88SEO
Note: The above examples are based on fictitious names and addresses.
Table 2: Determinants of Missing MIDs
(1) (2) (3) (4) (5)SizeSize Q2 0.017*** 0.027***
(0.000) (0.000)Size Q3 0.023*** 0.037***
(0.000) (0.000)Size Q4 0.035*** 0.045***
(0.000) (0.000)Related Party StatusRelated Party -0.035*** -0.046***
(0.000) (0.000)SectorMineral Products 0.023*** 0.039***
(0.000) (0.000)Chemical Products 0.013*** 0.017***
(0.000) (0.000)Plastics and Rubber 0.022*** 0.022***
(0.000) (0.000)Hides / Skins / Leather / Fur 0.026*** 0.013***
(0.000) (0.000)Textiles 0.009*** -0.001***
(0.000) (0.000)Footwear / Headgear 0.042*** 0.023***
(0.000) (0.000)Base Metals 0.016*** 0.013***
(0.000) (0.000)Machinery / Electrical 0.025*** 0.022***
(0.000) (0.000)Vehicles 0.022*** 0.028***
(0.000) (0.000)Optical and Arms 0.017*** 0.011***
(0.000) (0.000)SourceNorth America -0.018*** -0.027***
(0.006) (0.006)Central America -0.014*** -0.008
(0.006) (0.006)South America -0.013*** -0.004
(0.006) (0.006)Europe 0.022*** 0.026**
(0.000) (0.000)Asia 0.004 -0.002
(0.006) (0.006)Australasia and Oceania -0.016*** -0.012**
(0.006) (0.006)Africa -0.001 0.005
(0.006) (0.006)Constant 0.001*** 0.035*** 0.001*** 0.019*** -0.002
(0.000) (0.000) (0.000) (0.006) (0.006)𝑅2 0.01 0.02 0.01 0.01 0.05
Note: The dependent variable is 1 if a transaction’s MID is missing. Omitted catgeories are Q1, arm’s length,live animals, and Puerto Rico & U.S. posessions. There are 46,000,000 observations.

Table 3: Analysis of MIDs as Constructed from China Industrial Production Data
(a) Uniqueness of the “MID”, 2005
# of CIC4s % of Unique “MID”s per CIC4
Average CIC4 515 95.7Average CIC4 among CIC4s with > 100 Exporters 185 92.1Average CIC4 among CIC4s with > 500 Exporters 24 83.8Average CIC4 among CIC4s with > 1000 Exporters 7 84.7
# of CIC2s % of Unique “MID”s per CIC2
Average CIC2 39 87.5Average CIC2 among CIC2s with > 100 Exporters 32 85.2Average CIC2 among CIC2s with > 500 Exporters 27 84.6Average CIC2 among CIC2s with > 1000 Exporters 22 84.9
Note: This panel uses name, address, and city information from China NBS data to construct an “MID” for
each exporter, following rules from U.S. CBP Form 7501. CIC4 is the 4-digit China Industry Code, and CIC2 is
its 2-digit counterpart. For the English name of the firm, the Hanyu Pinyin romanization of Chinese characters,
with two to three characters per word, is used. An “MID” is unique if it corresponds to one faren daima firm
identifier.
(b) Uniqueness of the City Code
# of CIC4s % of Unique City Codes per CIC4
Average CIC4 515 86.8Average CIC4 among CIC4s with > 10 Cities 417 84.0Average CIC4 among CIC4s with > 50 Cities 97 72.6Average CIC4 among CIC4s with > 100 Cities 11 64.4
Note: This panel uses city codes from the “MID”s constructed above. A city code- the first three letters of a
city- is unique if there is only one city with that code in a CIC4 industry.
Table 4: Validity Checks for Bigram Matching Results
Broad Sector HS2 HS10 Buyer
% of Changed MIDs that match any: 64.0% 40.1% 26.5% 30.4%% of Random MID pairs that match any: 4.1% 2.3% 0.3% 0.6%
% of Changed MIDs that match all: 47.4% 23.9% 9.4% 16.4%% of Random MID pairs that match all: 1.3% 0.5% 0.0% 0.2%
Note: This table shows how similar information from changed MIDs is to information from the original MID.
Table 5: Distribution of BMID Lengths
11 12 13 14 1514% 18% 26% 23% 19%
Note: The maximum MID length is 15 characters. Cleaned sample BMIDs have a minimum of 11 characters.

Table 6: BMID Address Field
(a) All Countries
None 1 2 3 4
11% 15% 27% 24% 23%
(b) By Region
None 1 2 3 4
North America (ex. Mexico) 1% 3% 13% 34% 49%Central America and Mexico 10% 10% 21% 34% 24%
South America 9% 6% 16% 37% 33%Europe 13% 22% 37% 14% 14%Asia 12% 13% 24% 27% 24%
Oceania 6% 13% 33% 28% 20%Africa 16% 14% 27% 20% 22%
(c) Costa Rica
None 1 2 3 4
18% 12% 16% 34% 19%
Note: MIDs can have 0-4 numeric characters in the address field, taken from the supplier’s invoice.
Table 7: Distribution of BMIDs, by Number of Exported Products/Industries
(a) HS10 Products
1-5 6-10 11-20 21-50 More than 5084% 13% 3% 0.6% 0.1%
(b) HS2 Industries
1-2 3-5 6-9 10-20 More than 2084% 12% 3% 0.9% 0.1%
Note: This table shows the distribution of BMIDs to the U.S. by the number of products or industries exported.
24

Table 8: Number of Exporters to the U.S., 2011
Country World Bank EDD BMIDs Share
Albania 50 63 0.79Bangladesh 2,051 2,667 0.77Belgium 4,589 6,823 0.67Bolivia 268 476 0.56Brazil 5,772 9,080 0.64Cameroon 94 107 0.88Chile 2,072 2,959 0.70Colombia 2,663 4,045 0.66Costa Rica 1,599 1,476 1.08Cote d’Ivoire 139 123 1.13Croatia 421 295 1.43Denmark 3,139 4,783 0.66Dominican Republic 1,613 1,477 1.09Ecuador 1,466 1,915 0.77Egypt 851 1,200 0.71Estonia 302 265 1.14Ethiopia 240 220 1.09Georgia 102 63 1.62Germany 28,229 48,398 0.58Guatemala 1,370 1,699 0.81Jordan 574 346 1.66Kenya 413 377 1.10Lebanon 318 398 0.80Madagascar 174 173 1.01Mauritius 156 184 0.85Mexico 24,802 27,523 0.90Morocco 429 863 0.50Nepal 573 759 0.75Nicaragua 382 621 0.62Norway 1,940 2,512 0.77Paraguay 68 144 0.47Peru 2,396 3,271 0.73Portugal 2,413 3,809 0.63Romania 854 1,420 0.60South Africa 3,257 3,416 0.95Spain 13,888 13,115 1.06Turkey 4,316 8,275 0.52Uruguay 379 517 0.73
Total 114,362 155,857 0.73
Note: This table compares the number of exporters from two different datasets. The last column is the exportercount from the World Bank EDD as a fraction of the exporter count from the U.S. import data.

Table 9: Number of Exporter-Sector Combinations to the U.S., 2011
Broad HS Category EDD/LFTTD Share
Plastics & Rubber 0.92Raw Hides, Skins, Leather, & Furs 0.94
Footwear & Headgear 0.96Textiles 1.03
Vegetable Products 1.16Transportation 1.23
Prepared Foodstuffs 1.24Machinery & Electrical 1.43
Miscellaneous 1.54Animal & Animal Products 1.58
Stone & Glass 1.58Mineral products 2.01
Metals 2.57Wood & Wood Products 3.27
Chemical & Allied Industries 4.29
Note: This table compares the number of exporters to the U.S. in an HS2 sector from two different datasets, forthe countries listed in Table 8. The counts are aggregated to the “broad sector” classification. The last columnis the count from the World Bank EDD as a fraction of the count from the U.S. import data.
Table 10: Share of 2011 Suppliers found in Other Years
2010 2012 2013 2014
BMID 54% 56% 45% 40%Raw MID 54% 56% 46% 40%
Note: This table displays the percent of MIDs in 2011 that were also found in 2010, 2012, 2013, or 2014, as ashare of all MIDs in 2011. BMIDs are those that were combined via the bigram matching procedure., while”Raw” refers to the MID as it appears in the trade trasnactions data.
26

Table 11: Top Export Sources to the U.S., 2011
(a) By “Exporting Country”
Country Share of Total Value
China 18%Canada 14%Mexico 12%Japan 6%
Germany 5%South Korea 3%
United Kingdom 2%Saudi Arabia 2%Venezuela 2%Taiwan 2%
(b) By BMID “Country of Origin”
Country Share of Total Value
China 15%Mexico 13%Canada 12%Japan 9%
Germany 5%Taiwan 4%
South Korea 3%United Kingdom 3%
Hong Kong 3%Switzerland 3%
Note: The “exporting country” can differ from the ”country of origin” of a trade transaction, and typically the“exporting country” is the last stop without significant origin-conferring operations. The left panel utilizespublicly available import data from the U.S. Census Bureau.
Table 12: Related Party Relationships
(a) All Relationships
Log Trade Log Price
Related 0.149*** 0.107***
(0.002) (0.003)Country FE Yes YesProduct FE Yes YesAdj. 𝑅2 0.22 0.66
N 4,440,000 3,110,000
(b) Excluding China
Log Trade Log Price
Related 0.262*** 0.044***
(0.002) (0.003)Country FE Yes YesProduct FE Yes YesAdj. 𝑅2 0.25 0.66
N 3,394,000 2,341,000
Note: In the U.S. import data, two parties are considered to be related by ownership if one owns 5% or more ofthe other. Other possibilities for related party affiliation are family ties, an employer/employee relationships, orshared leadership. Log Trade refers to the logged total value of trade within the relationship(importer-exporter-product combination) in 2011, while the Log Price is the total value in the relationshipdivided by the total quantity. Observations are at the buyer-supplier-product level. Observation counts arerounded for disclosure purposes. Coefficients are significant at the 1% level.

Table 13: Share of Total Relationships, by Export Source to the U.S.
(a) 2011 Cleaned Sample
Country Share
China 27%Canada 7%
Hong Kong 6%Italy 6%
Taiwan 5%Germany 5%
United Kingdom 4%India 4%Japan 3%
South Korea 3%
(b) Sample in 2010 & 2011
Country Share
China 20%Canada 6%
Hong Kong 4%Italy 4%
Taiwan 4%Germany 4%
United Kingdom 3%India 2%Japan 2%
South Korea 2%
(c) 2010 Raw Sample
Country Share
China 27%Canada 9%
Hong Kong 6%Italy 5%
Taiwan 5%Germany 5%
United Kingdom 4%India 3%Japan 3%
South Korea 3%
Note: This table ranks U.S. export partners by the total number of importer-exporter relationships. Panel (a)uses BMIDs from our cleaned data for 2011. Panel (b) uses only MIDs that were found in both 2010 and 2011U.S. import data. Panel (c) uses only raw 2010 U.S. import data.
Table 14: Country Characteristics and Relationships
All Sectors Textiles Only
# Relationships Value/Relationship # Relationships Value/RelationshipLog GDP 0.97*** 0.27*** 0.82*** 0.14
(0.05) (0.05) (0.05) (0.09)Distance -0.00*** -0.00 0.00 0.00*
(0.00) (0.00) (0.00) (0.00)Contiguity -0.34 -0.49 0.25 0.42*
(0.34) (0.65) (0.89) (0.64)Common Language 0.94*** 0.32 0.163 -0.26
(0.24) (0.24) (0.34) (0.43)Former Colony 0.11 -0.64 0.36 0.05
(0.88) (0.41) (0.88) (0.53)RTA 1.20*** 0.66*** 1.42*** 2.58***
(0.22) (0.27) (0.44) (0.61)Common Currency 0.44 1.30* 0.21 -0.90
(0.38) (0.70) (0.31) (0.67)
Observations 177 177 153 153Adj.𝑅2 0.72 0.20 0.52 0.17
Note: This is a regression of the number of relationships and value per relationship on source countrycharacteristics. Covariates come from the CEPII gravity database.

A Examples of the Bigram Matching Program
In Section 3.1, we describe the procedure whereby we collapse “similar” Manufacturer IDs into
a single Manufacturer ID, where “similar” is defined as a score, calculated according to the
number of matching bigrams within the Manufacturing ID. The procedure follows Wasi and
Flaaen (2015) in order to calculate such a score. We have described rules of thumb to choose
bigram matching scores in order to “clean” the MIDs. Here, we provide detailed examples
of matches between MIDs and the associated scored, using hypothetical MIDs. Consider the
following hypothetical firm name and address:
Quan Kao Company
1234 Beijing Lane
Beijing, China
Following the rules described in Section 2, the Manufacturing ID for this firm would be:
CNQUAKAO1234BEI. Below we present seven permutations of this Manufacturer ID, along
with their accompanying bigram matching score.
As can be seen from the table, the closer the two strings are, the higher is the associated
match score. Furthermore, our criterion of consolidating similar firms if the two codes have
similarity indices of over 0.98 seems reasonable according to the above standards: while some
simple coding errors (such as missing one character in the name) might be reasonable to assume
as potentially occurring in the data, errors on the scale of wholly different addresses or firm
names are certainly likely to be much less common.
Table A1: Hypothetical MIDs and Bigram Matching Scores
Raw MID to be Matched Possible Matches Difference Score
CNQUAKAO1234BEI CNQUAKAO123BEI One Character Missing 0.9951
CNQUAKAO1234BEI CNQUAKAU1234BEI One Character Different 0.9917
CNQUAKAO1234BEI CNQUA1234BEI Second Word Missing 0.9830
CNQUAKAO1234BEI CNQUAKAO1234SHA Different City 0.9802
CNQUAKAO1234BEI CNQUAKAOBEI No Number 0.9723
CNQUAKAO1234BEI CNQUAKAO5555BEI Different Number 0.9381
CNQUAKAO1234BEI CNJIACHA1234BEI Different Name 0.5321
29

Online Appendix for“Identifying Foreign Suppliers in U.S. Import Data”1
Fariha Kamal2, Ryan Monarch 3
1Any opinions and conclusions expressed herein are those of the authors and do not necessarily representthe views of the U.S. Census Bureau, the Board of Governors of the Federal Reserve System, or any otherperson associated with the Federal Reserve System. All results have been reviewed to ensure that no confidentialinformation is disclosed.
2U.S. Census Bureau, [email protected] of Governors of the Federal Reserve, [email protected]
30

B Broad Sector Classification
We use “broad sector” classifications throughout different parts of our analysis, which are groupsof very similar HS2 sectors. This classification comes from Foreign Trade Online (http://www.foreign-trade.com/reference/hscode.htm), and is organized as follows:
Table 1: Broad HS2 Groupings
HS2 Description
01-05 Animal & Animal Products06-15 Vegetable Products16-24 Foodstuffs25-27 Mineral Products28-38 Chemicals & Allied Industries39-40 Plastics / Rubbers41-43 Raw Hides, Skins, Leather, & Furs44-49 Wood & Wood Products50-63 Textiles64-67 Footwear / Headgear68-71 Stone / Glass72-83 Metals84-85 Machinery / Electrical86-89 Transportation90-97 Miscellaneous
C Details about Translation of Chinese Firm Names
As detailed in Section 2.4, we translate approximately 75,000 exporter names and addressesfrom the China NBS ASIF database into “MID”s. We use a Chinese character-Hanyu Pinyintranslation webpage (www.chineseconverter.com) to do so. Pronunciation marks/ numbersare eliminated. If there are two or more spellings for a particular character, we use the firsttranslation alphabetically.
We generally take the first word of a firm name to be the first two characters of its name.The exception is if a “(” is found following the third character, as this is typically indicativeof a city or geographic designation in the firm name (such as ABCXYZ (China) Company), inwhich case we make the first word the first three characters of the name.
We generally take the second word of a firm name to be the third and fourth charactersof its name. If a firm has a geographic identifier such as city (“SHI”) or county (“XIAN”)following its first word, then we use the fourth and fifth characters of the name. We make thesame exception for left parenthesis discussed above.
We drop any non-alphabetic characters found in these words (including numbers, parenthe-ses, brackets, question marks, etc.). We use the first three letters of each of these words.
For city names, we combine city municipal areas (i.e. Shunyi, Beijing) into one city (Beijing).
For the numeric address, we take the first four available numbers from a firm’s reportedaddress. This section can be blank.
31

D Additional Tables
This section includes robustness checks for the empirical regularities established in Section 4across different cuts of our data. “2011 Raw” refers to the MIDs as filed in the 2011 importdata, showing whether bigram matching changes any results. “2010 Raw” refers to MIDs asfiled in the 2010 U.S. import data, and is intended to highlight the robustness of the results tousing data in a different calendar year. “2010 and 2011” refers to the set of MIDs found bothin 2010 and 2011, and is intended to highlight the robustness of the results to using a samplewhere MIDs all have flows in multiple years.
Table D1: Validity Checks for Bigram Matching Results, Match Score ≥ 0.99
Broad Sector HS2 HS4 HS6 HS10 Buyer
% of Changed MIDs that match any: 68 44 36 33 29 32% of Changed MIDs that match exactly: 49 25 15 12 9 16
Note: This table replicates Table 4 for a higher field similarity match score.
32
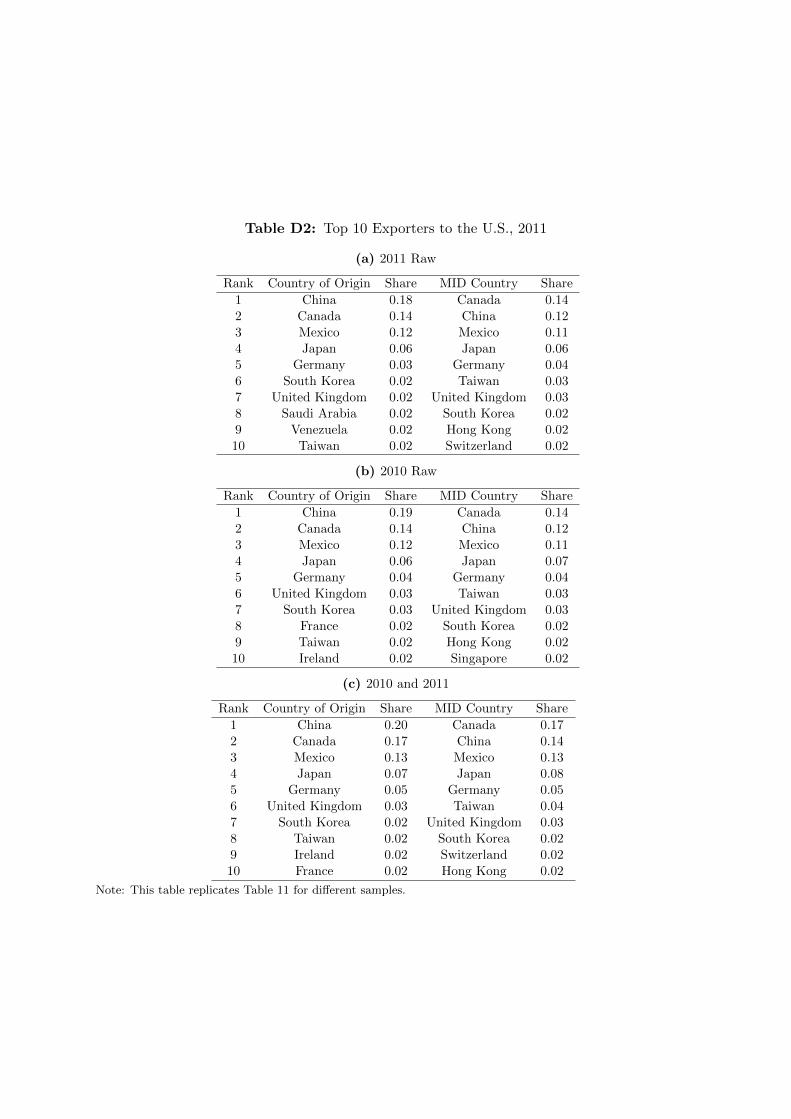
Table D2: Top 10 Exporters to the U.S., 2011
(a) 2011 Raw
Rank Country of Origin Share MID Country Share
1 China 0.18 Canada 0.142 Canada 0.14 China 0.123 Mexico 0.12 Mexico 0.114 Japan 0.06 Japan 0.065 Germany 0.03 Germany 0.046 South Korea 0.02 Taiwan 0.037 United Kingdom 0.02 United Kingdom 0.038 Saudi Arabia 0.02 South Korea 0.029 Venezuela 0.02 Hong Kong 0.0210 Taiwan 0.02 Switzerland 0.02
(b) 2010 Raw
Rank Country of Origin Share MID Country Share
1 China 0.19 Canada 0.142 Canada 0.14 China 0.123 Mexico 0.12 Mexico 0.114 Japan 0.06 Japan 0.075 Germany 0.04 Germany 0.046 United Kingdom 0.03 Taiwan 0.037 South Korea 0.03 United Kingdom 0.038 France 0.02 South Korea 0.029 Taiwan 0.02 Hong Kong 0.0210 Ireland 0.02 Singapore 0.02
(c) 2010 and 2011
Rank Country of Origin Share MID Country Share
1 China 0.20 Canada 0.172 Canada 0.17 China 0.143 Mexico 0.13 Mexico 0.134 Japan 0.07 Japan 0.085 Germany 0.05 Germany 0.056 United Kingdom 0.03 Taiwan 0.047 South Korea 0.02 United Kingdom 0.038 Taiwan 0.02 South Korea 0.029 Ireland 0.02 Switzerland 0.0210 France 0.02 Hong Kong 0.02
Note: This table replicates Table 11 for different samples.

Table D3: Related Party Relationships
Log Trade Log Price Log Trade Log Price Log Trade Log Price
Related 0.174*** 0.145*** 0.185*** 0.146*** 0.137*** 0.155***(0.002) (0.002) (0.002) (0.002) (0.002) (0.002)
Observations 5,831,000 4,089,000 5,575,000 3,924,000 4,594,000 3,263,000Country FE Yes Yes Yes Yes Yes YesProduct FE Yes Yes Yes Yes Yes YesAdjust 𝑅2 0.21 0.67 0.21 0.67 0.21 0.67Sample 2011 Raw 2011 Raw 2011 Raw 2011 Raw 2010 and 2011 2010 and 2011
Note: This table replicates Table 12 for different samples.
Table D4: Top Exporting Countries to the U.S., by Total Relationship Share, 2011 Raw
Country Share
China 0.29Canada 0.09
Hong Kong 0.06Italy 0.06
Taiwan 0.05Germany 0.05
United Kingdom 0.04India 0.03Japan 0.03
South Korea 0.03
Note: This table replicates Table 13 for an additional sample.
34

Table D5: Country Characteristics and Relationships
(a) 2011 Raw
Log (Number of Relationships) Log (Value/Relationship)
Log GDP (Current USD) 0.927*** 0.253***(0.053) (0.050)
Distance (weighted) -0.00001*** -0.00004(0.000) (0.000)
Contiguity -5.8043 -1.126(4.142) (1.106)
Common Official Language 0.736*** 0.192(0.268) (0.246)
Former Colony 0.261 -0.47(0.840) (0.485)
Regional Trade Agreeements 1.217*** 0.602**(0.205) (0.253)
Common Currency 0.45 1.220*(0.371) (0.672)
Observations 177 177Adj. R-squared 0.67 0.18
(b) 2010 Raw
Log (Number of Relationships) Log (Value/Relationship)
Log GDP (Current USD) 0.912*** 0.306***(0.048) (0.060)
Distance (weighted) -0.0001 -0.00002(0.000) (0.000)
Contiguity -5.351 -1.510(3.951) (1.396)
Common Official Language 0.640** 0.460*(0.262) (0.245)
Former Colony 0.276 -0.792*(0.834) (0.414)
Regional Trade Agreeements 1.310*** 0.663**(0.242) (0.285)
Common Currency 0.539 1.521**(0.460) (0.697)
Observations 178 178Adj. R-squared 0.67 0.25
(c) 2010 and 2011
Log (Number of Relationships) Log (Value/Relationship)
Log GDP (Current USD) 0.955*** 0.274***(0.059) (0.056)
Distance (weighted) -0.0001** -0.00004(0.000) (0.000)
Contiguity -5.675 -1.386(4.039) (1.304)
Common Official Language 0.826** 0.373(0.291) (0.264)
Former Colony 0.197 -0.713(0.996) (0.506)
Regional Trade Agreeements 1.404*** 0.561**(0.239) (0.265)
Common Currency 0.07 1.731**(0.510) (0.857)
Observations 175 175Adj. R-squared 0.63 0.17
Note: This table replicates Table 14 for different samples.

Table D6: Top 10 Export Cities to the U.S.
(a) By Number of Relationships
Location City Code Total Relationships Likely City/Cities
Taiwan TAI 50,196 TaipeiHong Kong HON 46,187 Hong Kong
China SHA 45,385 Shanghai, ShantouChina GUA 42,285 GuangzhouChina SHE 38,064 Shenzhen, ShenyangChina DON 29,602 DongguanChina JIA 24,177 Jiangmen, Ji’anChina ZHE 20,815 Zhengzhou, Zhenyang
Hong Kong KOW 20,491 KowloonChina NIN 16,221 Ningbo
(b) By Value
Location City Code Total Trade (in billions of USD) Likely City/Cities
Canada CAL 43.0 CalgaryChina SHA 29.0 Shanghai, Shantou
Singapore SIN 28.6 SingaporeTaiwan TAI 24.3 TaipeiChina SHE 22.3 Shenzhen, ShenyangMexico MEX 21.6 Mexico City
Hong Kong HON 17.6 Hong KongChina JIA 15.0 Jiangmen, Ji’anMexico CDJ 14.9 Ciudad JuarezChina GUA 14.3 Guangzhou
Note: It is possible to use the three-character city code from the MID to rank the top exporting cities to theU.S. A relationship is a U.S. importer-foreign supplier combination. We have a total of 1,579,983 relationshipsin the data. Likely cities are assigned based on population. This table is subject to the important caveat thatin some instances, three letters may not be enough to uniquely identify a city.
36


