Identifying Foreign Suppliers in U.S. Merchandise Import ...
47
Identifying Foreign Suppliers in U.S. Merchandise Import Transactions 1 by Fariha Kamal U.S. Census Bureau C.J. Krizan U.S. Census Bureau Ryan Monarch Federal Reserve Board CES 15-11 April, 2015 The research program of the Center for Economic Studies (CES) produces a wide range of economic analyses to improve the statistical programs of the U.S. Census Bureau. Many of these analyses take the form of CES research papers. The papers have not undergone the review accorded Census Bureau publications and no endorsement should be inferred. Any opinions and conclusions expressed herein are those of the author(s) and do not necessarily represent the views of the U.S. Census Bureau. All results have been reviewed to ensure that no confidential information is disclosed. Republication in whole or part must be cleared with the authors. To obtain information about the series, see www.census.gov/ces or contact Fariha Kamal, Editor, Discussion Papers, U.S. Census Bureau, Center for Economic Studies 2K132B, 4600 Silver Hill Road, Washington, DC 20233, [email protected].
Transcript of Identifying Foreign Suppliers in U.S. Merchandise Import ...

Identifying Foreign Suppliers in U.S. Merchandise Import Transactions1
by
Fariha Kamal U.S. Census Bureau
C.J. Krizan U.S. Census Bureau
Ryan Monarch Federal Reserve Board
CES 15-11 April, 2015
The research program of the Center for Economic Studies (CES) produces a wide range of economic analyses to improve the statistical programs of the U.S. Census Bureau. Many of these analyses take the form of CES research papers. The papers have not undergone the review accorded Census Bureau publications and no endorsement should be inferred. Any opinions and conclusions expressed herein are those of the author(s) and do not necessarily represent the views of the U.S. Census Bureau. All results have been reviewed to ensure that no confidential information is disclosed. Republication in whole or part must be cleared with the authors. To obtain information about the series, see www.census.gov/ces or contact Fariha Kamal, Editor, Discussion Papers, U.S. Census Bureau, Center for Economic Studies 2K132B, 4600 Silver Hill Road, Washington, DC 20233, [email protected].

Abstract
The availability of international trade transactions data capturing individual relationships between buyers and suppliers permits the answering of numerous new questions governing the economic activity of traders. In this paper, we explore the reliability of two-sided firm trade transactions data sourced from the United States by comparing the number of foreign suppliers from U.S. merchandise import transaction data to origin-country data. We find that the statistic derived from the origin-country data, on average, tends to be 20 percent lower than using the raw U.S. data. Guided by this finding, we propose and implement a set of methods that are capable of aligning the counts more closely from these two different data sources. Overall, our analysis presents broad support for the use of U.S. merchandise import transactions data to study buyer-supplier relationships in international trade. 1
1 Any opinions and conclusions expressed herein are those of the authors and do not necessarily represent the views of the U.S. Census Bureau, the Board of Governors of the Federal Reserve System, or of any other person associated with the Federal Reserve System. All results have been reviewed to ensure that no confidential information is disclosed. Special thanks to Hong Ma, Jeronimo Carballo, and Christian Volpe Martincus for sharing data. We thank Javier Miranda and Nikolas Zolas for valuable comments. We thank Clint Carter and William Wisniewski for timely disclosure review.

1. Introduction
Every international trade transaction is an agreement between two firms, an importer
(buyer) and an exporter (supplier), located in two different countries. For this reason, the recent
availability of international trade databases that provide the identity of both importers and
exporters for individual transactions has fundamental appeal for the field of international trade.
Indeed, the existence of such “two-sided” firm trade transactions data has the potential to
establish novel facts about traders that can augment the heterogeneous firm framework widely
used throughout the literature (Melitz, 2003). To the best of our knowledge, “two-sided” firm
trade transactions data has been analyzed for Colombia (Benguria, 2014), Chile and Colombia
(Blum, Claro, and Horstmann, 2011), Costa Rica, Ecuador, and Uruguay (Carballo, Ottaviano,
and Volpe Martincus, 2013), Norway (Bernard, Moxnes, and Ulltveit-Moe, 2013), and the
United States (Bernard, Jensen, and Schott, 2010; Pierce and Schott, 2012; Dragusanu, 2014;
Eaton, Eslava, Jinkins, Krizan and Tybout, 2014; Kamal and Sundaram, 2014; Monarch, 2014).
The use of two-sided firm data in international trade research is still in its infancy and it
may be fair to characterize the use of such data as cautious. One of the primary reasons is
concerns about data quality: in order to have individual transactions that include both importing
and exporting entities, one data source must identify individual traders in both countries. It is
readily apparent that one country collecting information on exporters originating in another
country will be an imperfect undertaking at best. While it is in the best interest of many
governments to collect reliable information about firms located in their jurisdiction for taxation
purposes, it is not obvious that the same governments would have the incentive, or even the
2

authority, to maintain accurate statistics on firms located outside its national borders.
Subsequently, two-sided trade data will by definition be more susceptible to issues related to the
unique and consistent identification of “foreign” suppliers. The purpose of this paper is to
examine and assess the reliability of two-sided firm trade data sourced from the United States,
specifically U.S. merchandise import transactions collected by U.S. Customs and Border
Protection (CBP) and maintained by the U.S. Census Bureau.2
We begin by describing the institutional environment surrounding the construction and
collection of the identifier that captures foreign suppliers exporting to the U.S, known as the
Manufacturer ID or MID (section 2). The source data is the U.S. merchandise import
transactions, which consists of information from every customs form filled out by U.S. firms
with import shipments above $2,000. Using this data as well as supporting evidence sourced
from CBP and third parties, we investigate the properties of the Manufacturer ID, highlighting
both pitfalls and benefits in using the MID to conduct research.
Our goal in this paper is to assess the extent to which the Manufacturer ID represents the
foreign supplier. In Section 3, we compare statistics on foreign suppliers generated using the
U.S. data to what are, theoretically, the same statistics generated using customs data from
selected source country databases, compiled in the World Bank’s Exporter Dynamic Database.
Trade data from countries exporting to the U.S. originate from official statistical sources, so it is
reasonable in our view to attempt to validate the Manufacturer ID via such a comparison. Where
possible, we augment these results with more detailed country-specific comparisons. Our main
2 See http://www.census.gov/ces/dataproducts/datasets/imp.html for further description. 3

finding is that the raw U.S. data tends to overshoot the number of foreign exporters by about 25
percent. Additionally, certain countries and industries tend to match better. Given this finding, in
Section 4, we propose several common-sense algorithms and cleaning methods to modify the
MID and generate statistics that align more closely to source-country data.
Overall, our findings are broadly supportive of the usage of the U.S. import data for the
purposes of investigating buyer and supplier relationships in international trade. Our analysis
supports the usage of the Manufacturer ID as a unique and consistent identifier of foreign-based
exporters that transact with U.S. importers, and thus as a window into the two-sided matching
dimension of international trade research.
2. Background and History
U.S. importers are required to fill out CBP Form 7501 in order to complete importation
of goods into the United States. In addition to information about value, quantity, and 10-digit
HTSUS product category of the imported merchandise, firms also have to provide the
“Manufacturer ID” (MID) for each product in Box 13 (see Figure 1).3 Due to strict rules-of-
origin requirements, the MID for textile shipments represents the “manufacturer” as defined in
Title 19 Code of Federal Regulations (CFR), i.e. “the entity performing the origin-conferring
operations”. 4 Textile products include both textile or apparel products as defined under Section
102.21, Title 19, CFR5, classified as any products in two-digit HS codes 50 through 63.6 In
3 See also form http://forms.cbp.gov/pdf/cbp_form_7501.pdf. 4 See http://www.gpo.gov/fdsys/pkg/CFR-2011-title19-vol1/pdf/CFR-2011-title19-vol1-sec102-23.pdf. 5 See http://www.gpo.gov/fdsys/pkg/CFR-2011-title19-vol1/pdf/CFR-2011-title19-vol1-sec102-21.pdf.
4

general, for all products, CBP requires that the manufacturer ID constitute the manufacturer and
not trading companies, or other trading agents.7
Customs Directive No. 3550-055 lays out the current method for deriving an
identification code for manufacturers and shippers.8 The MID consists of an alphanumeric code
that is constructed according to a pre-specified algorithm, using information on the seller’s name
and address from the importer’s official invoice. The derivation (known as “keylining”) is as
follows: the first two characters of the MID must contain the two-digit ISO country code of
origin of the good, the next three characters the start of the first word of the exporter’s name, the
next three characters the start of the second word, the next four characters the first numbers of
the street address of the foreign exporter, and the last three characters the first three letters of the
foreign exporter’s city (see Table 1 for stylized examples).9 The MID has a maximum length of
fifteen characters.
The multi-step process for constructing the MID described above may cause concerns
about its reliability as a usable identifier, or the susceptibility of the MID to erroneous data entry
by either importing firms or customs brokers. Although CBP Form 7501 may be filled out by
individual importers it is common to either employ in-house licensed customs brokers to
facilitate the import process or use outside customs brokerage service providers to handle the
6 See http://hts.usitc.gov/ for details on each HS chapter. 7 https://help.cbp.gov/app/answers/detail/a_id/952/kw/MANUFACTURER%20IDENTIFICATION%20NUMBER/suggested/1. 8 See http://www.cbp.gov/document/directives/3550-055-instructions-deriving-manufacturershipper-identification-code. 9 See Block 13 (pg. 7) for description of MID and Appendix 2 (pg. 30) for instructions on constructing MID at http://forms.cbp.gov/pdf/7501_instructions.pdf.
5

shipment clearance process. Customs regulations, 19 CFR, Part 111, require that a customs
broker hold a valid license to transact customs business on behalf of others, and in fact, the
Customs Broker License Examinations10 administered by CBP typically includes a question
about MID construction.11 Moreover, customs brokers utilize specialized software to prepare and
transmit invoices electronically to CBP such as SmartBorder.12 SmartBorder includes validation
checks on the entry data. In particular, with respect to the MID, the SmartBorder software can
store customer information that can auto-populate, thereby reducing errors due to manual data
entry. Overall, 96 percent of all entries filed with CBP are filed electronically through the CBP’s
Automated Broker Interface (ABI).13 Together these details allay some concern about the
potential for misspellings leading to errors in the construction of the MID. In terms of data
coverage alone, the MID is a well-populated variable in the U.S. merchandise import
transactions for all years between 1992 and 2008. On average about 10 percent of the MIDs are
missing by value while only about 3 percent are missing by count.
What possible incentives would the U.S. government have for making sure that U.S.
firms are writing down the identity of their foreign partners correctly? According to U.S. law,
there are two apparent reasons. First, the MID is utilized in national security programs such as
the Customs-Trade Partnership Against Terrorism (C-TPAT). An active MID is required to be
qualified for the program. Companies that join C-TPAT “sign an agreement to work with CBP to
10 See http://www.cbp.gov/trade/broker/exam/announcement for details about the exam. 11 See http://www.cbp.gov/document/publications/past-customs-broker-license-examinations-answer-keys for sample exam questions and answer keys. Questions 5 and 12 on the April 2014 examinations ask about MID construction. 12 See http://www.smartborder.com/newsb2/ProductsSmartBorderABI.aspx. 13 http://www.cbp.gov/trade/acs/abi/contact-info
6

protect the supply chain, identify security gaps, and implement specific security measures and
best practices.”14 C-TPAT members are less likely to be subject to examinations at the port since
they are considered low-risk. The CBP reports that the program covers about 10,000 companies,
accounting for over 50 percent of U.S. import value.
Second, the United States is clearly interested in enforcing trade-related regulatory
requirements that relate to the identity of foreign suppliers to the U.S. For instance, anti-dumping
measures are foreign-firm specific in nature. Furthermore, it is clear from U.S. regulations that
the Manufacturer ID is used to track compliance with U.S. restrictions for textile shipments.
MID criteria for textiles are more stringent than those for other products, since non-textile
products typically do not have the rule-of-origin restrictions that exist for textile and apparel
products. As mentioned earlier, the official “manufacturer” of textile products must be identified
through a MID, pursuant to Section 102.21 or 102.22, Title 19, CFR. A single entry filed for
textile products of more than one manufacturer require that the products of each manufacturer be
separately identified. If an entry filed for such merchandise fails to include the MID properly
constructed from the name and address of the manufacturer, the port director may reject the entry
or take other appropriate action. The above discussion highlights the regulatory imperatives to
provide an accurate MID and thereby establishes our confidence that it provides a consistent
basis of identifying the foreign manufacturer in an U.S. merchandise import transaction.
3. Comparison with External Data Sources
14 http://www.cbp.gov/border-security/ports-entry/cargo-security/c-tpat-customs-trade-partnership-against-terrorism 7

There may be two main concerns about the construction of the Manufacturer ID: the
Manufacturer ID might be either overestimating or underestimating the true number of exporters.
Why might using the Manufacturer ID to generate counts of firms exporting to the U.S. result in
too many exporters? The most obvious answer rests on two of CBP’s requirements in
constructing the Manufacturer ID. First, each manufacturer of the same product must be listed
separately. Second, trading companies, sellers other than manufacturers, and similar trading
agents cannot be used to create MIDs, and this particular requirement is especially strict for
textile products. Since countries may count intermediaries as exporters in their customs data,
origin-country data compared to the U.S. data may very likely yield lower counts of exporters.
Moreover, it is possible that two different U.S. importing firms might be purchasing goods from
the same exporting firm, yet constructing the MID differently. For example, one U.S. importer
might write down the numerical section of the exporter’s address, while another may not.
Typographical differences may also arise when entering the letters in the exporter’s name or
address by the filer of CBP Form 7501. These types of clerical errors would lead to an
overestimate of the number of firms exporting to the U.S. Alternatively, it is possible that firms
with very similar information are recorded using the same MID, thus leading to an
underestimation of the actual number of foreign suppliers.15
We assess the potential for clerical errors in the construction of the Manufacturer ID and
therefore its use as a unique and consistent identifier of foreign exporters by comparing a number
of statistics generated by using the Manufacturer ID to those generated using information from
15 Obviously, both problems could be occurring simultaneously, thus having an ambiguous effect on the total number of exporters.
8

external sources. We present results from three exercises. First, we measure both the overall
number of foreign exporters in a year and the number of surviving foreign exporters over time in
the U.S. import data, and determine how well these numbers match the same moments generated
from data compiled by the country of origin. Second, we compare the U.S. merchandise import
data to more detailed statistics from existing research and data on trading firms in selected
countries. Finally, we report the results of specific comparisons made through using more
detailed customs data from China, the largest importing partner of the U.S. (U.S. Census Bureau,
2013).
3.1 Cross-country comparisons using World Bank’s Exporter Dynamics Database
We begin by analyzing how statistics calculated using the Manufacturer ID in the U.S.
import data compare to the same statistics generated from data collected by reporting agencies in
the exporting countries. We first utilize the World Bank’s public-use Exporter Dynamics
Database (EDD) that contains destination-specific information on exporting firms for 43
countries between 1997 through 2007 (Cebeci, Fernandes, Freund, and Pierola, 2012). For every
available year and export destination for these countries, we use the total number of exporting
firms and the number of incumbent exporters. The source of the underlying micro data, which is
not publicly available, varies from national government statistics (such as in Peru) to figures
collected by private companies (such as in Chile) and are thus wholly different sources than the
U.S. customs data. We thus compare statistics from the two distinct sources and analyze how
closely they align, while being cognizant that the definition of what exactly constitutes a foreign
exporter is specific to the U.S., and may not match across different countries.
9

Column 1 in Table 2 presents a list of countries from the Exporter Dynamics Database,
along with the associated average number of exporters over the sample years in Column 2.16
Column 3 presents the same statistic, average number of exporters, calculated using the
Manufacturer ID as it appears in the U.S. import data (“raw”). For most countries in the EDD,
the total number of foreign exporters to the U.S. calculated using the raw Manufacturer ID is
higher than the corresponding numbers from the World Bank data. Looking at the total number
of exporters using EDD (91,841) compared to using the U.S. import data (114,888), we can see
that the U.S. data yields counts that are, on average, 25 percent higher. We also run a simple
regression of the number of exporters to the U.S. as reported in the Exporter Dynamics Database
on the number of MIDs in the U.S. merchandise import transactions data, where each data point
is an origin country-year observation present in both datasets. This regression yields a coefficient
of 0.84, implying that for every 100 exporters reported in the U.S. import data, the Exporter
Dynamic Database reports 84 exporters.
The second comparison between U.S. import data and the Exporter Dynamics Database is
a dynamic one. For any given year, it is possible to measure the number of incumbent exporters
to the U.S. (exporters that were also found in the previous year). Using U.S. import transactions
data, we compute the average number of incumbents from a country, over the time period for
which Exporter Dynamic Database data exists, by tracking the number of Manufacturer ID
observations that are also found in the previous year. The average number of incumbent
exporters using the EDD and the raw MID are presented in Columns 4 and 5 of Table 2. As with
16 The years in the database range from 1997 to 2007, though the actual number of years with available exporter data varies by country. See Cebeci et al (2012) for full details.
10

the findings for the average number of exporters reported in Columns 2 and 3, we tend to find a
higher number of incumbents using the U.S. import data than reported in the EDD. An exception
is Mexico, for which U.S. data implies a lower number of incumbents compared to that reported
in EDD.
3.2 Cross-country comparisons from various sources
We next turn to comparisons of number of exporters calculated using the MID from the
U.S. import data with same statistics derived from both published and unpublished academic
work. We identified three papers using firm-level data from individual countries that report
figures for the number of exporters to the U.S.: Bekes, Harasztosi, and Murakozy (2009) for
Hungary, Eaton et al. (2014) for Colombia, and Bernard et al. (2014) for Norway. We also report
figures for Uruguay, Costa Rica, Ecuador, and China. The results are presented in Table 3.
Bekes et al. (2009, 2011) utilize Hungarian firm-trade linked data, based on firm balance
sheet information combined with customs data.17 Row 1 in Table 3 compares the figures for
2003 with the same figures calculated using the MID in the U.S. import data. The number of
Hungarian firms exporting to the U.S. calculated using U.S. import data far exceeds the number
reported using Hungarian data.18
Eaton et al. (2014) provide the number of exporters from Colombia to the U.S. for 2000
through 2008. We compare the number of Colombian firms exporting to the U.S. in 2008 as
17 Table 27 in Bekes et. al (2009) presents the number of exporting firms by country of destination. 18 The data from Bekes et, al (2009, 2011) is from the Hungarian Statistical Office from Customs declarations. It excludes trade of goods “stored unaltered in bonded warehouse and duty free zones”. The authors note that “26 percent of export observations (firm-year) are not merged with production data, resulting in about 5,000 dropped observations per year”. These observations are also not included in their tables, a total of about 3-5 percent of total trade.
11

shown in row 2 of Table 3. Again, we see that U.S. data yields a higher number of exporters than
using origin-country data. The authors also document this finding in Appendix A of their paper,
and note that difference in value is only about 10 percent. In order to examine the reasons for
larger differences in firm counts, the authors compare the number of firms across the two data
sources by HS2 categories to find that counts using the Manufacturer ID are higher in only 28 of
the 82 codes and the biggest differences arise in HS codes 61 and 62: textiles. They show that
removal of these two sectors from the list reverses the firm counts such that the Colombian data
yield higher number of exporters. This finding is in line with regulations pertaining to reporting
requirement for Manufacturer IDs in textile products under Title 19, CFR. The MID must
represent the manufacturer for textile products and furthermore products of each manufacturer
must be separately identified.
Bernard, Moxnes, and Ultveit-Moe (2014) utilize transactions level data on Norwegian
exporters, and similar to U.S. import data, are able to positively identify both buyers and sellers.
Table 1 in their paper presents a number of statistics, including the number of Norwegian
exporters to the U.S. as well as the number of U.S. buyers that transact with Norwegian
exporters. We compare the number of Norwegian exporters to the U.S. using the MID to theirs in
Table 3, row 3 for the year 2006. In the Norwegian case, the U.S. data comes much closer to
matching the total number of exporters implied by Norwegian data.
Additionally, using information from the Norwegian export transactions data, the authors
calculate that 5,992 U.S. buyers transact with Norwegian exporters in 2006. Using the 2006
12

LFTTD-IMP 19 we calculate that there are 1,485 U.S. importers that imported merchandise goods
from Norway. The number of U.S. importers that transact with Norwegian exporters is four
times higher using Norwegian export transactions data compared to U.S. merchandise import
transactions data. This emphasizes further the difficulties in managing two-sided data and
underscores the point that the collection of information by one country on firms in another
country is an imperfect undertaking. Nonetheless, these newly available two-sided trade data
offer a valuable resource to understand various aspects of individual buyer-seller relationships
across national borders.
The next three rows in Table 3 provide statistics for Uruguay, Costa Rica, and Ecuador,
respectively. The number of exporters lines up well using the two different data sources for
Uruguay; while Costa Rica and Ecuador have much higher estimates using the MID variable in
the U.S. merchandise import transactions as compared to data from their national data sources.
3.3. Comparisons with Chinese trade statistics
Our final exercise analyzes the number of Chinese exporters to the U.S., derived both
from Chinese export data and U.S. import data in 2006. Table 3, row 7, shows the number of
exporters computed using Chinese customs data as well as those computed using the MID. The
number of Chinese exporters to the U.S. in 2006 using Chinese customs data represents only 40
percent of the number calculated using U.S. merchandise import data. The potential for higher
counts of foreign exporters using the MID may be due to the requirement that U.S. importers go
“directly to the source” when constructing the Manufacturer ID, a trend which should be
19 LFTTD-IMP refers to the Linked Foreign Trade Transactions Database that links individual import transactions to a firm identifier for the U.S. importer. See Bernard, Jensen, and Schott (2009) for data description.
13

especially pronounced in textiles due to stringent requirements to report the actual sourcing
entity for every HS10 product.
For the case of U.S.-China trade, it is actually possible to delve deeper into which
products produce the widest discrepancy, as we have access to the number of Chinese exporters
to the U.S. by HS2 category. This is especially valuable given the well-known differences in
MID reporting requirements for textile and non-textile shipments discussed in Section 2. We
would expect some evidence that the more detailed reporting requirements associated with textile
products to be consistent with higher numbers of exporters than country-specific data might
provide, as well as providing a valuable signal to researchers about the scope of overestimation
by industry. Indeed, Chinese exporter counts at the HS2 level display significant variation across
different product categories.
In Table 4, we present the HS2 codes where the total counts of Chinese exporters vary
most widely between Chinese and U.S. data. For example, the count of exporters generated using
Chinese customs data trading “Silk, Yarn, and Woven Fabric” is about half that of the count
generated using the U.S. import transactions data. Textiles (HS2 61-63) and other fabric textiles
(HS2 50-52) display some of the highest differences, but a few other categories also appear to be
differing significantly. If we exclude the top 10 industries where the U.S. data appears to
overestimate the number of Chinese exporters (representing 83 percent of total U.S. import value
from China), then the China/U.S. count ratio rises from 40 percent to 54 percent. If we further
drop all HS2 industries where the total number of exporters from U.S. data is more than double
14

the number from Chinese data (representing 76 percent of total U.S. import value from China),
the China/U.S. count share increases further to 59 percent.20
A final check that we undertake is to construct Manufacturer IDs from firm names and
addresses from Chinese firm level survey data, following closely the algorithms set forth by CBP
and described in Section 2. We can then evaluate the uniqueness and consistency of the
constructed MIDs vis-à-vis the source country data. There are two advantages to this approach.
First, this exercise allows us to quantify how commonplace the problem of two firms having the
same Manufacturer ID is. Second, we can assess how often the same firm has a changing
Manufacturer ID over time. Monarch (2014) undertakes this exercise with Chinese firm-level
data collected by the Chinese National Bureau of Statistics (NBS). He creates a pseudo-MID for
a set of exporting firms within particular Chinese Industrial Classification Codes (CIC) using the
firm name, city and address, with Chinese characters romanized according to the Hanyu Pinyin
system, and provides evidence of how uniquely MIDs are identified in the cross-section and over
time. Table 5 reproduces the tables in Monarch (2014).
For five selected industries in 2005, panels A, B, and C show results from three exercises.
Panel A, column 2 shows the number of Chinese exporters within each industry calculated using
NBS firm level data. Column 3 shows the number of pseudo-MIDs that could be created using
the name and address information in the same dataset. The final column lists the percentage
share of pseudo-MIDs in the total number of exporters. The very high percentages (ranging from
20 About 20 percent of HS2 products are associated with a fewer number of exporters using the U.S. data than the Chinese data. However, the number of exporters calculated using Chinese data is more than double the number from U.S. data in only one HS2 product category.
15

97 to 100 percent) indicate that the algorithm used to generate MIDs is capable of producing
unique identifiers for an exporter. Panel B shows results from an identical exercise using city
information. Column 2 shows the number of cities with at least one exporter within each industry
using NBS firm level data. Column 3 shows the unique number of cities generated using the last
three digits of the pseudo-MIDs. Again, the higher percentages in the final column indicate that
the three digit codes in the MID representing the city of the exporter tends to match the actual
number of cities quite well. Panel C illustrates the rarity of the same exporting firm will have
changes in name, address, or location that would result in a different pseudo-MID. Taken
together, the results in this table are another demonstration that U.S. importers constructing
MIDs according to the rules described in Section 2 are likely to generate reasonably unique and
consistent identifiers of foreign exporting firms.
4. Methods for Improving the Count of Foreign Exporters
We have described earlier the potential for higher counts in the U.S. data, and have
demonstrated that indeed, when comparing U.S. data to foreign data, the number of foreign
exporters generated using U.S. data tends to be larger than using origin-country data. This is not
altogether surprising. In fact, it is not unusual to find differences in the counts of businesses
across different data sources, even when they measure the same domestic economy. For
example, Becker, Elvery, Foster, Krizan, Nguyen, and Talan (2005) compare the number
of establishments in the U.S. reported by the Bureau of Labor Statistics (BLS) to published totals
from the Census Bureau. They find that the BLS count of establishments is about 9 percent
16

higher than counts generated using Census data. In a follow-up study, Elvery, Foster, Krizan, and
Talan (2006) matched the businesses in the two files and found that the 6-digit NAICS codes
assigned by the agencies differed for about 17-33 percent of the establishments.
Nevertheless, it is worthwhile to consider how potential clerical issues with the MID may
be addressed. Guided by our findings in Section 3, we present two alternative methods to address
the incidence of over-counting foreign exporters using the U.S. data - (1) “brute force” removal
of different components of the Manufacturer ID and treating the truncated ID as the unique
identifier of an exporter, and (2) implementing a matching protocol to determine how many
“similar” Manufacturer IDs are present in the data. The first approach is more straightforward,
but carries the risk of eliminating a significant amount of information. It is possible that different
exporters may in fact have very similar Manufacturer IDs, thus making it especially likely that
exporters will have identical truncated MIDs. The second approach is more nuanced, but requires
quantifying the notion of “similar”, as well as some significant computational capacity. In order
for researchers to better understand the tradeoff, we describe the results of each method in detail.
4.1 MID Truncation
We first provide analysis based on removing certain segments of the Manufacturer ID. As
detailed above, U.S. importers are required to write the first four numbers of their export
partner’s address and the first three letters of the exporter’s city in order to construct the MID.
Numbers may be likely sources of input errors since they may be transposed more easily than
alpha characters. City names may be prone to errors due to different interpretations about the
specific geographic location of a supplier. For instance, Kamal and Sundaram (2014) study the
17

role of Bangladeshi textile exporters located in the same city and exporting to a particular U.S.
importer in facilitating a match with the same U.S. importer. They find that in their sample of
Bangladeshi textile exporters to the U.S., the city variable extracted from the MID may represent
both districts and sub-districts in Bangladesh.
In order to mitigate the potential overestimation of exporter counts using the MID, it is
possible to eliminate numbers or last three characters from the raw MID, and then treat identical
truncated MIDs as a single exporter. Thus, the final effect of removing one or the other
component is to reduce the number of foreign suppliers generated using the U.S. data. For this
reason, we utilize the different permutations of the Manufacturer ID excluding all numeric
characters (“no number”) and excluding the last three characters (“no city”) and recalculate the
average number of exporters in columns 4 and 5 of Table 6.
Applying the simple cleaning procedures - either eliminating street numbers or
eliminating the city - tends to produce total foreign exporter estimates that are much closer to the
totals reported in the Exporter Dynamic Database, with few notable exceptions. If we replicate
the regression from Section 3.1, the regression coefficients for the “no number” and “no city”
versions of the MID are 1.001 and 0.94, respectively, suggesting that these truncation methods
are capable of reducing the number of MIDs to generate the number of foreign exporters that are
more in line with those reported by the origin country. Table 7, depicting the number of
exporters to the U.S. for seven countries, shows that there are significant improvements in
matching the sources originally described in Table 3 as well. These cleaning procedures also
improves the match between U.S. and Chinese datasets for the number of Chinese exporters: the
18

China/U.S. count share rises to 52.93 percent (no city), and 58.74 percent (no number), from 40
percent when using the raw MID.
4.2 Bigram Matching Algorithm
An alternative to applying a “brute force” cleaning procedure is to use a bigram matching
algorithm, and set a standard for determining if any Manufacturer ID is “similar enough” to
another Manufacturer ID. Bigram is an approximate string comparator computed from the ratio
of the number of common two consecutive letters of the two strings and their average length
minus one (Wasi and Flaaen, 2014). In this way, one could be more conservative about which
sets of Manufacturer IDs may be more likely to represent the same firm by setting the threshold
for matching to be as high as desired. We implement such a procedure by tallying the number of
matching string-variable component bigrams, and combining them into a field-similarity score
following. 21 Appendix I provides examples of pairs and their associated field-similarity score.
Within each country exporting to the U.S. in a given year, we compare each Manufacturer ID to
every other Manufacturer ID, and for those matches (or sets of matches) with high field-
similarity scores, we collapse them down into a single Manufacturer ID.
While this method sometimes works the same way as the blunter excise approach, it may
(depending on the threshold) capture subtler differences in the Manufacturing ID, or allow
similar MIDs with very different addresses to still be counted as different firms. For the 15
character Manufacturer ID, we identify a few rules of thumb for field-similarity: a score of 0.98
or higher tends to match MIDs with 1-2 characters being different, while scores of 0.97 or higher
21 We utilize the reclink2 module in STATA (Wasi and Flaaen, 2014). 19

tend to match to those MIDs that are identical in all aspects except for the address field. We use
both 0.98 and 0.97 as standards for whether two MIDs are similar enough, and report the total
number of foreign exporters according to each one. We believe these standards are sufficiently
low, so as to allow for the possibility of simple coding errors, while still being stringent enough
to not lump together two different firms. Table 8 presents the number of foreign suppliers by
country of origin that are dropped with a 0.97 and a 0.98 field-similarity score in 2008. We see
that eliminating “very similar” Manufacturer IDs using the matching procedure reduces the
number of foreign suppliers by about 10-15 percentage points compared to counts generated
using the “raw” Manufacturer ID. Furthermore, the bigram matching algorithm described here
also goes some way towards improving the match, with China/U.S. data count shares reaching
57.93 percent (for a 0.98 similarity score) and 63.39 percent (for a 0.97 similarity score)
compared to 40 percent using the “raw” MID.
Finally, as a supplement to our “cleaning” procedure, we manually inspect 100 random
Norwegian Manufacturer IDs. The goal is to identify instances where multiple Manufacturer IDs
may actually refer to the same firm, using reasonable judgment. We find 23 Manufacturer IDs
that we flag as potentially “problematic” - we find a total of 23 codes that are similar enough to
another code, such that instead of these 23 foreign firms there should be 11. Thus, through our
manual scanning exercise to identify “problematic” MIDs we reduce the number of MIDs by 12
percent, within the range generated through the matching program. In fact, if we apply the
matching algorithm to this sample, 17 MIDs would be identified as problematic, and would
20

collapse into eight firms, reducing the number of MIDs by 9 percent, closely mirroring our
subjective assessment.
As described at length throughout this paper, the likelihood that figures from different
sources will match is rare as evidenced even in aggregate data on trade volume between the U.S.
and Hungary or the U.S. and China that have well-known discrepancies based on which
country’s data is used.22 However, we view the above exercises as demonstrating that the
Manufacturer ID variable, especially incorporating our cleaning procedures or paying attention
to particular sectors, tends to match outside data closely providing reasonable assurance in using
it as a consistent identifier of foreign suppliers to study exporter-importer relationships in
international trade.
5. Summary
This paper investigates the properties and potential research uses of the “Manufacturer
ID” variable that identifies the foreign supplier in a U.S. merchandise import transaction. We
document the rules and laws that govern the generation of the MID, noting that the MID is
primarily meant to capture the origin-conferring entity in a merchandise import transaction. We
compute the number of exporters to the U.S. for a set of countries using the “Manufacturer ID”
and compare these to the same statistic computed using data sourced from the origin-country.
Our findings suggest that, on average, using the MID to compute these statistics tend to exceed
those using data from foreign data sources. Guided by this finding, we explore two main ways to
22 See https://www.census.gov/foreign-trade/reconcile/china.html; https://www.census.gov/foreign-trade/aip/recon_china_000406.pdf
21

“clean” the MID. Recreating the statistics using the modified MIDs, using either method, align
more closely with statistics from origin-country data sources.
We believe that the Manufacturer ID is a key element in allowing deeper investigations
of buyer and supplier relationships in international trade. Our findings offer the first set of
systematic evidence in identifying potential issues with using the MID, countries and sectors
where these issues may be more pronounced, and finally algorithms to modify the MID in order
to address the pertinent concerns. Future work linking individual firm-trade linked data from
origin countries to the U.S. merchandise import data will prove invaluable in furthering our
understating of the MID variable and subsequently its uses.
22

References
Becker, Randy, Joel Elvery, Lucia Foster, C.J. Krizan, Sang Nguyen, and David Talan, 2005. “A Comparison of the Business Registers Used By the Bureau of Labor Statistics and the Bureau of the Census,” Paper presented at 2005 Joint Statistical Meetings. Bekes, Gabor, Balazs Murakozy, and Peter Harasztosi, 2009. “Firms and Products in International Trade: Evidence from Hungary,” MT-DP-2009/19. Bekes, Gabor, Balazs Murakozy, and Peter Harasztosi, 2011. “Firms and Products in International Trade: Evidence from Hungary,” Economic Systems 35(1), 4-24. Benguria, Felipe, 2014. “Production and Distribution in International Trade: Evidence from Matched Exporter-Importer Data,” mimeo. Bernard, Andrew B., J. Bradford Jensen, and Peter K. Schott, 2010. “Wholesalers and Retailers in U.S. Trade,” American Economic Review Papers and Proceedings, 408-413. Bernard, Andrew B., J. Bradford Jensen, and Peter K. Schott, 2009. “Importers, Exporters and Multinationals: A Portrait of Firms in the U.S. that Trade Goods,” In Producer Dynamics : New Evidence from Micro Data, eds. Timothy Dunne, J. Bradford Jensen, and Mark J. Roberts, 513-552. Chicago, IL: University of Chicago Press. Bernard, Andrew B., J. Bradford Jensen, Stephen J. Redding, and Peter K. Schott, 2007. “Firms in International Trade,” Journal of Economic Perspectives 21(3), 105-130. Bernard, Andrew B., Andreas Moxnes, and Karen Helene Ulltveit-Moe, 2013. “Two-sided Heterogeneity and Trade’, mimeo. Blum, Bernardo, Sebastian Claro, and Ignatius Horstmann, 2011. “Intermediation and the Nature of Trade Costs: Theory and Evidence,” mimeo. Carballo, Jeronimo, Christian Volpe Martincus, and Gianmarco Ottaviano, 2013. “The Buyer Margins of Exports,” Center for Economic Performance working paper 9584. Cebeci, Tolga, Ana Fernandes, Caroline Freund, and Martha Pierola, 2012. “Exporter Dynamics Database,” World Bank Policy Research Working Paper 6229. di Giovanni, Julian and Andrei Levchenko, 2013. “Firm Entry, Trade and Welfare in Zipf’s World,” Journal of International Economics, 89(2), 283-296.
23

Dragusanu, Raluca, 2014. “Firm-to-Firm Matching Along the Global Supply Chain,” Harvard University working paper. Eaton, Jonathan, Marcel Eslava, David Jinkins, C.J. Krizan, and James Tybout, 2013. “A Search and Learning Model of Export Dynamics,” Pennsylvania State University working paper. Elvery, Joel, Lucia Foster, C.J. Krizan, and David Talan, 2006. “Preliminary Micro Data Results from the Business List Comparison Project,” Paper presented at 2006 Joint Statistical Meetings. Kamal, Fariha, and Asha Sundaram, 2014. “Buyer-Seller Relationships in International Trade: Do Your Neighbors Matter?” US Census Bureau Center for Economic Studies working paper 14-44. Melitz, Marc J., 2003. “The Impact of Trade on Intra-Industry Reallocations and Aggregate Industry Productivity,” Econometrica 71(6), 1695-1725. Monarch, Ryan, 2014. “It’s Not You, It’s Me: Breakups in US-China Trade Relationships,” US Census Bureau Center for Economic Studies working paper 14-08. Pierce, Justin R. and Peter K. Schott, 2012. “The Surprisingly Swift Decline of U.S. Manufacturing Employment,” NBER working paper 18655. U.S. Census Bureau. 2013. “U.S. International Trade in Goods and Services, April 2013,” http://www.census.gov/foreign-trade/Press-Release/2013pr/12/ft900.pdf. Accessed 18, September, 2014. Wasi, Nada, and Aaron Flaeen, 2014. “Record Linkage Using STATA: Pre-processing, Linking, and Reviewing Utilities,” University of Michigan working paper.
24

Figure 1. Excerpt from CBP Form 7501

Table 1. Stylized Examples of Manufacturer ID. Country Exporter Name Address City MANUFID
Bangladesh Red Fabrics 1234 Curry Road Dhaka BDREDFAB1234DHA France Green Chemicals 1111 Baguette Lane Paris FRGRECHE1111PAR
Republic of Korea Blue Umbrellas 88 Kimchi Street Seoul KRBLUUMB88SEO Notes: The above examples are based on fictitious names and addresses and are meant for illustrative purposes only.
26
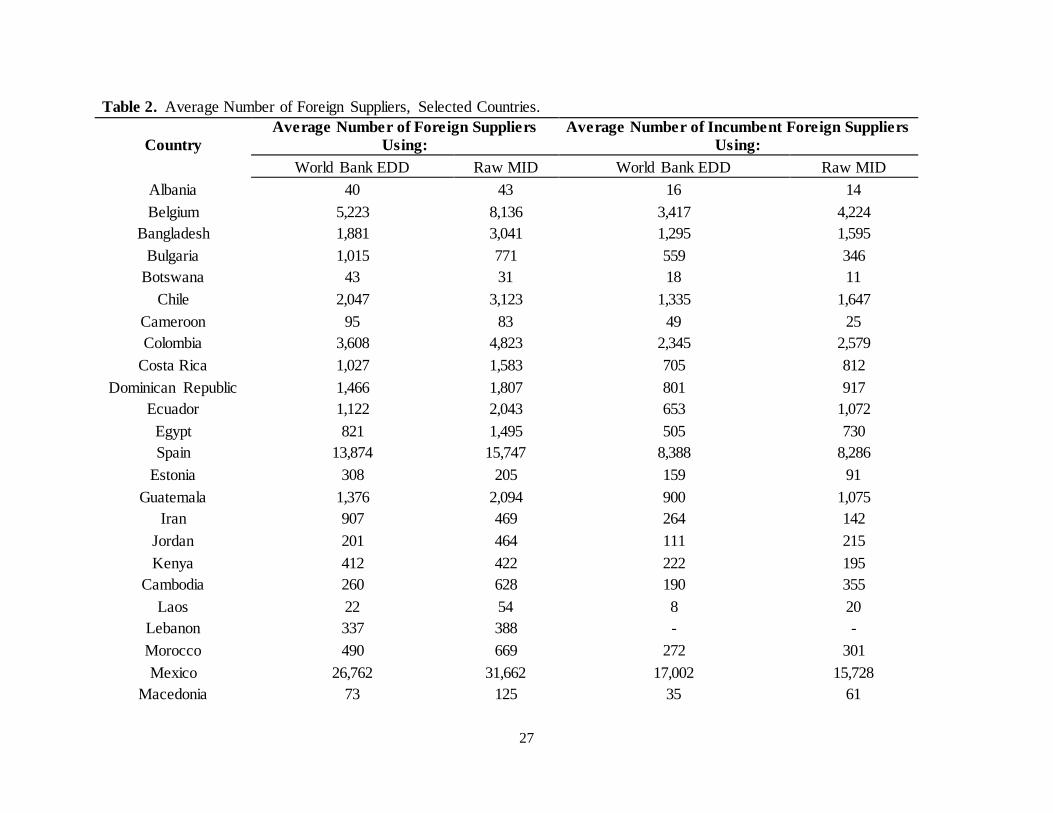
Table 2. Average Number of Foreign Suppliers, Selected Countries.
Country Average Number of Foreign Suppliers
Using: Average Number of Incumbent Foreign Suppliers
Using: World Bank EDD Raw MID World Bank EDD Raw MID
Albania 40 43 16 14 Belgium 5,223 8,136 3,417 4,224
Bangladesh 1,881 3,041 1,295 1,595 Bulgaria 1,015 771 559 346
Botswana 43 31 18 11 Chile 2,047 3,123 1,335 1,647
Cameroon 95 83 49 25 Colombia 3,608 4,823 2,345 2,579
Costa Rica 1,027 1,583 705 812 Dominican Republic 1,466 1,807 801 917
Ecuador 1,122 2,043 653 1,072 Egypt 821 1,495 505 730 Spain 13,874 15,747 8,388 8,286
Estonia 308 205 159 91 Guatemala 1,376 2,094 900 1,075
Iran 907 469 264 142 Jordan 201 464 111 215 Kenya 412 422 222 195
Cambodia 260 628 190 355 Laos 22 54 8 20
Lebanon 337 388 - - Morocco 490 669 272 301 Mexico 26,762 31,662 17,002 15,728
Macedonia 73 125 35 61
27

Mali 17 25 - - Mauritius 150 232 94 130 Malawi 54 54 21 28
Nicaragua 406 624 244 323 Norway 2,003 2,467 1,183 1,158 Pakistan 4,042 4,692 2,685 2,712
Peru 2,069 2,477 1,213 1,248 Portugal 2,607 3,814 1,697 1,952 Senegal 35 39 - -
El Salvador 876 978 498 488 Sweden 7,606 7,762 5,038 4,031 Turkey 4,368 7,982 2,686 3,806
Tanzania 196 140 104 58 Uganda 64 64 28 28 Yemen 15 25 - -
South Africa 4,007 3,700 2,396 1,567 Total 91,841 114,888 57,123 58,122
Notes: This table reports the average number of all and incumbent foreign suppliers calculated using the Manufacturer ID over the years 1992 through 2008. “Raw” refers to MIDs as they appear in the import data.
28

Table 3. Cross-country comparisons in number of exporters, Selected Countries and Years.
U.S. Merchandise Import Data
Country/Year Source Source Data Raw MID
Hungary (2003) Bekes et al. (2011) 714 1,238 Colombia (2008) Eaton et. al. (2014) 2,161 4,518 Norway (2006) Bernard et al. (2014) 2,088 2,584 Uruguay (2008) DNA 597 559
Costa Rica (2008) PROCOMER 1,116 1,627 Ecuador (2008) SENAE 1,151 1,973 China (2006) China Customs 76,081 190,376
Notes: This table compares the number of exporters from selected countries selling to the U.S. from two distinct data sources – official customs data by country and the U.S. Merchandise Import Transactions data. The statistics for China have been provided by Hong Ma and for Uruguay, Costa Rica, and Ecuador have been provided by Jeronimo Carballo and Christian Volpe Martincus. “Raw” refers to MIDs as they appear in the U.S. import data.
29

Table 4. Number of Chinese Suppliers, by HS2. HS2 Category HS2 Description Chinese #/ US #/
98 Special Classification Provisions 0.04 80 Tin and Articles Thereof 0.15 93 Arms and Ammunition 0.28 13 Lac, Gums, Resin, Etc. 0.31 26 Ores, Slag and Ash 0.47 50 Silk, Yarn, and Woven Fabric 0.49 62 Articles of Apparel and Clothing, Not Knitted 0.56 95 Toys, Games, and Sports Equipment 0.64 61 Articles of Apparel and Clothing, Knitted 0.74 3 Fish and Crustaceans 0.75 63 Made-up Textiles Articles 0.76 64 Footwear, Gaiters, and the Like 0.81 20 Preps of Vegetables, Fruits, Nuts, Etc. 0.86 53 Other Veg. Textile Fibers 0.89 52 Cotton Yarns and Woven Fabrics Thereof 0.96
Notes: See http://www.usitc.gov/tata/hts/bychapter/ for details on each chapter of the Harmonized Tariff Schedule of the United States. The third column reports the share of the count of Chinese exporters derived from Chinese customs data in the count of Chinese exporters derived from U.S. merchandise import transactions data.
30

Table 5. Analysis of Pseudo-MIDs as Constructed from China Industrial Production Data, Selected Industries Panel A: Uniqueness of Pseudo-MID, 2005
Industry CIC # Exporters # Psuedo-MIDs % CIC 3663 39 38 97 CIC 3689 27 26 97 CIC 3353 37 37 100 CIC 3331 35 35 100 CIC 4154 74 73 99
Notes: Panel A uses name, address, and city information from China NBS firm data to construct a Pseudo-MID for each firm, according to the rules laid out in U.S. CBP Form 7501. In constructing the name of the firm in English, we use the Hanyu Pinyin romanization of Chinese characters, with two to three characters per word of the English name. The second column states the number of firms with positive export values in the given industry in 2005. The third column states the number of unique constructed Pseudo-MIDs.
Panel B: Uniqueness of City Codes, 2005 Industry CIC # Cities # City Codes %
CIC 3663 22 21 96 CIC 3689 15 14 93 CIC 3353 28 24 86 CIC 3331 15 13 87 CIC 4154 19 18 95
Notes: Panel B uses city information from China NBS firm data to construct city information as found in the MID, where only the first three letters of city are given. The second column states the true number of cities with at least one exporting firm in the data from 2005, while the third column states the number of unique city codes.
Panel C: Changes in Pseudo-MID over Time, 2005-2006 Industry CIC # Exporters # Psuedo-MIDs %
CIC 3663 33 33 100 CIC 3689 26 26 100 CIC 3353 31 28 90 CIC 3331 20 17 85 CIC 4154 63 62 98
Notes: Panel C uses name, address, and city information from China NBS firm data to track whether constructed Pseudo-MIDs change over time for the same firm, identified here using the faren daima firm identifier from the NBS data. The second column states the number of exporting firms found in both 2005 and 2006, while the third column states the number of firms that have identical Pseudo-MIDs in both 2005 and 2006. Source: China National Bureau of Statistics, Monarch (2014).
31

Table 6. Panel A. Average Number of Foreign Suppliers, Selected Countries. Country Average Number of Foreign Suppliers Using:
World Bank EDD Raw MID MID – No Numbers MID – No City
Albania 40 43 42 41 Belgium 5,223 8,136 6,930 7,632
Bangladesh 1,881 3,041 2,321 2,726 Bulgaria 1,015 771 697 741
Botswana 43 31 26 29 Chile 2,047 3,123 2,372 2,791
Cameroon 95 83 78 82 Colombia 3,608 4,823 3,530 4,510
Costa Rica 1,027 1,583 1,237 1,379 Dominican Republic 1,466 1,807 1,404 1,639
Ecuador 1,122 2,043 1,507 1,879 Egypt 821 1,495 1,259 1,256 Spain 13,874 15,747 12,667 13,574
Estonia 308 205 191 199 Guatemala 1,376 2,094 1,629 1,739
Iran 907 469 431 463 Jordan 201 464 354 385 Kenya 412 422 362 397
Cambodia 260 628 530 459 Laos 22 54 48 52
Lebanon 337 388 364 366 Morocco 490 669 594 625 Mexico 26,762 31,662 26,626 27,784
Macedonia 73 125 116 119 Mali 17 25 24 24
Mauritius 150 232 218 188 Malawi 54 54 49 52
Nicaragua 406 624 465 574 Norway 2,003 2,467 1,997 2,312 Pakistan 4,042 4,692 3,486 4,410
Peru 2,069 2,477 2,001 2,216 Portugal 2,607 3,814 3,159 3,355
32

Senegal 35 39 37 38 El Salvador 876 978 786 813
Sweden 7,606 7,762 6,177 7,233 Turkey 4,368 7,982 5,963 7,157
Tanzania 196 140 127 138 Uganda 64 64 55 62 Yemen 15 25 24 24
South Africa 4,007 3,700 3,298 3,390 Total 91,841 114,888 93,098 102,763
33

Table 6. Panel B. Average Number of Incumbent Foreign Suppliers, For Selected Countries. Country Average Number of Incumbent Foreign Suppliers Using:
World Bank EDD Raw MID MID – No Numbers MID – No City
Albania 16 14 14 13 Belgium 3,417 4,224 4,222 4,106
Bangladesh 1,295 1,595 1,588 1,518 Bulgaria 559 346 346 340
Botswana 18 11 11 11 Chile 1,335 1,647 1,644 1,525
Cameroon 49 25 25 25 Colombia 2,345 2,579 2,577 2,470
Costa Rica 705 812 812 746 Dominican Republic 801 917 915 860
Ecuador 653 1,072 1,068 1,023 Egypt 505 730 731 646 Spain 8,388 8,286 8,275 7,477
Estonia 159 91 91 91 Guatemala 900 1,075 1,074 940
Iran 264 142 142 143 Jordan 111 215 215 180 Kenya 222 195 195 190
Cambodia 190 355 355 279 Laos 8 20 20 19
Morocco 272 301 301 290 Mexico 17,002 15,728 15,714 14,758
Macedonia 35 61 61 59 Mauritius 94 130 130 109 Malawi 21 28 28 28
Nicaragua 244 323 322 308 Norway 1,183 1,158 1,158 1,137 Pakistan 2,682 2,712 2,707 2,627
Peru 1,213 1,248 1,248 1,163 Portugal 1,697 1,952 1,949 1,820
El Salvador 498 488 488 435 Sweden 5,038 4,031 4,029 3,928
34
Turkey 2,686 3,806 3,799 3,575 Tanzania 104 58 58 58 Uganda 28 28 28 28
South Africa 2,396 1,567 1,567 1,521 Total 57,123 58,122 58,061 54,598
Notes: Panels A (B) in this table reports the average number of all (incumbent foreign suppliers calculated using three versions of the Manufacturer ID over the years 1992 through 2008. “Raw” refers to MIDs as they appear in the import data; “No Numbers” excludes numeric characteristics in the Raw MID and “No City” excludes the last three characters in the Raw MID.
35

Table 7. Cross-country comparisons in number of exporters, Selected Countries and Years.
U.S. Merchandise Import Data
Country/Year Source Source Data Raw MID MID - No Number MID - No City
Hungary (2003) Bekes et al. (2009) 714 1,238 1,073 1,170 Colombia (2008) Eaton et. al. (2014) 2,161 4,518 3,290 4,286 Norway (2006) Bernard et al. (2014) 2,088 2,584 2,078 2,402 Uruguay (2008) DNA 597 559 456 547
Costa Rica (2008) PROCOMER 1,116 1,627 1,287 1,408 Ecuador (2008) SENAE 1,151 1,973 1,438 1,805 China (2006) China Customs 76,081 190,376 129,517 143,752
Notes: This table compares the number of exporters from selected countries selling to the U.S. from two distinct data sources – official customs data and the U.S. Merchandise Import Transactions data. The statistics for China have been provided by Hong Ma and for Uruguay, Costa Rica, and Ecuador have been provided by Jeronimo Carballo and Christian Volpe Martincus. “Raw” refers to MIDs as they appear in the import data; “No Numbers” excludes numeric characteristics in the Raw MID and “No City” excludes the last three characters in the Raw MID.
36

Table 8. Number of Foreign Suppliers, by Country, 2008.
Not “Similar” at:
Not “Similar” at:
Country Raw MID 0.98 Match Score % 0.97 Match Score % Aruba 98 90 0.92 85 0.87
Afghanistan 238 220 0.92 209 0.88 Angola 77 73 0.95 69 0.90 Albania 61 58 0.95 57 0.93 U.A.E. 1,631 1,510 0.93 1,427 0.87
Argentina 4,168 3,737 0.90 3,485 0.84 Armenia 80 74 0.93 72 0.90
Antigua & Barbuda 55 55 1.00 53 0.96 Australia 10,548 9,724 0.92 9,103 0.86 Austria 4,502 4,009 0.89 3,788 0.84 Belgium 6,972 6,348 0.91 6,006 0.86
Bangladesh 3,403 2,876 0.85 2,574 0.76 Bulgaria 778 735 0.94 699 0.90 Bahrain 178 158 0.89 156 0.88
Bahamas 387 377 0.97 354 0.91 Bosnia & Herzegovina 97 91 0.94 89 0.92
Belarus 136 133 0.98 129 0.95 Bolivia 468 424 0.91 398 0.85 Brazil 12,058 10,346 0.86 9,107 0.76
Barbados 150 142 0.95 140 0.93 Botswana 49 46 0.94 45 0.92 Canada 76,654 69,150 0.90 66,005 0.86
Chile 2,968 2,579 0.87 2,344 0.79 China 304,509 216,278 0.71 189,028 0.62
Côte d'Ivoire 180 170 0.94 158 0.88 Cameroon 141 136 0.96 130 0.92
Congo 64 61 0.95 58 0.91 Colombia 4,452 3,934 0.88 3,615 0.81
Costa Rica 1,634 1,450 0.89 1,307 0.80 Cyprus 101 97 0.96 93 0.92
Czech Republic 2,949 2,647 0.90 2,524 0.86 Germany 57,078 49,065 0.86 45,946 0.80
37

Dominica 14 13 0.93 12 0.86 Denmark 4,796 4,281 0.89 4,087 0.85
Dominican Republic 1,529 1,323 0.87 1,214 0.79 Algeria 61 59 0.97 52 0.85 Ecuador 1,859 1,590 0.86 1,444 0.78
Egypt 1,428 1,249 0.87 1,132 0.79 Spain 13,513 11,798 0.87 10,858 0.80
Estonia 284 272 0.96 262 0.92 Ethiopia 206 184 0.89 175 0.85 Finland 2,526 2,283 0.90 2,126 0.84
Fiji 120 112 0.93 103 0.86 France 32,701 28,780 0.88 26,734 0.82
Faroe Islands 41 33 0.80 25 0.61 Gabon 50 46 0.92 44 0.88
United Kingdom 48,255 42,665 0.88 40,564 0.84 Ghana 240 227 0.95 216 0.90 Guinea 26 24 0.92 22 0.85 Greece 1,459 1,365 0.94 1,298 0.89
Guatemala 1,884 1,612 0.86 1,419 0.75 Guyana 124 114 0.92 110 0.89
Hong Kong 16,747 15,351 0.92 14,355 0.86 Honduras 1,008 847 0.84 796 0.79 Croatia 328 306 0.93 295 0.90
Haiti 174 151 0.87 143 0.82 Hungary 1,928 1,733 0.90 1,670 0.87 Indonesia 10,011 8,496 0.85 7,589 0.76
India 38,417 32,619 0.85 29,193 0.76 Ireland 2,979 2,712 0.91 2,638 0.89
Iran 421 400 0.95 391 0.93 Iraq 288 268 0.93 256 0.89
Iceland 263 257 0.98 245 0.93 Israel 8,624 7,596 0.88 7,027 0.81 Italy 63,517 53,662 0.84 48,319 0.76
Jamaica 454 415 0.91 395 0.87 Jordan 426 353 0.83 312 0.73
38

Japan 40,495 33,350 0.82 30,899 0.76 Kazakhstan 91 88 0.97 85 0.93
Kenya 400 370 0.93 345 0.86 Cambodia 704 571 0.81 526 0.75
Saint Kitts & Nevis 86 68 0.79 66 0.77 Korea 28,967 24,427 0.84 22,923 0.79 Kuwait 219 208 0.95 199 0.91 Laos 61 57 0.93 51 0.84
Lebanon 333 320 0.96 309 0.93 Libya 31 29 0.94 25 0.81
Sri Lanka 1,545 1,336 0.86 1,234 0.80 Lesotho 84 69 0.82 63 0.75 Lithuania 463 434 0.94 414 0.89
Luxembourg 268 243 0.91 232 0.87 Latvia 214 204 0.95 189 0.88 Macao 1,120 853 0.76 752 0.67
Morocco 789 716 0.91 665 0.84 Moldova 94 89 0.95 85 0.90
Madagascar 242 212 0.88 191 0.79 Mexico 31,244 28,154 0.90 26,162 0.84
Macedonia 120 118 0.98 114 0.95 Malta 148 135 0.91 131 0.89
Mongolia 101 93 0.92 90 0.89 Mauritius 154 141 0.92 141 0.92 Malawi 61 56 0.92 53 0.87
Malaysia 10,200 8,726 0.86 8,054 0.79 Nigeria 285 277 0.97 260 0.91
Nicaragua 667 557 0.84 514 0.77 Netherlands 11,876 10,839 0.91 10,185 0.86
Norway 2,560 2,307 0.90 2,154 0.84 Nepal 791 680 0.86 562 0.71
New Zealand 3,420 3,130 0.92 2,854 0.83 Oman 112 104 0.93 96 0.86
Pakistan 4,707 3,990 0.85 3,574 0.76 Panama 669 623 0.93 597 0.89
39

Peru 3,492 3,024 0.87 2,666 0.76 Philippines 6,134 5,314 0.87 4,858 0.79
Papua New Guinea 93 87 0.94 77 0.83 Poland 3,623 3,319 0.92 3,174 0.88
Portugal 3,924 3,441 0.88 3,172 0.81 Paraguay 136 128 0.94 121 0.89
French Polynesia 180 162 0.90 156 0.87 Qatar 211 188 0.89 181 0.86
Russian Federation 2,049 1,877 0.92 1,802 0.88 Saudi Arabia 482 463 0.96 438 0.91
Singapore 7,119 6,257 0.88 5,824 0.82 El Salvador 907 779 0.86 700 0.77 Suriname 65 62 0.95 57 0.88 Slovakia 629 577 0.92 554 0.88 Slovenia 660 598 0.91 562 0.85 Sweden 7,567 6,650 0.88 6,214 0.82
Swaziland 62 55 0.89 53 0.85 Syria 121 113 0.93 110 0.91
Thailand 14,592 12,216 0.84 11,118 0.76 Trinidad & Tobago 516 488 0.95 467 0.91
Tunisia 631 583 0.92 552 0.87 Turkey 8,106 6,697 0.83 6,085 0.75
Tanzania 163 156 0.96 150 0.92 Ukraine 551 518 0.94 501 0.91 Uruguay 515 466 0.90 443 0.86
Venezuela 783 725 0.93 693 0.89 Vietnam 8,770 7,112 0.81 6,488 0.74
South Africa 3,754 3,526 0.94 3,272 0.87 Zimbabwe 61 57 0.93 57 0.93
Total 972,782 799,201 0.90 730,113 0.85 Notes: This table reports the number of foreign suppliers by country of origin in 2008 using three versions of the Manufacturer ID. “Raw” refers to MIDs as they appear in the import data; Not similar at “0.98 Match Score” and “0.97 Match Score” refers to MIDs modified using bigram matching algorithms with 0.98 and 0.97 thresholds, respectively.
40
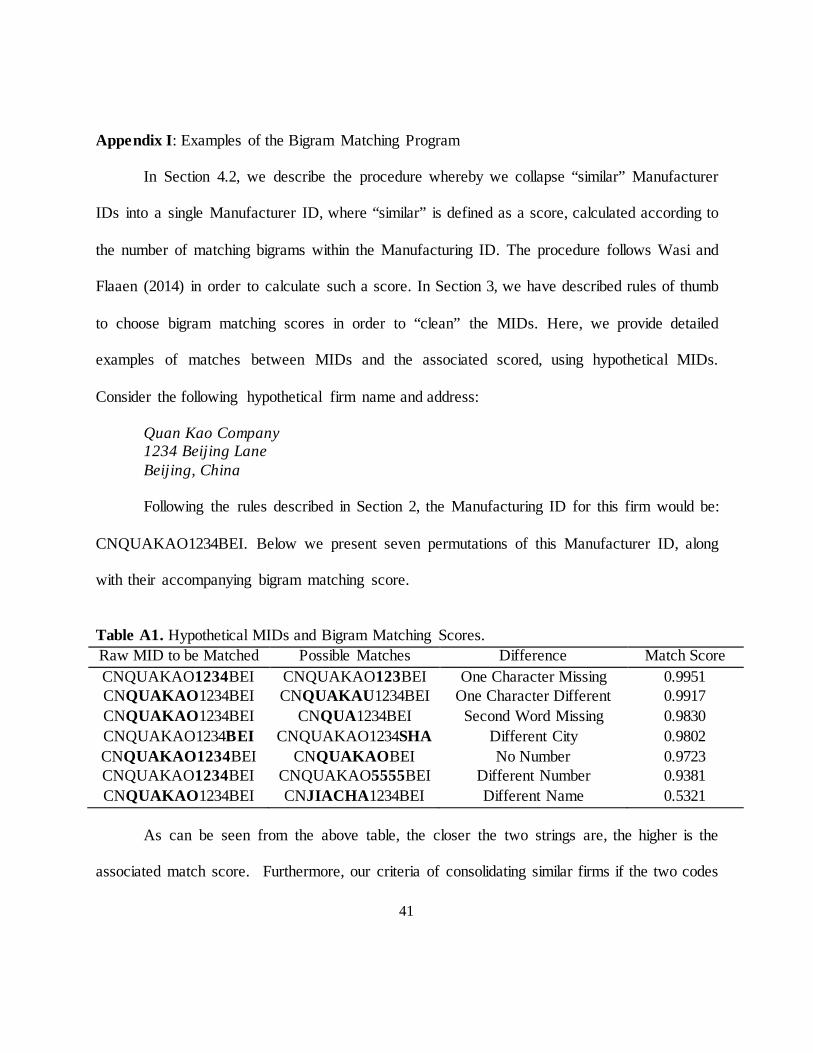
Appendix I: Examples of the Bigram Matching Program
In Section 4.2, we describe the procedure whereby we collapse “similar” Manufacturer
IDs into a single Manufacturer ID, where “similar” is defined as a score, calculated according to
the number of matching bigrams within the Manufacturing ID. The procedure follows Wasi and
Flaaen (2014) in order to calculate such a score. In Section 3, we have described rules of thumb
to choose bigram matching scores in order to “clean” the MIDs. Here, we provide detailed
examples of matches between MIDs and the associated scored, using hypothetical MIDs.
Consider the following hypothetical firm name and address:
Quan Kao Company 1234 Beijing Lane Beijing, China Following the rules described in Section 2, the Manufacturing ID for this firm would be:
CNQUAKAO1234BEI. Below we present seven permutations of this Manufacturer ID, along
with their accompanying bigram matching score.
Table A1. Hypothetical MIDs and Bigram Matching Scores. Raw MID to be Matched Possible Matches Difference Match Score CNQUAKAO1234BEI CNQUAKAO123BEI One Character Missing 0.9951 CNQUAKAO1234BEI CNQUAKAU1234BEI One Character Different 0.9917 CNQUAKAO1234BEI CNQUA1234BEI Second Word Missing 0.9830 CNQUAKAO1234BEI CNQUAKAO1234SHA Different City 0.9802 CNQUAKAO1234BEI CNQUAKAOBEI No Number 0.9723 CNQUAKAO1234BEI CNQUAKAO5555BEI Different Number 0.9381 CNQUAKAO1234BEI CNJIACHA1234BEI Different Name 0.5321
As can be seen from the above table, the closer the two strings are, the higher is the
associated match score. Furthermore, our criteria of consolidating similar firms if the two codes
41

have similarity indices of over 0.98 or 0.97 seem reasonable according to the above standards:
while some simple coding errors (such as missing one character in the name, or forgetting to use
the second word of the firm’s name) might be reasonable to assume as potentially occurring in
the data, errors on the scale of wholly different addresses or firm names are certainly likely to be
much less common.
42

Appendix II: Additional Statistics
We provide additional statistics in Tables A2 showing the total number of foreign
suppliers to the U.S. using the raw MID, as well as the “no number” and “no city” versions, for
the years 1997 through 2008. As can be seen, removing street numbers tends to reduce the
number of unique foreign exporters by about 20 percentage points on average, while removing
the city code only to reduce the total by about 15 percentage points. Table A3 shows the average
numbers of foreign suppliers calculated using the raw, “no number” and “no city” versions of the
Manufacturer ID, respectively, over the period 1992 through 2008 by geographic region of the
country of origin. The reductions are largest in percentage point terms for Manufacturer IDs
representing foreign suppliers originating in Asia.
We also investigate the concentration of imports among foreign suppliers using the
Manufacturer ID, we compute the share of imports by country/HS2 pairing accounted for by the
top 5 Manufacturer IDs (those with the 5 largest transaction values) in 2000. The choice of a
particular year does not alter our findings. We find that for about half of the country/HS2
pairings, the top 5 foreign suppliers account for about 98-100 percent of all import value. Thus,
using the MID we see that exports to the U.S. from a particular country are clustered among a
very small set of exporting firms. However, this result itself is not surprising: indeed, these
numbers are comparable to the share of export value accounted for by the top 5 U.S. exporters
within a destination/HS2 category.
43

We use the export records only in the Linked/Longitudinal Foreign Trade Transactions
Database (LFTTD-EXP) to compute the analogous shares for U.S. exporters.23 We find that for
about half of the country/HS2 pairings, the top 5 U.S. exporters account for 100 percent of all
export value in 2000. Thus, we feel confident that the share of import value accounted for by a
seemingly small number of foreign firms as identified by the Manufacturer ID is not indicative
of serious problems in the construction of the variable, rather it is consistent with the well-known
fat tail of the firm size distribution (di Giovanni and Levchenko, 2013) as well as the high
concentration of trade among a small group of firms (Bernard, Jensen, Redding, and Schott
(2007) document patterns for the U.S.). Also, using more disaggregated product categories, we
do not tend to see large numbers of products being traded with an unrealistically small numbers
of foreign suppliers. Between 1997 and 2008, for the approximately 9000 HS10 products
imported by the U.S., on average, 88 percent have 5 or more (accounting for 99.4 percent of U.S.
imports) and 96.3 percent have 1 or more MIDs associated with its transaction.
23 See http://www.census.gov/ces/dataproducts/datasets/lfttd.html for further data description. 44

Table A2. Number of Foreign Suppliers, 1997-2008. Year Total Number of Foreign Suppliers
Raw MID No Numbers % of Raw No City % of Raw
1997 708,503 562,354 0.79 618,300 0.87 1998 723,496 575,040 0.79 632,137 0.87 1999 739,061 587,348 0.79 644,159 0.87 2000 783,252 622,066 0.79 681,428 0.87 2001 790,203 629,487 0.80 686,868 0.87 2002 814,048 645,629 0.79 705,218 0.87 2003 827,348 653,090 0.79 712,897 0.86 2004 856,844 675,006 0.79 735,221 0.86 2005 926,584 723,298 0.78 790,375 0.85 2006 1,000,429 778,145 0.78 845,528 0.85 2007 1,019,366 791,624 0.78 864,695 0.85 2008 997,973 774,118 0.78 848,319 0.85
Notes: This table reports the number of unique manufacturer IDs in each year. “Raw” refers to MIDs as they appear in the import data; “No Numbers” excludes numeric characteristics in the Raw MID and “No City” excludes the last three characters in the Raw MID.
45

Table A3. Average Number of Foreign Suppliers, by Geographic Region. Year Total Number of Foreign Suppliers
Raw MID No Number % of Raw No City % of Raw
North America (excluding Mexico) 89,677 77,392 0.86 85,555 0.95 Central America and Mexico 42,531 35,397 0.83 37,888 0.89
South America 25,295 19,438 0.77 22,481 0.89 Europe 284,069 235,302 0.83 244,025 0.86 Asia 299,490 214,047 0.71 250,231 0.84
Oceania 12,085 10,454 0.87 10,928 0.90 Africa 6,803 5,981 0.88 6,234 0.92
Notes: This table reports the average number of foreign suppliers calculated using three versions of the Manufacturer ID over the years 1992 through 2008 by broad geographic regions. “Raw” refers to MIDs as they appear in the import data; “No Numbers” excludes numeric characteristics in the Raw MID and “No City” excludes the last three characters in the Raw MID.
46