Identify the Risk and Mitigation Potentials of Landslides ...
16
GSJ: Volume 8, Issue 7, July 2020 151 ISSN 2320-9186 GSJ: Volume 8, Issue 7, July 2020, Online: ISSN 2320-9186 www.globalscientificjournal.com Identify the Risk and Mitigation Potentials of Landslides: Case Study of Maragala Mountain Range in Moneragala Sri Lanka H.A.C.D.Senavirathna, Asitha de Silva H.A.C.D.Senavirathna, Department of Geography, University of Colombo, Sri Lanka. E-mail: [email protected] Asitha de Silva, Department of Geography, University of Colombo, Sri Lanka. E-mail: [email protected] ABSTRACT Landslides have become one of the major disasters in Sri Lanka which has a devastative impact on anthropogenic activities. Being the highest mountain range in Monaragala district, Maragala Mountain has also classified as a landslide prone site. Therefore, the main objective of this study is to identify the landslide risk areas and the potentials of landslide risk mitigation. Questionnaires, interviews, field observations were mainly used as qualitative methods of data collection and secondary data from NBRO and Survey Department were used as the quantitative data. Satellite images were used to identify the potential landslide zones and land use. According to the analysis Viharamulla Grama Niladhari Division was identified as the high-risk area for landslides. Based on qualitative data it was clear that there is lack of awareness about landslide hazard among the community, as well as authorities. There are several cases of rock fall which happened during the past decade yet people are reluctant to inform the authorities. The main reason is the lack of awareness and they never consider it as a potential risk. If the authorities can make people aware of there is a high possibility of mitigating a future devastating landslide event. Lack of vision, frameworks, plans and non-interconnected policy practices keep the risk strong. It is always recommended to empower regional level authorities should make decisions on the possible disaster risks, mainly in the identification of risk. Therefore, this study has mainly identified the potential risk of landslide and it is the time to take necessary actions to mitigate the potential loss before it is too late. KeyWords Landslide, Hazard, Risk, Risk mapping, Perception, Mitigation, vulnerability GSJ© 2020 www.globalscientificjournal.com
Transcript of Identify the Risk and Mitigation Potentials of Landslides ...
GSJ: Volume 8, Issue 7, July 2020 151 ISSN 2320-9186
GSJ: Volume 8, Issue 7, July 2020, Online: ISSN 2320-9186 www.globalscientificjournal.com
Identify the Risk and Mitigation Potentials of Landslides: Case Study of Maragala Mountain Range in Moneragala Sri Lanka H.A.C.D.Senavirathna, Asitha de Silva H.A.C.D.Senavirathna, Department of Geography, University of Colombo, Sri Lanka. E-mail: [email protected] Asitha de Silva, Department of Geography, University of Colombo, Sri Lanka. E-mail: [email protected] ABSTRACT Landslides have become one of the major disasters in Sri Lanka which has a devastative impact on anthropogenic activities. Being the highest mountain range in Monaragala district, Maragala Mountain has also classified as a landslide prone site. Therefore, the main objective of this study is to identify the landslide risk areas and the potentials of landslide risk mitigation. Questionnaires, interviews, field observations were mainly used as qualitative methods of data collection and secondary data from NBRO and Survey Department were used as the quantitative data. Satellite images were used to identify the potential landslide zones and land use. According to the analysis Viharamulla Grama Niladhari Division was identified as the high-risk area for landslides. Based on qualitative data it was clear that there is lack of awareness about landslide hazard among the community, as well as authorities. There are several cases of rock fall which happened during the past decade yet people are reluctant to inform the authorities. The main reason is the lack of awareness and they never consider it as a potential risk. If the authorities can make people aware of there is a high possibility of mitigating a future devastating landslide event. Lack of vision, frameworks, plans and non-interconnected policy practices keep the risk strong. It is always recommended to empower regional level authorities should make decisions on the possible disaster risks, mainly in the identification of risk. Therefore, this study has mainly identified the potential risk of landslide and it is the time to take necessary actions to mitigate the potential loss before it is too late. KeyWords Landslide, Hazard, Risk, Risk mapping, Perception, Mitigation, vulnerability
GSJ© 2020 www.globalscientificjournal.com
GSJ: Volume 8, Issue 7, July 2020 152 ISSN 2320-9186
INTRODUCTION A disaster is a phenomenon that can cause damage to life and property and destroy economic, social and culture life of people. The numbers of disasters have risen continuously, as a result of the anthropology activities and public unawareness. Landslide is one of the major disasters in Sri Lanka. Landslides cover down slop movements of soil and rock materials in masses under gravity. Many of the natural hill slopes which are considered safe in the past are now recording landslides and its intensity is increasing due to human interventions in hill slopes (DMC, 2012). Landslides are normally associated with intense monsoon and inter-monsoon rain in Sri Lanka (S.Jayaprakash et al , 2013). However, there are unidentified landslide hazard areas and risk areas in Sri Lanka and most of the people do not know whether they are vulnerable or not. When the landslides are activated in these areas, there isn’t a possible way of safety because of extemporary situation. Monaragala in Sri Lanka has no recorded history of landslides. This study will focus on the landslide possibility of the heart of Moneragala district, Maragala mountain range and the largest biodiversity area in the district. Since landslide occurrences have been re-ported rapidly around Sri Lanka, there are programs to find out the hazard areas by government level. National Building Research Organization (NBRO) is a part of this process and they have created a hazard map on landslide occurrence in Maragala Mountain Range. However, Risk map has not been created yet for this area. The focus of this study is to identify the risk and mitigation potentials of landslide. Moreover, people do not have any idea about landslide occurrence in the area. So, finding the risk areas and mitigation potentials would help to make awareness of people. There are objectives as follows to achieve the target as; identifying the landslide risk areas and identifying the potentials of landslide risk mitigation strategies. RELATED STUDIES There are many studies have been conducted throughout the world based on Landslide. Some related studies were discussed along with their objectives methodologies and also how it can be related to this particular study. Robert et al. (2007) conducted “Risk mapping of landslides in new member states” to compare landslide risk among 10 member states in central and eastern Europe (PECO) countries. They examine the existing situation in each surveyed country for mapping of priority natural and technological hazards. In this study, compared practices were used in the different countries for hazard to inform guidelines for establishing national mapping system. They have used a questionnaire on risk mapping practices and policy for priority hazard to the target countries as methodology. Most commonly collected landslide data relate to the following parameters: precipitation (in all of the countries), seismology (Bulgaria, Cyprus, the Czech Republic and Romania) and geological features (all countries). Geo-referenced information with associated metadata was available in the Czech Republic, Cyprus, Romania and Slovakia. Their recommendation was to design and implement new mapping tools for visualizing and managing landslide hazards. This research helps to identify the landslide map categories and to compare landslide mapping process between Sri Lanka and surveyed countries. Schneider J.MC. (2016) studied landslide hazard zonation mapping using bivariate statistical analysis method to evaluate landslide hazard zonation maps prepared through a bivariate statistical technique. Five basic maps were obtained by editing, merging, dis-solving and assigning weight values for the existing slopes in a statistic model. Then multy criteria analysis method by Arc GIS 10 has been used to be generated the Landslide Hazard Zonation Map (LHZM) by reclassifying landslide hazard map. Although, used materials are different from my study, the techniques of editing, merging, and dissolving the digital layer were extracted. To identified whether 1:50000 LHZM is accurate enough to make decisions on Landslide Risk Assessment Process (LRAP), structured professional interviews, their methods of application assessments and opinion were taken in to consideration by Sugathapala K. and Vijekumara P.A (2013). According to the analysis of this research it seems that areas marked as “safe slop and landslide not likely to occur” in 1:50000 LHZM, are not always safe in reality when it is compared with the relevant applications. All these reasons for rejection of application can be categorized in to following the categories as steep unstable slop and geomorphology, poor drainage system and erodible area, soil conditions and small landslides located in a landslide prone area and landslide flow path. I have used 1:50000 LHZM which available in NBRO and considered about above factors when preparing landslide risk map. Jayathilake D. et al. (2015) discussed about a tool which required in preparing Landslide Risk Map. Under the topic “Human settlement mapping as a tool for preparing Landslide Risk Maps”, to explore the significance of utilizing Human Settlements Maps (HSM) in landslide risk assessment process. HSM is the one of the fundamental tool for development of risk map and it has been used in my study as well.
GSJ© 2020 www.globalscientificjournal.com

GSJ: Volume 8, Issue 7, July 2020 153 ISSN 2320-9186
Quantitative landslide risk assessment and mapping was conducted by Jayathilake D. and Munasinghe D. (2016) to present landslide risk mapping methodology. Hazard Map overlaid with completed HSM and pairwise ranking method have been used to weighting the human settlement categories. In my study Landslide Risk Map (LRM) was generated and the methodology here was used with some indifference of the HSM’s legend and weighting numbers due to considering small study area. Lee M.J. et al. (2014) studied to evaluate the landslide hazard at Inje, Korea using a Geographic Information System (GIS) and rainfall probabilistic data. Landslide susceptibility map was prepared with overlay analysis using frequency ration model based on database construction. Landslide hazard map was generated with the combination of the establishment of the threshold recurrence interval of landslide hazard and rainfall probability. It shows that rainfall influence more to trigger landslide and Monsoon and Inter-Monsoon period lead to trigger landslide in Sri Lanka and risk may very high these periods. Likewise the all these studies are somehow related to this particular study and the relevant influences are taken in to consideration in order to make this study a success. METHODOLOGY This study will consider the various parameters and modalities. So, as a key part of this methodology will be presented in this section elaborately. Methodology has been divided in to three main categories as methodology of data collection, methodology of data analysis and methodology of information presenting. Methodology of data collection In this study many of the data types are incorporated. Questionnaire survey, interviews and field observations were conducted under primary data collection. In this study, questionnaire survey was held like interviews and filled by enumerators because for having high accuracy and best understanding. This method has been adopted for the sampled sector. Sample size was 134 and selected as below methodology. Fig.1 Methodology of selecting the sample size TABLE 1 Number of Selected Houses
GSJ© 2020 www.globalscientificjournal.com

GSJ: Volume 8, Issue 7, July 2020 154 ISSN 2320-9186
Questionnaires have been used for collecting data of demographic information, awareness on landslides and mitigation potentials. It contains both structured questions with blanks to be filled and open-ended questions. Questionnaire was prepared using major language of the target group. In this study, structured interviews also were held as the primary data collecting method. Structured interviews consist of a series of pre-determined questions and interviewees would answer in the same order. Information from structured interviews tends to be more compared to other form of interviews because researches can compare and contrast different answers given to the same questions. Director of Central Environment Authority, Director of Disaster Management Center, Six Grama Niladhari officers, Presidents of water project in mountain area and few of villagers were interviewed for more information. In this study, field observations have used to understand people’s behaviors, habits, needs and social relations. Secondary data were collected from several sources. 1:50000 LHZM of selected six Grama Niladhari divisions in Moneragala which is used in this study is an ingested one from 1:50000 LHZM of Moneragala district by NBRO and it was the basement of this study. Digital maps of Land use, Hydro, Terrain, Transport and Buildings in 1:50000 scales have been taken over from the survey department of Sri Lanka. These data was used to generate Landslide Risk maps for the selected area. Moneragala district secretariat office have collected population data each and every year and launching annually as Resource Profile (Sampath Pathikada). All population data that wanted to this study has been taken from Resource Profile 2017 issued by Moneragala district secretariat office. Satellite images were used to clarify and observe the buildings and geomorphological evidence. Building survey was done to identify the buildings of the area. Building survey has been done using Google Earth Software. Methodology of Data Analysis Two adopted methodologies for the preparation of landslide risk maps are as follows. First methodology is followed by the risk map-ping methodology of NBRO. Land use map, Settlements map, Road map and Hazard map are the four main inputs for Landslide risk map. NBRO uses human settlement map which including land use and settlements together but in this study land use and settlements have been taken as individuals because selected area is smaller than the area which is normally covered by NBRO. After as-signing the weights for these four maps, it was overlaid. Then risk map is generated calculating the associated risk level for each hazard zones (Fig 2).
Fig. 2 Methodology of landslide risk mapping according to NBRO- part1
GSJ© 2020
www.globalscientificjournal.com

GSJ: Volume 8, Issue 7, July 2020 155 ISSN 2320-9186
*1 Map revised through topological editing because land use shape files have been brought from survey department. After merge all shape files, some polygons were not matched so it was difficult to create some polygons while save the shapes with merge. There-fore topological editing in Arc GIS 10.1 was used. *2 Building survey was done by digitizing on Google map but it was difficult to find some especial places like schools, libraries and Ayurveda hospitals. Therefore, after check through survey department data and field visits, names of buildings were changed. *3 Analytical Hierarchical Process was used to take weighted values. The methodology of taking weighted values will be discussed below after methodology of risk mapping. After having four weighted maps the methodology was continued (fig 3). Fig.3 Methodology of Landslide Risk Mapping According to NBRO- part2 As above part of the methodology classified land use risk map, road risk map and settlement risk map were prepared. Resulted values of risk have been classified in to four major categories as High, Moderate, Low and Least. After that, continued the methodology to generate final risk map (Fig 4). Fig.4 Methodology of Landslide Risk Mapping According to NBRO- part3 Weighted method which used in above methodologies will be described further more. Main purpose of assigning the weights of Land Use, Roads and Buildings are to get the level of significant of the each classified categories in terms of casualties. Assigning the weights requires arranging classified categories in a matrix format to compare interactively with each to others. Analytical Hierarchical Process (AHP) were used to weight various categories which were identified under land use, road and settlement mapping. The AHP was developed by Saaty (1980) and quite often is referred to, as the “Saaty method”. The mathematical approach of the AHP and the calculation techniques are explained and its essence is to construct a matrix expressing the relative values of a set of attributes. For example, what is the relative importance on risk of landslide? Saaty’s ranking scale is shown below and it has been changed some definitions to fit with this study but scale has not been changed.
GSJ© 2020 www.globalscientificjournal.com

GSJ: Volume 8, Issue 7, July 2020 156 ISSN 2320-9186
TABLE 2 Ranking scale
According to the above mentioned theory and method, following pairwise ranking matrix was prepared for land use and settlements (Fig .5 & Fig. 6). Fig.5 pairwise ranking matrix for land use categories Fig.6 pairwise ranking matrix for settlement categories
Fig.7 pairwise ranking matrix for road categories After getting the rankings for all pairs, eigenvectors for each factor were calculated. Calculations of eigenvectors were done by using MS Excel. First, the table was squared by using table multiplication function =MMULT(B2:J10,B2:J10). Multiplied values were summed as rows and total of all summed rows were calculated. Summed values of each row were normalized by summed rows total (Fig. 8).
GSJ© 2020
www.globalscientificjournal.com

GSJ: Volume 8, Issue 7, July 2020 157 ISSN 2320-9186
Fig. 8 Steps of the calculation Same procedure was repeated for several times until normalized values get consistent. Consistent values (eigenvectors) are taken as the weight of each factor (Table 3). TABLE3 Weights of all categories These weighted values (Table 3) were input to the attribute tables in GIS. Weight values of Landslide Hazard Map have been taken from NBRO (Table 4) TABLE 4 Hazard level and values To take this values, LHZM rasterized in to 30m grids and probability of occurrence landslide of each grid find out from hazard map, Area composition of each hazard class in a grid was calculated and filled in a table, for this table a regression equation fitted by using Matlab software and derived weight to each hazard categories, was done. These values were normalized for the easy use and understanding. Risk calculation is the necessary part while generating risk map. To calculate risk, it can be used below calculation.
GSJ© 2020 www.globalscientificjournal.com

GSJ: Volume 8, Issue 7, July 2020 158 ISSN 2320-9186
It is very difficult to assess the capacity of each and every element in a given area. Hence vulnerability values and capacity are taken from the weighted values of the land use map, road map and settlement map. Resulted values have been classified in to four major categories as High, Medium, Low and least risk area. The classifications were done based on equal category method in to four categories in ArcGIS 10.1 software. Second risk map have been generated using personal criteria by the authors and build a model in GIS to create the map (Fig 9). Fig. 9 Model for weighted overlay risk map Under this methodology settlement, road and land use were weighted using AHP method (Fig. 10). Weighted values for settlements, road and land use added when it overlaid. The weighted values were calculated for various categories using AHP (Table 5). Fig 10: Pairwise ranking matrix for settlement, land use and road TABLE 5 Weighted values for weighted overlay risk map Landslide flow path is also considered. To find flow direction use hydrology tool in GIS software (Fig. 11). Fig. 11 Methodology of Catchment Extraction
GSJ© 2020 www.globalscientificjournal.com

GSJ: Volume 8, Issue 7, July 2020 159 ISSN 2320-9186
Basin wised landslide risk intensity was identified through maps (Fig 12). Fig.12 Methodology of intensity of risk area *3 Sum of “landslide hazard most likely to occur” areas and “landslide hazard are to be expected” areas were divided by basin area and multiply by 100 to get the percentages of landslide hazard area of whole basin area. Strengths, weakness, opportunities and threats were identified for landslide risk mitigation. To find these four categories SWOT anal-ysis was used. SWOT analysis is an analytical method which is used to categories significant internal (strengths and weaknesses) and external (opportunities and threats) factors. Questionnaire survey and interviews were used to find strengths, weaknesses, opportunities and threats. First, all opinions about risk mitigation programs were listed from the answers. Based on the responses it is divided in to above four categories (Fig.13). Fig. 13 Methodology of descriptive analysis Methodology of information presenting This is also known as visualization. It is important to look at summary statistics along with the data set to understand the entire picture, as the same summary statistic may describe very different data sets. Descriptive statistics can be illustrated in an understandable fashion by presenting them graphically using statistic and data presenting tool. This study basically stands on mapping. Risk areas are presented through maps. It helps to identify the surface distribution of hazard and risk clearly.
GSJ© 2020 www.globalscientificjournal.com

GSJ: Volume 8, Issue 7, July 2020 160 ISSN 2320-9186
Tables have been used to carry out the calculation results and data with summarization while percentages are shown in pie charts. Visualization through map was helped to give a clear idea about the selected area and risk areas. Classifications were done using Arc GIS and main output was Maps. Flow diagrams help lot to describe the methodologies of the study. It gives a clear picture about the way of done (Fig. 14). Fig. 14 Methodology of data and information presenting Results and Discussion Identifying landslide risk areas According to the weighted overlay risk mapping, landslide risk has been considered only for the human habitations and its associated features (Fig. 15). It is very clear that bottom of Maragala Mountain indicates the highest risk since it has almost all the anthropogenic activities agglomerated. It has also highlighted the Aliyawatta area being a mountainous region since it has more line houses belongs to the estate. Fig. 15 Landslide risk area based on normal weighted overlay method
GSJ© 2020 www.globalscientificjournal.com
GSJ: Volume 8, Issue 7, July 2020 161 ISSN 2320-9186
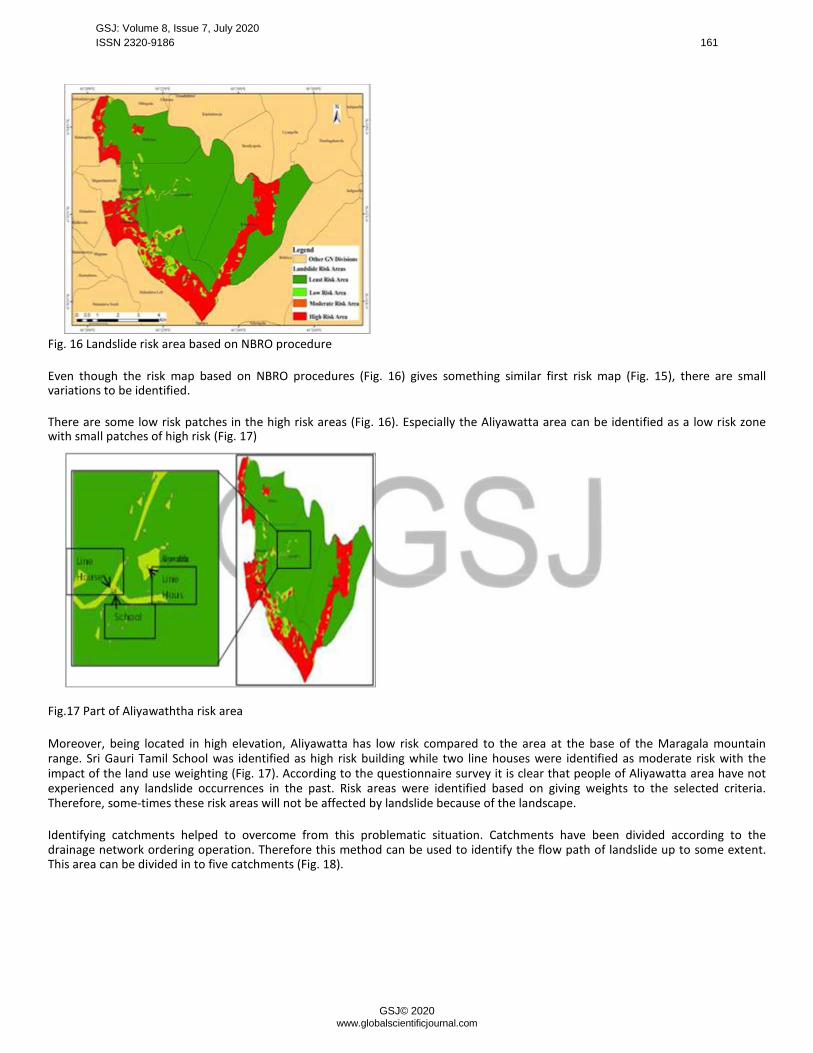
Fig. 16 Landslide risk area based on NBRO procedure Even though the risk map based on NBRO procedures (Fig. 16) gives something similar first risk map (Fig. 15), there are small variations to be identified. There are some low risk patches in the high risk areas (Fig. 16). Especially the Aliyawatta area can be identified as a low risk zone with small patches of high risk (Fig. 17) Fig.17 Part of Aliyawaththa risk area Moreover, being located in high elevation, Aliyawatta has low risk compared to the area at the base of the Maragala mountain range. Sri Gauri Tamil School was identified as high risk building while two line houses were identified as moderate risk with the impact of the land use weighting (Fig. 17). According to the questionnaire survey it is clear that people of Aliyawatta area have not experienced any landslide occurrences in the past. Risk areas were identified based on giving weights to the selected criteria. Therefore, some-times these risk areas will not be affected by landslide because of the landscape. Identifying catchments helped to overcome from this problematic situation. Catchments have been divided according to the drainage network ordering operation. Therefore this method can be used to identify the flow path of landslide up to some extent. This area can be divided in to five catchments (Fig. 18).
GSJ© 2020
www.globalscientificjournal.com

GSJ: Volume 8, Issue 7, July 2020 162 ISSN 2320-9186
Fig. 18 Landslide hazard with catchments Landslide hazard areas are clustered in each basin and the area of potential risk can change the intensity of the risk. 53% of the total area of basin one are prone to landslides under the categories of “most likely to occur” and “landslides to be expected”. It is more than half of the entire basin extend. Landslides can be least expected in the basin number 04 and it is 3% of the total basin extend of the area (Fig. 19). Fig.19 Percentage of land area with landslide hazard area of basin area Landslide risk areas also were calculated based on percentages to identify the intensity of landslide risk (Fig. 20 & Fig. 21).
. Fig. 20 Intensity of high risk area by NBRO methodology based on basins
GSJ© 2020
www.globalscientificjournal.com

GSJ: Volume 8, Issue 7, July 2020 163 ISSN 2320-9186
Fig.21 Intensity of high risk area by weighted overlay based on basins High intensity areas of these two maps are same but the area covered by risk is different due to the indifference of the parameters in the methodology. Anyhow high intensity risk area is clear and it belongs to the basin number one (Fig 20 & Fig 21). High intensity of risk area in figure 20 limits towards the border of the basin and high intensity risk area of figure 21 covers more than the area covered by the figure 20. Risk intensity is decreasing in basin 03, 02, 05 and 04 respectively. Flow path is important when considering the landslide risk because many more people in the floor path are exposure to the hazard. Possible flow path can be identified through overlaying contour and the hazard map (Fig. 22). Flow direction can be determined ac-cording to the contours. Fig.22 Possible flow cluttered area Flow directions can be identified in all basins. Although flow directions in basin number one would cluster in to the same place. Therefore it can be identified as high clustered area. High intensity landslide risk area also was identified in the same basin (Fig 20 & Fig. 21). According to these analyses, possible highest impact area belongs to Viharamulla Grama Niladhari Division (Fig. 23).
Fig.23 Possible flow clustered area
GSJ© 2020
www.globalscientificjournal.com

GSJ: Volume 8, Issue 7, July 2020 164 ISSN 2320-9186
Moreover, highlighted areas by the circles are the high risk areas (Fig. 23) and vast risk area has been narrowed with flow directions. Potentials of landslide risk mitigations Based on qualitative data, it was clear the lack of awareness about landslide hazard among the community as well as the authorities. All strongly believe that there is no possibility to active landslides since Moneragala is in dry zone in Sri Lanka. Although have to be careful because rainfall is not only fact to determine a landslide. There are several cases of rock fall which happened during the past decade, yet people are reluctant to inform the authorities. Fig. 24 Rock fall incident Rock fall incident was experienced in 2019 also (Fig.24). This was captured by the field observation. Pipe lines from the springs on the mountain to the houses have been damaged by the fallen rocks. When the pipe lines are damaged, water project presidents and the villagers fix it. The risk can be increasing if people don’t let the authorities know. SWOT analysis has done to identify the landslide mitigation potentials (Table 6). The main reason was the lack of awareness and they never consider it as a potential risk. Although, there were displaced materials and leaned trees in most of the steep slopes, yet com-munities do not aware of the risk. If the authorities can make people aware of there is a high possibility of mitigating a future devastating landslide event. Lack of vision, frameworks, plans and non-interconnected policy practices keep the risk strong. It is always recommended to empower region-al level authorities should make decisions on the possible risks, mainly in the identification of risk. There are government officers and organizations to work on preventing landslide risk. Ground level programs can be organized through Grama Niladhari Officers because there is one Grama Niladhari officer per one Grama Niladhari area. There are six presidents block wise for the water project. They concern what is happening on the mountain because they are aware about situation. Actions of above mentioned parties would help to empower regional level authorities. Non-availability of huge landslide activations has given a golden opportunity to get ready to face when the event happened. Anthropogenic activities have been reduced by the environmental reservation. Grama Niladhari offices and religious places can be used to held awareness programmes by the responsible parties. People are not keen to inform to the authorities about the landslides or rock falling incidents. Major reason for it is the unawareness. People do not know that they are in landslide risk. Defects with the authorities sometimes make people backward to inform about the incidents. People reveal that authorities do not pay attention or authorities do not make aware people about landslides. Conducting a data base would be helped for further researches about the landslides. Vulnerability assessment should be conducted to find the people vulnerability and want to give practice how to face with the vulnerability conditions. Landslide risk can be mitigated through the strengths and the opportunities are increased while the weakness and threats are reduced.
GSJ© 2020 www.globalscientificjournal.com

GSJ: Volume 8, Issue 7, July 2020 165 ISSN 2320-9186
TABLE 6 SWOT analysis
Strengths Weaknesses
• Disaster Management Centre • Lack of vision, frameworks and plans • National Building Research Organization • Non-interconnected policy practices • Central Environmental Authority • Lack of measuring and observations • Grama Niladhari Officers • Ignorance of the authorities • Water project Presidents • Lack of transportation facilities
• Low income of the community Opportunities Threats
• Government support • Lack of awareness • Maragala mountain being preserved as a • Activation of minor landslides
reserved area • Population growth • Support from Grama Niladhari Officers and
religious leaders • Community engagement
Conclusion and recommendation
Although base of the Maragala Mountain has been identified as the landslide risk area, it was narrowed down after considering the flow path. Then a part of Aliyawaththa could be identified as a high risk area. It’s better to make people aware about the land-slide risk since they don’t have any landslide experience.
According to the study, the risk area consists with the settlement area. Therefore awareness programmes must be conducted as the first step. It should be focused on make people aware of what is a landslide, how they occur, what people should do and should not do regarding landslides. Then lot of lives can be saved if there is a landslide occurrence in future.
Potential risk is high in the Aliyawatta GND due to the line houses. Therefore, relocating those people would be the safest option to be considered. But it takes time and lot of effort. Then there should some measures to be taken to have at least temporary prevention methods like construct some supports to the risk foundations of the area.
It is better not to encourage any land use activities, especially in crop production and Chena cultivation. The soil consistency and the bonds between soils must be supported and preserved properly. Then sudden landslides can be avoided. But it is needed to introduce other economic activities people who are engaging in.
The existing rubber cultivation needs more monitoring and evaluation. Rubber cultivation does not do any severe damage to the top soil. Since this is a hazardous area, it is better to take precautions. Methods of soil conservation in rubber lands should be adopted to make sure to be safe from the future landslides.
Most of the people who live in the upper parts on the mountain have their own home gardens cultivating such as areca nut, banana, coconut and some other fruits. They should be done with proper soil preservation methods. Since the area is so vulnerable to landslides and it is essential to be prepared.
There should be proper landslide warning to be established in the Maragala Mountain area. Rainfall can be considered as the threshold limit for landslides. To determine the limits a proper study can be conducted and based on that limits warnings can be given to the public for the evacuation. Identification of proper flow direction is recommended as the further studies to identify the exact critical locations in case of landslide occurrence. Since the NBRO has not prepare such flow direction map it would be the best option when it comes to decision making on which areas to be evacuated first if there is a landslide.
GSJ© 2020 www.globalscientificjournal.com

GSJ: Volume 8, Issue 7, July 2020 166 ISSN 2320-9186
REFERENCES [1] S. Arunashantha, 2016, Landslide effect of the South part of the up country area; special reference on Haldumbulla and Imbulpe
Divisional Secretariat Divisions: view 14 October 2017, online at
https://www.researchgate.net/publication/323868730_Landslide_effect_of_the_South_part_of_the_up_country_area_special
_reference_on_Haldumbulla_and_Im bulpe_Divisional_Secretariat_Divisions [2] Canadian Centre for Occupational Health and Safety,(2017), ‘Hazard and Risk’, viewed 12 December 2017, from
https://www.ccohs.ca/oshanswers/hsprograms/hazard_risk.html [3] Central Environmental Authority,1993, ‘An Environmental Profile of the Moneragala District’, Central Environmental Authority, Minisry of Environment and Parliamentry Affairs, online at http://cea.nsf.ac.lk/bitstream/handle/1/4495/04617.pdf?sequence=1&isAllowed=y [4] Disaster Management Centre, (2009), ‘Sri Lanka National Report on Disaster Risk, Poverty and Human Development
Relationship’, view 28 December 2017, online at https://www.preventionweb.net/english/hyogo/gar/background-
papers/documents/Chap3/Asia-overview/Sri-Lanka-DRAFT-march-09.pdf
[5] Jayathilaka, D. Upeshika, M.G.J. and Madhushani, G.M.S. (2016). Human settlement mapping as a tool for preparing Landslide Risk Maps. Colombo: NBRO International Symposium, pp. 73-78. [6] Jayathilaka, D. Munasinghe D. (2015). Quantitative Landslide Risk Assessment and mapping. Colombo: NBRO International Symposium, pp. 61-67. [7] Lee, M.J., Park, I., Won, J.S., Lee, S. 2016, ‘Landslide Hazard Mapping Considering Landslide Probability in Inje, Korea’, Geomatics, Natural Hazard and Risk 7(1), 424-446, viewed 11 November 2017, online at http://dx.doi.org/10.1080/19475705.2014.931307. [8] Novotny, j.,(2013), ‘Landslide Glossary’, viewed 01 January 2018, online at http://www.ukgeohazards.info/pages/eng_geol/landslide_geohazard/eng_geol_landslides_classification.htm. [9] Petley, D.,(2010), ‘Maps of Global Landslides’, The Landslide Blog, view 06 January 2018, from https://blogs.agu.org/landslideblog/2010/02/12/maps-of-global-fatal-landslides/ [10] Saaty, L.T. (2008). Decision making with the analytic hierarchy process. [online] International Journal of Service Science. Available at: https://www.colorado.edu/geography/leyk/geog_5113/readings/saaty_2008.pdf [Accessed 19 Oct. 2018] [11] Sugathapala, K. Vijekumara, P.A. (2013) Landslide Hazard Zonation Maps and Its Effective Usage in the Landslide Risk Assessment Process (LRAP). Colombo: 5th Annual NBRO Symposium, pp.15-18. [12] Weerasinghe, K.M., 1997, ‘Landslide Hazard Zonation Mapping Using GIS’, Second Indian Annual ESRI/ERDAS 1997 User Conference, New Delhi, India, October 24, 1997, pp.13-21.
GSJ© 2020 www.globalscientificjournal.com