IDENTIFICATION OF RESIDUAL OIL ZONES (ROZS) … Library/Events/2016/fy16 cs rd/Wed... · • Basin...
29
IDENTIFICATION OF RESIDUAL OIL ZONES (ROZS) IN THE WILLISTON AND POWDER RIVER BASINS DE-FE0024453 © 2016 University of North Dakota Energy & Environmental Research Center. Mastering the Subsurface Through Technology Innovation & Collaboration: Carbon Storage & Oil & Natural Gas Technologies Review Meeting August 17, 2016 Matt Burton-Kelly Geologist
Transcript of IDENTIFICATION OF RESIDUAL OIL ZONES (ROZS) … Library/Events/2016/fy16 cs rd/Wed... · • Basin...

IDENTIFICATION OF RESIDUAL OIL ZONES (ROZS) IN THE WILLISTON AND POWDER RIVER BASINS
DE-FE0024453
© 2016 University of North Dakota Energy & Environmental Research Center.
Mastering the Subsurface Through Technology Innovation & Collaboration: Carbon Storage & Oil & Natural Gas
Technologies Review MeetingAugust 17, 2016
Matt Burton-KellyGeologist

2
PRESENTATION OUTLINE
• Benefit to the program• Project overview• Technical status• Accomplishments to date• Synergy opportunities• Summary
3
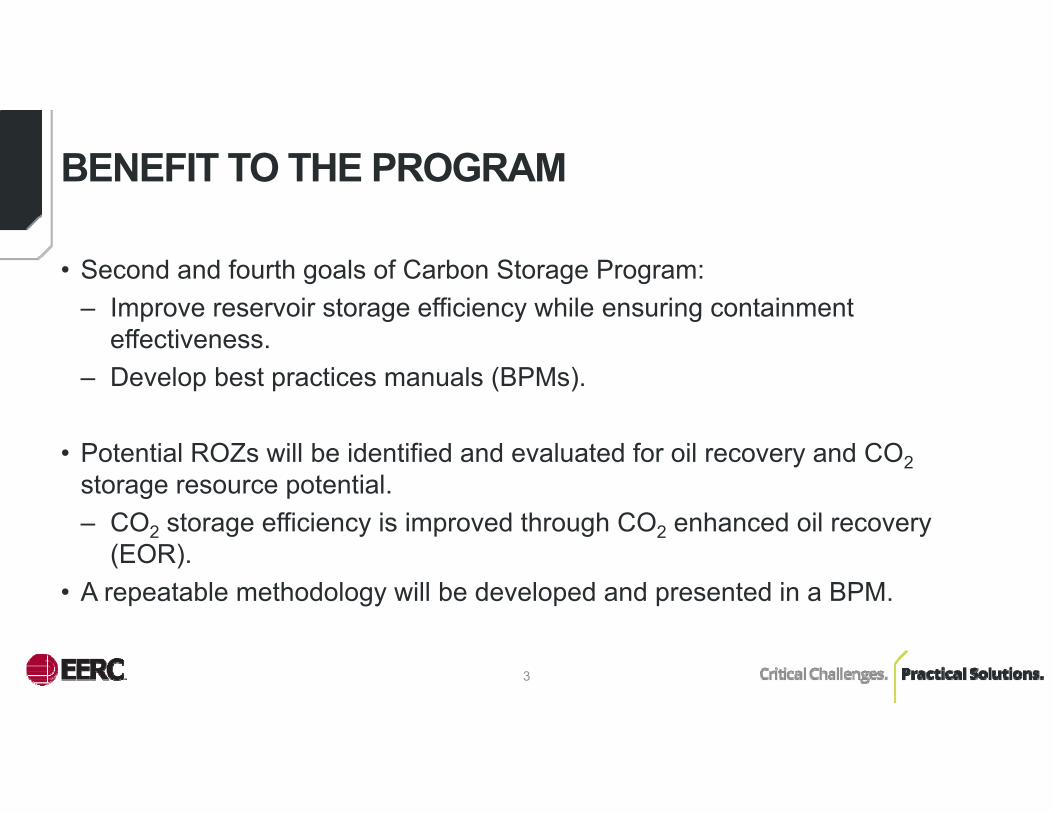
BENEFIT TO THE PROGRAM
• Second and fourth goals of Carbon Storage Program:– Improve reservoir storage efficiency while ensuring containment
effectiveness.– Develop best practices manuals (BPMs).
• Potential ROZs will be identified and evaluated for oil recovery and CO2storage resource potential.– CO2 storage efficiency is improved through CO2 enhanced oil recovery
(EOR).• A repeatable methodology will be developed and presented in a BPM.

4
PROJECT OVERVIEWGOALS AND OBJECTIVESObjectives:• Identify and characterize the presence and
extent of potential ROZs in the Williston Basin (WB) and Powder River Basin (PRB).
• Estimate residual oil in place and CO2 storage potential (Goal 2).
• Determine potential for CO2 EOR in identified ROZs (Goal 2).
• Develop repeatable methodology for sedimentary basins to be included in a BPM (Goal 4).

5
TECHNICAL STATUS: BASIN MODELINGProvides a complete record of the evolution of a petroleum system, including: • Deposition and erosion.• Pressure and compaction.• Heat flow analysis.• Petroleum generation.• Fluid pressure, volume,
temperature analysis.• Reservoir volumetrics.• Structural evolution.• Generation, migration, and
accumulation of hydrocarbons.

6
APPROACH• Understand ROZs and previous work in basin
modeling, both local and abroad.• Translate geologic history of basins into an input for
modeling.• Gather data required for model construction.

7
1-D AND 2-D MODELING
1-D Models 2-D Models
• Point location examination of:– Burial history.– Temperatures.– Boundary conditions.– Generation.
• Investigate generation and lateral migration.
• Faster simulation times than 3-D.

8
3-D MODELS ‒ STATIC• Provides more detail than a simplified 2-
D model.• Structural models have been developed. • Generation and migration calibration
ongoing.
Williston Basin Structure Model50x Vertical Exaggeration
Strobel et al. (1999) Black Hills cross-sections in context

9
3-D MODELS ‒ SIMULATION
By simulating the entire history of the stratigraphic package, models produce outputs that largely agree with known accumulations of hydrocarbons.• Produces most accurate pressure
history.• Has a long run time.
Nesson Anticline
Billings Nose
Cedar Creek Anticline
Mission Canyon, WB+PRB_1000_1

10
2-D MODELS ‒ SIMULATION• Extracted 2-
D models depict expulsion and migration throughout the Williston and Powder River Basins.
WB+PRB_1000_1

1. Compare model outputs (overlays) to known values (calibration database).
2. Adjust model inputs so model produces more accurate output.
11
• PetroMod software does not include calibration tools—all comparison and input adjustments are manual.
• The use of scripting in R for the comparison step of calibration results in more rapid iteration.
• Comparing all known values can identify:– Systematic errors.– Trends with a systematic solution.
• Comparing all known values eliminates issues with piecemeal changes to model inputs.– Local changes may have many effects.– Multiple simulations increase confusion.
CALIBRATION ‒ MOTIVATION

• Three calibration comparison scripts were built using R:– “2-D Calibration”– “2-D Compare Calibration”– “2-D Compare Overlay”
• Comparisons performed in the same way.– Simulate models with same structure– Overlay data as (x,y,z,value)– Calibration data as (x,y,z,value)– Compare closest overlay point with each
calibration point (within bandwidth)
12
CALIBRATION ‒ METHODS
WB+PRB_1000_1_X3-calibrate-pressure.Rmd

13
CALIBRATION – EXAMPLE RESULTS
dept
h (ft
)
WB+PRB_1000_1_X1 Pressure0

14
CALIBRATION – EXAMPLE RESULTS
15
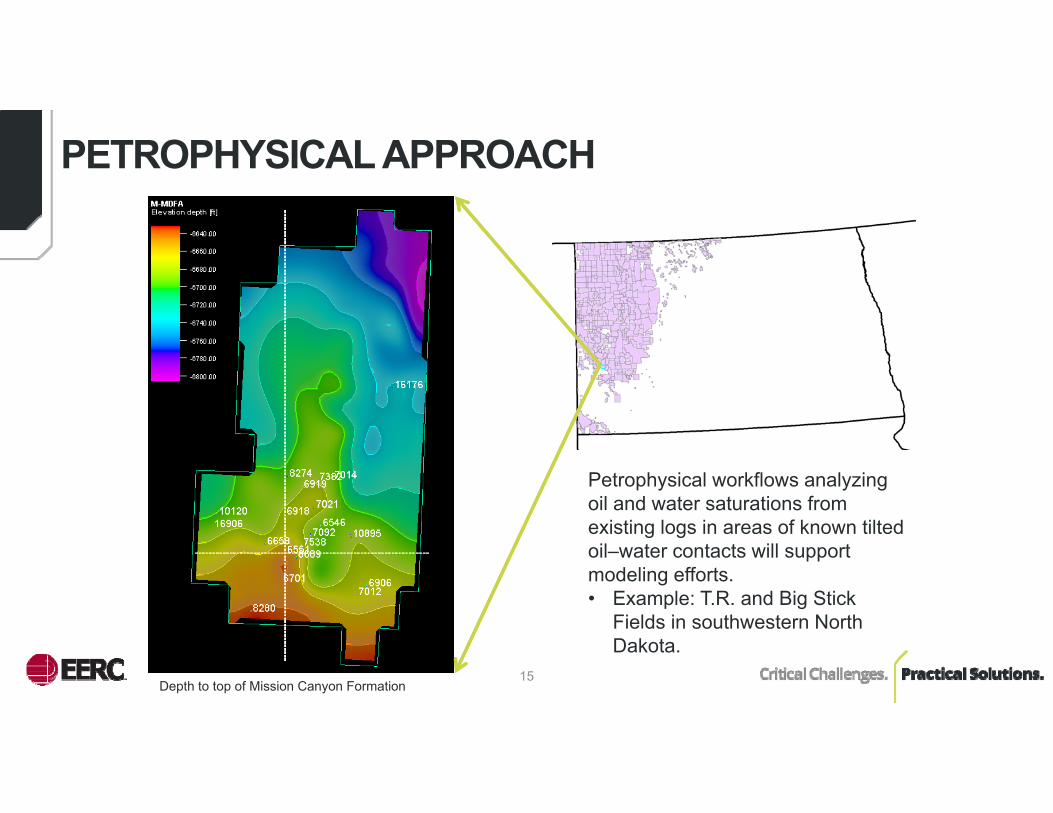
PETROPHYSICAL APPROACH
Petrophysical workflows analyzing oil and water saturations from existing logs in areas of known tilted oil‒water contacts will support modeling efforts.• Example: T.R. and Big Stick
Fields in southwestern North Dakota.
Depth to top of Mission Canyon Formation

16
PETROPHYSICAL APPROACH
W
N 655169188274
65516658
Zone 1Main Pay Zone
Zone 2Potential ROZ
Field-scale models and petrophysical analyses will be used to validate and calibrate basin-scale models.

17
VALIDITY TESTING: CORE ANALYSIS
• Data from core will be used to support the modeling effort (e.g., calibration, validation testing).
• Multiple wells will be chosen based on literature review, modeling results, and core availability.

18
VALIDITY TESTING: PULSED-NEUTRON LOGS (PNLs)PNLs will be collected near suspected ROZs to support and validate modeling and petrophysical analysis efforts.
To choose potential locations for PNLs, multiple criteria must be met: • Currently active well• Wells penetrate through to the potential
ROZ• Completion specifications

19
OUTPUT: RISK ANALYSIS• Uncertainty analysis using Monte Carlo simulations will be performed to
better understand the impact of key variables.• Range of data for each variable will come from literature review database.• Probabilities, confidence intervals, error bars, correlations, and calibration
will be considered to find the best model fit.• High-, mid-, and low-probability models will be used in fairway mapping.
www.brighton-webs.co.uk/montecarlo/simulation.aspx
Analyze
• Histograms• Tornado plots• Crossplots• Distributions

20
OUTPUT: ROZ FAIRWAY MAPPING
• Create play fairway maps showing potential brownfield (existing fields) and greenfield (new fields) ROZs.
• Display high, mid-, and low probabilities.
21
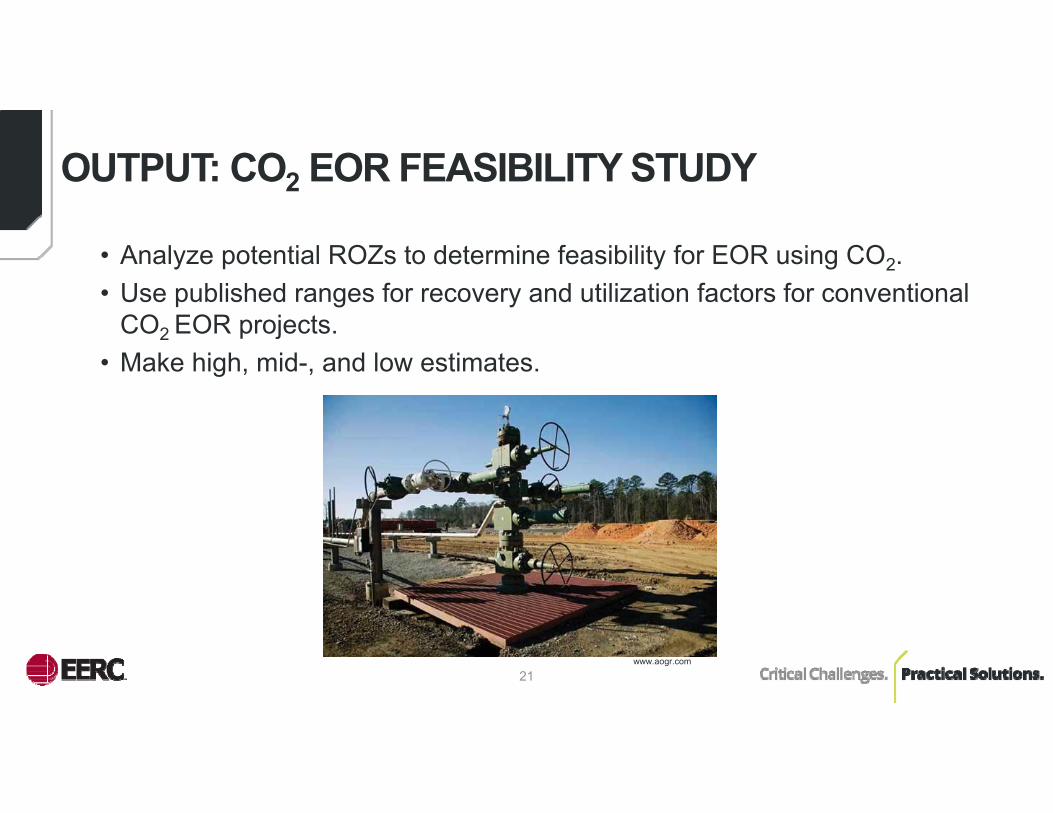
OUTPUT: CO2 EOR FEASIBILITY STUDY
• Analyze potential ROZs to determine feasibility for EOR using CO2. • Use published ranges for recovery and utilization factors for conventional
CO2 EOR projects.• Make high, mid-, and low estimates.
www.aogr.com

22
ACCOMPLISHMENTS TO DATE
• Literature review has been completed.• Several 1-D models have been completed, simulated, and calibrated as part
of the PetroMod learning process.• Several 2-D models have been extracted from the Williston Basin + Powder
River Basin combined 3-D model and simulated.• Calibration of lithologic properties and other input data based on 1-D and 2-D
simulations is well under way.• Reservoir simulation of T.R. and Big Stick Field 3-D model is in progress.• Project overview has been presented in multiple venues.

23
SYNERGY OPPORTUNITIES
Associated Storage (EOR)• Basin evolution modeling could be used to identify future
unconventional or conventional targets.• Collaboration between projects investigating CO2 EOR in
unconventional reservoirs and ROZs will help further the understanding of CO2 storage associated with EOR.

24
SUMMARY
• Key findings– Current PetroMod models predict hydrocarbon accumulations that largely
agree with known pools.• Lessons learned
– Much greater understanding of PetroMod software and relationships among variables.
– Improved structural frameworks for the WB and PRB.– Delicate balance between not enough detail and too much when collecting
data.• Future plans
– Streamline and calibrate.
THANK YOU!

26
ORGANIZATION CHART
27
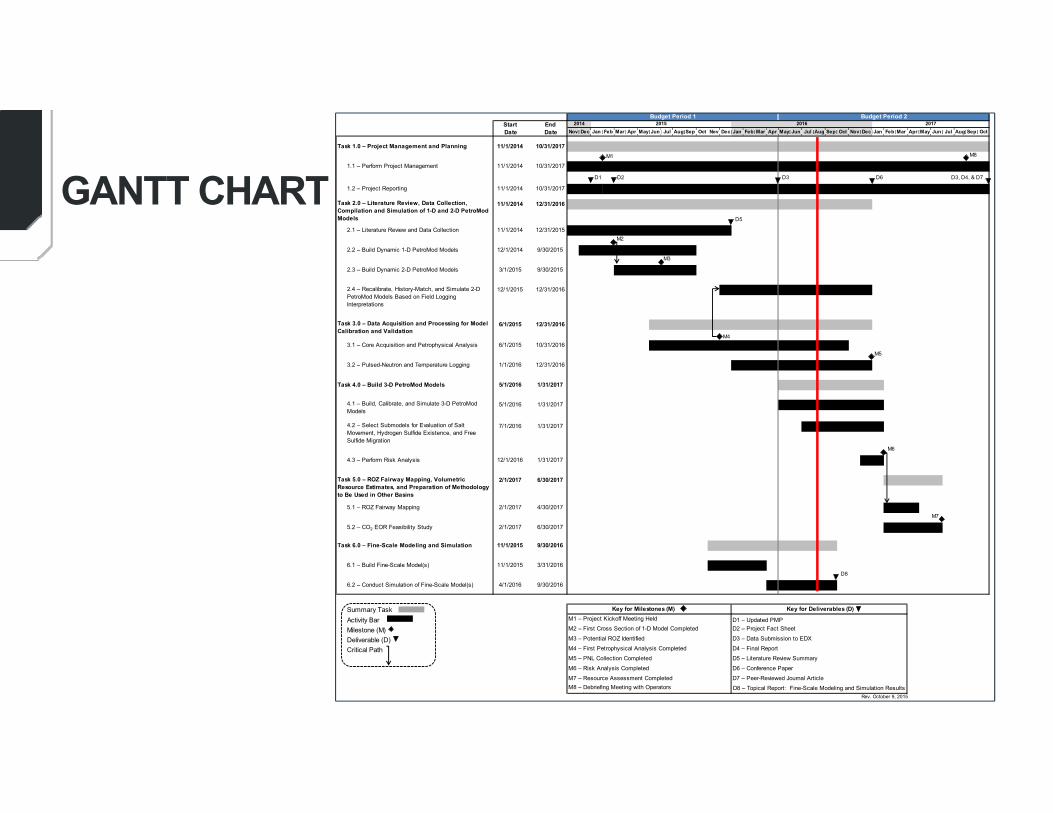
GANTT CHART
Nov Dec Jan Feb Mar Apr May Jun Jul Aug Sep Oct Nov Dec Jan Feb Mar Apr May Jun Jul Aug Sep Oct Nov Dec Jan Feb Mar Apr May Jun Jul Aug Sep Oct
11/1/2014 10/31/2017 M1 M8
1.1 – Perform Project Management 11/1/2014 10/31/2017
D1 D2 D3 D6
1.2 – Project Reporting 11/1/2014 10/31/2017
11/1/2014 12/31/2016
D5
2.1 – Literature Review and Data Collection 11/1/2014 12/31/2015M2
2.2 – Build Dynamic 1-D PetroMod Models 12/1/2014 9/30/2015M3
2.3 – Build Dynamic 2-D PetroMod Models 3/1/2015 9/30/2015
12/1/2015 12/31/2016
6/1/2015 12/31/2016
3.1 – Core Acquisition and Petrophysical Analysis 6/1/2015 10/31/2016 M5
3.2 – Pulsed-Neutron and Temperature Logging 1/1/2016 12/31/2016
5/1/2016 1/31/2017
5/1/2016 1/31/2017
7/1/2016 1/31/2017
M6
4.3 – Perform Risk Analysis 12/1/2016 1/31/2017
2/1/2017 6/30/2017
5.1 – ROZ Fairway Mapping 2/1/2017 4/30/2017M7
5.2 – CO2 EOR Feasibility Study 2/1/2017 6/30/2017
11/1/2015 9/30/2016
6.1 – Build Fine-Scale Model(s) 11/1/2015 3/31/2016 D8
6.2 – Conduct Simulation of Fine-Scale Model(s) 4/1/2016 9/30/2016
Summary Task Activity Bar M1 – Project Kickoff Meeting Held D1 – Updated PMP
Milestone (M) M2 – First Cross Section of 1-D Model Completed D2 – Project Fact Sheet
Deliverable (D) M3 – Potential ROZ Identified D3 – Data Submission to EDX
Critical Path M4 – First Petrophysical Analysis Completed D4 – Final Report
M5 – PNL Collection Completed
M6 – Risk Analysis Completed
M7 – Resource Assessment Completed
Rev. October 9, 2015
M8 – Debriefing Meeting with OperatorsH ld
Key for Milestones (M)
D5 – Literature Review Summary
D6 – Conference Paper
D7 – Peer-Reviewed Journal Article
D8 – Topical Report: Fine-Scale Modeling and Simulation Results
Key for Deliverables (D)
Budget Period 1 Budget Period 2Start Date
End Date
2014 2015 2016 2017
Task 6.0 – Fine-Scale Modeling and Simulation
Task 1.0 – Project Management and Planning
Task 2.0 – Literature Review, Data Collection, Compilation and Simulation of 1-D and 2-D PetroMod Models
2.4 – Recalibrate, History-Match, and Simulate 2-D PetroMod Models Based on Field Logging Interpretations
Task 3.0 – Data Acquisition and Processing for Model Calibration and Validation
Task 4.0 – Build 3-D PetroMod Models
D3, D4, & D7
M4
4.1 – Build, Calibrate, and Simulate 3-D PetroMod Models
4.2 – Select Submodels for Evaluation of Salt Movement, Hydrogen Sulfide Existence, and Free Sulfide Migration
Task 5.0 – ROZ Fairway Mapping, Volumetric Resource Estimates, and Preparation of Methodology to Be Used in Other Basins

28
BIBLIOGRAPHY
• No peer-reviewed literature to date.

29
CONTACT INFORMATION
Energy & Environmental Research CenterUniversity of North Dakota15 North 23rd Street, Stop 9018Grand Forks, ND 58202-9018
www.undeerc.org701.777.5297 (phone)701.777.5181 (fax)
Matt [email protected]


![Investor Update Q2 FY16 / H1 FY16 [Company Update]](https://static.fdocuments.in/doc/165x107/577ca80a1a28abea748caad0/investor-update-q2-fy16-h1-fy16-company-update.jpg)