Identification of Landslide Scars in the Region of the Serra do Mar, São Paulo State, Brazil, Using...
18
This article was downloaded by: [University of Waterloo] On: 21 November 2014, At: 09:12 Publisher: Taylor & Francis Informa Ltd Registered in England and Wales Registered Number: 1072954 Registered office: Mortimer House, 37-41 Mortimer Street, London W1T 3JH, UK GIScience & Remote Sensing Publication details, including instructions for authors and subscription information: http://www.tandfonline.com/loi/tgrs20 Identification of Landslide Scars in the Region of the Serra do Mar, São Paulo State, Brazil, Using Digital Image Processing and Spatial Analysis Tools Paulina Setti Riedel a , Alessandra Rodrigues Gomes a , Mateus Vidotti Ferreira a , Eymar Silva Sampaio Lopes b & José Ricardo Sturaro a a Sao Paulo State University (UNESP) b National Institute for Spatial Research (INPE), Sao José dos Campos, Brazil Published online: 15 May 2013. To cite this article: Paulina Setti Riedel , Alessandra Rodrigues Gomes , Mateus Vidotti Ferreira , Eymar Silva Sampaio Lopes & José Ricardo Sturaro (2010) Identification of Landslide Scars in the Region of the Serra do Mar, São Paulo State, Brazil, Using Digital Image Processing and Spatial Analysis Tools, GIScience & Remote Sensing, 47:4, 498-513 To link to this article: http://dx.doi.org/10.2747/1548-1603.47.4.498 PLEASE SCROLL DOWN FOR ARTICLE Taylor & Francis makes every effort to ensure the accuracy of all the information (the “Content”) contained in the publications on our platform. However, Taylor & Francis, our agents, and our licensors make no representations or warranties whatsoever as to the accuracy, completeness, or suitability for any purpose of the Content. Any opinions and views expressed in this publication are the opinions and views of the authors, and are not the views of or endorsed by Taylor & Francis. The accuracy of the Content should not be relied upon and should be independently verified with primary sources of information. Taylor and Francis shall not be liable for any losses, actions, claims, proceedings, demands, costs, expenses, damages, and other liabilities whatsoever or howsoever caused arising directly or indirectly in connection with, in relation to or arising out of the use of the Content. This article may be used for research, teaching, and private study purposes. Any substantial or systematic reproduction, redistribution, reselling, loan, sub-licensing, systematic supply, or distribution in any form to anyone is expressly forbidden. Terms &
-
Upload
jose-ricardo -
Category
Documents
-
view
213 -
download
0
Transcript of Identification of Landslide Scars in the Region of the Serra do Mar, São Paulo State, Brazil, Using...

This article was downloaded by: [University of Waterloo]On: 21 November 2014, At: 09:12Publisher: Taylor & FrancisInforma Ltd Registered in England and Wales Registered Number: 1072954 Registeredoffice: Mortimer House, 37-41 Mortimer Street, London W1T 3JH, UK
GIScience & Remote SensingPublication details, including instructions for authors andsubscription information:http://www.tandfonline.com/loi/tgrs20
Identification of Landslide Scars inthe Region of the Serra do Mar, SãoPaulo State, Brazil, Using Digital ImageProcessing and Spatial Analysis ToolsPaulina Setti Riedel a , Alessandra Rodrigues Gomes a , MateusVidotti Ferreira a , Eymar Silva Sampaio Lopes b & José RicardoSturaro aa Sao Paulo State University (UNESP)b National Institute for Spatial Research (INPE), Sao José dosCampos, BrazilPublished online: 15 May 2013.
To cite this article: Paulina Setti Riedel , Alessandra Rodrigues Gomes , Mateus Vidotti Ferreira ,Eymar Silva Sampaio Lopes & José Ricardo Sturaro (2010) Identification of Landslide Scars in theRegion of the Serra do Mar, São Paulo State, Brazil, Using Digital Image Processing and SpatialAnalysis Tools, GIScience & Remote Sensing, 47:4, 498-513
To link to this article: http://dx.doi.org/10.2747/1548-1603.47.4.498
PLEASE SCROLL DOWN FOR ARTICLE
Taylor & Francis makes every effort to ensure the accuracy of all the information (the“Content”) contained in the publications on our platform. However, Taylor & Francis,our agents, and our licensors make no representations or warranties whatsoever as tothe accuracy, completeness, or suitability for any purpose of the Content. Any opinionsand views expressed in this publication are the opinions and views of the authors,and are not the views of or endorsed by Taylor & Francis. The accuracy of the Contentshould not be relied upon and should be independently verified with primary sourcesof information. Taylor and Francis shall not be liable for any losses, actions, claims,proceedings, demands, costs, expenses, damages, and other liabilities whatsoever orhowsoever caused arising directly or indirectly in connection with, in relation to or arisingout of the use of the Content.
This article may be used for research, teaching, and private study purposes. Anysubstantial or systematic reproduction, redistribution, reselling, loan, sub-licensing,systematic supply, or distribution in any form to anyone is expressly forbidden. Terms &

Conditions of access and use can be found at http://www.tandfonline.com/page/terms-and-conditions
Dow
nloa
ded
by [
Uni
vers
ity o
f W
ater
loo]
at 0
9:12
21
Nov
embe
r 20
14

498
GIScience & Remote Sensing, 2010, 47, No. 4, p. 498–513. DOI: 10.2747/1548-1603.47.4.498Copyright © 2010 by Bellwether Publishing, Ltd. All rights reserved.
Identification of Landslide Scars in the Region of the Serra do Mar, São Paulo State, Brazil, Using Digital Image Processing and Spatial Analysis Tools
Paulina Setti Riedel1 Department of Applied Geology, São Paulo State University (UNESP), Avenida 24A, 1515 Bela Vista Rio Claro, SP, Brazil 13506-900
Alessandra Rodrigues Gomes and Mateus Vidotti FerreiraPost-Graduation Program in Geoscience and Environmental Studies, São Paulo State University, (UNESP), Avenida 24A, 1515 Bela Vista Rio Claro, SP, Brazil 13506-900
Eymar Silva Sampaio LopesImage Processing Division, National Institute for Spatial Research (INPE), Av dos Astronautas, 1.758, 3d. Granja, São José dos Campos, SP, Brazil 12227-010
José Ricardo SturaroDepartment of Applied Geology, São Paulo State University (UNESP), Avenida 24A, 1515 Bela Vista Rio Claro, SP, Brazil 13506-900
Abstract: The objective of the present study, developed in a mountainous region in Brazil where many landslides occur, is to present a method for detecting land-slide scars that couples image processing techniques with spatial analysis tools. An IKONOS image was initially segmented, and then classified through a Batthacharrya classifier, with an acceptance limit of 99%, resulting in 216 polygons identified with a spectral response similar to landslide scars. After making use of some spatial analysis tools that took into account a susceptibility map, a map of local drainage channels and highways, and the maximum expected size of scars in the study area, some features misinterpreted as scars were excluded. The 43 resulting features were then compared with visually interpreted landslide scars and field observations. The proposed method can be reproduced and enhanced by adding filtering criteria and was able to find new scars on the image, with a final error rate of 2.3%.
INTRODUCTION
Land mass-movements are locally hazardous to people and buildings, and their occurrence depends on regional geomorphologic characteristics, human land occupa-tion patterns, and rain incidence. The region chosen for the present investigation is
1Corresponding author; email: [email protected]
Dow
nloa
ded
by [
Uni
vers
ity o
f W
ater
loo]
at 0
9:12
21
Nov
embe
r 20
14

identification of landscape scars 499
located in the municipality of Cubatão, situated in the Serra do Mar mountain range, where mass-movements are fairly common.
Landslides can be classified according to the type of materials involved, their mechanics, and velocity. Although various types of landslides take place in the Serra do Mar, the ones that affect surface dynamics the most are shallow translational slides. Shallow translational slides are an essential part of the natural development of slopes of the seacoast of São Paulo, and they become more intense under tropical weather conditions of the local mountains, which present altitude variations of about 700 m. Under heavy rain conditions mass-movements take place in a regular and dispersed manner, even without the direct interference of man (Wolle, 1985).
During the summers of 1985 and 1994, hundreds of landslides took place in this region, generating a huge volume of debris. In 1994, landslide volume was estimated at 300,000 m3, which flowed through escape systems as debris flows of massive destructive power that traveled long distances, about 2,700 m. The local oil refinery was shut down for two weeks after particularly strong landslide events in 1994, during which large quantities of soil, trees, and even 6 m boulders were moved (Massad et al., 1998).
Keeping track of landslide processes in this region has become essential, and the local government and some private companies have recently designed a contention plan that aims at monitoring the most landslide-prone areas so as to take the necessary attenuating measures when the need arises.
Different remote sensing resources are used to monitor the most landslide prone areas. During the 1990s, according to Metternicht et al. (2005), the processes and effects of landslides had to be interpreted from airborne imagery in conjunction with stereoscopes and field inspections. Even today, in spite of the availability of high-resolution satellite images, aerial photographs are intensively used in landslide studies because they have already been used for such a long time and have adequate resolu-tion (van Westen, 2004, Sato et al., 2005). The analyzer makes use of a set of criteria to sort landslide scars from other landscape features. Such criteria would include, for example, clearings in the vegetation and the shape, size and position of the feature.
In addition to the common use of aerial photographs, there are also many research-ers who use satellite imagery to identify landslide scars with the aid of digital process-ing techniques. For example, Marcelino et al. (2003) tested the usefulness of IHS conversions coupled with principal components analysis and wavelet transform to detect landslide scars in the southern region of Brazil. La Ville et al. (2002) used IKONOS images to detect landslide scars after an earthquake in Venezuela, while Sato et al. (2005) proposed the use of SPOT-5 to enable stereoscopic analysis. In both cases, combining satellite imagery with existing map information and field work was essential.
However, other researchers also make use of unique techniques to analyze regions prone to landslides. Melchiorre et al. (2008), for example, applied artificial neural network and cluster analysis to identify the most prone areas over a region in northern Italy; in some studies, databases were built to create landslide susceptibility maps (Fernández et al., 2003), while in others, the use of more comprehensive databases enabled the authors to evaluate the dynamics of mass-movements and model the phenomenon (Fabbri et al., 2003).
Dow
nloa
ded
by [
Uni
vers
ity o
f W
ater
loo]
at 0
9:12
21
Nov
embe
r 20
14

500 riedel et al.
Whatever method is employed, it is crucial to organize the local historical and basic thematic data in order to understand, plot, and predict which areas are more prone to landslides, while enabling specialists and professionals working with the ter-ritorial plans to understand such processes (LaVille et al., 2002; Fabbri et al., 2003; Fernández et al., 2003, Galli et al., 2008). Therefore, the different remote sensing tools and digital image processing techniques may offer new analytical strategies whenever they are integrated in a geographical information system.
The present study’s objective is to present a method that combines digital image processing techniques with spatial analysis to detect landslide scars, based on a set of criteria for the identification of landscape features. Most of the published litera-ture on landslide hazard mapping deals with landslide susceptibility mapping (van Westen, 2004), where all possible landslide-contributing terrain factors are combined with a landslide inventory map, using data integration techniques (Bonham-Carter, 1996; Chung and Fabbri, 1999). In this study, we used a landslide susceptibility map, a drainage and road map, as well as the results for the regional past average scar size distribution statistics to detect present landslide scars in IKONOS satellite images.
REGIONAL SETTING
The Serra do Mar is a great complex of mountain ranges and escarpments located on the eastern border of the Brazilian Atlantic Plateau that stretches for about 1000 km from Rio de Janeiro State to Santa Catarina State (Santos, 2004). Its mean elevation is about 1000 m. It is a highly vegetated area, covered by a tropical rainforest.
The highest slopes, ranging from 700 to 900 m in altitude, are more resistant to erosion because they consist of granite, gneiss, and migmatite (Rodrigues, 1992). The lower areas, about 40–135 m, consist of schists and phyllites, which are less resistant to erosion (ibid.). Tertiary and recent sediments (classified as either pediments, collu-via, or alluvia) also can be found all over the plains along the local rivers and the base of slopes (Sadowski, 1974).
According to Setzer (1966) the climate of the Serra do Mar is typically super-humid mesothermal, without dry periods. As climate is strongly influenced by altitude, relatively small areas with specific microclimates are formed. The Serra do Mar works as a barrier against sea winds, while also retaining air pollutants that accumulate in that region (Moreira-Nordemann et al., 1987). This barrier effect is also responsible for the greater rain incidence, turning this area into one of the rainiests of Brazil, due to direct influence of its geographical profile. The local meteorological records of the summer months show long-lasting heavy rains separated by approximately constant periods of time (Vargas Jr. et al., 1986).
Regarding the local vegetation, this area belongs within the Atlantic forest domain, i.e., is a wooded slope area with typical slope tropical rainforest (with trees ranging from 15 to 20 m in height and from 1 to 1.5 m in diameter. The tops of the trees are very dense, broad and heavy, thus greatly shading the lower forest, which becomes dark and humid, with stagnant air (Rodrigues, 1992).
Many researchers have discussed the relationship between slope vegetation and stability, and agree that (mainly for certain forested slopes with relatively thin soil mantles) the vegetation helps stabilize the slopes (Prandini et al., 1976; Wu, 1984, Greenway, 1987). Based on this assumption, three aspects of the vegetation would
Dow
nloa
ded
by [
Uni
vers
ity o
f W
ater
loo]
at 0
9:12
21
Nov
embe
r 20
14

identification of landscape scars 501
be of importance to slope stability: tree tops and other aerial forested parts, vegetable remains, and the root system.
This region also houses an important industrial site in the state (Cubatão), which is reflected in dense human occupation, and therefore considerable human interference. An important oil refinery owned by Petrobras (Petroleum of Brazil) and many sewer and gas pipelines can also be found in this region. Consequently, mass- movements pose a threat to both safety in the refinery and local environment, as they could dis-lodge the aforementioned pipelines.
The study area selected is shown in Figure 1: a 20 km² area in the Serra do Mar chosen for presenting many recent landslide scars. Moreover, it is easily accessible and has abundant, dense typical tropical humid vegetation. Its thin soil layer is basi-cally composed of Arquean migmatites from the coastal complex and medium-sized granites. The landslide scars have already been locally confirmed by field expeditions, so we can directly ground-check our finds.
METHODS
Our research is based on previous studies that have attempted to identify land-slide scars through automated methods using digital tools for image processing and/or spatial analysis. Landslide analysis demands a multidisciplinary approach and an integration of a variety of information to enable mapping, monitoring, modeling, and prediction of where landslides can take place in the future. According to Carrara et al. (1999), it is by locating where landslides took place in the past that we are able to predict where mass-movements will occur in the future.
However, when it comes to processing digital images, McDermid and Franklin (1995) proved that pixel-based supervised classifications do not yield satisfactory results in identifying landscape scars. These authors suggested that this approach ought to consider geomorphologic information and the shape of the scars in order to achieve greater success than normal classification methods.
Thus, the use of different remote sensing tools alone does not enable one to precisely identify and delimit landslide scars when the spectral response pattern of the scars is similar to that of other areas with exposed soil. Clearly, auxiliary maps and techniques will be necessary for the monitoring of landslide events.
Barlow et al. (2003), for instance, obtained satisfactory results when automatically extracting translational landslide scars in British Columbia, Canada, by employing a hierarchical classification system that combined Landsat 7 ETM+ segmented images with the normalized difference vegetation index (NDVI) and geomorphologic data (from a digital elevation model, more specifically), thus excluding from the analysis all areas in the image with vegetation or slopes of less than 15°. The areas wherein landslide events were not perceived were then also eliminated, and the remaining ones were classified through segmentation and supervised classification. The technique proved efficient to detect scars, although with some limitations because of satellite image resolution. Because of these limitations, we employed in this study the methods proposed by Barlow et al. (2003) with some adaptations. Instead of using a digital elevation model, we employed a landslide susceptibility map to eliminate the areas with lesser susceptibility to translational slides, inasmuch as these maps already use as variables the slope angle (obtained from the digital elevation model), the geology
Dow
nloa
ded
by [
Uni
vers
ity o
f W
ater
loo]
at 0
9:12
21
Nov
embe
r 20
14

502 riedel et al.
Fig.
1. L
ocat
ion
of th
e st
udy
area
.
Dow
nloa
ded
by [
Uni
vers
ity o
f W
ater
loo]
at 0
9:12
21
Nov
embe
r 20
14

identification of landscape scars 503
(represented by the lithology), and slope shape. Moreover, while Barlow et al. (2003) used Landsat 7 ETM+ images, we worked with an IKONOS image with a resolution of 4 m. We focused on visual identification of landslide scars from this image to vali-date the results obtained using this method. All steps taken in processing the image are summarized in Figure 2.
Building a Landslide Inventory
The area of the mass-movement described here measures 20 km2 and consti-tutes part of a landslide inventory project encompassing a larger area of 137 km². Conventional landslide inventory mapping was performed using hard-copy stereo photographs from 1985 and 1994 (Lopes, 2006), at scales of 1:25,000 and 1:35,000, respectively, under a mirror stereoscope. Data from field work were used to clarify specific issues whenever necessary. It should be noted that given the difficulty of reaching a number of densely forested areas, some sites had to be inspected from a helicopter.
Landslide scars were visually identified based on the following criteria: clearing in the vegetation and shape, size, and position of the slope feature. Each scar was then marked with a polygon, labeled, and classified according to: area, perimeter, longer axis, shorter axis, coordinates, altimetry, slope, and slope shape. Their mean size
Fig. 2. Flowchart illustrating the processing steps.
Dow
nloa
ded
by [
Uni
vers
ity o
f W
ater
loo]
at 0
9:12
21
Nov
embe
r 20
14

504 riedel et al.
also was calculated. The scars obtained this way were later used to build a landslide susceptibility map.
Building a landslide inventory is the customary procedure in landslide studies. In the present study, it was used to generally depict the study area, its local landslide types, areas of occurrence, frequency, and statistics (Brardinoni et al., 2003; Guthrie and Evans, 2004; Malamud et al., 2004), while also serving as a source of information for the landslide susceptibility map (Chung and Fabbri, 1999, 2003).
Building a Preliminary Landslide Scar Map
An IKONOS color composite image 1B2G3R from May 2005 was used to detect recent landslide scars, based on the aforementioned criteria. This image was segmented and classified with supervised classification through a Batthacharrya classifier.
Image segmentation is a process that divides images into regions relative to their pixel properties, such as tonality and texture (Hussain, 1991). We used a segmentation algorithm by growth for each region to make it possible to assemble the pixels or sub-areas into larger areas. This segmentation of the image is widely used and important to identify and recognize land features.
To use the segmentation algorithm implemented in SPRING (Câmara et al., 1996), it is necessary to set two variables to delimit each region: a similarity boundary and an area boundary. The similarity boundary is the lowest difference between the pixel value and the mean value of its surrounding region in order to include this pixel within that region. If the difference becomes greater than the similarity boundary (previously set by the user), that pixel cannot be incorporated. The area boundary reflects the smallest set size that delimits a single region (Barbosa et al., 2000).
Segmentation Process. In segmenting the IKONOS image, we first evaluated the sizes of the landslide scars identified in the discussion on building a landslide inventory, and determined the area boundary to be used in the segmentation process. The boundary was set to three pixels, the equivalent of 48 m² in the image. This set-ting comprised 3.2%, or 93 observed land scars out of a total of 2,580 mapped scars. If the boundary was set to less than 2 pixels (32 m2), only 27 scars would have been included, or only 0.96% of the total amount mapped.
To determine the similarity boundary, we calculated the mean pixel variation inside five visually obtained scars from the IKONOS image. Based on the obtained mean variation, the similarity boundary was set to 22.
Classification Process. The next step was to classify the scars according to the regions defined by the segmentation process. We achieved the best results using the Batthacharrya classifier, with an acceptance limit of 99%. This classifier works with the resulting segmentation and presents a “training phase,” with which we obtained samples for establishing the classes “trees” (arboreal), “shrubs” (arbustive), “grass” (herbaceous), and “scars.”
We opted not to use a class for “human-made features” because there was great spectral response superposition between such a class and that for the “scars.” After many trials we found that the pixels surrounding scars located in very inclined and inaccessible areas were being classified as “human-made features.” Given the diffi-culty of differentiating between these two classes, we thus opted to use only the class “scars” and later applying spatial analysis to eliminate the artifacts.
Dow
nloa
ded
by [
Uni
vers
ity o
f W
ater
loo]
at 0
9:12
21
Nov
embe
r 20
14

identification of landscape scars 505
Spatial Analysis for Excluding Features
To start with, some features misinterpreted as scars were excluded based on the susceptibility map and on the map of local drainage channels and highways. Other misinterpreted features were further eliminated after incorporation into the analysis of parameters known to occur in landslide scars—wherever these parameters were not perceived the “identified” scar was excluded. The analysis and results were used as a basis to build a preliminary landslide map that was further enhanced by the application of an area filter and finally validated through comparison with the landslide scar map obtained by visual interpretation of the same IKONOS image.
Landslide Susceptibility Map. This map was made based on a multi-criteria analysis, also referred to as a heuristic model, using information about slope inclina-tion, slope shape, and local geology. Inclination was set as the main parameter (70%), followed by slope shape (20%) and geology (10%). The assignment of weights is a resource used to synthesize immense volumes of information about a given phenom-enon and, according to Barredo et al. (2000), demands a multidisciplinary approach.
The criteria employed were based on studies from the Institute of Technological Research of São Paulo State (IPT, 1985). After an exhaustive evaluation of the land-slides in the Serra do Mar, these authors concluded that the main factors driving trans-lational slides in that region are slope inclination, slope shape, and geology, the latter being less important. Rain incidence acting on these traits would be the factor trigger-ing slides.
Taking into account that landslide scars are more frequent in areas with greater susceptibility to landslides, we eliminated the landslide scars identified in areas with low or intermediate susceptibility. The aforementioned landslide inventory was then used to calibrate the susceptibility map.
Creation of Buffers along Railways and Drainage Channel Beds. Railways and drainage channels are deforested areas with spectral responses similar to those of landslide scars; therefore they were classified as such. In order to eliminate this artifact, we placed a 15 m long buffer along the main railway bed in the study area and another 30 m long buffer over the bed of the Mogi River, based on the topographic map of the region (1:50,000). Although landslides are very prone to occur along river terraces due to constant erosion and terrace steepening, based on our field reconnais-sance we concluded that those polygons along the river could be eliminated because we did not observe any landslides on terraces
Analysis of the Maximum Size of Features. We further eliminated some misin-terpreted areas based on their size. To establish the maximum expected size for each landslide scar in the study area, inventory data from 1985 and 1994 (Lopes, 2006) were used. The data, for 2,580 landslide scars, were represented in the form of histo-grams (Fig. 3), with the x-axis representing the area of mapped scars and the y-axis their frequency. The analysis of the histograms revealed that the largest landslides scars of the Serra do Mar measure 5,210 m², which was established as the maximum size limit.
RESULTS
The classified IKONOS image is presented in Figure 4. Most of the area is covered with shrubs and trees and landslide scars are spread all over the region. A recently built
Dow
nloa
ded
by [
Uni
vers
ity o
f W
ater
loo]
at 0
9:12
21
Nov
embe
r 20
14

506 riedel et al.
Fig.
3. H
isto
gram
of t
he a
rea
freq
uenc
y di
strib
utio
n of
land
slid
e sc
ars.
A. 1
985.
B. 1
994.
Dow
nloa
ded
by [
Uni
vers
ity o
f W
ater
loo]
at 0
9:12
21
Nov
embe
r 20
14

identification of landscape scars 507
railway extends through the region, and the main river (Mogi River) delimits the study area’s western side.
Bearing in mind that it is derived from many tests with different boundary values implemented with the Batthacharrya classifier, Figure 5 is expected to accurately illus-trate the features primarily considered to be “landslide scars.” Figure 5A still includes human-made features (buildings, streets, highways) in the class of landslide scars (as expected), for we deliberately did not create a specific class to include those features. In Figure 5B, the features classified as scars are actually areas surrounding the railway or the drainage channel. Finally, Figure 5C shows areas of size greater than the maxi-mum size limit that was set. These were also classified as landslide scars.
Figure 6 illustrates those landslide scars that were eliminated due to being located in areas with low susceptibility to sliding. These generally were associated with human-made features and level land, and were excluded. The placement of buffers over the main railway bed and riverbed of the Mogi River further eliminated polygons falling inside these buffers, as shown in Figure 7. A spatial analysis of the data further enabled us to eliminate scars greater than the maximum value set after the statistical evaluation (Fig. 3). In the study area, only one large feature of 11,354 m² was excluded (Fig. 8).
DISCUSSION
Through the use of the digital and spatial analysis procedures, the present study started with an image divided into regions wherein 216 polygons resulted in landslide scars. This number decreased to 88 after the elimination of areas with intermediate and low susceptibility to landslides. After the application of buffers on the railway and
Fig. 4. A classified IKONOS image. Areas 1, 2, and 3 are shown in greater detail in Figure 5.
Dow
nloa
ded
by [
Uni
vers
ity o
f W
ater
loo]
at 0
9:12
21
Nov
embe
r 20
14

508 riedel et al.
drainage channel beds, the number of land scars further decreased to 44, and finally to 43 after the maximum size limit was set.
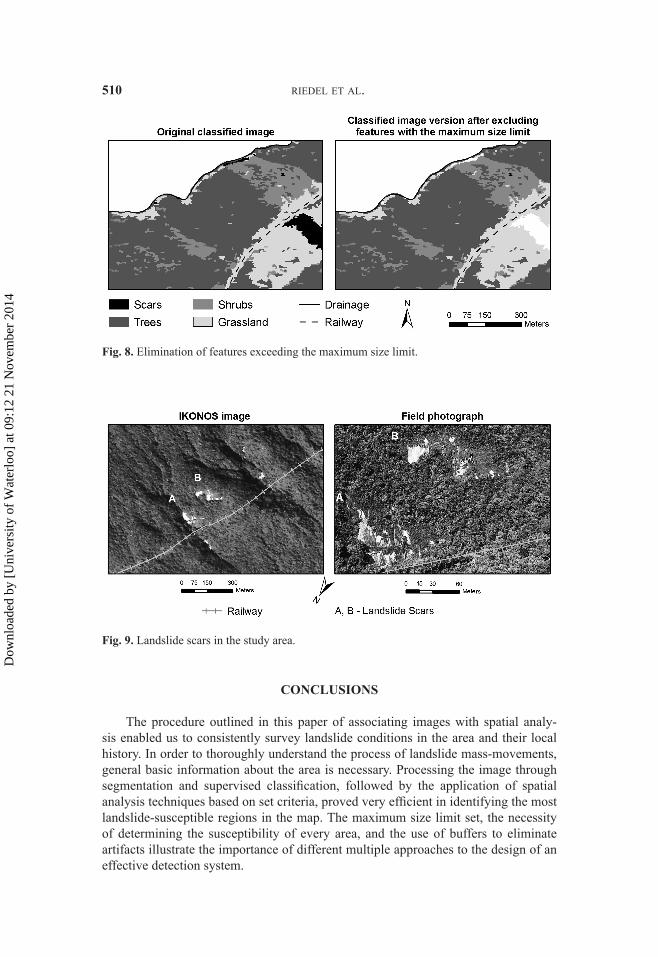
These resulting landslide scars were then compared with the scars visually identi-fied using ArcGIS software (ESRI, 2006). We perceived that apart from the total of 37 visually identified scars from the IKONOS image, our method was able to further identify six other scars on the map. Of these six “new” scars, two of them were arti-facts that could have been easily avoided with the application of a buffer over second-ary drainage channels. Regarding the other four scars—represented by polygons of about 80 m²— three actually proved prone to sliding, and the remaining one had been incorrectly interpreted. This last one was identified based on the region’s characteris-tics shown in Figure 9, where some typical landslide scars can be observed. The one
Fig. 5. IKONOS image in real-color composition and detailed results of the classification. Dow
nloa
ded
by [
Uni
vers
ity o
f W
ater
loo]
at 0
9:12
21
Nov
embe
r 20
14

identification of landscape scars 509
misinterpreted scar accounts for a final error rate of about 2.3%, which is compara-tively low for the present study and in accordance with the parameters set.2
The advantage of our method lies in the fact that by applying a susceptibility map to the landslide as a filter, other factors are included that contribute to its occurrence, such as lithologies and slope shapes, for instance. Furthermore, most of the published literature on landslide hazard mapping deals with landslide susceptibility mapping (van Westen, 2004), which makes this kind of map available in critical areas.
2In addition to all the strategies employed, we also tested the use of a shape filter, but this yielded no satisfactory results.
Fig. 6. Elimination of human-made features based on the susceptibility level.
Fig. 7. Elimination of polygons over the railway and main drainage channel beds through appli-cation of buffers.
Dow
nloa
ded
by [
Uni
vers
ity o
f W
ater
loo]
at 0
9:12
21
Nov
embe
r 20
14
510 riedel et al.
CONCLUSIONS
The procedure outlined in this paper of associating images with spatial analy-sis enabled us to consistently survey landslide conditions in the area and their local history. In order to thoroughly understand the process of landslide mass-movements, general basic information about the area is necessary. Processing the image through segmentation and supervised classification, followed by the application of spatial analysis techniques based on set criteria, proved very efficient in identifying the most landslide-susceptible regions in the map. The maximum size limit set, the necessity of determining the susceptibility of every area, and the use of buffers to eliminate artifacts illustrate the importance of different multiple approaches to the design of an effective detection system.
Fig. 8. Elimination of features exceeding the maximum size limit.
Fig. 9. Landslide scars in the study area.
Dow
nloa
ded
by [
Uni
vers
ity o
f W
ater
loo]
at 0
9:12
21
Nov
embe
r 20
14

identification of landscape scars 511
What distinguishes this method is the capability to identify landslide scars over extensive areas without the need for visual extraction, given the availability of thematic information of the physical environment to inform the analyses. Clearly, the use of a high-resolution image was crucial to achieve greater precision, and enabled us to discern landslide scars that otherwise were overlooked. Finally, the methods herein described include the use of high-resolution images and simple reproducible digital resources that can be employed in any given area, provided that there is sufficient information about it and that the team has an adequate understanding of the factors causing landslides.
ACKNOWLEDGMENTS
The authors would like to thank Petrobras for financial support and also for autho-rizing the publication of these results.
REFERENCES
Barbosa, C., Hess, L., Melack, J., and E. M. L. N. Novo, 2000, “Mapping Amazon Wetlands through Region-Growing Segmentation and Segmented-Based Classi-fication JERS-1 Data,” in Simpósio Latino Americano de Sensoriamento Remoto (Proceedings), Puerto Iguazu, Argentina, 1065–1076.
Barlow, J., Martin, Y., S. E. Franklin, 2003, “Detecting Translational Landslide Scars Using Segmentation of Landsat ETM+ and DEM Data in the Northern Cascade Mountains, British Columbia,” Canadian Journal of Remote Sensing, 29(4): 510–517.
Barredo, J. I., Benavides, A., Hervás, J., and C. J. van Westen, 2000, “Comparing Heu-ristic Landslide Hazard Assessment Techniques Using GIS in the Tirajana Basin, Gran Canaria Island, Spain,” International Journal of Applied Earth Observation and Geoinformation, 2(1): 9–21.
Bonham-Carter, G. F., 1996, Geographic Information Systems for Geoscientists, Mod-eling with GIS, Oxford, UK: Pergamon Press, 398 p.
Brardinoni , F., Slaymaker, O., and M. A. Hassan, 2003, “Landslide Inventory in a Rugged Forested Watershed : A Comparison between Air-Photo and Field Survey Data,” Geomorphology, 54(3–4):179–196.
Câmara, G., Souza, R. C. M., Freitas, N. M., Garrido, J., and F. Mitsuo, 1996, “SPRING: Integrating Remote Sensing and GIS by Object-Oriented Data Model-ing,” Computers & Graphics, 20(3):395–403.
Carrara, A., Guzzetti, F., Cardinali, M., and P. Reichenbach, 1999, “Use of GIS Tech-nology in the Prediction and Monitoring of Landslide Hazard,” Natural Hazards, 20:111–135.
Chung. C. J. and A. G. Fabbri, 1999, “Probabilistic Prediction Models for Land-slide Hazard Mapping,” Photogrammetric Engineering and Remote Sensing, 65(12):1389–1399.
Chung. C. J. and A. G. Fabbri, 2003, “Validation of Spatial Prediction Models for Landslide Hazard Mapping,” Natural Hazards, 30(3):451–472.
ESRI (Environmental Systems Research Institute), 2006, ArcGis Desktop 9.2, Red-lands, CA: ESRI.
Dow
nloa
ded
by [
Uni
vers
ity o
f W
ater
loo]
at 0
9:12
21
Nov
embe
r 20
14

512 riedel et al.
Fabbri, A. G., Chung, C. F., Cendrero, A., and J. Remondo, 2004, “Is Prediction of Future Landslides Possible with a GIS?,” Natural Hazards, 30:487–499.
Fernández, T., Irigaray, C., El Hamdouni, R., and J. Chacón, 2003, “Methodology for Landslide Susceptibility Mapping by Means of a GIS. Application to the Contra-viesa Area (Granada, Spain),” Natural Hazards, 30:297–308.
Galli, M., Ardizzone, F., Cardinali, M., Guzzetti, F., and P. Reichenbach, 2008, “Com-paring Landslide Inventory Maps,” Geomorphology, 94:268–289.
Greenway, D. R., 1987, “Vegetation and Slope Stability,” in Slope Stability: Geo-technical Engineering and Geomorphology, Anderson, M. G. and K. S. Richards (Eds.), New York, NY: John Wiley and Sons, 187–230.
Guthrie, R. H. and S. G. Evans, 2004, ”Analysis of Landslide Frequencies and Charac-teristics in a Natural System, Coastal British Columbia,” Earth Surface Processes and Landforms, 29(11):1321–1339.
Hussain, Z., 1991, Digital Image Processing: Practical Applications of Parallel Pro-cessing Techniques, Chichester, UK: Ellis Horwood, 406 p.
IPT (Instituto de Pesquisas Tecnológicas do Estado de São Paulo), 1985, Elabora-ção de Subsídios Técnicos para um Plano de Emergência para o município de Cubatão, Estado de São Paulo (Grants for Development of an Emergency Plan for Cubatão, State of São Paulo), São Paulo, Brazil: IPT, Relatório 22797.
La Ville, N., Diaz, A. C., and D. Ramirez, D., 2002, “Remote Sensing and GIS Tech-nologies as Tools to Support Sustainable Management of Areas Devastated by Landslides,” Environment, Development and Sustainability, 4:221–220.
Lopes, E. S. S., 2006, Modelagem espacial dinâmica aplicada ao estudo de movimen-tos de massa em uma região da Serra do Mar paulista, na escala de 1:10 000 (Modeling the Spatial Dynamics of Mass Movements in a Region of the Serra do Mar, São Paulo), São Paulo, Brazil: Instituto de Geociências e Ciência Exatas, Universidade Estadual Paulista (UNESP), 276 p.
Marcelino, E. V., Fonseca, L. M. G., Ventura, F., and A. N. C. S. Rosa, 2003, “Evalu-ation of IHS, PCA, and Wavelet Transform Fusion Techniques for the Identifica-tion of Landslide Scars Using Satellite Data,” in Simpósio Brasileiro de Sensoria-mento Remoto (Proceedings), Belo Horizonte, Brazil, 487–494.
Malamud, B. D., Turcotte, D. L., Guzetti, F., and P. Reichenbach, 2004, “Landslide Inventories and Their Statistical Properties,” Earth Surface Processes and Land-forms, 29(6):687–711.
Massad, F., Kanji, M. A., Cruz, P. T., Uehara, K., Ishitani, H., and H. A. Araujo Fil-ho, 1998, “Debris Flows em Cubatão, S. Paulo: Obras de Controle e Impactos Ambientais (Debris Flows in Cubatão, S. Paulo: Control Measures and Environ-mental Impacts),” in XI Congresso Brasileiro de Mecânica dos Solos e Engenha-ria Geotécnica (Proceedings), Brasilia, Brazil, 1265–1272.
McDermid, G. and S. Franklin, 1995, “Remote Sensing and Geomorphic Discrimi-nation of Slope Processes,” Zeitschrift für Geomorphologie, Supplementband, 101:165–185.
Melchiorre, C., Matteucci, M., Azzoni, A., and A. Zanchi, A. 2008, “Artificial Neu-ral Networks and Cluster Analysis in Landslide Susceptibility Zonation,” Geo-morphology, 94:379–400.
Metternicht, G., Hurni, L., and R. Gogu, 2005, “Remote Sensing of Landslides: An Analysis of the Potential Contribution to Geo-spatial Systems for Hazard
Dow
nloa
ded
by [
Uni
vers
ity o
f W
ater
loo]
at 0
9:12
21
Nov
embe
r 20
14

identification of landscape scars 513
Assessment in Mountainous Environments,” Remote Sensing of Environment, 98:284–303.
Moreira-Nordemann, L. M., Danelon, O. M., and J. C. Lopes, 1987, Composition of Precipitation in Cubatao region (S.Paulo- Brazil), Sao Jose dos Campos, Brazil: INPE, 29 p.
Prandini, F. L., Guidicini, G., Bottura, J. A., Ponçano, W. L., and A. R. Santos, 1976, Atuação da Cobertura Vegetal na Estabilidade de Encostas: Uma Resenha Críti-ca (The Role of Vegetation in Slope Stability: A Critique), São Paulo, Brazil: IPT, Publicação Especial, no. 1074, 22 p.
Rodrigues, R., 1992, Características Geológicas e Geotécnicas Intervenientes na Estabilidade de Massas Coluviais da Serra do Cubatão–SP (Characteristics of Geological and Geotechnical Factors Affecting the Stability of Colluvial Masses of the Serra do Cubatão), São Carlos, Brazil: Escola de Engenharia de São Carlos, Universidade de São Paulo, 116 p.
Sadowski, G. R., 1974, Tectônica da Serra de Cubatão (Tectonics of the Serra do Cubatão), São Paulo, Brazil: Universidade de São Paulo, 159 p.
Santos, A. R., 2004, A grande Barreira da Serra do Mar—da Trilha Dos Tupiniquins à Rodovia dos Imigrantes (The Great Barrier of the Serra do Mar—from Trail of the Tupiniquins to Highway of Immigrants), São Paulo, Brazil: O Nome da Rosa, 122 p.
Sato, H. P., Hasegawa, H., Fujiwara, S., Tobita, M., Koarai, M., Une, H., and J. Iwahashi, 2005, “Interpretation of Landslide Distribution Triggered by the 2005 Nothern Pakistan Earthquake using SPOT-5 Imagery,” Landslides, 4:114–122.
Setzer, J., 1966, Atlas Climático e Ecológico do Estado de São Paulo (Climatic and Ecological Atlas of São Paulo State), São Paulo, Brazil: Comissão Interestadual da Bacia Paraná-Uruguai, 186 p.
van Westen, C. J., 2004, “Geo-information Tools for Landslide Risk Assessment: An Overview of Recent Developments” in Landslides : Evaluation and Stabiliza-tion, Lacerda, W. A., Ehrlich, M., Fontoura, S. A. B., and A. S. F. Sayao (Eds.), London, UK: 35–59.
Vargas Jr., E. A., Costa Filho, L. M., Campos, L. E. P., and A. A .R. B. Oliveira, 1986, “A Study of the Relationship Between the Stability of Slopes in Residual Soils and Rain Intensity,” in International Symposium on Environmental Geotechnol-ogy (Proceedings), Allentown, PA: Envo Publishing, 491–500.
Wolle, C. M., 1995, Slope Stability, Brasilia, Brazil: International Conference on Tropical Lateritic and Saprolitic Soils, Progress Report, 51 p.
Wu, T. H., 1984, “Effect of Vegetation on Slope Stability,” Transportation Research Record, 965:37–46.
Dow
nloa
ded
by [
Uni
vers
ity o
f W
ater
loo]
at 0
9:12
21
Nov
embe
r 20
14