
IDENTIFICATION AND COMPARATIVE ANALYSIS OF...
14
TRANSPORT PROBLEMS 2013 PROBLEMY TRANSPORTU Volume 8 Issue 3 road safety; regions; factors; voivodeships Joanna WACHNICKA Gdańsk University of Technology Department of Civil Engineering 11/12 G Narutowicza, 80-233 Gdańsk, Poland Corresponding author. E-mail: [email protected] IDENTIFICATION AND COMPARATIVE ANALYSIS OF FACTORS INFLUENCING ROAD SAFETY IN US REGIONS AND IN POLISH VOIVODESHIPS Summary. Analyses of road safety at national level have been run for many years and large number of publications concerning them appeared so far. How interdisciplinary the issue is, has been shown by literature studies done by the author of the paper. It appears that economists, mathematicians, doctors as well as engineers have studied the issue. It is not an easy one, as results of many analyses lead to conflicting conclusions and often fail to provide straightforward answers to questions asked. The administrative actions taken to improve road safety, uniform for the whole country, frequently fail to give expected results, including Poland’s case. Therefore there is a need to analyse what makes some provinces, and not the others, report improvement in road safety. This paper presents part of the work on author’s doctoral thesis, which analyses how regional characteristics may impact road safety in respective regions. However, during collection of data for the purpose of the doctoral thesis it turned out that many variables mentioned in literature as significant had not been collected on regional level in Europe, including Poland. There are, though, available data on respective American states, so the search for the best describing independent variables started from the analyses of US data. The analyses showed the impact of factors such as annual income per capita, transport activity, density of population, seatbelt rates, road and vehicle density, rate of doctors. IDENTYFIKACJA I ANALIZA PORÓWNAWCZA CZYNNIKÓW WPŁYWAJĄCYCH NA BEZPIECZEŃSTWO RUCHU DROGOWEGO W REGIONACH USA I POLSKICH WOJEWÓDZTWACH Streszczenie. Analizy poziomu bezpieczeństwa ruchu drogowego na poziomie krajowym doczekały się już wielu publikacji, gdyż jest to zagadnienie badane od dłuższego czasu. Jak interdyscyplinarny jest to problem dowodzą studia literatury przeprowadzone przez autorkę artykułu. Okazuje się, że badali ten problem ekonomiści, matematycy, lekarze i inżynierowie. Zagadnienie to nie jest łatwe, gdyż wyniki wielu analiz wykazują sprzeczne wnioski i często nie dają jednoznacznej odpowiedzi na zadawane pytania. Podjęte działania administracyjne na rzecz poprawy bezpieczeństwa ruchu drogowego, jednolite dla całego kraju, w wielu przypadkach, np. Polski nie dają oczekiwanych rezultatów. Dlatego konieczna wydaje się analiza, co może powodować,
Transcript of IDENTIFICATION AND COMPARATIVE ANALYSIS OF...

TRANSPORT PROBLEMS 2013 PROBLEMY TRANSPORTU Volume 8 Issue 3
road safety; regions; factors; voivodeships
Joanna WACHNICKA
Gdańsk University of Technology Department of Civil Engineering 11/12 G Narutowicza, 80-233 Gdańsk, Poland Corresponding author. E-mail: [email protected]
IDENTIFICATION AND COMPARATIVE ANALYSIS OF FACTORS INFLUENCING ROAD SAFETY IN US REGIONS AND IN POLISH VOIVODESHIPS
Summary. Analyses of road safety at national level have been run for many years and
large number of publications concerning them appeared so far. How interdisciplinary the issue is, has been shown by literature studies done by the author of the paper. It appears that economists, mathematicians, doctors as well as engineers have studied the issue. It is not an easy one, as results of many analyses lead to conflicting conclusions and often fail to provide straightforward answers to questions asked. The administrative actions taken to improve road safety, uniform for the whole country, frequently fail to give expected results, including Poland’s case. Therefore there is a need to analyse what makes some provinces, and not the others, report improvement in road safety. This paper presents part of the work on author’s doctoral thesis, which analyses how regional characteristics may impact road safety in respective regions. However, during collection of data for the purpose of the doctoral thesis it turned out that many variables mentioned in literature as significant had not been collected on regional level in Europe, including Poland. There are, though, available data on respective American states, so the search for the best describing independent variables started from the analyses of US data. The analyses showed the impact of factors such as annual income per capita, transport activity, density of population, seatbelt rates, road and vehicle density, rate of doctors.
IDENTYFIKACJA I ANALIZA PORÓWNAWCZA CZYNNIKÓW WPŁYWAJĄCYCH NA BEZPIECZEŃSTWO RUCHU DROGOWEGO W REGIONACH USA I POLSKICH WOJEWÓDZTWACH
Streszczenie. Analizy poziomu bezpieczeństwa ruchu drogowego na poziomie
krajowym doczekały się już wielu publikacji, gdyż jest to zagadnienie badane od dłuższego czasu. Jak interdyscyplinarny jest to problem dowodzą studia literatury przeprowadzone przez autorkę artykułu. Okazuje się, że badali ten problem ekonomiści, matematycy, lekarze i inżynierowie. Zagadnienie to nie jest łatwe, gdyż wyniki wielu analiz wykazują sprzeczne wnioski i często nie dają jednoznacznej odpowiedzi na zadawane pytania. Podjęte działania administracyjne na rzecz poprawy bezpieczeństwa ruchu drogowego, jednolite dla całego kraju, w wielu przypadkach, np. Polski nie dają oczekiwanych rezultatów. Dlatego konieczna wydaje się analiza, co może powodować,

54 J. Wachnicka
że pewne województwa odnotowują poprawę bezpieczeństwa ruchu drogowego a inne nie. Autorka w swojej pracy doktorskiej, której część przedstawia w tym artykule, postanowiła przeanalizować jak charakterystyki regionalne mogą wpływać na bezpieczeństwo ruchu drogowego w poszczególnych regionach. Jednak podczas zbierania danych na potrzeby doktoratu okazało się, że wiele zmiennych wymienianych w literaturze jako znaczące, nie jest zbieranych na poziomie regionalnym w Europie, w tym w Polsce. Dostępne są one natomiast dla danych o poszczególnych stanach USA i dlatego poszukiwania najlepiej opisujących zmiennych niezależnych zaczęto od analizy danych amerykańskich. Analizy te wykazały wpływ między innymi takich czynników jak roczny dochód w przeliczeniu na mieszkańca, praca przewozowa, gęstość zaludnienia, procent użytkowników pojazdów zapinających pasy, gęstość dróg, gęstość pojazdów, wskaźnik lekarzy.
1. INTRODUCTION
In majority of European countries car transport is a dominating system of transport, Poland being the best example of this. The percentage of individual car travels in total travels by inhabitants very well reflects the situation. In USA the rate is about 87%, whereas in Europe it amounts to 79%. Unfortunately it also results in the situation that 95% of accidents and 90% of the total death rate in transport account for road transport fatalities.
Seven years ago Council of Ministers adopted National Road Safety Program for the years 2005-2007-2013 GAMBIT 2005 [1]. One year after Poland’s accession into EU, it was an obligation in order to fulfil the EU goal to slash the number of death casualties in road accidents by half in 10 years. Unfortunately, looking from the perspective of current year 2013, reaching the goal seems unlikely. Hence, in the context of another ambitious goals set by the EU till 2020, the policy of the Polish state in the scope of road safety needs to be verified.
Maybe a closer look on regional specifications of Polish voivodeships that could impact road safety in a given region is needed. Perhaps programs adopted on national level do not touch the core of the issue on regional level. It may turn out that the actions on the level of voivodeship focused on weak points of a particular voivodeship will help improve effectiveness of these activities.
2. BACKGROUND
In the papers that focused on national level significant impact of National Product per capita has been indicated [2 - 4]. Second important factor indicated in the literature is kilometres travelled, being a perfect tool to define mobility, and thus the exposure to being a potential victim of road accident. Unfortunately, the data on kilometres travelled on regional level are available only for respective states of the USA.
Researchers who tried to cope somehow with the issue of missing data on transport activity on regional level began to look for generally available data that could be substituted for transport activity. They realized that population density calculated as, for instance, the number of inhabitants per 1 square km may be a good substitute characteristic [5]. Obviously, road safety largely depends on the quality of service [6].
With these variables, the researchers tried to seek other characteristics that could additionally differentiate the regions, such as unemployment rate [7], alcohol consumption [8], or type of spatial development in a given region [9].
However, in the papers studied by the author of this article regional analyses concerned either selected country or selected regions with similar characteristics, whereas the authors decided to analyse regions in a set that comprised Polish voivodeships and all states of the USA. It was done in order to establish, which characteristics impact road safety regardless of the country and which data should be collected to be able to bring about more beneficial impact to road safety.
Identification and comparative analysis of factors influencing road safety… 55 3. METHODOLOGY
As part of work on the doctoral thesis the authors aimed at researching, which factors may impact road safety on regional level with special consideration to Polish provinces. Under the name region author meant regions referred to as NUTS 2 (in Poland voivodeships) in EUROSTAT and states in the USA. While preparing regional database for Poland it turned out that part of the factors indicated in the literature as impacting road safety have not been collected on regional level. Unfortunately, one of the more important determinants indicated in literature that is transport activity, has not been collected on the NUTS 2 level.
Therefore the decision has been made to create database for the American states in order to check, which factors impact road safety in respective states. Then, based on this, creation of descriptive models, characterizing analysed independent variable, has been planned, with an attempt to apply them to European regions envisaged afterwards. Since traffic fatality rate in a given year turned out to have big dispersion, being a result, among other factors, of big differences in sizes of the regions, relative fatality rate has been adopted for further analyses, calculated as follows:
𝐹𝐴𝑇𝐴𝐿𝑅! =!"#"$!!"!!
(1) where: FATALRi – traffic fatality rate in an i-th region [killed/100 thou. inhabitants], FATALj – number of fatalities of an i-th region in j-th year, POPj – number of population of an i-th region in j-th year
In order to establish, which independent variables may have potential impact on the analysed FATALR index potentially most likely functions that could describe studied correlations have been analysed in the case of both databases. The following functions have been checked: linear:
𝑦 = 𝛼𝑥 + 𝛽 (2) logarithmic:
𝑦 = 𝛼ln (𝑥) (3) Kuznets:
𝑦 = 𝛼 + 𝛽 ln 𝑥 + 𝛾(ln 𝑥 )! (4) exponent:
𝑦 = 𝛼𝑒(!") (5) power-exponent:
𝑦 = 𝛼𝑥!𝑒(!") (6)
In further analyses the graphs of FATALR variable versus the analysed variables were also prepared in order to capture potential correlation, which was not detected in initial analyses. The results of performed studies were presented below. 4. REGIONS OF THE USA
As concerns American data, they were collected from all states in the years 1999-2008. In Table 1 independent variables have been listed, for which the impact on the analysed FATALR ratio has been studied.
Initial analyses proved that regardless of their function the best Q factor was displayed by the correlation of FATALR index with kilometres travelled TRAVEL, followed by significant correlation displayed by percentage of paved roads PROADC and national income per capita NIPC. Therefore

56 J. Wachnicka these are the factors that describe mobility of inhabitants of a given region, road network structure and the wealth of its inhabitants. Details of factor analyses have been presented in Table 2, and Fig. 1-4 contain examples of analysed correlations.
Table 1 Independent variables collected for the USA analysis
Independent variables
Group of variables Name Abbreviation Unit
Demography Density of population DPOP people/km2 Percentage of urban population URB %
Motorisation
Total vehicles VEHR veh./pop. Passenger vehicle rate CARR car/pop. Motor vehicle rate MOTOR veh./pop. Total vehicle density VEHD veh./km2 Passenger car density CARD car/km2 Motor vehicle density MOTOD veh./km2 Percentage of passenger cars CARP %
Infrastructure
Total road concentration ROADC km/100 thou. pop Motorway concentration MOTORC km/100 thou. pop. Total road density ROADD km/km2 Motorway density MOTORD km/km2 Percentage of motorways MOTORP % Paved road density PROADD km/km2 Paved road concentration PROADC km/100 thou. pop. Percentage of paved roads PROADP % Percentage of urban roads UROADP %
Mobility Number of kilometres travelled per capita TRAVEL thou. km
Economy National product per capita NPPC thou. ID National income per capita NIPC thou. ID
Society Alcohol consumption ALC litres/person Seatbelt rate BELT % Human development index HDI -
Health care
Rate of doctors DOC doctors/10 thou. pop White infant death rate DEAD deaths./1000 births Life expectancy LIFE years Time to transport road accident casualty to hospital EMERG minutes
Fig. 1 and 2 present graph of FATALR correlation with transport activity TRAVEL and National
product per capita NPPC, respectively. In the case of transport activity, large correlation is observed, as well as uniform FATALR growth trend with a growth of transport activity TRAVEL. In Fig 2 correlation between analysed data and NPPC has been presented, because the data are also collected in Europe and one can compare the course of correlation in both sets. In the case of USA, data form rather uniform falling trend of FATALR together with growing NPPC. Obviously, there are a dozen or so outliers, but it does not spoil the general picture of the studied data.
Since in the studied articles the attention has been drawn many times to the impact of health care or generally the development level of a given region, these characteristics have also been checked, including Human Development Index (HDI). It turned out that this is a variable, which can explain the level of road safety in a given region to a considerable extent (Fig. 3).
Therefore, instead of HDI, the data have been collected on the rate of doctors DOC (Fig.4), life expectancy of inhabitants in a given region LIFE and white infant death rate DEAD. It turned out that the studied factors might correlate with analysed FATALR index. Regrettably, the analysis of seatbelt rates or time to transport road accident casualty to hospital have not shown statistically significant

Identification and comparative analysis of factors influencing road safety… 57 correlation. It is most likely a result of insignificant differences in these variables between respective states. However, additional analyses based on preparation of correlation graphs proved that there is a visible trend, both in the case of seatbelt rates and time to transport road accident casualty to hospital.
Table 2 Quality factors R2 for the adjustment of functions of studied correlations
Independent variable
Model
Linear Logarithmic Kuznets Power Exponential Power-exponential
NIPC 0,41 0,00 0,45 0,48 0,45 0,46 NPPC 0,24 0,00 0,38 0,33 0,30 0,00 VEHR 0,06 0,00 0,08 0,06 0,07 0,10 CARR 0,07 0,00 0,14 0,03 0,06 0,13
MOTOR 0,00 0,00 0,01 0,00 0,01 0,03 VEHD 0,28 0,00 0,35 0,21 0,00 0,00
MOTORD 0,28 0,00 0,35 0,21 0,00 0,00 CARD 0,28 0,00 0,36 0,22 0,30 0,31 CARP 0,29 0,00 0,29 0,22 0,23 0,00 DPOP 0,28 0,00 0,37 0,22 0,00 0,00 URB 0,28 0,00 0,31 0,19 0,24 0,31
ROADD 0,21 0,00 0,19 0,06 0,17 0,20 MOTORD 0,01 0,00 0,00 0,00 0,01 0,00 ROADC 0,16 0,34 0,38 0,31 0,13 0,38
MOTORC 0,19 0,00 0,00 0,00 0,16 0,00 MOTORP 0,07 0,00 0,00 0,06 0,06 0,00 PROADD 0,22 0,00 0,21 0,09 0,20 0,20 PROADP 0,44 0,00 0,45 0,45 0,38 0,46 PROADP 0,16 0,00 0,17 0,09 0,12 0,15 UROADP 0,33 0,00 0,35 0,24 0,32 0,33 TRAVEL 0,61 0,00 0,59 0,57 0,53 0,58
ALC 0,01 0,00 0,01 0,01 0,01 0,01 BELT 0,11 0,00 0,12 0,10 0,11 0,12
EMERG 0,07 0,00 0,09 0,07 0,06 0,00 LIFE 0,37 0,00 0,35 0,35 0,35 0,00
DEAD 0,35 0,00 0,34 0,33 0,31 0,35 DOC 0,44 0,00 0,49 0,47 0,47 0,48 HDI 0,63 0,00 0,65 0,65 0,65 0,65
5. VOIVODESHIPS OF POLAND
As concerns data from Poland, they were collected in voivodeships for the years 1999-2008. The author tried to collect all data available for voivodeships, the same as in the case of American states. Unfortunately, part of them is not available in generally accessible databases. For instance, there are no data on transport activity TRAVEL or net income per capita NIPC. Data concerning the actions of rescue services are unattainable in Poland. The author has tried to reach the data concerning time it takes on average to transport the road accident casualty to a hospital or even on the number of functioning Hospital Rescue Wards in a given voivodeship, however she’s been unsuccessful so far.

58 J. Wachnicka
10 12 14 16 18 20 22 24 26 28 30 32
TRAVEL [thou. km/person]
-5
0
5
10
15
20
25
30
35
40
45FA
TA
LR
[fat
aliti
es/y
ear/
100
thou
.in
hab.
]
Fig. 1. Correlation between road fatality rate and kilometres travelled Rys. 1. Zależność pomiędzy wskaźnikiem zabitych oraz pracą przewozową
20 25 30 35 40 45 50 55 60 65 70 75
NPPC [thou. ID]
-5
0
5
10
15
20
25
30
35
40
45
FA
TA
LR
[fat
aliti
es/y
ear/
100
thou
.in
hab.
]
Fig. 2. Correlation between road fatality rate and national product per capita Rys. 2. Zależność pomiędzy wskaźnikiem zabitych oraz jednostkowym produktem krajowym brutto

Identification and comparative analysis of factors influencing road safety… 59
3,0 3,5 4,0 4,5 5,0 5,5 6,0 6,5
HDI [-]
-5
0
5
10
15
20
25
30
35FA
TALR
[fat
aliti
es/y
ear/1
00 th
ou.
inha
b.]
Fig. 3. Correlation between road fatality rate and HDI index Rys. 3. Zależność pomiędzy wskaźnikiem zabitych oraz wskaźnika HDI
15 20 25 30 35 40 45
DOC [doctors/10 thou. pop]
-5
0
5
10
15
20
25
30
35
40
FATA
LR [f
atal
ities
/yea
r/100
thou
.in
hab.
]
Fig. 4. Correlation between road fatality rate and rate of doctors Rys. 4. Zależność pomiędzy wskaźnikiem zabitych oraz wskaźnikiem lekarzy
60 J. Wachnicka
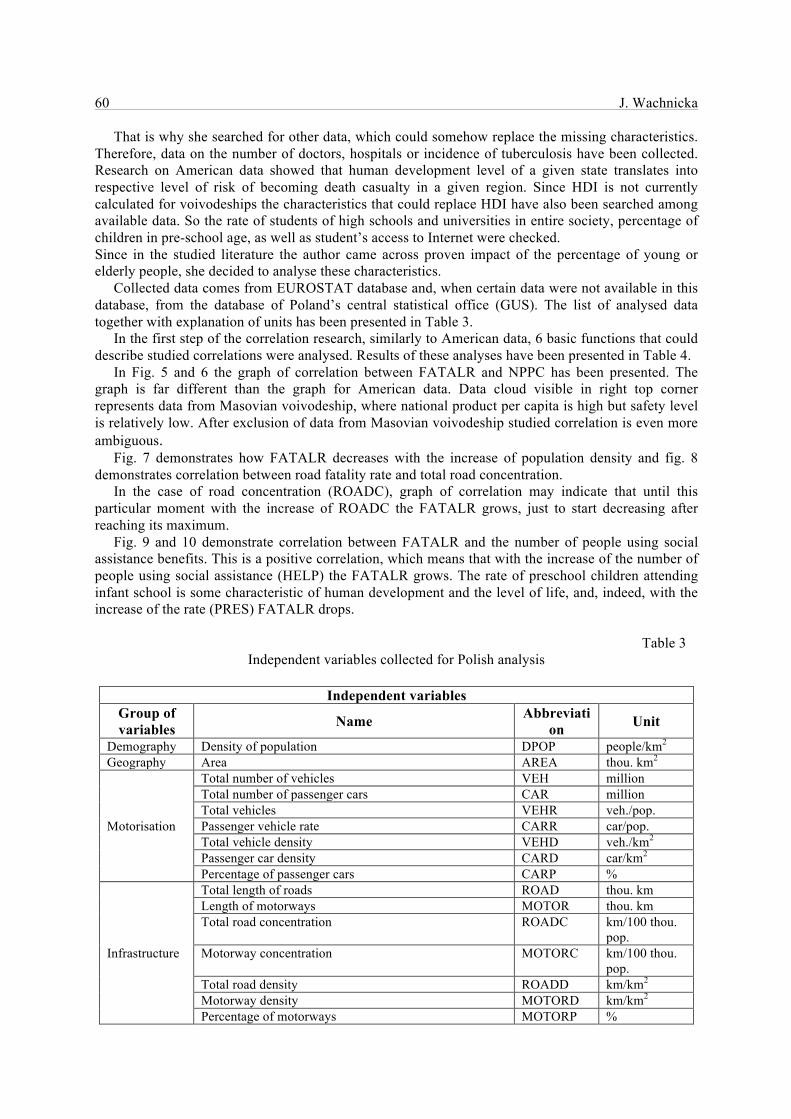
That is why she searched for other data, which could somehow replace the missing characteristics. Therefore, data on the number of doctors, hospitals or incidence of tuberculosis have been collected. Research on American data showed that human development level of a given state translates into respective level of risk of becoming death casualty in a given region. Since HDI is not currently calculated for voivodeships the characteristics that could replace HDI have also been searched among available data. So the rate of students of high schools and universities in entire society, percentage of children in pre-school age, as well as student’s access to Internet were checked. Since in the studied literature the author came across proven impact of the percentage of young or elderly people, she decided to analyse these characteristics.
Collected data comes from EUROSTAT database and, when certain data were not available in this database, from the database of Poland’s central statistical office (GUS). The list of analysed data together with explanation of units has been presented in Table 3.
In the first step of the correlation research, similarly to American data, 6 basic functions that could describe studied correlations were analysed. Results of these analyses have been presented in Table 4.
In Fig. 5 and 6 the graph of correlation between FATALR and NPPC has been presented. The graph is far different than the graph for American data. Data cloud visible in right top corner represents data from Masovian voivodeship, where national product per capita is high but safety level is relatively low. After exclusion of data from Masovian voivodeship studied correlation is even more ambiguous.
Fig. 7 demonstrates how FATALR decreases with the increase of population density and fig. 8 demonstrates correlation between road fatality rate and total road concentration.
In the case of road concentration (ROADC), graph of correlation may indicate that until this particular moment with the increase of ROADC the FATALR grows, just to start decreasing after reaching its maximum.
Fig. 9 and 10 demonstrate correlation between FATALR and the number of people using social assistance benefits. This is a positive correlation, which means that with the increase of the number of people using social assistance (HELP) the FATALR grows. The rate of preschool children attending infant school is some characteristic of human development and the level of life, and, indeed, with the increase of the rate (PRES) FATALR drops.
Table 3 Independent variables collected for Polish analysis
Independent variables
Group of variables Name Abbreviati
on Unit
Demography Density of population DPOP people/km2
Geography Area AREA thou. km2
Motorisation
Total number of vehicles VEH million Total number of passenger cars CAR million Total vehicles VEHR veh./pop. Passenger vehicle rate CARR car/pop. Total vehicle density VEHD veh./km2
Passenger car density CARD car/km2
Percentage of passenger cars CARP %
Infrastructure
Total length of roads ROAD thou. km Length of motorways MOTOR thou. km Total road concentration ROADC km/100 thou.
pop. Motorway concentration MOTORC km/100 thou.
pop. Total road density ROADD km/km2
Motorway density MOTORD km/km2 Percentage of motorways MOTORP %
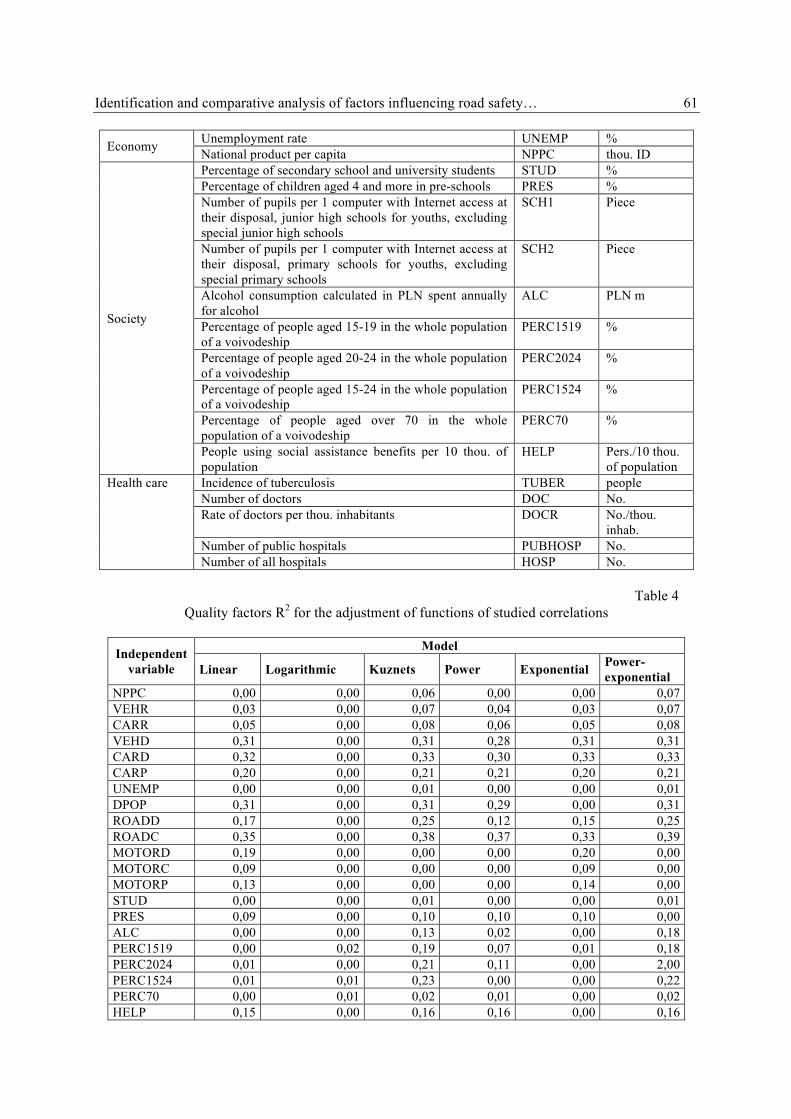
Identification and comparative analysis of factors influencing road safety… 61
Economy Unemployment rate UNEMP % National product per capita NPPC thou. ID
Society
Percentage of secondary school and university students STUD % Percentage of children aged 4 and more in pre-schools PRES % Number of pupils per 1 computer with Internet access at their disposal, junior high schools for youths, excluding special junior high schools
SCH1 Piece
Number of pupils per 1 computer with Internet access at their disposal, primary schools for youths, excluding special primary schools
SCH2 Piece
Alcohol consumption calculated in PLN spent annually for alcohol
ALC PLN m
Percentage of people aged 15-19 in the whole population of a voivodeship
PERC1519 %
Percentage of people aged 20-24 in the whole population of a voivodeship
PERC2024 %
Percentage of people aged 15-24 in the whole population of a voivodeship
PERC1524 %
Percentage of people aged over 70 in the whole population of a voivodeship
PERC70 %
People using social assistance benefits per 10 thou. of population
HELP Pers./10 thou. of population
Health care Incidence of tuberculosis TUBER people Number of doctors DOC No. Rate of doctors per thou. inhabitants DOCR No./thou.
inhab. Number of public hospitals PUBHOSP No. Number of all hospitals HOSP No.
Table 4
Quality factors R2 for the adjustment of functions of studied correlations
Independent variable
Model
Linear Logarithmic Kuznets Power Exponential Power-exponential
NPPC 0,00 0,00 0,06 0,00 0,00 0,07 VEHR 0,03 0,00 0,07 0,04 0,03 0,07 CARR 0,05 0,00 0,08 0,06 0,05 0,08 VEHD 0,31 0,00 0,31 0,28 0,31 0,31 CARD 0,32 0,00 0,33 0,30 0,33 0,33 CARP 0,20 0,00 0,21 0,21 0,20 0,21 UNEMP 0,00 0,00 0,01 0,00 0,00 0,01 DPOP 0,31 0,00 0,31 0,29 0,00 0,31 ROADD 0,17 0,00 0,25 0,12 0,15 0,25 ROADC 0,35 0,00 0,38 0,37 0,33 0,39 MOTORD 0,19 0,00 0,00 0,00 0,20 0,00 MOTORC 0,09 0,00 0,00 0,00 0,09 0,00 MOTORP 0,13 0,00 0,00 0,00 0,14 0,00 STUD 0,00 0,00 0,01 0,00 0,00 0,01 PRES 0,09 0,00 0,10 0,10 0,10 0,00 ALC 0,00 0,00 0,13 0,02 0,00 0,18 PERC1519 0,00 0,02 0,19 0,07 0,01 0,18 PERC2024 0,01 0,00 0,21 0,11 0,00 2,00 PERC1524 0,01 0,01 0,23 0,00 0,00 0,22 PERC70 0,00 0,01 0,02 0,01 0,00 0,02 HELP 0,15 0,00 0,16 0,16 0,00 0,16

62 J. Wachnicka
TUBER 0,00 0,00 0,02 0,01 0,00 0,00 DOC 0,04 0,00 0,11 0,09 0,00 0,00 DOCR 0,00 0,00 0,08 0,00 0,00 0,07 SCH1 0,02 0,02 0,03 0,02 0,02 0,03 SCH2 0,01 0,01 0,01 0,01 0,01 0,01 PUBHOSP 0,04 0,00 0,04 0,04 0,04 0,04 HOSP 0,09 0,00 0,08 0,08 0,09 0,09
6 8 10 12 14 16 18 20 22 24 26 28
NPPC [thou. ID]
8
10
12
14
16
18
20
22
24
FAT
AL
R [f
atal
ities
/yea
r/10
0 th
ou.
inha
b.]
Fig. 5. Correlation between road fatality rate and national product per capita. All voivodeships Rys. 5. Zależność pomiędzy wskaźnikiem zabitych oraz jednostkowym produktem krajowym. Wszystkie województwa
0 10 20 30 40 50
NPPC [thou. ID]
8
10
12
14
16
18
20
22
24
FA
TA
LR
[fa
talit
ies/
year
/100
tho
u.in
hab.
]
Fig. 6. Correlation between road fatality rate and national product per capita. Without Mazowieckie voivodeship Rys. 6. Zależność pomiędzy wskaźnikiem zabitych oraz jednostkowym produktem krajowym. Bez województwa Mazowieckiego

Identification and comparative analysis of factors influencing road safety… 63
0 50 100 150 200 250 300 350 400 450
DPOP [people/km2]
8
10
12
14
16
18
20
22
24FA
TALR
[fat
aliti
es/y
ear/
100
thou
.in
hab.
]
Fig. 7. Correlation between road fatality rate and density of population Rys. 7. Zależność pomiędzy wskaźnikiem zabitych oraz gęstością zaludnienia
0,4 0,6 0,8 1,0 1,2 1,4 1,6 1,8
ROADC [km/100 thou. pop.]
8
10
12
14
16
18
20
22
24
FATA
LR [f
atal
ities
/yea
r/100
thou
.in
hab.
]
Fig. 8. Correlation between road fatality rate and total road concentration Rys. 8. Zależność pomiędzy wskaźnikiem zabitych oraz intensywnością wszystkich dróg

64 J. Wachnicka
300 400 500 600 700 800 900 1000 1100 1200
HELP [THOU.]
8
10
12
14
16
18
20
22
24
FATA
LR [f
atal
ities
/yea
r/100
thou
.in
hab.
]
Fig. 9. Correlation betweem fatality rate and the number of people using social assistance benefits Rys. 9. Zależność pomiędzy wskaźnikiem zabitych oraz liczbą osób korzystających z pomocy opieki społecznej
20 30 40 50 60 70 80
PRES [% ]
8
10
12
14
16
18
20
22
24
FATA
LR [f
atal
ities
/yea
r/10
0 th
ou.
inha
b.]
Fig. 10. Correlation between fatality rate and the percentage of children in preschool age attending infant school Rys. 10. Zależność pomiędzy wskaźnikiem zabitych oraz odsetkiem dzieci w wieku przedszkolnym uczęszczających do przedszkola
Identification and comparative analysis of factors influencing road safety… 65 6. SUMMARY
Factor analyses performed on these two separable data sets showed that some correlations, which were unequivocal in the case of American data, are not so straightforward in the case of Polish data. For instance, national product per capita NPPC demonstrates clear negative correlation with FATALR in the case of American data. However based on Polish data, the tendency is not that clear. It may stem from the relatively low diversity of NPPC across voivodeships. Analyses of correlation between FATALR and population density DPOP as well as road concentration ROADC demonstrated correlation of about 30% in both groups (see table 2 and 4). If the intention were to create prognostic models containing factors, which could be influenced by proper actions, it would be possible only in the case of American data. In USA very detailed data on the behaviour of road users and rescue services are collected. Analyses proved the impact of seatbelt rate and the time it takes to transport accident casualty to a hospital on the level of safety in a given region. Unfortunately, such data are not collected in Poland either by EUROSTAT or GUS, and the author of this paper has been unsuccessful so far in reaching other sources for this type of data on the level of voivodeships. It is very likely that this type of data would explain differences in road safety levels in respective voivodeships.
Analyses of American data demonstrated significant impact of human development level HDI of a respective region. Since these data are not collected on the level of voivodeships, attempts have been made to check the percentage of children in preschool age attending infant school or the number of people using social assistance benefits and initial analyses demonstrated certain correlations. Further stage of works on the doctoral thesis will be an attempt to create descriptive models of FATALR for American and Polish data while using available data.
Acknowledgement
The paper has been funded by grant-in-aid for carrying out scientific research or development work and related tasks, aimed at the progress of young scientists and doctoral students.
Bibliography
1. Krajowy Program Bezpieczeństwa Ruchu Drogowego na lata 2005-2007-2013 "GAMBIT 2005". Warszawa: Ministerstwo Infrastruktury. 2005. [In Polish: The National Road Traffic Safety Program for the Years 2005-2007-2013 "GAMBIT 2005". Warsaw: Ministry of Infrastructure]
2. Kopits, E. & Cropper, M. Traffic fatalities and economic growth. Accid. Anal. Prev. 2005. N. 37. P. 169-178.
3. Evans, L. Traffic Safety. Bloomfield Hills: Science Serving Society. 2005. 4. Van Beeck, E. & Mackenbach, J.P. & Looman, C.W. & Kunst, A.E. Determinants of Traffic
Accident Mortality in the Netherlands: A Geographical Analysis. International Journal of Epidemiology. 1991. N. 20 (3). P. 698-706.
5. Eksler, V. & Lassarre, S. & Thomas, I. Regional analysis of road mortality in Europe. Public Health. 2008. N. 122. P. 826-837.
6. Barabino, B. & Deiana, E. & Mozzoni S. The quality of public transport service: the 13816 standard and a methodological approach to an Italian case. Ingegneria Ferroviaria. 2013. V. 68. No. 5. P. 475-499.
7. Gerdtham, U. & Ruhm, C. Deaths Rise in Good Economic Times: Evidence from the OECD. Economics and Human Biology. 2006. N. 4 (3). P. 298-316.
8. Dee, T.S. Reconsidering the effects of seat belt laws and their enforcement status. Accid. Anal. Prev. 1998. N. 30 (1). P. 1-10.

66 J. Wachnicka 9. Lambert, T. & Meyer, P. Ex-urban Sprawl as a Factor in Traffic Fatalities and EMS Response
Times in the South-eastern United States. Journal of Economic. 2006. N. 40 (4). P. 941-953. Received 17.02.2012; accepted in revised form 26.08.2013


![INVESTIGATION INTO THE BIMODAL TRANSPORTATION …transportproblems.polsl.pl/pl/Archiwum/2017/zeszyt2/2017t12z2_10.… · Paper [8] is concerned with a new automated container terminal](https://static.fdocuments.in/doc/165x107/5eda5fe5b3745412b5713cfa/investigation-into-the-bimodal-transportation-paper-8-is-concerned-with-a-new.jpg)

![Sanok blok [to do].qxp Layout 1 21.11.2016 08:38 Strona 3 · Jakieś łacińskie „zdrowie” ... Od nich często pochodzą nazwy miast. To konkretne miasto dodało do nazwy rzeki,](https://static.fdocuments.in/doc/165x107/5c77f3c409d3f2322f8caa4e/sanok-blok-to-doqxp-layout-1-21112016-0838-strona-3-jakies-lacinskie.jpg)


