id334562315 pdfMachine by Broadgun Software - a great … · Employment Equity Act ... SAIFM SAIGA...
68
Transcript of id334562315 pdfMachine by Broadgun Software - a great … · Employment Equity Act ... SAIFM SAIGA...

id334562315 pdfMachine by Broadgun Software - a great PDF writer! - a great PDF creator! - http://www.pdfmachine.com http://www.broadgun.com

Fasset Sector Skills Plan
2005 to 2010
Update for the 2007/2008 Financial Year
Draft 29 August 2006 Final 21 May 2007
Fasset Sector Skills Plan 2005 � 2010 Update for the 2007/2008 Financial Year
Draft 21 May 2007 i
CONTENTS
1 SECTOR PROFILE ....................................................................................................................................1 1.1 Introduction........................................................................................................................................1 1.2 Industrial coverage ............................................................................................................................1 1.3 Enterprises and employment ............................................................................................................2 1.4 Current employment..........................................................................................................................4 1.5 BEE and co-operatives......................................................................................................................6 1.6 Professional associations..................................................................................................................6 1.7 Trade unions .....................................................................................................................................7 1.8 Cross-sectoral involvement in skills development ............................................................................7 1.9 Drivers of change ..............................................................................................................................8
1.9.1 Policy and legislation ................................................................................................................... 8 1.9.2 Economic factors ....................................................................................................................... 12 1.9.3 Social factors.............................................................................................................................. 14 1.9.4 Technological factors ................................................................................................................. 15 1.9.5 Environmental factors ................................................................................................................ 16
1.10 Conclusions.....................................................................................................................................16 2 THE DEMAND FOR SKILLS ...................................................................................................................17
2.1 Introduction......................................................................................................................................17 2.2 Current employment........................................................................................................................17
2.2.6 Current employment composition .............................................................................................. 17 2.2.7 Skills of the current workforce.................................................................................................... 18
2.3 Employment trends and patterns ....................................................................................................18 2.3.1 Growth in employment ............................................................................................................... 18 2.3.2 Vacancies................................................................................................................................... 18 2.3.3 Earning trends............................................................................................................................ 19
2.4 Forecasting of future demand .........................................................................................................19 2.4.1 Aggregate demand .................................................................................................................... 19
2.5 The demand for specific occupations..............................................................................................21 2.6 Conclusions.....................................................................................................................................21
3 THE SUPPLY OF SKILLS .......................................................................................................................22 3.1 Introduction......................................................................................................................................22 3.2 Current employment........................................................................................................................22 3.3 Availability of financial skills in the economy...................................................................................22 3.4 The formation of new skills for the sector........................................................................................28
3.4.1 Entry routes into the sector ........................................................................................................ 28 3.4.2 Providers of education and training ........................................................................................... 29
3.5 Development of skills of the existing workforce ..............................................................................37 3.6 Conclusions.....................................................................................................................................38
4 SCARCE SKILLS AND CRITICAL SKILLS IDENTIFICATION ..............................................................39 4.1 Introduction......................................................................................................................................39 4.2 Growth in demand ...........................................................................................................................39 4.3 Growth in supply..............................................................................................................................39 4.4 Scarce skills ....................................................................................................................................40 4.5 critical skills in demand....................................................................................................................42 4.6 Conclusions.....................................................................................................................................43
5 SMALL BUSINESS, ENTREPRENEURIAL OPPORTUNITIES AND OTHER NSDS PRIORITIES ......45 5.1 Introduction......................................................................................................................................45 5.2 Small business opportunities ..........................................................................................................45 5.3 Support to small organisations........................................................................................................45 5.4 Adult basic education and training ..................................................................................................46 5.5 National standard of good practice .................................................................................................46 5.6 Stakeholder capacity building .........................................................................................................46 5.7 Conclusions.....................................................................................................................................46

Fasset Sector Skills Plan 2005 � 2010 Update for the 2007/2008 Financial Year
Draft 21 May 2007 ii
LIST OF TABLES Table 1.1 Industrial coverage and subsectoral demarcation............................................................................ 2 Table 1.2 Composition of the sector: organisations, operational units and employment4................................ 3 Table 1.3 Size distribution of organisations in the sector ................................................................................. 4 Table 1.4 Distribution of workers in the sector according to occupational category and population group ...... 4 Table 1.5 Distribution of workers in the sector according to occupational category, population group and
gender ........................................................................................................................................................ 5 Table 1.6 Average age of workers in the Financial and Accounting Services Sector compared to total
economy..................................................................................................................................................... 5 Table 1.7 Professional body membership ........................................................................................................ 7 Table 2.1 Projected employment demand: 2005 to 2009............................................................................... 20 Table 3.1 The economically active workforce with post-Grade 12 qualifications in business, commerce and
management studies ................................................................................................................................ 23 Table 3.2 Qualifications awarded by universities in business, commerce and management sciences
according to field of study: 1999-2004 ..................................................................................................... 31 Table 3.3 Qualifications awarded by technikons in business, commerce and management sciences
according to field of study: 1999-2004 ..................................................................................................... 33 Table 3.4 Roles of professional bodies in education and training.................................................................. 34 Table 3.5 Professional qualifications available to the sector.......................................................................... 35 Table 3.6 Learnerships contracts registered with Fasset and learnerships completed in 2005/2006 ........... 36 Table 3.7 Beneficiaries of training: 2004/2005 according to occupational category ....................................... 38 Table 4.1 Vacancies reported in 2004/2005 by subsector ............................................................................. 41 Table 4.2 Vacancies reported in 2004/2005 by main occupation .................................................................. 41 Table 4.3 Occupations with highest numbers of scarce skills ......................................................................... 42 LIST OF FIGURES Figure 1.1 Provincial distribution of operational units and employees ............................................................. 3 Figure 1.2 Economic growth in South Africa and in the Financial Intermediation, Insurance, Real Estate and
Business Service Sector: 1970 to 2005 ................................................................................................... 13 Figure 1.3 Immigration and emigration of accountants and related professionals: 1990 to 2003 ................. 15 Figure 2.1 Occupational composition of the sector ........................................................................................ 18 Figure 3.1 Highest educational qualifications of workers in the sector .......................................................... 22 Figure 3.2 Number of university graduates who majored in accounting by highest level of education ........ 24 Figure 3.3 Number of university graduates in commerce, business management and business administration
by highest level of education .................................................................................................................... 25 Figure 3.4 University graduates in accounting by population group .............................................................. 25 Figure 3.5 University graduates in commerce, business management and business administration by
population group (excluding accounting) ................................................................................................. 26 Figure 3.6 Number of technikon graduates in accounting by highest level of education ............................... 26 Figure 3.7 Number of technikon graduates in commerce, business management and business administration
by highest level of education .................................................................................................................... 27 Figure 3.8 Technikon graduates in accounting by population group.............................................................. 27 Figure 3.9 Technikon graduates in commerce, business management and business administration by
population group....................................................................................................................................... 28 Figure 3.10 Senior Certificate passes: 2004 .................................................................................................. 29 Figure 3.11 Senior Certificate passes in mathematics: 2004......................................................................... 30 Figure 3.12 Senior Certificate passes in accounting: 2004 ............................................................................. 30 Figure 3.13 Qualifications awarded by universities in business, commerce and management sciences
according to qualification level: 1999-2004 .............................................................................................. 31 Figure 3.14 Qualifications awarded by technikons in business, commerce and management sciences
according to qualification level: 1999-2004 .............................................................................................. 32 Figure 3.15 Actual and projected entry-level qualifications in business, commerce and management
sciences from the public HET sector........................................................................................................ 33 Figure 4.1 New learnerships registered and learnerships completed 2002 to 2006....................................... 40 ANNEXURES ANNEXURE A LABOUR DEMAND PROJECTIONS ..................................................................................... 49 ANNEXURE B METHODOLOGY USED TO WEIGH WSP DATA................................................................. 50 ANNEXURE C FASSET SCARCE SKILLS LIST ........................................................................................... 51

Fasset Sector Skills Plan 2005 � 2010 Update for the 2007/2008 Financial Year
Draft 21 May 2007 iii
ACRONYMS AND ABBREVIATIONS AAT ABASA ABET ACCA ADRA AETA AFP AGA(SA) AIMR AsgiSA ATO ATR BBBEE BEE BER CA CAT CBET CFA(SA) CFA CFA CFP CIA CIBM CICB CIMA CPE CTA DoL DTI EEA ETQA FAIS Fasset FCCA FET FPI FSB GAAP GAP GDS GRAP GIA HEMIS HET HSRC IAB
Associate Accounting Technician Association for the Advancement of Black Accountants Adult Basic Education and Training Association of Chartered Certified Accountants Association of Debt Recovery Agents Association for the Education and Training of Accountants Associate Financial Planner Associate General Accountant Association for Investment Management and Research Accelerated and Shared Growth Initiative for South Africa Approved Training Office Annual Training Report Broad-Based Black Economic Empowerment Black Economic Empowerment Bureau for Economic Research (BER) Chartered Accountant Certified Accounting Technician Competency Based Education and Training Institute of Commercial and Financial Accountants of Southern Africa Certified Financial Accountant Chartered Financial Analyst Certified Financial Planner Certified Internal Auditor Chartered Institute of Business Management Certificate of Membership of the Institute of Certified Bookkeepers Chartered Institute of Management Accountants Continuous Professional Education Certificate in the Theory of Accounting Department of Labour Department of Trade and Industry Employment Equity Act Education and Training Quality Authority The Financial Advisory and Intermediary Services Act, No. 37 of 2002 Sector Education and Training Authority for Finance, Accounting, Management Consulting and other Financial Services Fellow of the Chartered Certified Accountants Further Education and Training Financial Planning Institute Financial Services Board Generally Accepted Accounting Practice Global Accounting Proficiency Growth and Development Summit Generally Recognised Accounting Practice General Internal Auditor Higher Education and Management Information System Higher Education and Training Human Sciences Research Council International Association of Bookkeepers
IAC IBS ICMCI ICSA IDC IFA IFAC IFRS IIA-SA IIP IMCSA IRBA JIPSA LFS IPFA MBA MIAC NLRD NQF NSA NSDS NSF OFO PAAB PDI PE PFMA RAU RBA RCA RFP RGA RTO SAICA SAIFM SAIGA SAIPA SAQA SARB SARS SDA SDF SDL Seta SCG SIC SMME SSP StatsSA TIPP TOPP UCT UNISA WSP
Institute of Administration and Commerce Institute of Business Studies International Council of Management Consulting Institutes Institute of Chartered Secretaries and Administrators Industrial Development Corporation Institute of Financial Accountants International Federation of Accountants International Financial Reporting Standards Institute of Internal Auditors South Africa Investors in People Institute of Management Consultants of South Africa Independent Regulatory Board for Auditors Joint Initiative for Priority Skills Acquisition Labour Force Survey Institute for Public Finance and Auditing Master in Business Administration Member of the Institute of Administration and Commerce National Learners� Records Database National Qualifications Framework National Skills Authority National Skills Development Strategy National Skills Fund Organising Framework for Occupations Public Accountants and Auditors Board Previously Disadvantaged Individuals Professional Evaluation Public Finance Management Act Rand Afrikaans University Regulatory Board for Auditors Representative Council for Accountants Registered Financial Planner Registered Government Auditor Registered Training Office South African Institute of Chartered Accountants South African Institute for Financial Markets Southern African Institute of Government Auditors South African Institute for Professional Accountants South African Qualifications Authority South African Reserve Bank South African Revenue Service Skills Development Act Skills Development Facilitator Skills Development Levy Sector Education and Training Authority Strategic Cash Grant Standard Industrial Classification Small, Medium, Micro Enterprise Sector Skills Plan Statistics South Africa Training Inside Public Practice Training Outside Public Practice University of Cape Town University of South Africa Workplace Skills Plan
Fasset Sector Skills Plan 2005 � 2010 Update for the 2007/2008 Financial Year
Draft 21 May 2007 iv
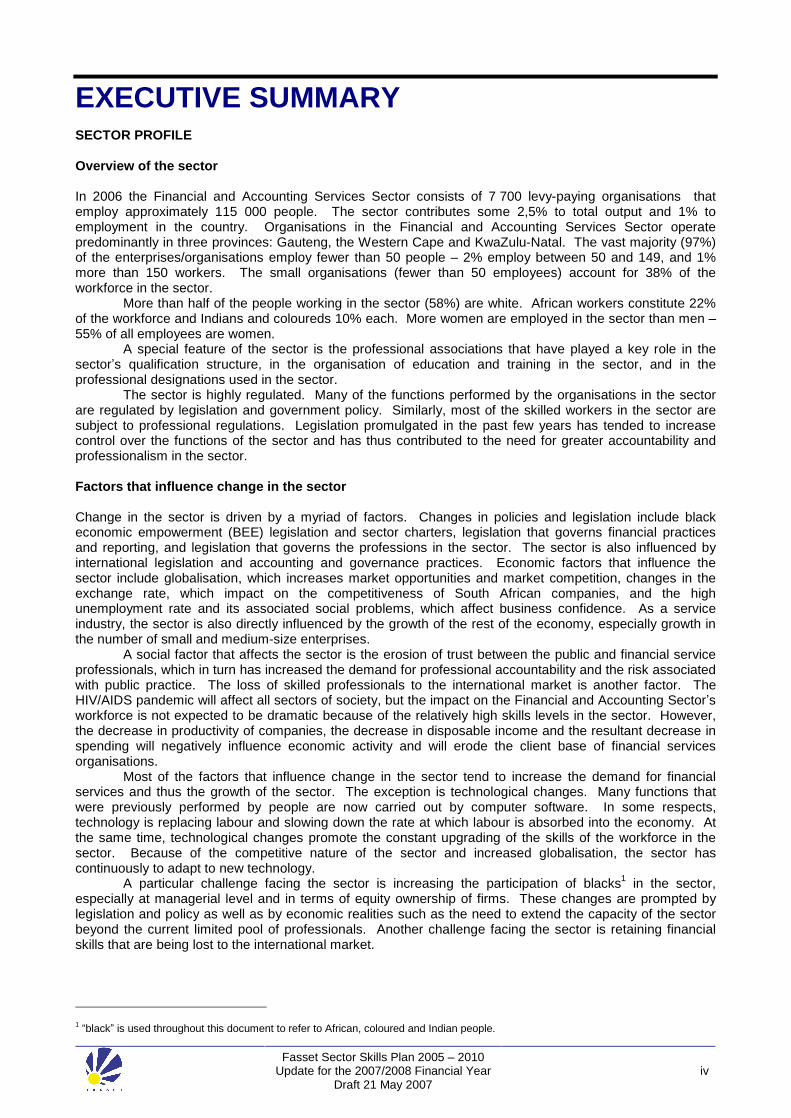
EXECUTIVE SUMMARY SECTOR PROFILE Overview of the sector In 2006 the Financial and Accounting Services Sector consists of 7 700 levy-paying organisations that employ approximately 115 000 people. The sector contributes some 2,5% to total output and 1% to employment in the country. Organisations in the Financial and Accounting Services Sector operate predominantly in three provinces: Gauteng, the Western Cape and KwaZulu-Natal. The vast majority (97%) of the enterprises/organisations employ fewer than 50 people � 2% employ between 50 and 149, and 1% more than 150 workers. The small organisations (fewer than 50 employees) account for 38% of the workforce in the sector.
More than half of the people working in the sector (58%) are white. African workers constitute 22% of the workforce and Indians and coloureds 10% each. More women are employed in the sector than men � 55% of all employees are women.
A special feature of the sector is the professional associations that have played a key role in the sector�s qualification structure, in the organisation of education and training in the sector, and in the professional designations used in the sector.
The sector is highly regulated. Many of the functions performed by the organisations in the sector are regulated by legislation and government policy. Similarly, most of the skilled workers in the sector are subject to professional regulations. Legislation promulgated in the past few years has tended to increase control over the functions of the sector and has thus contributed to the need for greater accountability and professionalism in the sector.
Factors that influence change in the sector Change in the sector is driven by a myriad of factors. Changes in policies and legislation include black economic empowerment (BEE) legislation and sector charters, legislation that governs financial practices and reporting, and legislation that governs the professions in the sector. The sector is also influenced by international legislation and accounting and governance practices. Economic factors that influence the sector include globalisation, which increases market opportunities and market competition, changes in the exchange rate, which impact on the competitiveness of South African companies, and the high unemployment rate and its associated social problems, which affect business confidence. As a service industry, the sector is also directly influenced by the growth of the rest of the economy, especially growth in the number of small and medium-size enterprises.
A social factor that affects the sector is the erosion of trust between the public and financial service professionals, which in turn has increased the demand for professional accountability and the risk associated with public practice. The loss of skilled professionals to the international market is another factor. The HIV/AIDS pandemic will affect all sectors of society, but the impact on the Financial and Accounting Sector�s workforce is not expected to be dramatic because of the relatively high skills levels in the sector. However, the decrease in productivity of companies, the decrease in disposable income and the resultant decrease in spending will negatively influence economic activity and will erode the client base of financial services organisations.
Most of the factors that influence change in the sector tend to increase the demand for financial services and thus the growth of the sector. The exception is technological changes. Many functions that were previously performed by people are now carried out by computer software. In some respects, technology is replacing labour and slowing down the rate at which labour is absorbed into the economy. At the same time, technological changes promote the constant upgrading of the skills of the workforce in the sector. Because of the competitive nature of the sector and increased globalisation, the sector has continuously to adapt to new technology.
A particular challenge facing the sector is increasing the participation of blacks1 in the sector, especially at managerial level and in terms of equity ownership of firms. These changes are prompted by legislation and policy as well as by economic realities such as the need to extend the capacity of the sector beyond the current limited pool of professionals. Another challenge facing the sector is retaining financial skills that are being lost to the international market.
1 �black� is used throughout this document to refer to African, coloured and Indian people.

Fasset Sector Skills Plan 2005 � 2010 Update for the 2007/2008 Financial Year
Draft 21 May 2007 v
THE DEMAND FOR SKILLS More than half (60%) of the employees in the sector are employed in managerial, professional and semi-professional positions. The professional people in the sector are mainly accountants and auditors, financial and management consultants, and investment professionals. The semi-professional and associated professional category consists largely of trainee accountants and auditors. The clerical and administrative staff consists of general administrators and clerks, secretaries and personal assistants, bookkeepers, and accounting clerks and receptionists.
The occupational profile of the sector reveals that the sector needs highly skilled workers with post-school qualifications. The current educational profile shows that 70% of the workforce has post-school qualifications.
Woman and African workers are underrepresented in the managerial and professional categories, and the future demand for skills will be met only if these imbalances are corrected.
Three skills priorities for employers in the sector are specialised financial skills, basic computer skills and marketing skills. The continuous upgrading of specialised financial skills is driven by the numerous legislative and regulatory changes that impact on the work of organisations in the sector. The need for computer skills flows from the continuous technological advancements in accounting and other software, while marketing skills are crucial for general business development and expansion.
Employment in the sector is expected to grow by 3 500 to 5 800 positions a year if economic growth in South Africa can be sustained at 4.5% to 6% per annum. The growth in employment is attributable to an increase in the demand for financial services resulting from the expansion of the client base of the sector, especially the growth in the number of Small, Medium and Micro Enterprises (SMMEs); legislative changes and an increase in the complexity of business activities that compel organisations to use specialised financial services and the general tendency of organisations to outsource non-core functions. Positions that will be created due to replacement demand will occur in two occupational categories: professionals, and technicians and associated professionals. The sector will have to attract large numbers of workers with tertiary education qualifications in the specialised fields relevant to the sector and with professional and technical qualifications conferred by the professional associations in the sector as a large part of the sector is dependent on people trained as accountants and auditors and as financial and business specialists.
Growth in the demand for clerical and administrative workers is expected to be slower than that for the professional and technician categories, and it is unlikely that the demand for workers in lower level occupations will increase.
The transformational needs of the sector add a special dimension to the demand for skilled financial professionals, namely an increased demand for people from historically disadvantaged groups.
THE SUPPLY OF SKILLS The availability of financial skills in the economy Information on the availability of people with financial skills was obtained from two national sources. The first was the Labour Force Surveys (LFSs) conducted by StatsSA. The September 2005 survey indicated 461 000 potential workers with post-school qualifications in the field of business, commerce and management studies, 57 000 (12%) of whom were unemployed at the time of the survey. For those with only a post-matric diploma or certificate, the unemployment rate was 19%. However, the unemployment rate dropped to 1% for those with a degree or a postgraduate qualification. The analysis furthermore showed that the circumstances of African graduates differed widely from those of members of the other three population groups. At all qualification levels, their unemployment rates were much higher.
A more detailed analysis of the availability of university and technikon graduates with qualifications in the financial field, and more specifically in accounting, was made possible by the NLRD, which is maintained by SAQA. The analysis shows that in 2001, the total number of university graduates with qualifications in either accounting or commerce, business management and business administration was 159 000. However, of these, only 29% (46 000) had majored in accounting. In the accounting field, the number of graduates increased by 42% over the period 1991 to 1996 and by 47% over the period 1996 to 2001. The growth in graduates in commerce, business management and business administration was 48% between 1991 and 1996 and 44% between 1996 and 2001.
Technikon graduates with qualifications in these two fields numbered 55 000, of whom 13 000 (24%) had qualifications in accounting. The number of people with qualifications in accounting grew by 226% from 1991 to 1996 and by 146% from 1996 to 2001. The growth rates for people with qualifications in commerce, business management and business administration were 221% from 1991 to 1996 and 98% from 1996 to 2001.
Fasset Sector Skills Plan 2005 � 2010 Update for the 2007/2008 Financial Year
Draft 21 May 2007 vi
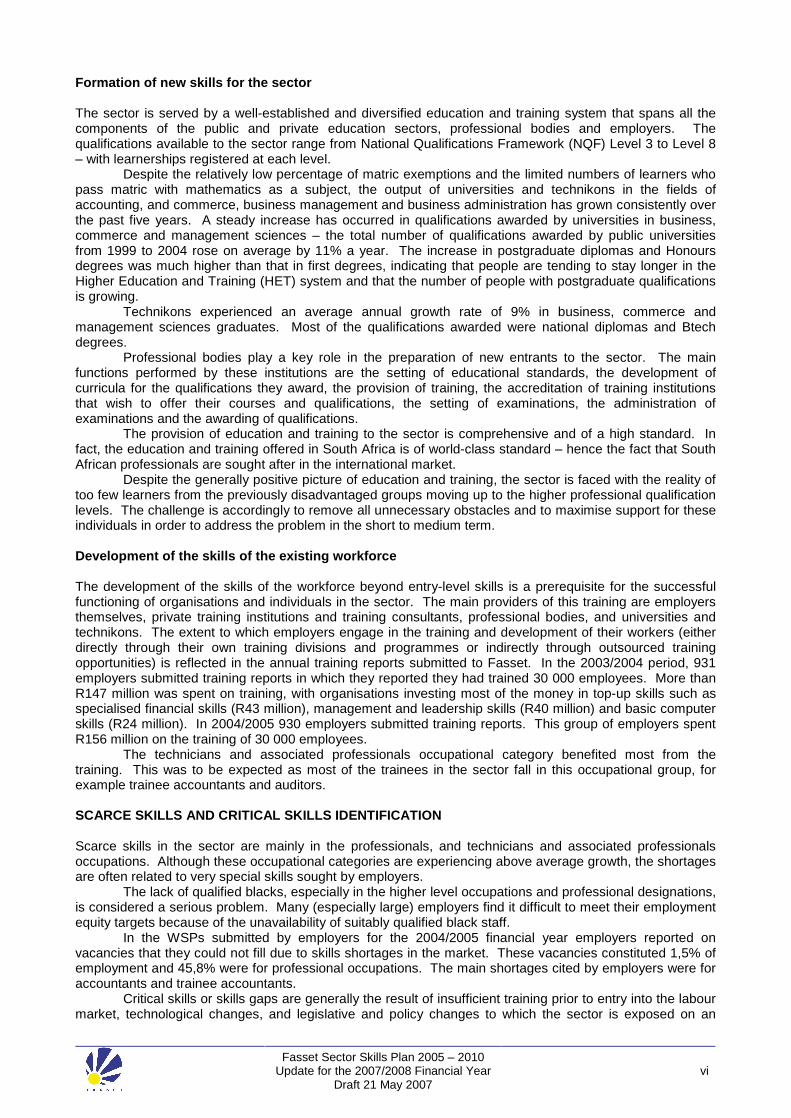
Formation of new skills for the sector The sector is served by a well-established and diversified education and training system that spans all the components of the public and private education sectors, professional bodies and employers. The qualifications available to the sector range from National Qualifications Framework (NQF) Level 3 to Level 8 � with learnerships registered at each level.
Despite the relatively low percentage of matric exemptions and the limited numbers of learners who pass matric with mathematics as a subject, the output of universities and technikons in the fields of accounting, and commerce, business management and business administration has grown consistently over the past five years. A steady increase has occurred in qualifications awarded by universities in business, commerce and management sciences � the total number of qualifications awarded by public universities from 1999 to 2004 rose on average by 11% a year. The increase in postgraduate diplomas and Honours degrees was much higher than that in first degrees, indicating that people are tending to stay longer in the Higher Education and Training (HET) system and that the number of people with postgraduate qualifications is growing.
Technikons experienced an average annual growth rate of 9% in business, commerce and management sciences graduates. Most of the qualifications awarded were national diplomas and Btech degrees.
Professional bodies play a key role in the preparation of new entrants to the sector. The main functions performed by these institutions are the setting of educational standards, the development of curricula for the qualifications they award, the provision of training, the accreditation of training institutions that wish to offer their courses and qualifications, the setting of examinations, the administration of examinations and the awarding of qualifications.
The provision of education and training to the sector is comprehensive and of a high standard. In fact, the education and training offered in South Africa is of world-class standard � hence the fact that South African professionals are sought after in the international market.
Despite the generally positive picture of education and training, the sector is faced with the reality of too few learners from the previously disadvantaged groups moving up to the higher professional qualification levels. The challenge is accordingly to remove all unnecessary obstacles and to maximise support for these individuals in order to address the problem in the short to medium term.
Development of the skills of the existing workforce The development of the skills of the workforce beyond entry-level skills is a prerequisite for the successful functioning of organisations and individuals in the sector. The main providers of this training are employers themselves, private training institutions and training consultants, professional bodies, and universities and technikons. The extent to which employers engage in the training and development of their workers (either directly through their own training divisions and programmes or indirectly through outsourced training opportunities) is reflected in the annual training reports submitted to Fasset. In the 2003/2004 period, 931 employers submitted training reports in which they reported they had trained 30 000 employees. More than R147 million was spent on training, with organisations investing most of the money in top-up skills such as specialised financial skills (R43 million), management and leadership skills (R40 million) and basic computer skills (R24 million). In 2004/2005 930 employers submitted training reports. This group of employers spent R156 million on the training of 30 000 employees.
The technicians and associated professionals occupational category benefited most from the training. This was to be expected as most of the trainees in the sector fall in this occupational group, for example trainee accountants and auditors.
SCARCE SKILLS AND CRITICAL SKILLS IDENTIFICATION Scarce skills in the sector are mainly in the professionals, and technicians and associated professionals occupations. Although these occupational categories are experiencing above average growth, the shortages are often related to very special skills sought by employers.
The lack of qualified blacks, especially in the higher level occupations and professional designations, is considered a serious problem. Many (especially large) employers find it difficult to meet their employment equity targets because of the unavailability of suitably qualified black staff.
In the WSPs submitted by employers for the 2004/2005 financial year employers reported on vacancies that they could not fill due to skills shortages in the market. These vacancies constituted 1,5% of employment and 45,8% were for professional occupations. The main shortages cited by employers were for accountants and trainee accountants.
Critical skills or skills gaps are generally the result of insufficient training prior to entry into the labour market, technological changes, and legislative and policy changes to which the sector is exposed on an

Fasset Sector Skills Plan 2005 � 2010 Update for the 2007/2008 Financial Year
Draft 21 May 2007 vii
ongoing basis. Critical skills listed by employers are specialist financial skills, basic computer skills, administrative and support skills, and management and leadership skills. Specialist financial skills are the most important critical skills in the sector as these skills are required across all occupational groups.
SMALL BUSINESS, ENTREPRENEURIAL OPPORTUNITIES AND OTHER NSDS PRIORITIES
Fasset supports initiatives that lead to the development of new employment opportunities in the labour market and that provide new entrants with the skills needed for self-employment. These operations initiatives include learnerships, social development projects funded by Fasset and Fasset�s own strategy for supporting new BEE firms.
Various support structures for small businesses in the sector are already in place. Small levy payers benefit from free training offered nationally throughout the year (such as continuous professional education (CPE) and skills development facilitator (SDF) training).
Small and medium businesses can also claim grants if they employ Previously Disadvantaged Individuals (PDI) learners. Fasset views Adult Basic Education and Training (ABET) as a strategic priority and currently funds a complete ABET programme for ABET employees in the sector. The national standard of good practice will continue to be upheld through the promotion of the Investors in People (IIP) standard.

Fasset Sector Skills Plan 2005 � 2010 Update for the 2007/2008 Financial Year
Draft 21 May 2007 viii
INTRODUCTION According to the Skills Development Act (SDA) section 10(1)(a), each Sector Education and Training Authority (Seta) must develop a Sector Skills Plan (SSP) within the framework of the National Skills Development Strategy (NSDS). Each Seta must also submit annual strategic plans and reports on the implementation of the Seta SSP to the Director-General of the Department of Labour (DoL).
On 3 March 2005, the Minister of Labour announced the new NSDS 2005-2010 targets. This national strategy sets priorities for skills development that address the scarcity of skills and lack of capacity in the current labour force � skills needed to meet the challenges posed by economic growth and to alleviate poverty. In accordance with the DoL requirements and in service of the NSDS, the Fasset five-year SSP was submitted to the DoL in August 2004. This SSP identified the skills needs (skills shortages and gaps) in the sector and set out the Seta implementation plan in relation to NSDS objectives.
In early 2006 the Government announced its Accelerated and Shared Growth Initiative for South Africa (AsgiSA) and the formation of a new institution to look at skills development - the Joint Initiative for Priority Skills Acquisition (JIPSA). The SSP and annual updates prepared by Fasset are aimed at identifying the sector�s skills needs and describing the constraints on the effective development of skills. Therefore support the work undertaken by JIPSA and incorporate the economic growth targets set by AsgiSA.
The SSP and the updates indicate to education and training providers and communities the skills that are currently needed or will be needed in the future. The annual updates also afford Fasset the opportunity to update information in respect of changes that may have occurred in the sector since the submission of the SSP. These changes are considered by the Fasset Management Board in its annual strategic planning processes.
This SSP annual update draws extensively on information collected through various research projects commissioned by Fasset in the two years preceding the SSP. These projects include a comprehensive sector study on the views of stakeholder groups such as employers, professional institutes, learners and educational institutions; a study on the need for learnerships in the sector based on employer and stakeholder views; and analyses of the grant applications submitted to Fasset in the first five years of the implementation of the skills development legislation (these applications reflect the information collected from the employers who participated in the Fasset grant system, i.e. claimed grants back from Fasset on the basis of grant application forms.)
In addition to these surveys, data from other sources were also analysed in order to identify skills trends influencing the sector. These sources include the National Learners Records Database (NLRD) operated by the South African Qualifications Authority (SAQA), economic data from the South African Reserve Bank (SARB), various surveys conducted by Statistics South Africa (StatsSA), and the sector brief for the Financial and Accounting Services Sector commissioned by the DoL. The SSP was prepared according to guidelines provided by the DoL. Chapter 1 of the document describes the sector in terms of its industrial coverage, the enterprises in the sector and the sector�s occupational composition. The chapter also analyses the main factors driving change in the sector. The second chapter analyses the demand for skills in the sector, and the third chapter the supply of skills to the sector. Chapter 4 deals with scarce and critical skills. The final chapter highlights issues related to the NSDS indicators not directly covered in the chapter on scarce and critical skills.

Fasset Sector Skills Plan 2005 � 2010 Update for the 2007/2008 Financial Year
Draft 21 May 2007 1
1 SECTOR PROFILE 1.1 INTRODUCTION The nature and composition of any sector are critical factors in the assessment of skills needs and in the development of skills strategies. This chapter gives a brief profile of the Financial and Accounting Services Sector.2 The profile includes the industrial coverage of the sector, an overview of the organisations and employment in the sector, the occupational profile of employees and the professional bodies associated with the sector.
The chapter also describes the factors that influence change in employment and in skills needs. These factors include policy and legislation, economic factors, and social, technological and environmental issues.
1.2 INDUSTRIAL COVERAGE Financial, accounting, management consulting and other financial services include 17 categories of the SIC. Most of these categories fall within the main group Finance, Real Estate and Business Services. Some of the economic activities described under the 17 SIC codes are similar, and, in order to facilitate the meaningful analysis of data, services/organisations belonging to Fasset have been recategorised into seven subsectors.3 The SIC categories and the subsectors to which each belongs are indicated in Table 1.1.
The subsector descriptions are generally self-explanatory. However, it should be noted that the development organisations belonging to the Financial and Accounting Services Sector include only those that provide financial and management consulting services, for example organisations that provide financial assistance and (in some instances) business advice, such as the Industrial Development Corporation (IDC). Similarly, business and management consulting services encompass a wide range of activities and may also occur in other Setas. Only those organisations that choose to describe their main functions in terms of SIC code 83190 are included in this subsector. Accounting and auditing firms that also provide business and management consulting services are classified in the subsector Accounting, Bookkeeping, Auditing and Tax Services.
The subsector Activities Auxiliary to Financial Intermediation includes statutory bodies such as the Financial Services Board (FSB) and the Independent Regulatory Board for Auditors (IRBA), professional associations as well as services not included in any of the other subsectors, for example debt collection.
2 Fasset is responsible for activities described as finance, accounting, management consulting and other financial services. For brevity, the sector served by Fasset is referred to as the Financial and Accounting Services sector. 3 This categorisation is used consistently through all of Fasset�s research reports.

Fasset Sector Skills Plan 2005 � 2010 Update for the 2007/2008 Financial Year
Draft 21 May 2007 2
Table 1.1 Industrial coverage and subsectoral demarcation
SIC code SIC description Subsector
81904 Investment Entities and Trusts
88103 Company Secretary Services Investment Entities and Trusts and Company Secretary Services
83110 Administration of Financial Markets
83120 Security Dealing Activities
83121 Stockbroking
88102 Asset Portfolio Management
Stockbroking and Financial Markets
83180 Development Corporations and Organisations Development Organisations
88101 Tax Services
88120 Accounting, Bookkeeping and Auditing Activities; Tax Consultancy
88121 Activities of Accountants and Auditors Registered in Terms of the Public Accountants and Auditors Act
88122 Activities of Cost and Management Accountants
88123 Bookkeeping Activities, including Relevant Data Processing and Tabulating Activities
Accounting, Bookkeeping, Auditing and Tax Services
83190 Activities Auxiliary to Financial Intermediation Activities Auxiliary to Financial Intermediation
88140 Business and Management Consulting Services
88112 Project Financial Management Business and Management Consulting Services
91108 South African Revenue Service (SARS) 9110E National Treasury
Provincial Treasuries SARS and Government Departments
1.3 ENTERPRISES AND EMPLOYMENT In 2004 the Financial and Accounting Services Sector consisted of 7 200 levy-paying organisations that had 9 300 operational units4 across the country and employed approximately 106 000 people. In 2006 the number of levy-paying organisations had grown to more than 7 700 (an increase of 8% in the total number of organisations). It is estimated that employment has grown to approximately 115 000 employees5 - an annual growth of 4%.
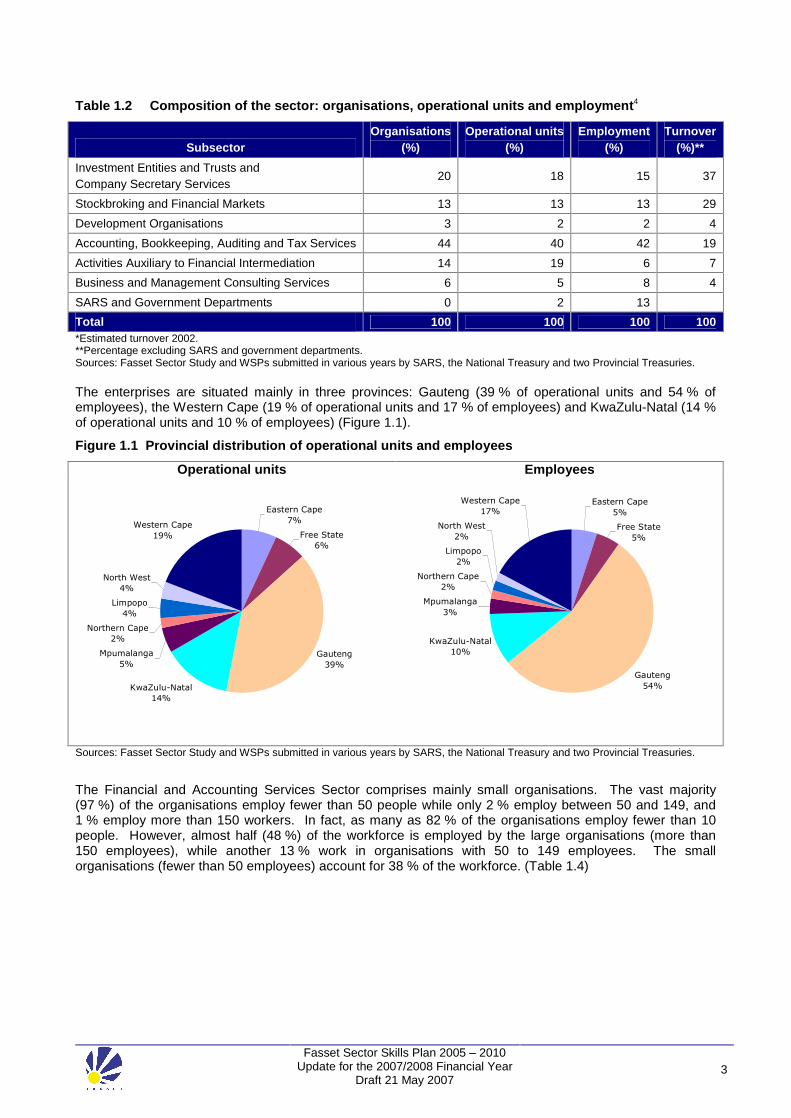
The sector contributes 2,5 % to total output and 1% to employment in the country. The largest subsector is Accounting, Bookkeeping, Auditing and Tax Services, which accounts for 44% of the organisations, 40% of the operational units and 42% of the employees in the sector. This is followed by Investment Entities and Trusts and Company Secretary Services for which the corresponding figures are 20 %, 18 % and 15 % respectively. The smallest subsector is Development Organisations, which accounts for only 3% of the organisations, 2% of the operational units and 2% of employees in the sector (Table 1.2.).
4 An operational unit refers to a physical office or operation. One organisation may have one or it may have several operational units. For example, if an auditing firm has offices in several towns, they are regarded as separate operational units even if they are registered under one SDL number. 5 Employment estimated by weighting of employment data submitted in WSPs in the year 2005/2006. In the absence of any recent data from SARS employment in that organisation is based on their WSP submitted in 2003/2004.
Fasset Sector Skills Plan 2005 � 2010 Update for the 2007/2008 Financial Year
Draft 21 May 2007 3
Table 1.2 Composition of the sector: organisations, operational units and employment4
Subsector Organisations
(%) Operational units
(%) Employment
(%) Turnover
(%)**
Investment Entities and Trusts and Company Secretary Services
20 18 15 37
Stockbroking and Financial Markets 13 13 13 29
Development Organisations 3 2 2 4
Accounting, Bookkeeping, Auditing and Tax Services 44 40 42 19
Activities Auxiliary to Financial Intermediation 14 19 6 7
Business and Management Consulting Services 6 5 8 4
SARS and Government Departments 0 2 13
Total 100 100 100 100 *Estimated turnover 2002. **Percentage excluding SARS and government departments. Sources: Fasset Sector Study and WSPs submitted in various years by SARS, the National Treasury and two Provincial Treasuries. The enterprises are situated mainly in three provinces: Gauteng (39 % of operational units and 54 % of employees), the Western Cape (19 % of operational units and 17 % of employees) and KwaZulu-Natal (14 % of operational units and 10 % of employees) (Figure 1.1).
Figure 1.1 Provincial distribution of operational units and employees
Operational units Employees
Eastern Cape
7%
Free State
6%
Gauteng
39%
KwaZulu-Natal
14%
Mpumalanga
5%
Northern Cape
2%
Limpopo
4%
North West
4%
Western Cape
19%
Eastern Cape
5%
Free State
5%
Gauteng
54%
KwaZulu-Natal
10%
Mpumalanga
3%
Northern Cape
2%
Limpopo
2%
North West
2%
Western Cape
17%
Sources: Fasset Sector Study and WSPs submitted in various years by SARS, the National Treasury and two Provincial Treasuries.
The Financial and Accounting Services Sector comprises mainly small organisations. The vast majority (97 %) of the organisations employ fewer than 50 people while only 2 % employ between 50 and 149, and 1 % employ more than 150 workers. In fact, as many as 82 % of the organisations employ fewer than 10 people. However, almost half (48 %) of the workforce is employed by the large organisations (more than 150 employees), while another 13 % work in organisations with 50 to 149 employees. The small organisations (fewer than 50 employees) account for 38 % of the workforce. (Table 1.4)

Fasset Sector Skills Plan 2005 � 2010 Update for the 2007/2008 Financial Year
Draft 21 May 2007 4
Table 1.3 Size distribution of organisations in the sector
Organisation size Organisations (%)
Employees (%)
1 - 9 employees 82 21
10 - 19 employees 11 10
20 - 49 employees 4 7
50 - 149 employees 2 13
150 + employees 1 48
Total 100 100
Sources: Calculated from Fasset Sector Study and WSPs submitted in various years by SARS, the National Treasury and two Provincial Treasuries.
1.4 CURRENT EMPLOYMENT a) Population group
More than half of the people working in the sector (58%) are white. African workers constitute 22% of the workforce and Indians and coloureds 10% each. The need for greater racial equity is important particularly if one considers the composition of each occupational category (Table 1.4).
Workers in the occupational category legislators, senior officials, managers, and owner managers are generally experienced professionals who have either started their own businesses or who have moved into partnership or managerial positions in their organisations. A significantly high 81% of employees in this occupational group are white; only 10% are African, 4% coloured and 8% Indian.
Table 1.4 Distribution of workers in the sector according to occupational category and population group
African Coloured Indian White Total Occupational category
% % % % %
Legislators, Senior Officials, Managers & Owner Managers 8 4 8 81 100
Professionals 14 6 10 70 100 Technicians & Associate Professionals 19 8 13 59 100 Clerks & Administrative Workers 24 18 9 49 100 Service & Sales Workers 62 18 3 18 100 Skilled Agricultural & Fishery Workers 50 38 0 13 100 Skilled Workers, Craft & Related Trades 33 10 4 53 100 Plant & Machine Operators & Assemblers 44 9 1 46 100 Labourers & Elementary Occupations 85 12 0 2 100 Total 22 10 10 58 100
Sources: Calculated from WSPs approved by Fasset in 2005/2006.
b) Gender
More women are employed in the sector than men � 55% of all employees are women. African women constitute 12% of the total workforce, coloured women 7%, Indian women 5% and white women 31%. The predominance of women is largely attributable to the large percentage (81%) of women in clerical and administrative occupations. Only 30% of legislators, senior officials, managers and owner managers are women. (Table 1.5)

Fasset Sector Skills Plan 2005 � 2010 Update for the 2007/2008 Financial Year
Draft 21 May 2007 5
Table 1.5 Distribution of workers in the sector according to occupational category, population group and gender
African Coloured Indian White Total Occupational Category
M F M F M F M F M F
% % % % % % % % % %
Legislators, Senior Officials, Managers & Owner Managers 5 2 2 2 6 2 57 24 70 30 Professionals 8 6 3 3 6 4 42 28 58 42 Technicians & Associated Professionals 9 10 3 5 7 7 28 31 47 53 Clerical & Administrative Workers 8 16 3 14 2 7 6 43 19 81 Service & Sales Workers 26 36 5 13 2 1 8 10 40 60 Skilled Agricultural & Fishery Workers 44 6 38 0 0 0 13 0 94 6 Skilled Workers, Craft & Related Trades 30 3 7 3 4 0 51 3 92 8 Plant & Machine Operators and Assemblers 41 3 6 3 1 0 39 6 88 12 Labourers & Elementary Occupations 35 50 8 5 0 0 1 1 44 56 Total 10 12 3 7 5 5 27 31 45 55
Source: Calculated from WSPs approved by Fasset in 2005/2006.
c) Age
The Fasset Sector Study (2002) found that workers in the sector are relatively young, with 63% 35 years of age or younger. Only 4% are in the age category 56 to 65. As can be expected, the average age varies for the different occupational groups. Average ages are as follows: managers: 39; professionals: 31; technicians and associated professionals: 26; clerks and administrative workers: 34; service and sales workers: 31; plant and machine operators: 43; labourers and workers in elementary occupations: 40; and trainees: 24.
The relative youthfulness of professionals in the sector is illustrated in Table 1.6. This is, at least in part, the result of the training and development function that the sector is fulfilling and the movement of qualified professionals into more senior financial positions in other sectors. For the Financial and Accounting Services Sector itself, the loss of older and more experienced professionals has profound implications, especially for the need to develop managerial talent and skills.
Table 1.6 Average age of workers in the Financial and Accounting Services Sector compared to total economy
Average age Occupational category
Fasset sector Total economy
Legislators, Senior Officials, Managers & Owner Managers 39 47
Professionals 31 49
Technicians & Associate Professionals 26 44
Clerks & Administrative Workers 34 38
Service & Sales Workers 31 39
Plant & Machine Operators & Assemblers 43 42
Labourers & Elementary Occupations 40 38
Sources: Fasset Sector Study (2002) and LFS September 2003.
d) People with disabilities
The sector employs very few disabled people. Only 0,6 of all employees were reported as having some disability.6 The kinds of disabilities specified by employers were deafness or impaired hearing (0,1%), blindness or impaired vision (0,2%), and paralysis (0,1%). A further 0,2% were disabled in other ways, but employers did not give details regarding the type of disability.
6 Fasset Sector Study.
Fasset Sector Skills Plan 2005 � 2010 Update for the 2007/2008 Financial Year
Draft 21 May 2007 6
1.5 BEE AND CO-OPERATIVES A recent study7 conducted by Fasset revealed that 18% of small firms in the sector can be classified as BEE firms. These firms are supported by Fasset through the provision of free CPE and the learnership grant for PDIs. In the 2004/2005 period, 20% of these small BEE firms attended at least one training (CPE) event hosted by Fasset, and 11% applied for the PDI learnership grant.
Establishing BEE co-operatives is not considered an imperative for organisations in the sector as co-operatives are more beneficial to farming organisations and consumer groups.
1.6 PROFESSIONAL ASSOCIATIONS Because of the large concentration of financial professionals and semi- and associate professionals in the sector, a number of professional associations that represent and are responsible for the training of these employees have established close relationships with Fasset. An important characteristic of the Financial and Accounting Services Sector is that membership of professional associations is highly valued by employers and the professionals themselves. Furthermore, qualifications, professional designations and membership of professional associations are interlinked, and most of the professional bodies confer upon their members qualifications that have been registered on the NQF. Most of these qualifications require workplace experience in addition to institutional training. The total set of qualifications used in the sector forms an intricate combination of qualifications conferred by the public and private higher education institutions and those conferred by the professional associations themselves.
Many of the professional associations are affiliated to international organisations, and many of the qualifying examinations are either internationally set and marked, or they are moderated by international organisations. This brings with it international standards in education and training and international recognition for South African professionals. International recognition of the professional bodies and their members flows from the bodies� adherence to organisational requirements determined by the international associations (e.g. the Statement of Member Obligations set by the International Federation of Accountants).
The professional bodies not only play a pivotal role in skills development in the financial services field, they are also represented on Fasset�s management board and are closely involved in the activities of Fasset and its substructures. Several of the learnerships registered with Fasset provide access to membership of professional bodies and to the professional designations guarded by the professional bodies. As a result of these linkages, as well as their pre-existing experience and capacity, some of the professional bodies act as quality assurance partners for the learnerships registered with Fasset.
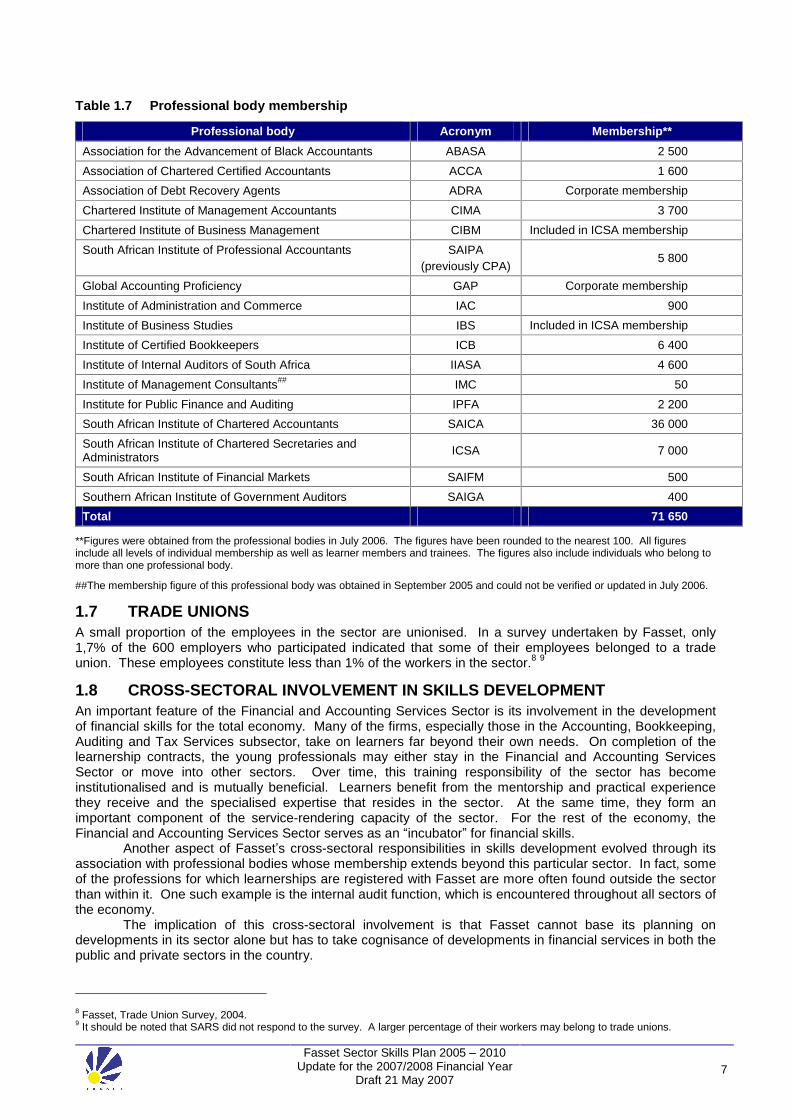
The professional bodies associated with Fasset are listed in Table 1.7 below, which also indicates their current total membership. Total membership of those bodies that provide individual membership is approximately 72 000. In some instances, linkage of individual professionals to the professional bodies is through corporate or institutional membership.
7 Small BEE firms in The Financial and Accounting Services Sector, September 2005.
Fasset Sector Skills Plan 2005 � 2010 Update for the 2007/2008 Financial Year
Draft 21 May 2007 7
Table 1.7 Professional body membership
Professional body Acronym Membership**
Association for the Advancement of Black Accountants ABASA 2 500
Association of Chartered Certified Accountants ACCA 1 600
Association of Debt Recovery Agents ADRA Corporate membership
Chartered Institute of Management Accountants CIMA 3 700
Chartered Institute of Business Management CIBM Included in ICSA membership
South African Institute of Professional Accountants SAIPA (previously CPA)
5 800
Global Accounting Proficiency GAP Corporate membership
Institute of Administration and Commerce IAC 900
Institute of Business Studies IBS Included in ICSA membership
Institute of Certified Bookkeepers ICB 6 400
Institute of Internal Auditors of South Africa IIASA 4 600
Institute of Management Consultants## IMC 50
Institute for Public Finance and Auditing IPFA 2 200
South African Institute of Chartered Accountants SAICA 36 000
South African Institute of Chartered Secretaries and Administrators ICSA 7 000
South African Institute of Financial Markets SAIFM 500
Southern African Institute of Government Auditors SAIGA 400
Total 71 650
**Figures were obtained from the professional bodies in July 2006. The figures have been rounded to the nearest 100. All figures include all levels of individual membership as well as learner members and trainees. The figures also include individuals who belong to more than one professional body.
##The membership figure of this professional body was obtained in September 2005 and could not be verified or updated in July 2006.
1.7 TRADE UNIONS A small proportion of the employees in the sector are unionised. In a survey undertaken by Fasset, only 1,7% of the 600 employers who participated indicated that some of their employees belonged to a trade union. These employees constitute less than 1% of the workers in the sector.8 9
1.8 CROSS-SECTORAL INVOLVEMENT IN SKILLS DEVELOPMENT An important feature of the Financial and Accounting Services Sector is its involvement in the development of financial skills for the total economy. Many of the firms, especially those in the Accounting, Bookkeeping, Auditing and Tax Services subsector, take on learners far beyond their own needs. On completion of the learnership contracts, the young professionals may either stay in the Financial and Accounting Services Sector or move into other sectors. Over time, this training responsibility of the sector has become institutionalised and is mutually beneficial. Learners benefit from the mentorship and practical experience they receive and the specialised expertise that resides in the sector. At the same time, they form an important component of the service-rendering capacity of the sector. For the rest of the economy, the Financial and Accounting Services Sector serves as an �incubator� for financial skills.
Another aspect of Fasset�s cross-sectoral responsibilities in skills development evolved through its association with professional bodies whose membership extends beyond this particular sector. In fact, some of the professions for which learnerships are registered with Fasset are more often found outside the sector than within it. One such example is the internal audit function, which is encountered throughout all sectors of the economy.
The implication of this cross-sectoral involvement is that Fasset cannot base its planning on developments in its sector alone but has to take cognisance of developments in financial services in both the public and private sectors in the country.
8 Fasset, Trade Union Survey, 2004. 9 It should be noted that SARS did not respond to the survey. A larger percentage of their workers may belong to trade unions.

Fasset Sector Skills Plan 2005 � 2010 Update for the 2007/2008 Financial Year
Draft 21 May 2007 8
1.9 DRIVERS OF CHANGE Over the past number of years, major changes have impacted on the sector and will continue to do so in the foreseeable future. They include legislation, draft legislation, charters and changes in accepted practices. The Financial and Accounting Services Sector also does not stand divorced from social and economic changes in the country. The main factors that play a role in change in the sector, and more specifically in the need for skills in the sector, are discussed under the following headings: policy and legislation, economic influences, social factors, technological changes and environmental factors.
1.9.1 Policy and legislation Numerous policy and legislative changes impact on the sector � only a few of the most pertinent of these are included in this discussion.
a) Employment equity and black economic empowerment The need to correct racial and gender imbalances and to increase the participation of all population groups in the mainstream economic activities of South Africa is widely accepted, and measures to attain these objectives have been entrenched in legislation such as the Employment Equity Act (EEA),10 the Preferential Procurement Framework Act11 and the more recent Broad-Based Black Economic Empowerment (BBBEE) Act,12 as well as in policy documents such as the Code of Good Practice in Black Economic Empowerment in Public Private Partnerships. These developments, as well as the economic imperatives to draw more black people into skilled occupations, will affect all sectors over the next few years and exacerbate the effect on individual sectors. For example, the need for black financial professionals will increase dramatically, and the Financial and Accounting Services Sector will have to compete for resources from a limited pool. This shortage of skilled resources is expected to become an important driving force in skills development in the period covered by this SSP.
b) Industry and professional charters BEE legislation has led to the development of several sector charters that will steer human resources practices as well as business activities for the foreseeable future. Although all the charters will exert an indirect influence on the total economy (e.g. through procurement and service policies), the Financial Services Charter will directly affect components of the Financial and Accounting Services Sector.
The Financial Services Charter, which was approved in October 2003, is a voluntary charter in which the participants have set a framework for black economic empowerment in the Financial Services Sector.13 The charter aims to increase the participation of black people (especially women) and the disabled in the sector while further unlocking the sector�s potential, promoting its global competitiveness and enhancing its world-class status.
The charter encompasses various issues such as human resources development, procurement policies, enterprise development, access to financial services, empowerment financing, ownership and control in the Financial Services Sector, shareholder activism and corporate social responsibility. Firms that are bound by the charter will be rated in each category of activity according to a scorecard. These ratings will be used not only to monitor progress but will also be considered by the private and public sectors when procuring financial services.
The charter applies directly to only a small component of the Financial and Accounting Services Sector, namely the licensed exchanges, fund managers and organisations that operate in the financial markets. However, the charter will certainly exert indirect pressure on the Financial and Accounting Services Sector. Two aspects of the charter are especially important: the short-term targets set in terms of the employment of blacks (especially women) in managerial positions and the procurement targets that specify the desired percentage of procurement from BEE-accredited companies. In the former case, financial institutions will be competing more vigorously for black professionals in the financial field, and, in the latter case, financial services will be procured from BEE-accredited companies � thus compelling organisations in the rest of the Financial and Accounting Services Sector to change their ownership and management
10 Employment Equity Act, No. 55 of 1998. 11 Preferential Procurement Framework Act, No. 5 of 2000. 12 Broad-Based Black Economic Empowerment Act, No. 53 of 2003. 13 The Financial Services Sector, which is bound by the charter, includes banks, long-term insurers, short-term insurers, managers of formal collective investment schemes in securities, investment managers and other entities that manage funds on behalf of the public, including retirement funds and members of any exchange licensed to trade equities or financial instruments in this country, and entities listed as part of the financial index of a licensed exchange. Any other institution in the Financial and Accounting Services sector may opt in (Financial Services Charter, 2003:3).

Fasset Sector Skills Plan 2005 � 2010 Update for the 2007/2008 Financial Year
Draft 21 May 2007 9
structures if their client bases are situated in the Financial Services Sector as defined for the purpose of the charter.
Another charter that will impact on the sector is the Broad-Based Socio-Economic Empowerment Charter for the Chartered Accountancy Profession in South Africa. This charter, which is currently being developed by the accounting profession14, aims, among other things, to increase the supply of black chartered accountants in South Africa.
c) Legislation that governs corporate structures and governance The basic requirements for corporate governance as well as the statutory duties of auditors are prescribed in the Companies Act15 and the subsequent amendments to this Act. The Department of Trade and Industry (DTI) has embarked on a major project to review company law, including amending the Companies Act. The idea is to provide legal backing for accounting standards and to set clear reporting frameworks for companies. The DTI has issued a policy document on the proposed changes, one of which is the establishment of a new corporate entity that will eliminate the distinction between companies and close corporations.16
d) The King Reports The major forces influencing corporate governance reform in South Africa have been the markets and the requirements they have set. Market discipline instituted after falling equity prices has caused radical changes in corporate structures. The return of foreign investors to South Africa after 1994 has been accompanied by their criticism of corporate governance and performance in this country. The First King Commission on Corporate Governance in South Africa was established under the aegis of the Institute of Directors in 1994. The committee aimed at, and has been successful in, raising public awareness of corporate governance. Nevertheless, compliance with the commission�s recommendations remained voluntary, even for companies listed on the JSE Securities Exchange.17 In 2000, however, the JSE required as part of its listing requirements that companies report the extent to which they do not meet the stipulations of the King Report. Following representations, the King Code was updated in 2002 by the Second King Committee Report on Corporate Governance. The report looked at the boards and directors of companies, their composition, independence, remuneration and how meetings should be conducted. The resultant code provides for board committees and how they and the board itself should be evaluated.18 The increased requirements placed on listed companies have contributed to a number of companies de-listing from the JSE.
The issue of risk management received special attention in the Second King Report. The importance of the role and independence of the internal audit and the audit committee was reconfirmed as was the need for organisational integrity and a code of ethics. These recommendations have increased the demand for professional company secretarial services and, as a result, have highlighted the significance of the internal audit and its role in the internal control system. Audit firms are becoming increasingly involved in internal audit and risk management/assessment activities on a consultation basis.
e) Tax legislation and policy Tax legislation, tax policy and tax requirements are revised on a regular basis. Keeping up to date with these changes is central to the work of almost all components of the Financial and Accounting Services Sector. Taxation will consequently always be a component of the skills development needs of the sector.
f) Public Finance Management Act With the promulgation of the Public Finance Management Act (PFMA) in 1999, the effective, efficient and economical use of public resources was emphasised. Strict requirements have been placed on the accounting officers of government departments with regard to financial management, internal control and corporate governance. A chapter of the Act is also dedicated to the functions and responsibilities of treasuries, national as well as provincial (Chapter 2).19
The different treasuries, of which there are a number in the Financial and Accounting Services Sector, will have an ongoing training and roll-out responsibility in respect of the PFMA. The PFMA also
14 The process is facilitated by the SAICA.
15 Companies Act, No. 61 of 1973. 16 Temkin, S. Revamp of SA company law aims to loosen red tape in setting up firms, Business Day, 15 July 2004. 17 Malherbe, Segal, Corporate governance in South Africa, 2001. 18 Institute of Directors, The King Report on Corporate Governance, 2002. 19 The Public Finance Management Act, No. 1 of 1999 as amended.

Fasset Sector Skills Plan 2005 � 2010 Update for the 2007/2008 Financial Year
Draft 21 May 2007 10
prescribed the establishment of the Accounting Standards Board. This board lays down the generally recognised accounting practice (GRAP) standards applicable to the public sector and is in the process of developing a framework for the preparation and presentation of financial statements for the public sector. These frameworks and the GRAP standards will influence the public sector members of the Financial and Accounting Services Sector as well as private audit firms used by the Office of the Auditor-General for public sector audits as they will require knowledge of the standards to be able to audit the financial statements.
g) The Auditing Profession Act, 2005
After almost of decade of debating new legislation to regulate the auditing profession, the Auditing Profession Act (Act 26 of 2005) was signed into legislation in January 2006. The act repeals the Public Accountants' and Auditors' Act, (Act 80 of 1991) and aims to
a) introduce a more comprehensive and modern legislative framework for regulating the auditing profession;
b) improve the integrity of South Africa�s financial sector and financial reporting; c) introduce measures to ensure that potential conflicts of interest between auditors and their clients
are minimised and that swift and appropriate actions can be taken to rectify a situation where the independence of an auditor is at stake.20 The Act establishes an Independent Regulatory Board for Auditors (IRBA) to register auditors and
hold them accountable for their professional conduct, and to implement auditing standards comparable to international standards. The IRBA replaces the Public Accountants and Auditors Board (PAAB). The new act also creates Standards-Setting Boards for Auditor Ethics and for Auditing itself. Proposed amendments to the Companies Act, 61 of 1973 will ensure that only financial professionals who are registered as auditors with IRBA may be appointed as the auditor of a company and that all audits of company accounts will be subject to the controls and safeguards of the Act. The Act furthermore provides for more stringent requirements with regard to financial disclosure by auditors of irregularities and criminal and fraudulent financial practices.
An important aspect of the new act is that it requires individual auditors as well as auditing firms to register with the Board and to subject themselves to the oversight of the Board. (Auditing Profession Act, 2005) Concerns have been raised that the requirements of registration at the firm level as well as the individual auditors� level may be too onerous for small auditing firms and sole proprietors. The new regulatory requirements are also expected to increase the cost of auditing services by a substantial margin.21
The new legislation will impact not only on the public component of the Financial and Accounting Services Sector as the Office of the Auditor-General also uses private audit firms when it requires additional capacity. The utilisation cost of using private audit firms amounted to R137 million in 2002.22 The proposed legislation could further influence the amount of work contracted to private audit firms in the future, with the resultant capacity implications.
h) Debt Collectors Act Debt collections forms part of the subsector Services Auxiliary to Financial Intermediation and several of the major debt collecting firms are registered with Fasset (although debt collection firms are also registered with several other Setas).
The regulation of debt collectors was introduced with the promulgation of the Debt Collectors Act (No. 114 of 1998). This Act makes provision for the establishment of a Debt Collectors Council and for the registration of debt collectors. At this stage, no competency requirements are attached to the registration of debt collectors partly because before 2004 there were no qualifications available for this category of workers. However, during 2004 Fasset supported the development of such a qualification and in December 2004 the Further Education and Training Certificate in Debt Collection was registered under the ETQA scope of Fasset. Currently Fasset is developing a learnership that leads to this qualification. These measures will contribute to the professionalism of this component of the sector, which in turn may increase the demand for its services. i) The National Credit Act
The National Credit Act (Act 34 of 2005) was signed into legislation in March 2005. This Act aims to
20 Moores Rowland, Public comment on the draft Auditing Profession Bill, 2004 (February 2005). 21 Temkin, S, Auditors generally welcome new law despite concerns about education roles. Business Day, 7 April 2006 22 Gloeck, J.D. Advancing or retreating in the quest to improve public accountability and government auditing. South African Journal of Accountability and Auditing Research.

Fasset Sector Skills Plan 2005 � 2010 Update for the 2007/2008 Financial Year
Draft 21 May 2007 11
promote a fair and non-discriminatory marketplace for access to consumer credit and for that purpose to provide for the general regulation of consumer credit and improved standards of consumer information;
promote black economic empowerment and ownership within the consumer credit industry; prohibit certain unfair credit and credit-marketing practices; promote responsible credit granting and use and for that purpose to prohibit reckless credit granting; provide for debt re-organisation in cases of over-indebtedness; regulate credit information; provide for registration of credit bureaux, credit providers and debt counselling services; establish national norms and standards relating to consumer credit; promote a consistent enforcement framework relating to consumer credit; establish the National Credit Regulator and the National Consumer Tribunal.23
Knowledge of this Act is not only imperative for various components of the Financial and Accounting Services Sector, for example for accounting practices and the debt collection industry, but the Act will also influence the way in which certain functions are performed. One of the specific requirements of the Act, namely the provision of debt counselling services to consumers will probably lead to the development of a new occupation i.e. debt counsellors.
j) Financial Advisory and Intermediary Services Act The Financial Advisory and Intermediary Services Act, No. 37 of 2002 (FAIS Act), impacts specifically on the financial planning profession, some of whose members are employed in this sector. The Act requires all service providers to be licensed as such. In order to be licensed, a financial services provider has to satisfy the registrar that he/she complies with the requirements for fit and proper financial services providers or categories of providers, which are determined by the Registrar by notice in the Government Gazette. These requirements are formulated in respect of
personal character qualities of honesty and integrity; the competence and operational ability of the applicant to fulfil the responsibilities imposed by the Act; the applicant's financial soundness.
At this stage, most of the work related to the evaluation, comparison and mapping of qualifications relevant to the assessment of competence of financial services providers is undertaken by the Insurance Seta. Individual professionals employed in the Financial and Accounting Services Sector also have to comply with the legislation.
k) The Financial Intelligence Centre Act The Financial Intelligence Centre Act, No. 38 of 200124 is aimed at curbing money laundering activities in South Africa and requires financial service providers, many of whom are in the Financial and Accounting Services Sector, to establish the identity of their clients, to keep certain records and to provide certain information to the authorities. Knowledge of and compliance with this Act are important for organisations in the sector. l) Educational and skills development legislation and policy Over the past few years, educational and skills development legislation and policy have become major forces in driving and steering skills development in the sector. Most of the qualifications used in the sector have been registered on the NQF, and in many instances the qualifications were re-examined before they were presented for registration. Numerous education and training providers have also applied for accreditation with the relevant ETQAs.
Participation in the levy-grant system has increased dramatically since its inception in 2000/2001. Of the 7 200 organisations that paid levies to Fasset in 2000/2001, approximately 5% submitted workplace skills plans (WSPs). In 2005/2006 the participation rate in the WSP grants had increased to 34%.
m) International legislation and accounting standards The Financial and Accounting Services Sector is not controlled only by South African legislation and financial practices. The legislation and practices that apply in the countries with which South Africa trades, and from which multinational client organisations originate, have become equally important. Financial services
23 National Credit Act, Act 34 of 2005. 24 Financial Intelligence Act, Act 38 of 2001

Fasset Sector Skills Plan 2005 � 2010 Update for the 2007/2008 Financial Year
Draft 21 May 2007 12
organisations that are themselves multinationals are affected by changes in international legislation and practices in several ways: their human resources practices are affected by international practices while their employees must keep abreast of changes in legislation and financial practices in order to retain the international marketability of their firms. Similarly, local financial services organisations that market their services internationally operate within the legislative and policy frameworks of the countries in which their clients are based. These organisations are directly affected by changes in the international environment.
One example of international legislation that affects the Financial and Accounting Services Sector is the United States of America�s Sarbanes-Oxley Act that was enacted in July 2002 largely in response to a number of major corporate and accounting scandals involving some of the most prominent companies in the USA. The Sarbanes-Oxley Act and the events that preceded it have brought the issues of transparency, disclosure and independence to the fore not only in the USA but in many other countries and have contributed to a migration towards a common global platform for corporate reporting.25
Another example of a time-critical change to the accounting profession is the transition from South African Generally Accepted Accounting Practice (GAAP) to International Financial Reporting Standards (IFRS), taking effect from 2005. This change will have an impact on measurement principles and recognition, and the financial results of organisations.
1.9.2 Economic factors
a) Globalisation �Faster methods of transportation, together with instantaneous information, have allowed the world to become one giant marketplace.�26 This observation also applies to the market for financial services. Information and communication technology has made it possible to outsource financial services to any part of the world and to draw financial expertise from a global professional market. For the South African Financial and Accounting Services Sector, the disappearance of international boundaries has brought about intensified international competition in the market for its services and in the labour market. Increased market competition places renewed focus on customer satisfaction, while competition in the labour market can result in the loss of important professional skills.
Globalisation (coupled with technological changes) increases the pace of change in the business world, shortens product life cycles and competitive advantages, and increases the need for better, quicker and more decisive actions by the management of organisations. Globalisation also leads to increasingly complex business transactions, increased uncertainty and the explicit recognition of risk.27 These changes have a profound effect on the nature of services required from firms operating in the financial services field and on the skills required at all levels of staff. Traditional accounting services are, for example, giving way to services related to the interpretation of information and to strategic consultation services.
Globalisation has also brought about new opportunities for market expansion. Call centre operations (such as debt collection) are an example of financial services in which South African firms already render a service to the international market.
b) The exchange rate Expansion into international markets depends on the relative price at which local services can be rendered. This, in turn, makes local firms that are venturing into foreign markets vulnerable to the fluctuations in the exchange rate that have become characteristic of the local currency. Similarly, firms that are largely dependent on exports (e.g. the corporate divisions of mining companies that are registered with Fasset), as well as those involved in the financial markets, are exposed to changes in the exchange rate. c) Unemployment The very high level of unemployment in South Africa is a national concern. Although it is not directly related to change in the Financial and Accounting Services Sector, unemployment threatens social stability in the country and has an indirect impact on business prospects. It is therefore an issue that warrants the ongoing attention of government, business, labour movements and civil society; it also cannot be ignored in the skills planning processes of any of the Setas. In fact, the upgrading of the skills base of the country is one of the key components of the South African government�s strategy to reduce unemployment. Another important
25 Brown, F. & Ooi, E., Implications of Sarbanes-Oxley, http://www.pwcglobal.co/extweb/manisseu 26 Albrecht, S.W. & Sack, R.J. 2000. Accounting Education: Charting the Course through a Perilous Future, American Accounting Association, Accounting Education Series, Vol. 16. 27 Ibid

Fasset Sector Skills Plan 2005 � 2010 Update for the 2007/2008 Financial Year
Draft 21 May 2007 13
-3.0
-2.0
-1.0
0.0
1.0
2.0
3.0
4.0
5.0
6.0
7.0
8.0
1970
1972
1974
1976
1978
1980
1982
1984
1986
1988
1990
1992
1994
1996
1998
2000
2002
2004
Total Economy Financial Services
factor in combating unemployment is the stimulation of labour intensive economic activities such as those agreed upon in the Growth and Development Summit Agreement of June 2003.28
d) Economic growth Since the need for financial services is linked to the level of economic activity in the country, the sector is sensitive to economic changes. However, the Financial Intermediation, Insurance, Real Estate and Business Service sector,29 in which most of the Financial and Accounting Services Sector resides, has been able to sustain an average annual growth rate of 4% over the 35-year period from 1969 to 2005. In the late 1990s, the sector outperformed the rest of the economy by a substantial margin and became a significant contributor to total economic growth (Figure 1.4). This performance of the subsector is the result of an increase in the demand for financial services, which in turn stems from a myriad of factors including growth in the level of sophistication of the economy, growth in the number of SMMEs, the tendency of organisations to outsource non-core functions such as financial services to specialist service providers, and legislative changes that require businesses to use professional financial services. These trends will most probably continue over the next four to five years and will stimulate employment growth in the sector � especially if Governments economic growth targets of 4,5% - 6% over the next couple of years are attained.
Figure 1.2 Economic growth in South Africa and in the Financial Intermediation, Insurance, Real Estate and Business Service Sector: 1970 to 2005
Source: Reserve Bank, data series KBP6006Y and KBP6640Y.
e) Accelerated and Shared Growth Initiative for South Africa (AsgiSA) AsgiSA has been mentioned in the introduction to this SSP update. This initiative consists essentially of a set of projects and other government initiatives that aim to halve poverty and unemployment in South Africa by 2014. Not all of the projects that form part of this initiative have direct relevance to the Financial and
28 The Growth and Development Summit Agreement emanated from the summit held by the constituencies represented in NEDLAC: government, business, labour and the community, on 7 June 2003. 29 This sector description is used in the national accounts data reported by StatsSA and the SARB. The sector includes SIC codes 81100 to 88999. It is much larger than The Financial and Accounting Services Sector and includes various other activities, such as banking, insurance and real estate. Most of the private sector activities included in The Financial and Accounting Services Sector description occur within this broader sector.

Fasset Sector Skills Plan 2005 � 2010 Update for the 2007/2008 Financial Year
Draft 21 May 2007 14
Accounting Services Sector, but, if the growth targets mentioned earlier are attained, the growth of this sector may also be accelerated.
One of the AsgiSA focus areas that has a more direct bearing on the sector, is the preparation of sector strategies aimed at promoting private-sector investment. In this context, two sectors have been identified for special priority attention: business process outsourcing (BPO) (which is relevant to organisations in the sector) and tourism. BPO refers to the trend of business worldwide, especially in countries where labour is costly, to locate back-office activities such as accounts or claims processing or front office activities like call centers in cheaper centers. According to AsgiSA South Africa has attracted about 5 000 of such jobs from the rest of the world so far. The sector has the potential for 100 000 additional direct and indirect jobs by 2009. Government and business have a joint project, supported by the Business Trust, led by the Minister of Trade and Industry and the Chair of Standard Bank to remove obstacles and refine incentives to achieve this goal.30
The BPO strategy may provide organisations in the Financial and Accounting Services Sector, for example debt collecting and accounting firms, with opportunities for business expansion. This will have to be supported by appropriate skills development initiatives.
f) Joint Initiative for Priority Skills Acquisition (JIPSA) AsgiSA mentioned above, uses mainly existing structures and institutions to attain its objectives. The exception is a new institution, the Joint Initiative for Priority Skills Acquisition (JIPSA). This institution is led by a committee of the Deputy President, key ministers, business leaders, trade unionists and education and training providers or experts. Its job is to identify urgent skills needs (especially skills needed for the successful implementation of the AsgiSA projects) and quick and effective solutions to these skills needs. Solutions may include special training programmes, bringing back retirees or South Africans and Africans working out of Africa, and drawing in new immigrants where necessary. It may also include mentoring and overseas placement of trainees to fast-track their development. JIPSA will have an initial timetable of 18 months, starting in March 2006, after which its future will be reviewed.31
It is obvious that JIPSA will co-operate closely with the Setas and that the work of the Setas will have to support JIPSA.
1.9.3 Social factors Recent international and local corporate failures and scandals referred to earlier (e.g. Enron, Leisurenet and Regal) have to some extent eroded the public trust that financial professionals previously enjoyed. At the same time, insistence has grown from the public on professional accountability and a trend has emerged to seek recourse in litigation if professionals fail in their public duty. These changes have increased the risk associated with professional work in public practice and may have contributed to the migration of financial professionals not only out of the Financial and Accounting Services Sector but also out of the financial service professions.32 a) Loss of skilled professionals The internationalisation of the professional labour market was mentioned earlier in this document. Unfortunately, South Africa is not benefiting from this phenomenon. Since 1994, a sharp increase has occurred in the loss of skilled professionals in the Financial and Accounting Services Sector due to emigration. This loss of skilled professionals may offset any growth in labour supply in the highly qualified and scarce skills categories in particular. Official figures published by Statistics South Africa show that the emigration of accountants and related professionals soared to more than 500 a year in 2001 and 2002. In 2003 over 700 financial professionals left the country (Figure 1.3). The unofficial figure could, however, be much higher as many professionals leave the country temporarily or do not declare their permanent emigration. At the end of April 2006, 5 646 chartered accountants registered with SAICA were working abroad33 (approximately 23% of all chartered accountants). At the same time, immigration of these professionals has declined since 1991 and is currently negligible.
30Government of South Africa, Accelerated and Shared Growth Initiative for South Africa, http://www.info.gov.za/asgisa/asgisa.htm 31 Ibid. 32 Members of Fasset�s Skills Planning Working Committee (2004). 33 SAICA�s membership statistics published on http:www.saica.co.za, June 2006.

Fasset Sector Skills Plan 2005 � 2010 Update for the 2007/2008 Financial Year
Draft 21 May 2007 15
Figure 1.3 Immigration and emigration of accountants and related professionals: 1990 to 200334
0
100
200
300
400
500
600
700
800
1990 1991 1992 1993 1994 1995 1996 1997 1998 1999 2000 2001 2002 2003
Immigration Emigration
Source: Statistics South Africa, Tourism and Migration, Data Series PO351.
b) HIV/AIDS South Africa�s MRC (Medical Research Council) 2001 report indicated that nearly five million people in South Africa are living with HIV/AIDS. Without effective intervention, the report estimates that by 2010, 66% of deaths in South Africa will be AIDS-related and that life expectancy will fall to 41 years. Current estimates suggest that 95% of the HIV infections in Sub-Saharan Africa are attributable to unsafe sex. The disease will affect a large percentage of the workforce including decision-makers. The potential for economic growth could be reduced by up to 2% as the disease depletes the labour force, especially when the skilled labour force is affected. The Bureau for Economic Research (BER) indicates that gross domestic product GDP may be 5,7% lower by 2015 as a result of AIDS.
According to population-based surveys in Sub-Saharan Africa, infection levels in women are higher than in men. Studies conducted in nine African countries suggest that for every 10 African men infected, between 12 and 13 African women are infected.
Statistics show that nationally in South Africa, the �high-risk� age groups are 18-40 years of age for females and 22-50 years of age for males. The majority of the workforce in the Financial and Accounting Services Sector is between the ages of 20 and 55 and hence fall into the most vulnerable age group. The prevalence of HIV/AIDS in the sector itself is, however, most probably lower than in other sectors because of the higher educational qualification levels of the workforce. The Human Sciences Research Council (HSRC) study revealed that HIV infection rates are much lower for people with tertiary education (6,5%) than for the total adult population.35
1.9.4 Technological factors The sector is affected in several ways by technological developments, especially by developments in electronic financial systems. Many functions that were previously performed by people are now done by computer software. Thus, in some respects, technology is replacing labour and is slowing down the rate at which labour is absorbed in the economy. The effect of technological changes on organisations in the financial markets was mentioned earlier. Another example is the electronic systems acquired by SARS that enable small businesses to submit tax returns and to pay their taxes electronically. This is causing a decline in the demand for the services of smaller accounting firms and tax service providers in the sector.36 Technological changes also necessitate constant upgrading of the skills of the workforce in the sector. As a result of the highly competitive nature of the sector and increased globalisation, the sector is required to
34 In 2004 Statistics South Africa stopped collecting and publishing emigration figures. Emigration trends can therefore not be traced beyond 2003. 35 Ibid. 36 Ibid. 36 Department of Labour, Fasset Sector Brief, 2002.
Fasset Sector Skills Plan 2005 � 2010 Update for the 2007/2008 Financial Year
Draft 21 May 2007 16
adapt to new technology continuously. For instance, audit firms have to stay abreast of the software used by their clients, and some firms have to keep up with their international partners, which requires constant training and skills improvement.37
In terms of the public sector, the current accounting systems will have difficulty in coping with the move to accrual accounting in government departments. This will necessitate a new integrated accounting system with related skills and training needs for the subsector.38
1.9.5 Environmental factors The King Report on Corporate Governance for South Africa (2002) states that companies should move from single to �triple-bottom-line� reporting,39 which covers the economic, environmental and social aspects of a company�s activities. The King Report (2002) further states, �The environmental aspects include the effect on the environment of the product or services produced by the company�. Thus, it has become increasingly important to disclose environmental impact and its effect on the financial position of a company.
Costing systems can be used to determine the environmental costs while management accounting techniques can be used to assist decision makers in making informed decisions on environmental issues.40 However, this is a new subfield in accounting and economics. The research available on this subfield is still limited, and educational institutions are only now beginning to include environmental accounting in their curricula. Environmental accounting will probably become increasingly important in the future and will gain a more prominent position in education and training in the sector.
1.10 CONCLUSIONS The sector served by Fasset is relatively small and consists mainly of micro- and small organisations, many of which are professional practices. However, almost half of the employees in the sector work in the small number of large and medium size organisations. Fasset is thus left with the challenge of balancing the needs and interests of SMMEs as well as large organisations. The organisations belonging to the sector are concentrated in the metropolitan areas of Gauteng, the Western Cape and KwaZulu-Natal.
The services rendered by organisations in the sector are mainly of a specialised and professional nature; consequently, the sector tends to employ professionals, and technicians and associated professionals. These workers are supported by clerical and administrative workers, who also constitute a substantial proportion of the employees in the sector.
A special feature of the sector is the presence and influence of a number of professional associations whose roles have become ingrained in the sector�s qualification structure, in the organisation of education and training, and in the professional designations used in the sector.
The sector is also a highly regulated environment. Many of the functions performed by the organisations in the sector are regulated by legislation and by government policy. Similarly, most of the skilled workers in the sector are regulated through professional rules. The new legislation passed in the course of the past few years has tended to increase control over the functions of the sector and has thus contributed to the need for greater accountability in and the further professionalisation of the sector.
Most of the factors that influence change in the sector tend to increase the demand for financial services and thus the growth of the sector. The exception is technological changes, which generally have an adverse effect on the demand for labour but at the same time increase the need for technological skills in the workforce. The only component of the sector that has been contracting markedly over the past few years is the stockbroking and financial markets subsector, and this contraction is likely to continue in the foreseeable future.
A particular challenge facing the sector is to increase the participation of blacks in the sector � especially at managerial level and in terms of equity ownership of firms. These changes are prompted by legislation and policy as well as by economic realities such as the need to extend the capacity of the sector beyond the current limited pool of professionals. Another challenge facing the sector is to retain financial skills that are currently being lost rapidly to the international market.
All the changes mentioned in this chapter boil down to an increased need for highly skilled financial professionals as well as the continuous development of the skills of workers who are already active in the labour market. The current profile of workers confirms the need for greater equity in the sector. This implies the need to increase the representation of blacks in all categories and women in managerial positions. The employment of more disabled people also requires attention.
37 Gerrits, E., Partner, PricewaterhouseCoopers, Telephonic interview, January 2004. 38 Cassim, Z., Institute for Public Finance and Auditing, Interview, January 2004. 39 Dekker, C. King Report on Corporate Governance for South Africa, 2002. 40 Van Rensburg, A.M., Management Accounting as an existing decision making tool, 2003.

Fasset Sector Skills Plan 2005 � 2010 Update for the 2007/2008 Financial Year
Draft 21 May 2007 17
2 THE DEMAND FOR SKILLS 2.1 INTRODUCTION This chapter begins with a summary of employment in the sector and the attributes of the current workforce, which was described in some detail in Chapter 1 of this report. These attributes reflect the kinds of skills that are used in the sector, and they give an indication of the racial and gender equity attained in the sector, and thus of the extent to which further transformation is required. This is followed by an assessment of the number of workers that will be needed in the sector over the period 2005 to 2009 and the occupations in which growth is likely to occur. The Financial and Accounting Services Sector does not correspond with any of the sectors used by agencies that produce labour market statistics in South Africa; consequently, little historical information is available on the sector. Although the grant applications received by Fasset are useful sources of information on the labour market in the sector, the levy-grant system is still too new to allow the discernment of any trends. This chapter therefore focuses mainly on expected trends based on the cross-sectional survey information gathered since Fasset�s inception. The quantitative assessment of demand presented in this chapter was derived from an adaptation of a labour demand model that was developed as part of the Fasset Sector Study (2002). The original model did not include SARS and the government departments registered with Fasset. The adapted model includes this component of the sector and uses updated and adjusted economic and emigration figures.
2.2 CURRENT EMPLOYMENT
2.2.6 Current employment composition The services provided by the Financial and Accounting Services Sector are mostly of a professional nature. This is reflected in the occupational composition of the sector, which indicates that 54% of the staff is employed in managerial, professional and semi-professional occupational categories (Figure 2.1). The relatively high percentage of workers in the legislators, senior officials, managers and owner managers category is largely the result of the preponderance of small professional practices in the sector. Many of these people are in fact professionals but are classified in this category because they are the owners of their own firms or practices.
Professionals constitute 15% of the total workforce. The professionals encountered most frequently in the sector are accountants and auditors, financial and management consultants, and investment professionals. Similarly, the technicians and associated professionals category (23%) consists largely of professionals in training such as trainee accountants and auditors. The clerical and administrative worker category is made up predominately of general administrators and clerks, secretaries/personal assistants, bookkeepers, accounting clerks and receptionists41 and constitutes 33% of employment in the sector. Labourers and workers employed in elementary occupations constitute only 6% of the sector�s workforce.
41 Occupations reported by employers in the Fasset Sector Study 2002.

Fasset Sector Skills Plan 2005 � 2010 Update for the 2007/2008 Financial Year
Draft 21 May 2007 18
Professionals15%
Technicians & Associated
Professionals23%
Clerical & Administrative
workers33%
Legislators, Senior officials, Managers &
Owner Managers18%
Service & Sales Workers
5%
Skilled Agricultural & Fishery Workers
0%
Skilled Workers, Craft & Related Trades
1%
Plant & Machine Operators and
Assemblers0%
Labourers & Elementary
Occupations5%
Figure 2.1 Occupational composition of the sector
Source: Calculated from WSPs submitted in 2005/2006
2.2.7 Skills of the current workforce Workers in the Financial and Accounting Services Sector are obliged to update their knowledge and upgrade their skills continuously. The need for the continuous upgrading of specialised financial skills arises from the numerous legislative and regulatory changes that impact on the work of organisations in the sector. These changes were outlined in Chapter 1 and include changes in the tax legislation, corporate governance requirements and accounting practices. The need for computer skills follows on from the ongoing technological advancements in accounting and other software; marketing skills are crucial for business development and expansion. Many of the professional bodies expect their members to undergo continuous professional education in order to maintain their membership and professional status.
2.3 EMPLOYMENT TRENDS AND PATTERNS
2.3.1 Growth in employment The occupational profile of the sector suggests that the sector needs highly skilled workers with post-school qualifications, which is confirmed by the current educational profile which shows that 70% of the workforce has post-school qualifications. The demographic profile depicted in Chapter 1 also illustrates the need for transformation in the sector. Women are underrepresented in the managerial and professional categories, and African workers are largely underrepresented in all four of the main occupational categories: the managerial, professional, technicians and associated professionals and the clerical and administrative categories. The future demand for skills will therefore be strongly influenced by the need to correct these imbalances.
2.3.2 Vacancies Long-term vacancies (i.e. vacancies that employers find difficult to fill) provide an indication of skills shortages and of occupations in which the demand is higher than others. Fasset monitors vacancy rates on an annual basis and has found that over the past three to four years the vacancy rates for professionals and for technicians and associated professionals were higher than that in the other occupational categories. In the Fasset Sector Study (2002), the vacancy rate was 3,2% for professionals, 5,2% for technicians and associated professionals, and 1,8% for clerical and administrative workers. Similar trends were observed in the WSPs submitted between 2001 and 2006.

Fasset Sector Skills Plan 2005 � 2010 Update for the 2007/2008 Financial Year
Draft 21 May 2007 19
In 2005/2006 the professional occupations with the highest numbers of vacancies were accountants and auditors, financial advisors and economists. Accounting and auditing clerks (accountant trainees) showed the highest numbers of vacancies in the technicians and associated professionals category. Programme or project administrators was the occupation with the highest number of vacancies in the category clerical and administrative workers.42
2.3.3 Earning trends The salaries earned by professionals in the financial services field and those earned by clerical and administrative staff also correspond with these trends. In the period 1994 to 2000, the annual income of chartered accountants who worked in the private sector increased by 9,6% a year (in real terms) and that of auditors in the private sector by 8,3% a year. Conversely, administrative officers experienced a real increase of 4,2%, secretaries and personal assistants 3,8%, and administrative assistants and clerks 1,3%. The salaries of financial clerks and bookkeepers increased by 0,8% while receptionists and information clerks experienced a 1,3% drop in income43 .
2.4 FORECASTING OF FUTURE DEMAND This section of the SSP analyses employment trends and patterns that can be expected in the period 2005 to 2009. The first part of this analysis focuses on aggregate demand, and the second part looks at the demand for specific occupations.
2.4.1 Aggregate demand
The demand for labour in the sector is defined as the total number of people expected to be employed in the sector in a specific year. Of particular importance for skills development is the number of positions that need to be filled; in other words, the number of people who have to be recruited into or trained for the sector. Positions that have to be filled are the result of two processes: expansion of the sector because of growth in the demand for its services or growth in the output of the sector (new demand) and attrition of staff through retirement, movement of people into other sectors or out of the labour market, emigration and mortality (replacement demand).44
Four demand scenarios were developed in order to establish the quantitative parameters within which skills development needs should be seen. The scenarios range from conservative to most optimistic and result from the adaptation of the demand model developed as part of the Fasset Sector Study (2002). The input variables for this model are based on employment trends and patterns observed in the sector. These variables are explained below.
a) Base employment
The first variable is the number of positions currently available in the sector, which is taken as the sum of people employed plus reported vacancies. On the basis of the findings of the Fasset Sector Study (2002) and the subsequent adaptations to include SARS and government departments, the total employment in the sector in 2003 is estimated at 106 000. Added to this is the number of vacancies that existed over a prolonged period of time � taken as 3% of total employment.45 Given the number of people who left their places of work during the year preceding the Fasset Sector Study (2002) (those who were retrenched excluded), it seems realistic to add another 1% of short-term vacancies. The total number of positions in the sector is therefore taken as 110 240.
b) Mortality Expected mortality in the sector is based on the age, gender and population group distributions of the workforce. If the survivor ratios projected by the Bureau for Market Research46 in its population projections are applied to these distributions, a mortality rate of 0,6% per annum is obtained. This is lower than the
42 Fasset, Analysis of Grant Submissions Year 2005/2006. 43 Calculated from the HSRC�s Surveys of the Income of Graduates conducted in 1994, 1997 and 2000. These figures apply only to people with university degrees. The surveys have been discontinued and more recent data are not available. 44 In supply and demand models that are designed to establish the skills gap in a sector by comparing supply and demand, the attrition of workers is sometimes calculated on the supply side of the equation. In this model, attrition is used on the demand side to calculate replacement demand. The model is not an attempt to establish the skills gap but rather to indicate the replacement needs and possible growth trends that may translate into the need to train or re-train people for the sector. 45 This is based on the vacancies reported by employers in the Fasset Sector Study as well as on the workplace skills plans submitted for the year 2001/2002. The next sector survey and scenario update will be conducted in the middle of the second National Skills Development Strategy (NSDS) period. 46 Bureau of Market Research, A Projection of the South African Population, 1996 to 2021, University of South Africa, Pretoria, 1999.

Fasset Sector Skills Plan 2005 � 2010 Update for the 2007/2008 Financial Year
Draft 21 May 2007 20
0,9% death rate for the year 2001/2002 reported in the Fasset Sector Study (2002). The mortality rate is consequently taken as the mid-point between these two, namely 0,75%. c) Retirement An estimate of retirement is based on the assumption that workers will retire at the age of 60. The number who would retire was therefore taken as all workers who would reach retirement age in each projection year � approximately 0,8% of the total workforce. This calculation was based on the age distribution of workers as indicated in the Fasset Sector Study (2002). d) Emigration General trends with regard to the emigration of accountants and related professionals were discussed in Chapter 1. In this discussion, it was noted that the emigration of accountants and related professionals soared in the last part of the 1990s and up to 2003.
In the Fasset Sector Study (2002), employers also reported that the sector was losing large numbers of its workers (especially professionals) to emigration. In the year preceding the study, some 500 individuals (0,5% of all employees) left their places of employment to establish themselves elsewhere in the world. For the purpose of developing the four scenarios, it was assumed that emigration would stay at 0,5% a year.
e) People leaving the sector or the labour market People leaving the sector to find employment in other sectors of the economy or who stop working altogether (e.g. to become homemakers) is a major factor in replacement demand. Information on these trends is, however, very limited. In the absence of comprehensive data, a speculative figure of 5% is used. This figure is suggested by the Department of Labour in its Sector Skills Plan Guide issued to all the Setas during the previous sector skills planning period (Date unknown, p. 31.). The figure seems realistic in the light of the Fasset Sector Study�s (2002) finding that in the year 2001/2002, approximately 10% of the workforce resigned or left their places of employment voluntarily. Half of these people may well leave the sector altogether.
Four scenarios were developed. This was done by varying only two variables: the economic growth rates and employment elasticity � in other words, the factors that affect growth in new demand. Attrition from the sector was held constant and was calculated as described above. In this year�s SSP update the economic figures were changed to 4,5% and 6% to bring the model more in line with the economic growth rates seen over the last couple of years. (In the previous version of the SSP the model assumed growth rates of 3% and 4,5%)
The permutations used in the four scenarios are as follows:
Scenario Economic growth of sector Employment elasticity
A 4,5% 0,65
B 4,5% 0,78
C 6% 0,65
D 6% 0,78
The results of the model are shown in Annexure A. Scenario A gives an annual growth rate of 2,9%
in the number of positions to be filled. The growth rates arising from the other three scenarios are 3,5%, 3,9% and 4,7% respectively. The number of new employment opportunities that need to be created over the five-year period 2005 to 2009, and those that need to be replaced because of people leaving the sector, can be seen in Table 2.1.
Table 2.1 Projected employment demand: 2005 to 2009
New positions Positions to be replaced Scenario
Total Annual average Total Annual average
A 20 818 3 470 52 378 8 730 B 25 352 4 225 53 455 8 909 C 28 446 4 741 54 185 9 031 D 34 811 5 802 55 673 9 279

Fasset Sector Skills Plan 2005 � 2010 Update for the 2007/2008 Financial Year
Draft 21 May 2007 21
The projection of new positions that will be created was compared with the growth expectations of organisations that submitted WSPs to Fasset. Of the employers that submitted WSPs in 2004/2005 640 organisations (26,5%) indicated that they expected to employ new people as a result of business expansion. The number of new positions that they expected to create amounted to 5% of total employment of the organisations that submitted WSPs. Thus, the employment scenarios are slightly more conservative than the employer expectations.
All four scenarios are based on the assumption that relatively high positive average economic growth rates will be experienced over the projection period. Lower growth in the output of the sector or a marked decline in the growth of the total economy will obviously change the situation completely and may even lead to a decline in total employment.
The concentration of employment in the few large firms in the sector should also borne in mind (Section 1.3). Sudden changes in the situation of one or more of the large firms may have a dramatic impact on employment in the sector, for example a major merger or the demise of one of the large firms may result in a sudden and unexpected reduction in employment and may suddenly push a large number of qualified people into the job market.
The demand scenarios also assume no constraints on the supply side. Employment creation in this particular sector is highly dependent on the availability of skilled professionals. They are the people who start up small practices and businesses and, by doing so, create employment for others. Even in large organisations, business growth is dependent on the presence of professionals; the employment of clerical and administrative staff follows. Thus, employment growth may be stifled by the absence of professionals.
2.5 THE DEMAND FOR SPECIFIC OCCUPATIONS The growth in employment expected in the sector will not be distributed equally among the main occupational categories. The labour market trends referred to in section 2.1 suggest that the professional and technicians and associated professional categories are growing and will probably continue growing faster than the other occupational categories. The need for professional and technical skills is driven by changes in the financial services environment described in Chapter 1, while the demand for clerical staff is somewhat stifled by technological advancements such as the computerisation of functions. Similarly, replacement demand is to a large extent concentrated in the professional and technicians and associated professional categories as these workers are frequently absorbed into financial and financial management positions in other sectors of the economy.
2.6 CONCLUSIONS Although historical and time series data on Fasset�s sector are not available, analysis of available data seems to sketch a relatively consistent picture of current and expected future trends.
If economic growth in South Africa is sustained at approximately 4% per annum, employment in the sector can be expected to grow by 3 500 to 5 800 positions a year. This growth is driven by the factors discussed in Chapter 1, for example an increase in the demand for financial services emanating from growth in the client base of the sector, especially growth in SMMEs; legislative changes and an increase in the complexity of business activities that compel organisations to use specialised financial services, and the general tendency of organisations to outsource non-core functions.
In addition to the new positions that need to be filled, a total of 8 700 to 9 300 positions will also have to be filled because of people leaving the labour market or the sector. Most of the new positions, as well as the replacement positions, will occur in the two occupational categories: professionals and technicians and associated professionals. The sector will therefore have to attract relatively large numbers of workers with tertiary education qualifications in the specialised fields relevant to the sector and with the professional and technical qualifications conferred by the professional associations involved in the sector. Although the professionals, and technicians and associated professionals categories cover a range of skills, a large part of the sector is specifically dependent on people trained as accountants and auditors and as financial and business specialists.
Growth in the demand for clerical and administrative workers is expected to be slower than that for workers in the professionals and technicians categories. The turnover of workers in this category also seems to be lower than that in the professionals and technicians categories. However, clerical and administrative staff forms a large component of the workforce and their training and development cannot be neglected. Lower level occupations such as machine operators and labourers constitute a very small part of the workforce, and the demand for workers in these categories is unlikely to increase.
All the changes mentioned in this chapter boil down to an increased need for highly skilled financial professionals as well as the continuous development of the skills of workers who are already active in the labour market. The transformational needs of the sector add a special dimension to the demand for skilled financial professionals, namely an increased demand for people from historically disadvantaged groups.

Fasset Sector Skills Plan 2005 � 2010 Update for the 2007/2008 Financial Year
Draft 21 May 2007 22
3 SUPPLY OF SKILLS 3.1 INTRODUCTION The supply of skills to the sector is analysed from different perspectives. First of all, the focus falls on the availability of people with skills in the study fields relevant to the sector and the unemployment in the sector. High unemployment rates are an indication of an oversupply of skills, while very low unemployment rates may indicate the inability of the educational sector to meet increased labour market needs.
The second part of this chapter deals with the formation of new skills for the sector � more specifically, the role of the higher education institutions and professional associations and learnerships in this regard.
The last part of the chapter deals with skills development in the workplace.
3.2 CURRENT EMPLOYMENT The educational profile of the current workforce corresponds with the occupational composition of the sector. As can be seen from Figure 3.1, more than 70% of the workers in the sector have a post-matric qualification and almost 20% have postgraduate qualifications. This means that tertiary education and training are of critical importance to the development of skills for this sector. Workers at ABET Level 3 and lower (i.e. those who may benefit from ABET programmes) are few in number (approximately 2,7% of total employment) and are thinly dispersed among organisations in the sector.
Figure 3.1 Highest educational qualifications of workers in the sector47
0
2000
4000
6000
8000
10000
12000
14000
16000
18000
Grade
9/ABET 4
and lower
Grade 10 &
11
Grade 12 Grade 12 &
diploma/
certificate
First
degree/
Higher
diploma
Honours/
Masters'
degree
Doctoral
degree
3%
7%
18%
31%
22%
18%
0.4%
Source: Fasset Sector Study (2002).
3.3 AVAILABILITY OF FINANCIAL SKILLS IN THE ECONOMY The LFSs conducted by StatsSA provide information on the qualification levels and economic status of the South African workforce. According to the September 2005 survey, there are approximately two million economically active48 people in South Africa with post-matric qualifications. Of these, 461 000 (22%) have qualifications in the field of business, commerce and management studies. More than half (57%) of the people qualified in this field of study have post-matric diplomas or certificates; 22% have degrees and 21% have postgraduate diplomas or degrees.
47 Excludes the educational qualifications of workers in SARS and government departments. This information was not available. 48 The expanded definition of unemployment was used to determine the economically active population. This means that work seekers who had not actively looked for employment shortly before the survey, but who were available for work (generally known as discouraged work seekers), were regarded as economically active. In the strict or official definition of unemployment, these workers would have been regarded as not economically active.

Fasset Sector Skills Plan 2005 � 2010 Update for the 2007/2008 Financial Year
Draft 21 May 2007 23
Of the 461 000 potential workers in this field, 57 000 (12%) were unemployed at the time of the survey. The unemployment rate differs markedly for people at different qualification levels. For those with only a post-matric diploma or certificate, the unemployment rate was 19%. However, the unemployment rate dropped to 1% for those with a degree or a postgraduate qualification (Table 3.1).
Table 3.1 shows that the circumstances of African graduates differ markedly from those of members of the other three population groups. At all qualification levels, their unemployment rates are much higher. At the level of post-matric diplomas and certificates, the unemployment rate for African diplomates is as high as 31% compared to the overall unemployment rate in this educational category of 19%. African graduates with a first degree have an unemployment rate of 9% compared to a 1% unemployment rate among white graduates with this level of qualification. This improves slightly at the postgraduate level where the unemployment rate for Africans is 5%.
Table 3.1 The economically active workforce with post-Grade 12 qualifications in business, commerce and management studies
Employed Unemployed Highest qualification
Population group N % N %
Total
African 106 325 69 47 066 31 153 391 Coloured 17 469 96 746 4 18 215 Indian 10 982 94 655 6 11 637 White 76 920 97 1 987 3 78 907 Unknown 588 100 0 0 588
Diploma/Certificate with Grade 12/Std 10
Total 212 284 81 50 453 19 262 737
African 33 447 91 3 426 9 36 873 Coloured 6 231 100 0 0 6 231 Indian 8 180 86 1 288 14 9 468 White 47 901 99 436 1 48 337 Unknown 1 692 100 0 0 1 692
Degree
Total 97 451 95 5 149 5 102 600
African 23 130 95 1 119 5 24 249 Coloured49 2 516 100 0 0 2 516 Indian 7 185 100 0 0 7 185 White 61 913 100 0 0 61 913 Unknown 94 743 99 1 119 1 95 862
Postgraduate degree or diploma
Total 23 130 95 1 119 5 24 249
Source: Calculated from the September 2005 Labour Force Survey.
These figures show that there is spare capacity of people who are already educated to some level and who could be available for work in the Financial and Accounting Services sector. Unfortunately, a macro-analysis such as this one does not reveal much detail about the exact skills available among the unemployed. What this analysis does reveal is that most of the unemployed are young (64% are younger than 30), most of them have never worked before and many are living in areas where organisations belonging to the Fasset sector are thinly spread, for example 10% are living in Limpopo, 14% in the Eastern Cape and 9% in North West.
Information on the total number of university and technikon50 graduates in South Africa with qualifications in the financial field, and more specifically in accounting, was obtained from the NLRD, which is maintained by SAQA. These figures have been analysed up until 2001. At the time of preparing this update of the SSP SAQA was in a process of updating their analysis to 2004. However, the data were not yet
49 The LFS provides the best and most recent labour market data. However, due to the size of the sample, large variances can occur if data are analysed at a very detailed level. This is the reason for the absence of coloureds with a postgraduate degree or diploma. 50 The restructuring of the higher education system that is currently taking place is hereby acknowledged. Technikons are no longer so called but are known as universities of technology. Various institutions are in the process of merging and have new names. However, the historical data used in this analysis are still structured according to the old institutional divisions. The new qualification structures that will emerge from the current transformation process are also unclear at this stage. Therefore this SSP still refers to universities and technikons and to the qualifications that are currently in use.
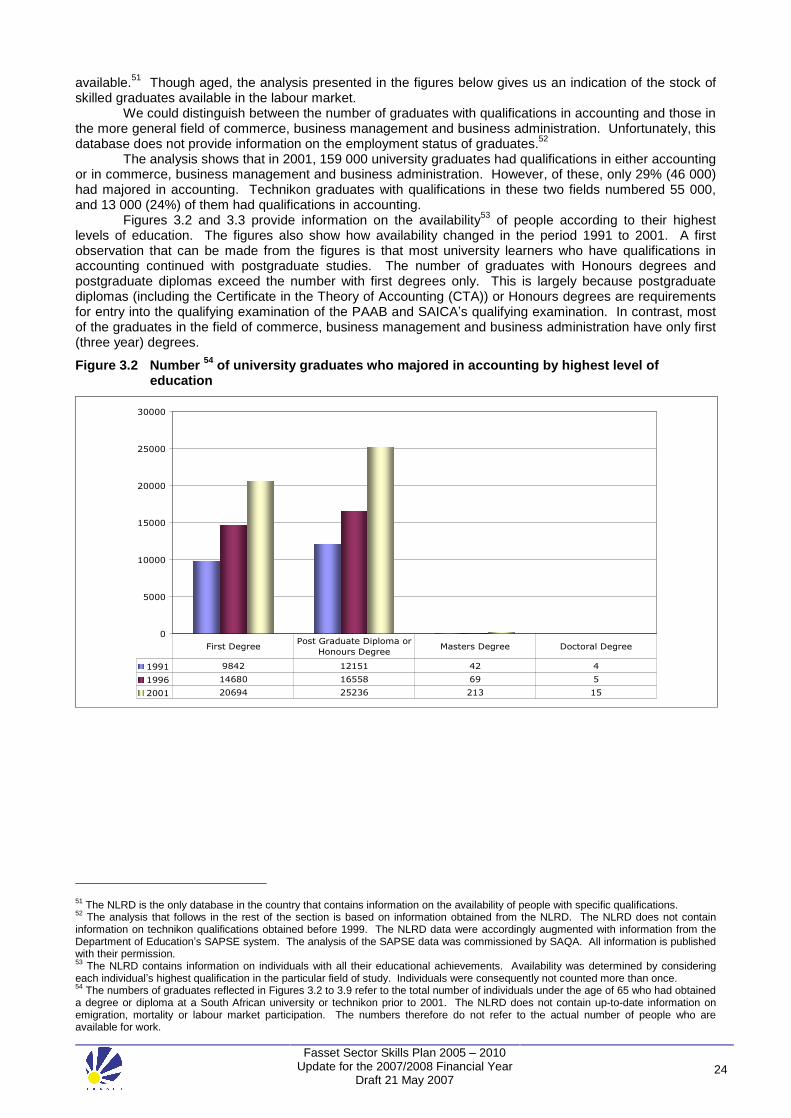
Fasset Sector Skills Plan 2005 � 2010 Update for the 2007/2008 Financial Year
Draft 21 May 2007 24
available.51 Though aged, the analysis presented in the figures below gives us an indication of the stock of skilled graduates available in the labour market.
We could distinguish between the number of graduates with qualifications in accounting and those in the more general field of commerce, business management and business administration. Unfortunately, this database does not provide information on the employment status of graduates.52
The analysis shows that in 2001, 159 000 university graduates had qualifications in either accounting or in commerce, business management and business administration. However, of these, only 29% (46 000) had majored in accounting. Technikon graduates with qualifications in these two fields numbered 55 000, and 13 000 (24%) of them had qualifications in accounting.
Figures 3.2 and 3.3 provide information on the availability53 of people according to their highest levels of education. The figures also show how availability changed in the period 1991 to 2001. A first observation that can be made from the figures is that most university learners who have qualifications in accounting continued with postgraduate studies. The number of graduates with Honours degrees and postgraduate diplomas exceed the number with first degrees only. This is largely because postgraduate diplomas (including the Certificate in the Theory of Accounting (CTA)) or Honours degrees are requirements for entry into the qualifying examination of the PAAB and SAICA�s qualifying examination. In contrast, most of the graduates in the field of commerce, business management and business administration have only first (three year) degrees.
Figure 3.2 Number 54 of university graduates who majored in accounting by highest level of education
0
5000
10000
15000
20000
25000
30000
1991 9842 12151 42 4
1996 14680 16558 69 5
2001 20694 25236 213 15
First DegreePost Graduate Diploma or
Honours DegreeMasters Degree Doctoral Degree
51 The NLRD is the only database in the country that contains information on the availability of people with specific qualifications. 52 The analysis that follows in the rest of the section is based on information obtained from the NLRD. The NLRD does not contain information on technikon qualifications obtained before 1999. The NLRD data were accordingly augmented with information from the Department of Education�s SAPSE system. The analysis of the SAPSE data was commissioned by SAQA. All information is published with their permission. 53 The NLRD contains information on individuals with all their educational achievements. Availability was determined by considering each individual�s highest qualification in the particular field of study. Individuals were consequently not counted more than once. 54 The numbers of graduates reflected in Figures 3.2 to 3.9 refer to the total number of individuals under the age of 65 who had obtained a degree or diploma at a South African university or technikon prior to 2001. The NLRD does not contain up-to-date information on emigration, mortality or labour market participation. The numbers therefore do not refer to the actual number of people who are available for work.

Fasset Sector Skills Plan 2005 � 2010 Update for the 2007/2008 Financial Year
Draft 21 May 2007 25
Figure 3.3 Number of university graduates in commerce, business management and business administration by highest level of education
0
10000
20000
30000
40000
50000
60000
70000
80000
1991 34558 10016 7951 614
1996 50207 16167 11341 745
2001 69939 25164 16793 844
First DegreePost Graduate Diploma or
Honours DegreeMasters Degree Doctoral Degree
Figures 3.4 and 3.5 illustrate the total growth in the number of graduates in accounting and in commerce, business management and business administration. In the accounting field, the number of graduates increased by 42% over the period 1991 to 1996 and by 47% from 1996 to 2001. The growth in graduates in commerce, business management and business administration was 48% between 1991 and 1996 and 44% between 1996 and 2001.
The figures also show the pace at which the population group distribution of graduates has been changing. In 1991, 89% of all graduates who majored in accounting were white and only 2% were African, 1% were coloured and 6% were Indian. By 2001, African graduates had increased their share to 9%, coloureds to 3% and Indians to 10%. The pace of change in this field is thus relatively slow. In the more general field of commerce, business management and business administration, change has been somewhat faster with African graduates increasing from 4% of graduates in 1991 to 13% in 2001.
Figure 3.4 University graduates in accounting by population group
Accounting 1991 1996 2001
African, 490, 2%
Coloured, 250, 1%
White, 19 570,
89%
Unknown, 497, 2%
Indian, 1 232,
6%
Coloured, 508, 2%
White, 26 535,
85%
Unknown, 759, 2%
Indian, 2 120,
7%
African, 1 390, 4%
White, 35 331,
76%
Coloured, 1 235,
3%
Indian,
4 487,
10%
African, 4 176, 9%
Unknown, 930, 2%
N 22 039 31 312 46 158 Growth 42 % 47 %

Fasset Sector Skills Plan 2005 � 2010 Update for the 2007/2008 Financial Year
Draft 21 May 2007 26
Figure 3.5 University graduates in commerce, business management and business administration by population group (excluding accounting)
1991 1996 2001
Coloured, 755, 1%
White, 45 328,
86%
African, 2 085, 4%
Unknown, 2 729,
5%
Indian, 2 248, 4%
White, 62 839,
80%
African, 5 598, 7%
Coloured, 1 642,
2%
Indian, 3 988,
5%
Unknown, 4 399,
6%
White, 81 876,
73%
Indian,
7 701,
7%
Coloured,
3 339,
3%
African, 14 960,
13%
Unknown, 4 868,
4%
N 53 139 78 460 112 740
Growth 48 % 44 % The majority of technikon graduates in both accounting and in commerce, business management and business administration have only a national diploma (Figures 3.5 and 3.6).
Figure 3.6 Number of technikon graduates in accounting by highest level of education
0
2000
4000
6000
8000
10000
12000
14000
1991 1669 213 12 2
1996 5268 758 15 2
2001 11451 1437 20 3
National DiplomasHigher Diplomas/ B Tech
Degrees
Masters Diplomas/
Degrees
Doctoral
Degrees/Laureatus
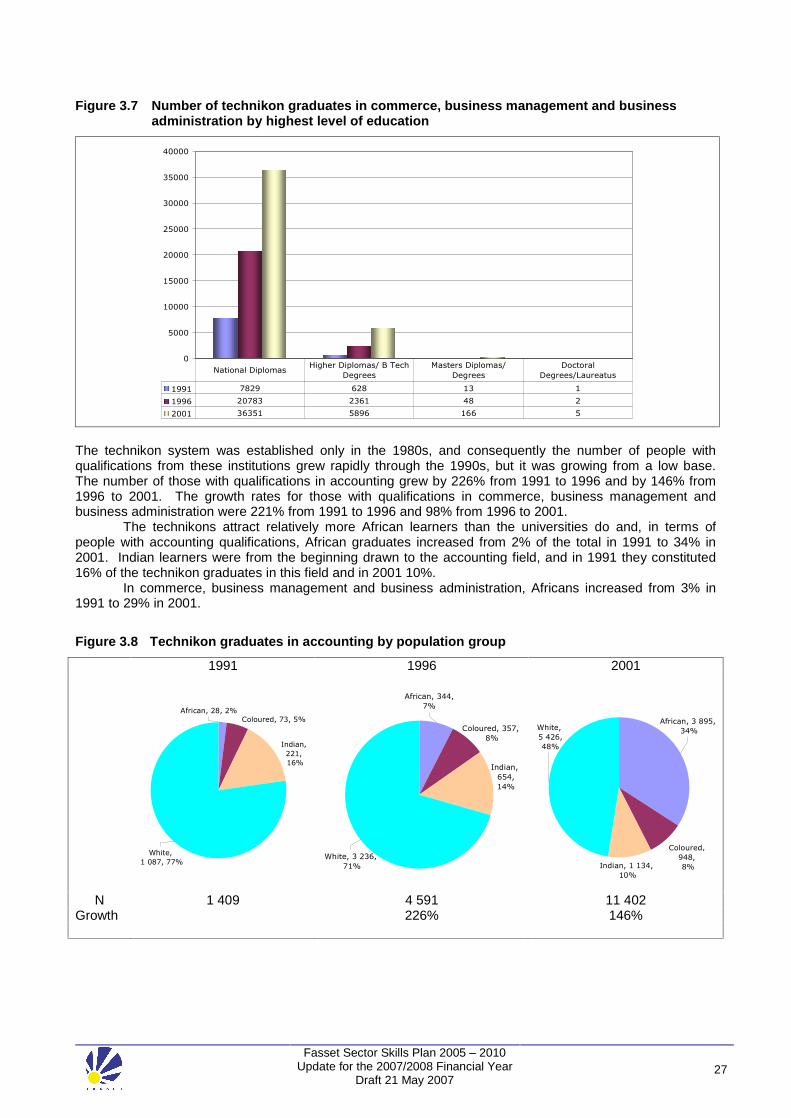
Fasset Sector Skills Plan 2005 � 2010 Update for the 2007/2008 Financial Year
Draft 21 May 2007 27
Figure 3.7 Number of technikon graduates in commerce, business management and business administration by highest level of education
0
5000
10000
15000
20000
25000
30000
35000
40000
1991 7829 628 13 1
1996 20783 2361 48 2
2001 36351 5896 166 5
National DiplomasHigher Diplomas/ B Tech
Degrees
Masters Diplomas/
Degrees
Doctoral
Degrees/Laureatus
The technikon system was established only in the 1980s, and consequently the number of people with qualifications from these institutions grew rapidly through the 1990s, but it was growing from a low base. The number of those with qualifications in accounting grew by 226% from 1991 to 1996 and by 146% from 1996 to 2001. The growth rates for those with qualifications in commerce, business management and business administration were 221% from 1991 to 1996 and 98% from 1996 to 2001.
The technikons attract relatively more African learners than the universities do and, in terms of people with accounting qualifications, African graduates increased from 2% of the total in 1991 to 34% in 2001. Indian learners were from the beginning drawn to the accounting field, and in 1991 they constituted 16% of the technikon graduates in this field and in 2001 10%.
In commerce, business management and business administration, Africans increased from 3% in 1991 to 29% in 2001.
Figure 3.8 Technikon graduates in accounting by population group
1991 1996 2001
Indian,
221,
16%
White,
1 087, 77%
African, 28, 2%
Coloured, 73, 5%
African, 344,
7%
Coloured, 357,
8%
White, 3 236,
71%
Indian,
654,
14%
White,
5 426,
48%
African, 3 895,
34%
Indian, 1 134,
10%
Coloured,
948,
8%
N 1 409 4 591 11 402
Growth 226% 146%

Fasset Sector Skills Plan 2005 � 2010 Update for the 2007/2008 Financial Year
Draft 21 May 2007 28
Figure 3.9 Technikon graduates in commerce, business management and business administration by population group
1991 1996 2001
African, 206, 3%
Coloured, 365, 6%
Indian, 311,
5%
White,
5 183, 86%
African, 1866, 10%
Coloured,
1 101, 6%
Indian,
864,
4%
White,
15 617, 80%
African, 11 170,
29%
Indian, 1 664, 4%
Coloured,
2 341,
6%
White, 23 301,
61%
N 6 064 19 448 38 476
Growth 221 % 98% Although the sector served by Fasset is one of the largest users of financial skills in the country, it shares the stock of skills with all other sectors. It is therefore difficult to establish whether the number of people available is sufficient for the needs of the sector. Unemployment figures show spare capacity in the labour market. However, the figures presented above reveal that in the specialised field of accounting, which is a key study field for this sector, the stock of skills is limited. Growth in African graduates has been relatively slow, and the backlog in terms of racial equity is likely to hamper progress in terms of the targets set by the various charters and in terms of individual organisations� employment equity plans.
3.4 THE FORMATION OF NEW SKILLS FOR THE SECTOR This section describes the various routes through which learners can enter the sector and the providers of education and training including a detailed description of the professional bodies that are active in the sector.
3.4.1 Entry routes into the sector
The formation of new skills for the sector takes many forms, and several routes are available to those who want to work permanently in the sector. The routes that can be followed are as follows: a) Direct entry from school into the labour market A relatively small proportion of the workers in the sector enter the labour market after school without any further education or training. The educational profile of the sector shows that very few workers have qualifications lower than Grade 12 or matric. These workers are employed mainly in elementary occupations. Workers with Grade 12 are employed largely in clerical or administrative positions. b) Entry after school via learnerships Various learnerships in the sector have Grade 12 or matric as an entry-level requirement. These learnerships prepare workers for clerical and administrative positions or as technicians and associated professionals. c) Entry via the higher education system with national qualifications Many workers enter the sector after completion of a degree or diploma at a public or private higher education institution. The qualifications gained along this route are the standard higher education qualifications (typically diplomas and degrees). d) Entry via the higher education system with professional qualifications Several of the professional associations offer professional qualifications, some of which are internationally recognised. Preparatory education for the qualifying examinations is offered by some of the public as well as

Fasset Sector Skills Plan 2005 � 2010 Update for the 2007/2008 Financial Year
Draft 21 May 2007 29
private higher education institutions while the qualifying examinations are generally set by the professional bodies. e) Entry via the higher education system with national qualifications, followed by a learnership and a professional qualification Some of the higher level professional qualifications can be obtained only after acquiring a national qualification or qualifications (e.g. a B.Com. (Honours) degree), after the completion of a learnership and after passing a qualifying examination set by the professional body. This route is the one followed by specialised professionals such as chartered accountants.
3.4.2 Providers of education and training55
The main groups of providers of education and training at entry level are the formal school system, universities, technikons, private FET and HET institutions, professional bodies and employers. The role that each of these groups plays, and the most important qualifications offered by them, are discussed below.
a) Schools The number and academic ability of new entrants into the labour market and into the higher education system are determined by the Senior Certificate examination results. Of particular importance to this sector are the pass rates in mathematics as this subject is a prerequisite for most of the study fields relevant to the sector. In 2004, a total of 471 080 learners sat the Senior Certificate examination. Of these, 71% passed the examination � 18% with matriculation exemption and 53% without exemption (Figure 3.10)
Figure 3.10 Senior Certificate passes: 2004
Passed w ithout
exemption53%
Failed29%
Passed w ith
exemption18%
Source: Department of Education, Statement on the 2004 Senior Certificate Examination Report, December 2004.
Of all the candidates who wrote the examination, 267 461 wrote mathematics with 50% passing the subject. Only 9% of all the learners passed mathematics at the higher grade and a further 41% passed the subject at the standard grade. This situation did not change in 2005, when approximately 500 000 learners wrote matric. Of those only 26 000 (5.2%)56 passed mathematics on higher grade. The low number of mathematics passes severely limits the pool of candidates for study in accounting and related fields (Figure 3.11).
Although accounting at school level is not necessarily a requirement for entry into the accounting field, the Senior Certificate passes in accounting give an indication of learners� interest in the subject and of the general achievement in a field that requires a high level of numeracy. The number of learners who wrote accounting was much lower than the number who wrote mathematics, but pass rates in this subject were higher. In 2004, a total of 140 919 learners (30% of all the learners who sat the Senior Certificate examination) wrote accounting; 19% passed at the higher grade and 69% at the standard grade (Figure 3.12).
55 The educational statistics provided in this section pertains mainly to the matric results of 2004. At the time of preparing this SSP update the Department of Education has not yet published detailed information on the 2005 matric results. 56
Lawless, A. 2005. Numbers and Needs. Addressing the imbalance in the civil engineering profession. SACI: Halfway House.

Fasset Sector Skills Plan 2005 � 2010 Update for the 2007/2008 Financial Year
Draft 21 May 2007 30
Figure 3.11 Senior Certificate passes in mathematics: 2004
Figure 3.12 Senior Certificate passes in accounting: 2004
Passed standard
grade41%
Passed higher grade9%
Failed50%
Passed higher grade19%
Passed standard
grade69%
Failed12%
Source: Department of Education, Statement on the 2004 Senior Certificate Examination Report, December 2004
Source: Department of Education, Statement on the 2004 Senior Certificate Examination Report, December 2004
The flow of learners through the higher education system and the entry of matriculants into the labour market are also affected by the English language proficiency developed at school level. A general problem experienced by higher education institutions is that non-English speaking learners do not have the language skills needed to master the academic content. Similarly, many employers state that learners do not have the language skills required in the labour market. 57
The flow of learners through the higher education system and the entry of matriculants into the labour market are also affected by the English language proficiency attained at school level. A general problem experienced by higher education institutions is that non-English speaking learners do not have the language skills needed to master the academic content. Similarly, many employers state that learners do not have the language skills required in the labour market. 58
b) Public FET and HET Institutions Universities All the universities, except Medunsa, provide training in the broad area of business, commerce and management sciences. The fields of study most relevant to the sector are accounting, cost and management accounting, financial accounting, business and financial management, auditing, financial information systems and taxation. Business schools based at some of the universities offer postgraduate programmes in business administration.
Figure 3.13 shows the qualifications awarded by universities in business, commerce and management sciences according to qualification level from 1999 to 2004. The number of graduates in this field increased on average by 11% a year. The increase in postgraduate diplomas and Honours degrees was much higher than that in first degrees, which indicates that people tend to stay longer in the HET system and that the number of people with postgraduate qualifications is increasing.
57 Human Sciences Research Council, Skills Development in the Financial and Accounting Sector, Fasset, Johannesburg, October 2002. 58 Human Sciences Research Council, Skills Development in the Financial and Accounting Sector, Fasset, Johannesburg, October 2002.

Fasset Sector Skills Plan 2005 � 2010 Update for the 2007/2008 Financial Year
Draft 21 May 2007 31
0
2 000
4 000
6 000
8 000
10 000
12 000
14 000
16 000
18 000
First degrees 5 783 6 589 7 106 8 359 8 649 9 560
Postgraduatediplomas/Honours degrees
2 878 4 173 4 392 5 214 5 322 5 465
Master�s degrees 1 159 1 215 1 333 1 592 1 538 1 660
Doctoral degrees 12 25 23 42 63 63
Total 9 831 12 001 12 853 15 207 15 572 16 748
1999 2000 2001 2002 2003 2004
Figure 3.13 Qualifications awarded by universities in business, commerce and management sciences according to qualification level: 1999-2004
Source: Calculated from DoE, HEMIS Table 2.13, 1999 to 2004. Table 3.2 shows the specific fields of study and the increase in the number of qualifications awarded in each field by universities. The number of accounting graduates was higher than the number of graduates in other fields, and the average annual growth rate in this field of study over the five-year period was 12%. Table 3.2 Qualifications awarded by universities in business, commerce and management sciences according to field of study: 1999-2004
Field of study 1999 2000 2001 2002 2003 2004
Average annual growth
rate (%)*
Accounting 5 164 6 748 6 321 7 905 8 123 8 301 10 Administrative and Office Services 38 9 12 0 4 1 -52 Banking and Finance 271 414 482 461 614 849 26 Business Data Systems 164 173 323 204 182 75 -14 Entrepreneurship 1 175 1 101 966 684 881 925 -5 Information Communications 319 449 478 521 523 284 -2 Insurance and Risk Management 44 74 88 108 105 51 3 International Business 0 2 4 45 50 63 Management 977 1 098 1 916 3 252 3 338 3 856 32 Marketing 201 262 364 412 427 667 27 Personnel Management & Administration 188 295 395 345 296 359 14 Quantitative Methods 46 49 105 50 51 36 -5 Real Estate 5 2 4 0 0 7 7 Other Business, Commerce and Management Sciences 1 240 1 324 1 395 1 220 977 1274 1 Total 9 832 12 000 12 853 15 207 15 571 16 748 11 *Unweighted average. Source: Calculated from DoE, HEMIS Table 2.13, 1999 to 2004.

Fasset Sector Skills Plan 2005 � 2010 Update for the 2007/2008 Financial Year
Draft 21 May 2007 32
0
1000
2000
3000
4000
5000
6000
7000
8000
9000
National certificates andhigher certificates
98 193 347 292 339 495
National diplomas 5 910 5 862 7 718 7 823 7 846 8 210
National higher diplomas 77 39 52 29 6 37
BTech degrees 1 085 1 205 1 629 1 786 1 875 2 184
Master's degrees anddiplomas
20 41 42 71 64 67
Doctoral degrees 0 1 5 5 3 5
1999 2000 2001 2002 2003 2004
Apart from Unisa, the largest output was from the Universities of Pretoria and the Witwatersrand, the Rand Afrikaans University (RAU) (now part of the University of Johannesburg) and the University of KwaZulu-Natal. Most Master�s level learners were from universities with business schools attached to them, namely Unisa and the Universities of Stellenbosch, Cape Town, the Witwatersrand and Potchefstroom (now the University of North West). Technikons All the technikons offer training in accounting and in commerce, business management and business administration. The specific specialisations offered at technikons are cost and management accounting, financial accounting, internal auditing, financial information systems and financial management. Some of the technikons also offer training towards the Chartered Institute for Secretaries (CIS) qualification.59
From 1999 to 2004, technikons experienced an average annual growth rate of 9% in business, commerce and management sciences graduates (Figure 3.15). Most of the qualifications awarded were at the national diplomas and BTech degrees. Figure 3.14 Qualifications awarded by technikons in business, commerce and management sciences according to qualification level: 1999-2004 Source: Calculated from DoE, HEMIS Table 2.13, 1999 to 2004.
Table 3.3 details the qualifications awarded by technikons in business, commerce and management according to field of study. Similar to universities, more qualifications were awarded in accounting than in any of the other fields of study. The annual growth rate for accounting was 15%.
59 The CIS qualification is the professional qualification offered by ICSA for company secretaries.

Fasset Sector Skills Plan 2005 � 2010 Update for the 2007/2008 Financial Year
Draft 21 May 2007 33
Table 3.3 Qualifications awarded by technikons in business, commerce and management sciences according to field of study: 1999-2004
Field of study 1999 2000 2001 2002 2003 2004
Average annual growth
rate (%)*
Accounting 1 846 1 922 3 407 3 381 3 647 3 756 15
Administrative and Office Services 493 560 617 870 822 1 402 23 Banking and Finance 54 116 43 49 47 75 7
Business Data Systems 127 45 50 16 18 0 -100
Entrepreneurship 90 69 221 163 197 97 2
Information Communications 76 136 155 215 143 71 -1 Insurance and Risk Management 0 0 0 0 0 0
International Business 24 0 0 0 0 0 -100
Management 1 752 1 888 2 804 2 684 2 880 3 265 13
Marketing 678 683 731 878 791 928 6 Personnel Management and Administration 868 941 953 1 024 895 841 -1
Quantitative Methods 81 47 24 55 29 53 -8
Real Estate 44 48 34 36 15 36 -4
Other Business, Commerce and Management Sciences 1 057 887 779 637 652 475 -15 Total 7 190 7 342 9 818 10 008 10 136 10 999 9 *Unweighted average. Source: Calculated from DoE, HEMIS Table 2.13, 1999 to 2004. Projection of new entrants from the public HET sector Figure 3.16 shows the number of new graduates who qualified between 1999 and 2004, and the number that will qualify per annum if the average annual growth rate is sustained. The HET sector could produce as many as 132 700 new graduates in the five-year period 2005 to 2009. This projection however depends on a number of factors, these include; the capacity of the HET sector to sustain this level of growth and the DoE�s subsidisation of the HET sector. Figure 3.15 Actual and projected entry-level qualifications in business, commerce and management sciences from the public HET sector
0
2,000
4,000
6,000
8,000
10,000
12,000
14,000
16,000
18,000
20,000
Bachelor's degrees 5,783 6,589 7,106 8,359 8,649 9560 10,571 11,689 12,926 14,293 15,805 17,477
National diplomas 5,910 5,862 7,718 7,823 7,846 8210 8,785 9,400 10,058 10,762 11,515 12,321
BTech degrees 1,085 1,205 1,629 1,786 1,875 2184 2,512 2,888 3,322 3,820 4,393 5,052
1999 2000 2001 2002 2003 2004 *2005 *2006 *2007 *2008 *2009 *2010
*Figures projected, using the average annual growth rate observed for the period 1999 to 2004 Sources: Calculated from DoE, HEMIS Table 2.13, 1999 to 2004 and own projections from 2005 to 2010.

Fasset Sector Skills Plan 2005 � 2010 Update for the 2007/2008 Financial Year
Draft 21 May 2007 34
c) Private FET and HET institutions
On 9 September 2002, 111 private higher education and training institutions were registered with the Department of Education. These institutions offer mainly certificates and diplomas that fall within Levels 5 and 6 on the NQF. Twenty of the currently registered private institutions provide training relevant to the Financial and Accounting Services sector. 60
Private further education and training institutions are now in a process of registering with the Department of Education; consequently, a similar register of FET institutions is not yet available. However, many private FET institutions offer qualifications that are awarded by the professional bodies and are therefore accredited by these organisations.
d) Professional bodies
The roles that professional bodies play in the provision of education and training to the sector differ from organisation to organisation. The most common functions performed by these bodies are the setting of educational standards, the development of curricula for the qualifications they award, the provision of training, the accreditation of training institutions that wish to offer their courses and qualifications, the setting of examinations, the administration of examinations and the awarding of qualifications. The specific functions that each of the professional bodies associated with Fasset fulfil are summarised in Table 3.4. The table shows that most of the professional bodies are involved in the quality assurance, examination and certification processes and that only a few actually offer training themselves.
Table 3.4 Roles of professional bodies in education and training
Role in education and training
Professional Body
Set
tin
g o
f S
tan
dar
ds
Dev
elo
pm
ent
of
Cu
rric
ula
Pro
visi
on
of
Tra
inin
g
Acc
red
itat
ion
of
Tra
inin
g a
nd
/or
wo
rkp
lace
p
rovi
der
s
Set
tin
g o
f E
xam
inat
ion
s*
Ad
min
istr
atio
n o
f E
xam
inat
ion
s*
Aw
ard
ing
of
Qu
alif
icat
ion
s
ACCA √ √ √ √ √ √
ADRA
CIMA √ √ √ √ √ √
FPI √ √ √
GAP √ √ √ √ √ √
IAC √ √ √ √ √
ICB √ √ √ √ √ √
ICSA √ √ √ √ √ √
IIA SA √ √ √ √
IMCSA √
IPFA √ √ √ √ √ √ √
SAICA √ √ √ √ √ √
SAIFM √ √ √ √ √ √
SAIGA √ √ √ √ √
SAIPA √ √ √ √ √ √
*Including the assessment of practical experience Source: Fasset, The Need for Strategic Learnerships in Finance, Accounting, Management Consulting and Other Financial Services, 2003.
60 Fasset Sector Study.

Fasset Sector Skills Plan 2005 � 2010 Update for the 2007/2008 Financial Year
Draft 21 May 2007 35
The qualifications offered by the professional bodies are summarised in Table 3.5. The table also indicates how the qualifications link up with the professional designations used in the sector, the NQF levels at which each qualification has been registered, and whether a learnership has been registered that leads to the qualification.
Table 3.5 Professional qualifications available to the sector
Professional body Qualification Link with designation
NQF level Learnership
ACCA ACCA ACCA � Designation is registered as qualification
7 Yes
ACCA Certified Accounting Technician (CAT)
None 5 Yes
SAIPA Commercial and Financial Accounting: Public Practice
CPA(SA) � Full membership 7 Yes
SAIPA Commercial and Financial Accounting: Commerce and Industry Specialism
CPA(SA) � Full membership 7 Yes
CIMA Chartered Management Accountant ACMA � Associate membership
7 Yes
CIMA Diploma in Management Accounting None 6 Yes
CIMA Certificate in Business Accounting None 5 Yes
GAP Accounting Technician None 5 Yes
IAC Certificate in Office Administration * None 5 No
ICB Registered Accounting Clerk None 3 No
ICB National Diploma : Technical Financial Accountant
Fellow Member (FICB) 5 Yes
ICB National Certificate Small Business Financial Management
Certificate Member (CICB) 4 No
IPFA National Diploma in Public Sector Accounting
Registered Public Sector Financial Officer and other specialist designations
4 Yes
IPFA National Diploma in Public Sector Accounting
Registered Public Sector Financial Officer and other specialist designations
5 No
SAICA Chartered Accountant: Audit Specialism
Member of SAICA 7 Yes
SAICA Chartered Accountant: Financial Management Specialisation
Member of SAICA 7 Yes
* This project is on hold. Source: Information provided by Fasset�s Learnership Division, September 2005.
e) Employers Employers play a crucial role in the formation of entry-level skills in the sector. As indicated above, most of the professional qualifications are attained through learnerships, and most of those that are not currently linked to learnerships require a certain amount of workplace experience. Employers� roles are therefore to provide the workplace exposure and mentorship needed by new entrants to the sector.
By June 2006, 22 learnerships had been registered by Fasset with the Department of Labour. In the 2005/2006 financial year 4308 new learnership contracts were registered with Fasset, while 2502 learners successfully completed their learnerships. Most of these learners were on the learnership for Chartered Accountants: Audit Specialism. Just under half (48%) of all the learners were women, and 40% were previously disadvantaged individuals.61 The learnerships and the number of learners who were registered and who qualified in each are listed in Table 3.6.
61 Information provided by Fasset�s Learnership Division.

Fasset Sector Skills Plan 2005 � 2010 Update for the 2007/2008 Financial Year
Draft 21 May 2007 36
Table 3.6 Learnerships contracts registered with Fasset and learnerships completed in 2005/2006
Title NQF level Professional body No of learners
registered
No of learnerships completed
1 ACCA Learnership 7 ACCA 7 0
2 Associate Accounting Technician 5 SAICA 0 7
3 Associate General Accountant
6 SAICA 0 26
4 Certificate in Business Accounting
5 CIMA 10 0
5 Certificate in Debt Recovery 4 0 0
6 Certified Accounting Technician
5 ACCA 1 0
7 Chartered Accountant: Audit Specialism
7 SAICA 3 847 2 460
8 Chartered Accountant: Financial Management Specialism
7 SAICA 0 0
9 Chartered Management Accounting
7 CIMA 8 1
10 Commercial and Financial Accountant: Public Practice Specialism
7 SAIPA 359 0
11 Commercial and Financial Accountant: Commerce and Industry Specialism
7 SAIPA 8 0
12 Diploma in Management Accounting
6 CIMA 10 0
13 GAP - Accounting Technician
5 GAP 1 0
14 National Certificate in Business Administration
4 IBS 0 0
15 National Certificate in Business Administration
3 IBS 0 0
16 National Certificate in Public Sector Accounting
4 0 0
17 National Certificate: Office Administration
5 IAC 0 0
18 National Certificate: Small Business Financial Management
4 ICB 5 0
19 National Diploma in Public Sector Accounting
5 4 7
20 National Diploma: Technical Financial Accounting
5 ICB 6 1
21 Registered Accounting Clerk 3 ICB 26 0
22 Registered Bookkeeper 4 ICB 16 0
Total 4 308 2 502
*Figures include only learners registered in Fasset�s sector. It should, however, be noted that some of the learnerships registered with Fasset are specifically designed for the development of skills in government and in commerce and industry. These learners will be registered mainly in other sectors.

Fasset Sector Skills Plan 2005 � 2010 Update for the 2007/2008 Financial Year
Draft 21 May 2007 37
A critical element in the successful implementation of learnerships is employers� readiness to take on learners. This, in turn, is a function of various factors including employers� knowledge of learnerships in general and the availability of specific learnerships; their knowledge of and perspectives on the possible benefits associated with learnerships; their perceptions of the administrative processes involved in learnerships; and their perceptions of the inputs that they, as role players, would have to contribute. Fasset�s research on the need for strategic learnerships in the sector revealed that organisations differ vastly in their readiness for learnerships. At the one end of the spectrum are organisations that are well informed about the concept, that are already involved with learnerships and that are ready to become involved in new and �non-traditional� learnerships. At the other end, are organisations that are totally unfamiliar with the concept or that are vaguely familiar with it but are uninformed about the benefits such as tax concessions and learnership grants. A particular challenge to the sector is to get more small firms involved in learnerships, especially the newly registered learnerships.
Another way in which employers contribute to skills development in the sector is by making bursaries available. In 2003/2004, over 1 500 PDIs had received some sort of financial assistance for their studies from employers. Financial assistance for these candidates was offered from one year to as many as four years depending on the length of the course. Some of the recipients of these bursaries would find employment in the organisation after graduation while others benefited from the work experience, which equipped them for future employment opportunities.62
3.5 DEVELOPMENT OF SKILLS OF THE EXISTING WORKFORCE Continuous education and training of the workforce in the sector is essential because of the ongoing changes in the legislative and policy environment as well as the changes in financial practices and in computer technology. Chapter 2 covered the relatively high turnover and the need to replace people who have left the sector. The development of the skills of the workforce beyond entry-level skills is consequently a prerequisite for the successful functioning of organisations and individuals in the sector.
The main providers of this training are employers themselves, private training institutions and training consultants, professional bodies, and universities and technikons. The extent to which employers engage in the training and development of their workers (either directly through their own training divisions and programmes or indirectly through outsourced training opportunities) is reflected in the annual training reports submitted to Fasset. In 2001/2002, 621 employers submitted training reports to Fasset in which they reported that they had provided approximately 20 000 training interventions63 and that they had trained approximately 32 000 workers � almost their total workforces. The amount spent by these organisations on training amounted to R112 million.64 In the 2002/2003 period, 1 381 organisations submitted training reports in which they reported that they had trained 27 000 employees (69% of their employees), and that they had spent R136 million on training.65
The information for the 2003/2004 period reveals that 931 employers submitted training reports in which they reported they had trained 30 000 employees.66 More than R147 million was spent on training with organisations investing most of the money in top-up skills such as specialised financial skills (R43 million), management and leadership skills (R40 million) and basic computer skills (R24 million).
In 2004/2005 930 employers submitted training reports. In this year they spent R156 million on the training of 30 000 employees. The number of people trained in each occupational category can be seen in Table 3.7. The occupational category in which most of the beneficiaries of training fell was technicians and associated professionals. This is to be expected as most of the trainees in the sector are classified in this occupational group, for example trainee accountants and auditors.
62 Fasset, Analysis of Grant applications Year 4 (2003/4). 63 A training intervention is a training course or training opportunity attended by one or more employees. 64 Fasset, Analysis of Grant Submissions Year 2. 65
Fasset, Analysis of Grant Submissions Year 3. 66 Fasset, Analysis of Grant Submissions Year 4.

Fasset Sector Skills Plan 2005 � 2010 Update for the 2007/2008 Financial Year
Draft 21 May 2007 38
Table 3.7 Beneficiaries of training: 2004/2005 according to occupational category
Occupational Group Total
employed Total
trained %
% of employed
trained Legislators, Senior Officials, Managers & Owner managers 5 684 4 174 14 73 Professionals 8 414 5 775 19 69
Technicians & Associated Professionals 10 771 10 938 36 102
Clerical & Administrative Workers 10 950 7 758 26 71 Service & Sales Workers 1 060 868 3 82
Skilled Workers, Craft & Related Trades 215 84 0 39
Plant & Machine Operators and Assemblers 140 71 0 51
Labourers & Elementary Occupations 819 304 1 37 Total 38 053 29 972 100 79
Source: Fasset, Analysis of Grant Submissions 2004/2005
3.6 CONCLUSIONS The analysis presented in this chapter indicates that the sector is served by a well-established and diversified education and training system that spans all the components of the public and private education sectors, professional bodies and employers. The qualifications available to the sector range from NQF Level 3 to Level 8 � with learnerships registered at each level.
Despite the relatively low percentage of matric exemptions and the limited numbers of learners who pass matric with mathematics as a subject, the output of universities and technikons in the fields of accounting and commerce, business management and business administration has grown consistently over the past decade.
The overall impression gained from the surveys that preceded the SSP development is that the provision of education and training to the sector is comprehensive and generally of a high standard. In fact, the education and training available in South Africa is of world-class standard; hence the fact that South African professionals are sought after in the international market. The role that the professional bodies play in maintaining these standards should not be underestimated.
Despite an overall positive picture of education and training, the sector is faced with the realities of too few learners from the previously disadvantaged groups moving up to the higher professional qualification levels. The challenge is accordingly to remove all unnecessary obstacles and to maximise support for these individuals in order to alleviate the problem in the short to medium term.

Fasset Sector Skills Plan 2005 � 2010 Update for the 2007/2008 Financial Year
Draft 21 May 2007 39
4 SCARCE SKILLS AND CRITICAL SKILLS IDENTIFICATION 4.1 INTRODUCTION This chapter looks at skills needs in the sector with specific reference to scarce and critical skills. The term scarce skills refers to those occupations characterised by a scarcity of qualified and experienced people (current and anticipated) � in other words, occupations in which numerical imbalances exist in employment because of a divergence between the demand for and the supply of skills. The term critical skills refers to particular skills within an occupation,67 or the qualitative deficiencies that may exist or develop in the skills apparatus of the existing workforce. The chapter starts with a summary of certain of the demand and supply issues that have a direct influence on the scarcity of skills. This is followed by a discussion of scarce skills and then of critical skills in the sector.
4.2 GROWTH IN DEMAND
The legislative and policy changes that have a bearing on corporate governance and financial and accounting practices in the public and private sectors all tend to stimulate the demand for the financial services offered by The Financial and Accounting Services Sector. The demand for financial services is also driven by the positive economic growth experienced in South Africa over the last number of years. Although employment demand is relatively inelastic (i.e. employment grows more slowly than output), the demand model developed for the sector, as well as the WSPs submitted to Fasset, indicates that new employment opportunities can be expected to increase by between 3 500 and 5 800 annually. These opportunities will occur in all employment categories, but the largest growth will be in the professionals and technicians categories.
A particular challenge for the sector is to replace people who have moved out of the sector. One occupational group with a very high replacement demand is the accounting profession � more specifically trainee accountants. This replacement demand is a result of the occupational structure that has developed over time and the specific roles played by trainee accountants in the sector. The professional learnerships in accounting are relatively long (approximately three years) and the trainees who enter these learnerships are graduates � many already have honours degrees. Thus, in many accounting firms the bulk of the para-professional work is done by trainee accountants and the learnership positions have become a permanent component of the occupational structure of the sector. In some of the accounting and auditing firms learners constitute as much as twenty percent or more of the total workforce. However, it is widely accepted that most learners will leave the firms in which they trained after completion of their learnerships to find employment elsewhere. In the firms they are replaced by new learners. Many learners leave the sector altogether to become financial professionals and managers elsewhere in the economy. This leaves the Financial and Accounting Services Sector with the responsibility to train more learners than only those needed for the sector�s own professional positions.
The loss of skilled personnel is not limited to the local labour market � permanent emigration and temporary employment abroad are causing a substantial drain of people with financial skills.
In the demand analysis presented in Chapter 2 of this SSP the need to change the racial profile of the sector was emphasised. Thus, the demand for financial professionals from historically disadvantaged groups is particularly high.
4.3 GROWTH IN SUPPLY
If one looks at the output of the higher education sector, it seems as if the supply of skills is growing at a sufficient pace to keep up with the growth in demand. However, the Financial and Accounting Services Sector is by no means the only sector that is drawing from this skills pool. At this stage, little information is available on the demand for financial skills in the total economy. A direct comparison cannot therefore be made between demand and supply. Another key question is whether the higher education system will be
67 Department of Labour, Framework for Identifying and Monitoring Scarce Skills, 2005.

Fasset Sector Skills Plan 2005 � 2010 Update for the 2007/2008 Financial Year
Draft 21 May 2007 40
0
500
1 000
1 500
2 000
2 500
3 000
3 500
4 000
4 500
5 000
2002/2003 2003/2004 2004/2005 2005/2006
N
New learnerships registered Learnerships completed
able to sustain its growth, especially in the midst of the current restructuring of the sector and the changed subsidy formulas applied by the Department of Education.
The increase in the numbers of black graduates in the general fields of commerce, business management and business administration should to some extent ease the pressure on the sector to change its racial profile. However, the change in the specialised field of accounting is slower and requires more focused attention. As this problem has its roots in the school system, especially in the number and quality of matric passes in mathematics, it should be addressed from this level and upwards.
Professional qualifications are highly valued and sought after in the Financial and Accounting Services Sector. For certain functions (e.g. the audit function), professional qualifications are a prerequisite. The pace at which professionals qualify is therefore a critical issue in the supply side of the market.
At this stage, Fasset has registered 22 learnerships many of which link up with the professional qualification structure, and more are being developed. The registered learnership contracts are, however, largely limited to the chartered accountant learnership. Although the training of these professionals is crucial, the number of learners in all the learnerships has to be increased.
Figure 4.1 shows the number of new learnership registrations and the number of learners who qualified over the four-year period from 2002/2003 to 2005/2006. The number of learners who qualified dropped slightly in the last two years. The number of new learnership registrations increased substantially in the 2005/2006 financial year, but most of these learners will only qualify in three years� time. The change in the racial profile of learners is also relatively slow. In 2001/2002, 29% of the learners registered with Fasset were black, and, by June 2006, this figure had increased to 40%.
Figure 4.1 New learnerships registered and learnerships completed 2002 to 2006
Source: Fasset learnership registration system
4.4 SCARCE SKILLS
Scarce skills manifest in unfilled positions that exist over prolonged periods of time, in above-average growth in remuneration and in the inability of small organisations and rural areas to attract skilled people. Research68 shows that scarce skills already exist in the sector � mainly in the professionals, and technicians and associated professional occupations. These occupational categories are also experiencing above-average growth. However, it is evident that the shortages are often related to very special skills sought by employers.
68 Fasset Sector Study and Fasset, Analysis of Grant Submissions 2000/2001, 2001/2002, 2002/2003, 2003/2004 and 2004/2005.
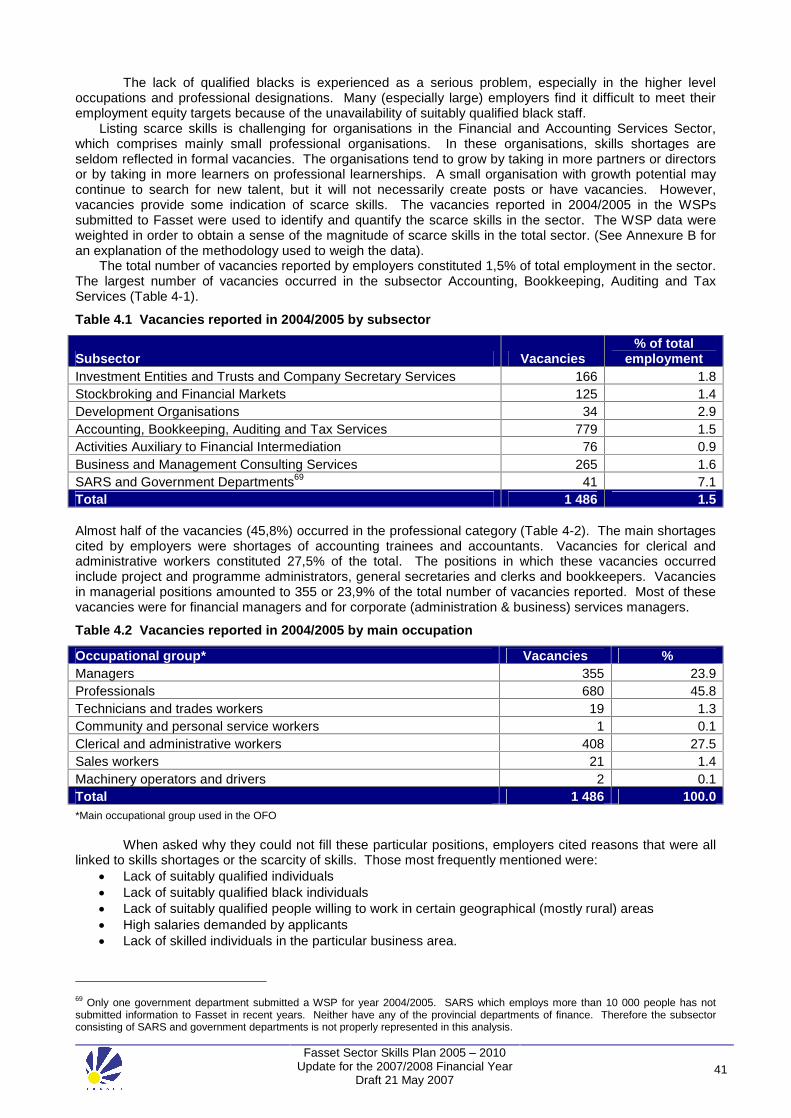
Fasset Sector Skills Plan 2005 � 2010 Update for the 2007/2008 Financial Year
Draft 21 May 2007 41
The lack of qualified blacks is experienced as a serious problem, especially in the higher level occupations and professional designations. Many (especially large) employers find it difficult to meet their employment equity targets because of the unavailability of suitably qualified black staff.
Listing scarce skills is challenging for organisations in the Financial and Accounting Services Sector, which comprises mainly small professional organisations. In these organisations, skills shortages are seldom reflected in formal vacancies. The organisations tend to grow by taking in more partners or directors or by taking in more learners on professional learnerships. A small organisation with growth potential may continue to search for new talent, but it will not necessarily create posts or have vacancies. However, vacancies provide some indication of scarce skills. The vacancies reported in 2004/2005 in the WSPs submitted to Fasset were used to identify and quantify the scarce skills in the sector. The WSP data were weighted in order to obtain a sense of the magnitude of scarce skills in the total sector. (See Annexure B for an explanation of the methodology used to weigh the data).
The total number of vacancies reported by employers constituted 1,5% of total employment in the sector. The largest number of vacancies occurred in the subsector Accounting, Bookkeeping, Auditing and Tax Services (Table 4-1).
Table 4.1 Vacancies reported in 2004/2005 by subsector
Subsector Vacancies % of total
employment Investment Entities and Trusts and Company Secretary Services 166 1.8 Stockbroking and Financial Markets 125 1.4 Development Organisations 34 2.9 Accounting, Bookkeeping, Auditing and Tax Services 779 1.5 Activities Auxiliary to Financial Intermediation 76 0.9 Business and Management Consulting Services 265 1.6 SARS and Government Departments69 41 7.1 Total 1 486 1.5
Almost half of the vacancies (45,8%) occurred in the professional category (Table 4-2). The main shortages cited by employers were shortages of accounting trainees and accountants. Vacancies for clerical and administrative workers constituted 27,5% of the total. The positions in which these vacancies occurred include project and programme administrators, general secretaries and clerks and bookkeepers. Vacancies in managerial positions amounted to 355 or 23,9% of the total number of vacancies reported. Most of these vacancies were for financial managers and for corporate (administration & business) services managers.
Table 4.2 Vacancies reported in 2004/2005 by main occupation
Occupational group* Vacancies % Managers 355 23.9 Professionals 680 45.8 Technicians and trades workers 19 1.3 Community and personal service workers 1 0.1 Clerical and administrative workers 408 27.5 Sales workers 21 1.4 Machinery operators and drivers 2 0.1 Total 1 486 100.0 *Main occupational group used in the OFO
When asked why they could not fill these particular positions, employers cited reasons that were all linked to skills shortages or the scarcity of skills. Those most frequently mentioned were:
Lack of suitably qualified individuals Lack of suitably qualified black individuals Lack of suitably qualified people willing to work in certain geographical (mostly rural) areas High salaries demanded by applicants Lack of skilled individuals in the particular business area.
69 Only one government department submitted a WSP for year 2004/2005. SARS which employs more than 10 000 people has not submitted information to Fasset in recent years. Neither have any of the provincial departments of finance. Therefore the subsector consisting of SARS and government departments is not properly represented in this analysis.

Fasset Sector Skills Plan 2005 � 2010 Update for the 2007/2008 Financial Year
Draft 21 May 2007 42
Annexure C provides the list of scarce skills in the sector as required by the Department of Labour, while Table 4.3 lists the ten occupations in which largest numbers of people are needed. The occupations listed were derived from the vacancies reported by employers in the year 2004/2005 WSPs. The occupational descriptions used by employers were coded to the OFO occupations. The numerical values reported in the second last column of Annexure C refer only to the scarce skills listed in the table and not to the numbers of people who need to undergo training in respect of critical skills needs. The numbers of people needed in each occupation were derived by increasing the number70 of vacancies reported in 2004/2005 by 20%71. Thus these numbers refer to the estimated shortfall in the market and not to the total number of people needed to satisfy new and replacement demand.
Although the need for accountants (at different levels and with different professional designations) is clearly evident, the table also indicates that Fasset needs to focus its skills development strategies on a relatively broad spectrum of professional fields and at NQF levels five and above. The shortages of managers will in the longer term also be alleviated by an increase in the availability of professionals.
Table 4.3 Occupations with highest numbers of scarce skills
Ranking OFO Code* Occupation
Need for Period 1 April
2006 to 31 March 2007
% of total need
1 2211 Accountants 616 35 2 1321 Corporate (Administration & Business)
Services Managers 228 13
3 5111 Contract, Program and Project Administrators
157 9
4 1322 Finance Managers 133 8 5 5311 General Clerks 114 6 6 5212 Secretaries 94 5 7 1329 Other Project Managers nec 47 3 8 2243 Economists 40 2 9 5512 Bookkeepers 36 2 10 2223 Financial Investment Advisers and
Managers 31 2
The number of people needed has been summed to the 4-digit level of the OFO.
4.5 CRITICAL SKILLS IN DEMAND
The people working in the Financial and Accounting Services Sector, especially professionals have a constant need for skills development and therefore critical skills (as currently defined by the DoL) will probably always exist among a large proportion of the employees in the sector. These needs emanate from some of the factors discussed in Chapter 1 of this SSP. For example, it is imperative for many of the professionals to stay abreast of changes in the tax legislation and other changes in the tax regime, changes in financial reporting practices and requirements and new computer software. Some of the critical skills also stem from insufficient training prior to entering the labour market.
In the WSPs submitted for 2004/2005 employers identified the skills areas in which their employees needed training. The analysis of WSPs over time revealed that these skills areas remained more or less constant. Specialist financial skills are the most important critical skills in the sector and they are required across all occupational groups. The total list of critical skills identified by the sector is summarised below. The skills are grouped into six broad categories and listed in order of priority within each category. Management and leadership
Management skills/leadership skills Human resources management skills Workflow and imaging skills
70 The weighted number was used. 71 The 20% increase was necessary because an increase in the number of vacancies reported by employers occurred in the last few years.

Fasset Sector Skills Plan 2005 � 2010 Update for the 2007/2008 Financial Year
Draft 21 May 2007 43
Organisational development/office management skills Specialist financial
Accounting skills Knowledge of taxation, including VAT and capital gains tax Bookkeeping skills Auditing skills Knowledge of commercial and statutory law Insurance knowledge Financial and mathematical skills Investment and micro-lending training skills
Information technology Computer skills, e.g. word-processing and spreadsheet skills Specialist information technology skills
Communication, customer care and marketing Communication skills Marketing skills Public relations skills Presentation skills Client service skills
Support and administration Administration skills Secretarial skills Business economics skills Clerical skills Reception skills
Personal development People skills Education/Basic adult education skills
Professional bodies72 confirmed the need for financial skills across a broad spectrum of workers in the sector. In the financial market, general financial and mathematical skills, knowledge of financial market instruments and financial market analysis, trading knowledge, and computer knowledge and skills were identified as areas of need.
In the management consulting profession, practitioners need to know what constitutes ethical behaviour. This subsector requires a combination of managerial expertise, industry knowledge, technical knowledge and an understanding of management issues.
In the public sector, a need exists for the following skills: Literacy and numeracy skills Basic accounting skills, especially in respect of new people who enter organisations in entry-level
posts Accounting support skills (e.g. those needed by accounting technicians) Auditing skills Financial management skills Experience and training in credit control and debt management Risk assessment skills Computer literacy Management skills for newly appointed chief financial officers Experience in statistical models, econometrics and macro-economic modelling Knowledge of and experience in supply chains Financial sector policy advisory services and Exposure to public finance coupled with analytical skills with regard to budgeting, strategic planning
and information overload assessments
4.6 CONCLUSIONS The Financial and Accounting Services Sector has to ensure a sufficient number of new entrants into the labour market, address skills shortages and prevent skills gaps from occurring. Interventions to address skills shortages or scarce skills have to be aimed at three levels:
72 Professional bodies that participated in the Fasset Sector Study.

Fasset Sector Skills Plan 2005 � 2010 Update for the 2007/2008 Financial Year
Draft 21 May 2007 44
a) School level The provision of a sufficient number of new entrants into the labour market starts at school level. Schools have to produce enough matriculants with endorsements and with mathematics and accounting as subjects.
b) Tertiary education level At the tertiary education level, access to the higher education system has to be ensured and unnecessary institutional constraints have to be reduced so as to provide a sufficiently large pool of graduates (especially in the specialised field of accounting) who can take up professional and technical positions in the financial services field.
c) Professional level
At a third level, it is also essential to increase the number of people in learnerships who can obtain the professional qualifications and designations required in the sector.
Critical skills gaps are generally the result of insufficient training prior to entry into the labour market,
technological changes, and legislative and policy changes to which the sector is exposed on an ongoing basis. Skills gaps can occur across the whole spectrum of functions performed in the sector and can affect all levels and categories of workers. However, the indications are that the main areas currently requiring attention are specialist financial skills (which cover a wide spectrum of skills needs), computer skills (ranging from basic computer literacy to highly specialised information technology skills) and managerial skills.

Fasset Sector Skills Plan 2005 � 2010 Update for the 2007/2008 Financial Year
Draft 21 May 2007 45
5 SMALL BUSINESS, ENTREPRENEURIAL OPPORTUNITIES AND OTHER NSDS PRIORITIES 5.1 INTRODUCTION This section covers those issues related to the NSDS indicators for 2005 to 2010 that do not directly concern scarce or critical skills in the sector, namely, small business opportunities, support for small levy-paying and non-levy-paying firms, ABET, the National Standard of Good Practice and stakeholder capacity building.
5.2 SMALL BUSINESS OPPORTUNITIES It is the NSDS objective to assist new entrants to the labour market, create self-employment and develop entrepreneurs. Fasset has to identify specific opportunities in the sector for small businesses that can lead to job creation and poverty alleviation.
As part of its implementation plan, Fasset supports strategic interventions that lead to new employment opportunities in the labour market and that provide new entrants with the skills for self-employment. These operations include learnerships, social development projects funded by Fasset and Fasset�s strategy for supporting new BEE firms.
On completion of Fasset learnerships (specifically those offered through SAICA and SAIPA), learners can open their own firms and practise as registered professionals. For example, once learners have completed their qualification through SAICA, they are registered as SAICA members with the designation CA (SA) and obtain a professional licence. With this specific designation and professional practicing licence, graduates can establish their own accountancy practices in the sector. Many of these learnerships such as the Chartered Accountant: Audit Specialism and the Commercial and Financial Accountant: Public Practice offer modules on practical management and business management skills for business owners.
Fasset also funds initiatives to promote the entry of new entrants into the labour market. For example, the Guarantee Trust Holdings Unemployed Tertiary Accounting Graduate Support Programme aims to:
increase the number of previously disadvantaged individuals on registered learnerships; increase the level of success of these learners on the learnerships; support skills development in small businesses. The intensive skills development programme comprises five months� full-time and part-time training
including an internship at an accounting practice in the sector. Course material includes rules of professional conduct, communication skills, accounting practice orientation, computer literacy, office orientation and formulas for business success. The programme thus allows the sector to integrate (sometimes re-integrate) learners that have already made some progress towards gaining the skills required by the sector. The programme also assists firms with their transformation efforts by providing them with appropriately skilled staff and by equipping learners with entrepreneurial and business skills.
Finally, Fasset supports the establishment of BEE ventures through the strategic cash grant (SCG) for 2006/7. Large and medium-size employers may qualify for SCGs if they assist PDIs in creating new ventures in the sector. The focus is not only on placement within existing enterprises but also on the individual persons� ability to create self-employment through new ventures.
5.3 SUPPORT TO SMALL ORGANISATIONS As indicated in Chapter 1 of this SSP most of the organisations in this sector are small. More than 80% of the levy-paying companies employ fewer than 10 people and 97% employ fewer than 50 people. At the time of preparing this SSP update there were more than 2 000 very small non-levy-paying companies on Fasset�s database. It is expected that, after the increase of the threshold for the SDL from an annual payroll of R250 000 to R500 000 between 4 500 and 5 000 of the current levy-payers will become non-levy payers. Fasset has various support structures for small businesses in the sector in place. These include free CPE and SDF training opportunities, free assistance and advice with the completion of grant applications and access to PDI learnership grant. Many of the social projects funded by Fasset also benefit small companies.

Fasset Sector Skills Plan 2005 � 2010 Update for the 2007/2008 Financial Year
Draft 21 May 2007 46
Fasset will continue its support for small levy-paying and non-levy paying companies during this planning period. The form and extent of this support will be reviewed and decided by the Fasset Management Board on an annual basis.
5.4 ADULT BASIC EDUCATION AND TRAINING The Fasset sector consists largely of skilled employees, with only 3% of employees at or below ABET Level 4. Fasset regards ABET as a priority area and is committed to developing learners in need of training. In August 2004, Fasset began implementing an ABET programme to assist adult learners in the sector to improve their literacy and numeracy skills and to further their path on the National Qualifications Framework (NQF). The programme delivers ABET Levels 1-4 and consists of the following:
ABET level basic (Pre-ABET) ABET Level 1 (equivalent to Standard 1 or Grade 3) ABET Level 2 (equivalent to Standard 3 or Grade 5) ABET Level 3 (equivalent to Standard 5 or Grade 7) ABET Level 4 � NQF Level 1 (equivalent to Standard 7 or Grade 9)
5.5 NATIONAL STANDARD OF GOOD PRACTICE
The NSDS aims to accelerate the quality of training in the workplace by promoting the achievement of a national standard of good practice in skills development. No specific standard has yet been identified by DoL. Fasset is supporting the Investors in People (IIP) standard until more clarity has been obtained on the accepted national standard of people development. As of 31 March 2005, 21 organisations were committed to the standard, and seven organisations have achieved the standard.
5.6 STAKEHOLDER CAPACITY BUILDING
Stakeholder groupings in the sector include Fasset management board members, Fasset committee members and Fasset members. All board members are annually inducted into their roles as board members. They are given a detailed overview of the sector, are advised on their role and obligations as members and are informed about Fasset corporate governance structures. Committee members are regularly updated on Fasset developments via the quarterly committee meetings. Members are invited to all SDF and CPE training interventions and are updated and briefed regularly on all developments and other changes to legislation that affect the sector.
5.7 CONCLUSIONS Current initiatives such as learnerships, social development projects and Fasset�s BEE strategy provide support in areas of skills needs (many of which are critical and scarce).
Various support structures for small businesses in the sector are already in place. Levy-paying small businesses can benefit from free CPE and SDF training as well as free assistance and advice on the completion of their grant applications. Small and medium-size businesses can also claim grants from Fasset if they employ PDI learners. Fasset considers ABET a strategic priority and funds a complete ABET programme for ABET employees in the sector. Fasset will continue promoting the IIP standard.

Fasset Sector Skills Plan 2005 � 2010 Update for the 2007/2008 Financial Year
Draft 21 May 2007 47
REFERENCES
Albrecht, S.W. & Sack, R.J. Accounting Education: Charting the Course through a Perilous Future, American Accounting Association, Accounting Education Series, Vol. 16, 2000.
Brown, F. & Ooi, E., Implications of Sarbanes-Oxley, http://www.pwcglobal.com/extweb/manisseu.
Bureau of Market Research, A Projection of the South African Population, 1996 to 2021, University of South Africa, Pretoria, 1999.
Cassim, Z. Institute for Public Finance and Auditing, Interview, January 2004.
Cliffe Dekker, King Report on Corporate Governance for South Africa, 2002.
Department of Education, Education Statistics in South Africa at a Glance in 2001, EMIS Directorate, Pretoria, 2003
Department of Labour, Fasset Sector Brief, 2002.
Fasset, Analysis of Grant Submissions Year 1, April 2002.
Fasset, Analysis of Grant Submissions Year 2, November 2002.
Fasset, Analysis of Grant Submissions Year 3, June 2004.
Fasset, Analysis of Grant Submissions Year 4, September 2005.
Fasset, Analysis of Grant Submissions Year 5, In progress.
Fasset, Analysis of Grant Submissions Year 6, In progress.
Fasset, The Need for Strategic Learnerships in Finance, Accounting, Management Consulting and Other Financial Services, Johannesburg, 2003.
Financial Services Charter, 2003
Gerrits, E. Partner, PricewaterhouseCoopers, Telephonic interview, January 2004.
Gloeck, J.D. Advancing or retreating in the quest to improve public accountability and government auditing. South African Journal of Accountability and Auditing Research. Vol. 4:2003, pp.1-13.
Growth and Development Summit Agreement, 7 June 2003.
Government of South Africa, Accelerated and Shared Growth Initiative for South Africa, http://www.info.gov.za/asgisa/asgisa.htm, 2006.
Human Sciences Research Council, Nelson Mandela/HSRC Study of HIV/AIDS, Pretoria, 2002.
Human Sciences Research Council, Skills Development in the Financial and Accounting Sector, Fasset, Johannesburg, October 2002. (Fasset Sector Study)
Institute of Directors, The King Report on Corporate Governance, 2002,www.iodsa.co.za
Institute of Internal Auditors, IIA advisor, December 2003.
Lawless, A. 2005. Numbers and Needs. Addressing the imbalance in the civil engineering profession. SACI: Halfway House.
Malherbe, Segal, Corporate governance in South Africa, 2001. Discussed at Policy Dialogue Meeting on Corporate Governance and emerging Economies, OECD, 23 April 2001.
Manual, T., 2002 Budget Speech, http://www.finance.gov.za
Ministerial Panel for the Review of the Draft Accountancy Professions Bill, Short summary of recommendations, 2003, www://finance.gov.za
Republic of South Africa, Auditing Profession Act, No. 26 of 2005.
Republic of South Africa, Broad-Based Black Economic Empowerment Act, No. 53 of 2003.
Republic of South Africa, Companies Act, No. 61 of 1973.
Republic of South Africa, Draft Accountancy Profession Bill, 2001, http://www.finance.gov.za
Republic of South Africa, Draft Public Audit Bill, 2003, www.finance.gov.za
Republic of South Africa, Employment Equity Act, No. 55 of 1998.
Republic of South Africa, Financial Intelligence Centre Act, No. 38 of 2001.
Republic of South Africa, National Credit Act, No 34 of 2005.
Republic of South Africa, Preferential Procurement Framework Act, No. 5 of 2000.
Republic of South Africa, Skills Development Act, No. 97 of 1998.

Fasset Sector Skills Plan 2005 � 2010 Update for the 2007/2008 Financial Year
Draft 21 May 2007 48
Republic of South Africa, South African Debt Collectors� Act, No. 114 of 1998.
Republic of South Africa, The Public Finance Management Act, No. 1 of 1999 as amended.
Reserve Bank, data series KBP6006Y and KBP6640Y.
Rothchild, G. Manager of Marketing, JSE Securities Exchange SA, Interview, January 2004.
SAICA, http//www.saica.co.za, accessed January 2004.
Statistics South Africa, Labour Force Survey, September 2003.
Statistics South Africa, Labour Force Survey, September 2005.
Statistics South Africa, Tourism and Migration, Data Series PO351.
Van Rensburg, A.M., Management Accounting as an existing decision making tool, Unpublished Paper, 2003.
World Health Organisation, Weekly Epidemiological Record, December 2003.

Fasset Sector Skills Plan 2005 � 2010 Update for the 2007/2008 Financial Year
Draft 21 May 2007 49
ANNEXURE A LABOUR DEMAND PROJECTIONS
2003 2004 2005 2006 2007 2008 2009
Scenario A
Total projected employment 110 240 113 465 116 783 120 199 123 715 127 334 131 058
New positions to be filled 3 225 3 319 3 416 3 516 3 619 3 725
Positions that need replacement 8 113 8 350 8 594 8 846 9 104 9 371
Total positions to be filled 11 337 11 669 12 010 12 361 12 723 13 095
Annual growth in positions to be filled: 2.9
Scenario B
Total projected employment 110 240 114 109 118 115 122 260 126 552 130 994 135 592
New positions to be filled 3 869 4 005 4 146 4 291 4 442 4 598
Positions that need replacement 8 159 8 445 8 742 9 048 9 366 9 695
Total positions to be filled 12 028 12 450 12 887 13 340 13 808 14 293
Annual growth in positions to be filled: 3.5
Scenario C
Total projected employment 110 240 114 539 119 006 123 648 128 470 133 480 138 686
New positions to be filled 4 299 4 467 4 641 4 822 5 010 5 206
Positions that need replacement 8 190 8 509 8 841 9 186 9 544 9 916
Total positions to be filled 12 489 12 976 13 482 14 008 14 554 15 122
Annual growth in positions to be filled: 3.9
Scenario D
Total projected employment 110 240 115 399 120 800 126 453 132 371 138 566 145 051
New positions to be filled 5 159 5 401 5 653 5 918 6 195 6 485
Positions that need replacement 8 251 8 637 9 041 9 465 9 907 10 371
Total positions to be filled 13 410 14 038 14 695 15 383 16 102 16 856
Annual growth in positions to be filled: 4.7

Fasset Sector Skills Plan 2005 � 2010 Update for the 2007/2008 Financial Year
Draft 21 May 2007 50
ANNEXURE B METHODOLOGY USED TO WEIGH WSP DATA
1) The first step was to identify organisations that were �linked� in Fasset�s data system. These
were organisations that submitted one WSP for two or more SDL numbers. The total levy amounts paid against each group of SDL numbers was calculated. (In other words a group of linked organisations was further on treated as one organisation.)
2) Organisations were then categorised into levy categories (using total levies paid in respect of the
2005/2006 financial year). The following levy categories were used:
1 = R 2 mil + 2 = R 1mil � R2 mil 3 = R 500 000 � R 1 mil 4 = R 100 000 � R 500 000 5 = R 10 000 � R 100 000 6 = R 5 000 � R10 000 7 = R 1 000 � R 5 000 8 = < R 1 000
3) Organisations were also categorised into subsectors using SIC codes.
4) A cross tabulation was made of all the levy paying organisations according to levy categories
and subsectors
5) A cross tabulation was made of all organisations that submitted WSPs according to levy categories and subsectors
6) The proportion of companies that submitted WSPs in each subcategory was then calculated.
(subcategory refers to levy category and subsector, for example the Development organisations that paid less than R 1000 in levies).
7) The weight for each subcategory was calculated: weight = inverse of proportion that submitted
WSPs.
8) Each organisation was assigned a weight according to the subcategory to which it belonged.
9) The weights were applied in the statistical analysis, which was performed in SPSS.
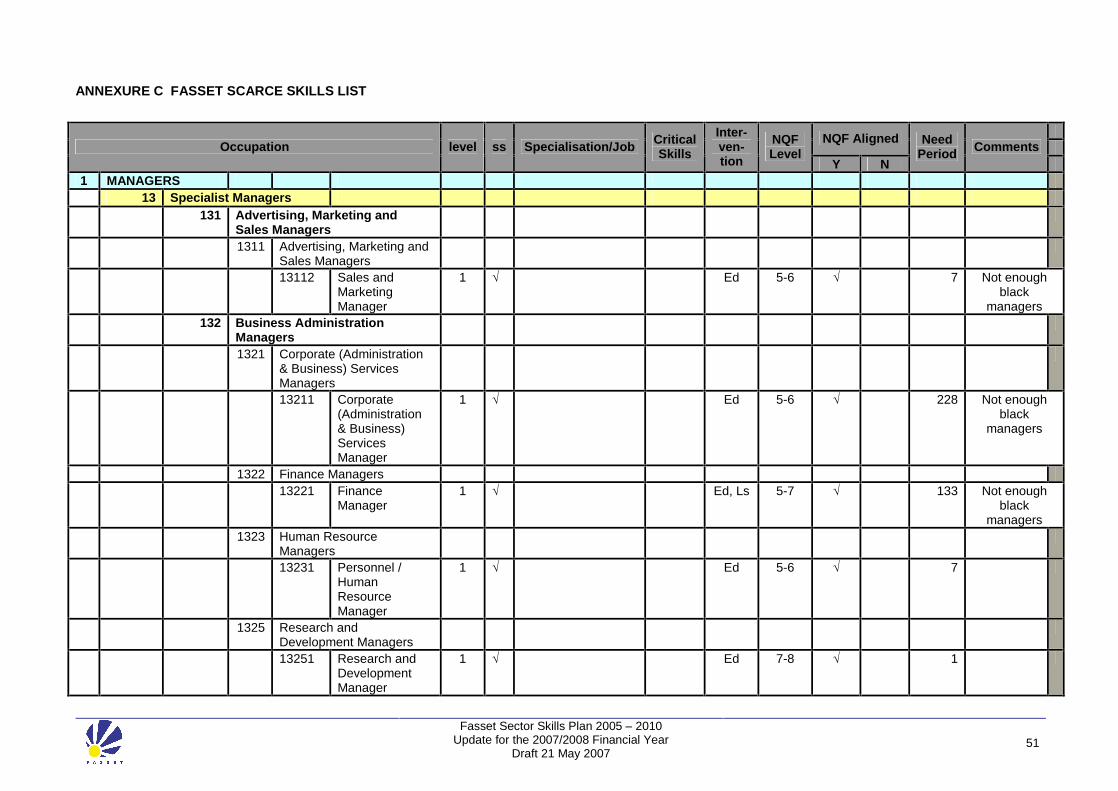
Fasset Sector Skills Plan 2005 � 2010 Update for the 2007/2008 Financial Year
Draft 21 May 2007 51
ANNEXURE C FASSET SCARCE SKILLS LIST
NQF Aligned Occupation level ss Specialisation/Job Critical
Skills
Inter-ven-tion
NQF Level
Y N
Need Period Comments
1 MANAGERS 13 Specialist Managers 131 Advertising, Marketing and
Sales Managers
1311 Advertising, Marketing and Sales Managers
13112 Sales and Marketing Manager
1 √ Ed 5-6 √ 7 Not enough black
managers 132 Business Administration
Managers
1321 Corporate (Administration & Business) Services Managers
13211 Corporate (Administration & Business) Services Manager
1 √ Ed 5-6 √ 228 Not enough black
managers
1322 Finance Managers 13221 Finance
Manager 1 √ Ed, Ls 5-7 √ 133 Not enough
black managers
1323 Human Resource Managers
13231 Personnel / Human Resource Manager
1 √ Ed 5-6 √ 7
1325 Research and Development Managers
13251 Research and Development Manager
1 √ Ed 7-8 √ 1

Fasset Sector Skills Plan 2005 � 2010 Update for the 2007/2008 Financial Year
Draft 21 May 2007 52
NQF Aligned Occupation level ss Specialisation/Job Critical
Skills
Inter-ven-tion
NQF Level
Y N
Need Period Comments
1329 Other Project Managers
nec
13291 Technical Project / Technical Contract Manager nec
√ Ed 5-6 √ 37 Not enough black
managers
13299 Project / Contract Manager (General / nec)
√ Ed 5-6 √ 10
135 Information and Communication Technology (ICT) Managers
1351 Information and Communication Technology (ICT) Managers
Ed, SC
5-6 √
13519 ICT Managers nec
1 √ 2
2 PROFESSIONALS 22 Business, Human Resource and Marketing
Professionals
221 Accountants, Auditors and Company Secretaries
2211 Accountants 22111 Accountant
(General) 1 √ Ed, Ls 6-7 √ 215 Not enough
black professionals. Geographical
shortages 22111 Accountant
(General) 1 √ Trainee accountants Ed, Ls 6-7 √ 388 Not enough
black professionals. Geographical
shortages 22112 Management
Accountant 1 √ Ed, Ls 6-7 √ 2 Not enough
black professionals.

Fasset Sector Skills Plan 2005 � 2010 Update for the 2007/2008 Financial Year
Draft 21 May 2007 53
NQF Aligned Occupation level ss Specialisation/Job Critical
Skills
Inter-ven-tion
NQF Level
Y N
Need Period Comments
Geographical
shortages 22113 Taxation
Accountant 1 √ Ed, Ls 6-7 √ 11 Not enough
black professionals. Geographical
shortages 2212 Auditors, Company
Secretaries and Corporate Treasurers
22121 Company Secretary
1 √ Ed 6 √ 12
22124 Internal Auditor 1 √ Ed 6 √ 22 Not enough black
professionals. Geographical
shortages 22125 Forensic Auditor √ 2 222 Financial Brokers and Dealers,
and Investment Advisers
2221 Financial Brokers 22213 Insurance
Broker 2 √ Ed,
SP, L 4-6 √ 4
2222 Financial Dealers 22221 Financial Market
Dealer 1 √ Ed 6-7 √ 7 Not enough
black professionals. Geographical
shortages 22229 Financial
Dealers nec 1 √ Ed 6-8 √ 1 Not enough
black professionals. Geographical
shortages 2223 Financial Investment
Advisers and Managers
22231 Financial 1 √ Ed, L 6-7 √ 31 Not enough

Fasset Sector Skills Plan 2005 � 2010 Update for the 2007/2008 Financial Year
Draft 21 May 2007 54
NQF Aligned Occupation level ss Specialisation/Job Critical
Skills
Inter-ven-tion
NQF Level
Y N
Need Period Comments
Investment Adviser
black professionals. Geographical
shortages 223 Human Resource and Training
Professionals
2233 Training and Development Professionals
22331 Training and Development Professional
1 √ Ed 5-7 √ 1
224 Information and Organisation Professionals
2243 Economists 22431 Economist 1 √ Ed 7-8 √ 40 Not enough
black professionals.
2244 Intelligence and Policy Analysts
22442 Policy Analyst 1 √ Ed 7-8 √ 10 2247 Management and
Organisation Analysts
22471 Management Consultant
1 √ Ed 6-8 √ 4
25 Health Professionals 254 Midwifery and Nursing
Professionals
2544 Registered Nurses 25441 Nurse
Practitioner 1 √ Ed 5-6 √ 2
26 ICT Professionals
261 Business and Systems Analysts, and Programmers
2611 ICT Business and Systems Analysts
26112 Systems Analyst 1 √ Ed 5-6 √ 8

Fasset Sector Skills Plan 2005 � 2010 Update for the 2007/2008 Financial Year
Draft 21 May 2007 55
NQF Aligned Occupation level ss Specialisation/Job Critical
Skills
Inter-ven-tion
NQF Level
Y N
Need Period Comments
2613 Software and Applications
Programmers
26132 Developer Programmer
1 √ Ed 5-6 √ 18
26139 Software and Applications Programmers nec
1 √ 5
262 Database and Systems Administrators, and ICT Security Specialists
2621 Database and Systems Administrators, and ICT Security Specialists
26213 Systems Administrator
1 √ Ed 5-6 √ 2
2632 ICT Support and Test Engineers
26322 ICT Support Engineer
1 √ Ed 5-6 √ 12
27 Legal, Social and Welfare Professionals 271 Legal Professionals 2713 Attorneys / Lawyers /
Solicitors
27131 Attorney / Lawyer / Solicitor
1 √ Ed 6-7 √ 13
3 TECHNICIANS AND TRADES WORKERS 31 Engineering, ICT and Science Technicians 313 ICT and Telecommunications
Technicians
3131 ICT Support Technicians 31319 ICT Support
Technicians nec 2 √ Ed, Ls 5-6 √ 12
4 COMMUNITY AND PERSONAL SERVICE WORKERS 44 Protective Service Workers
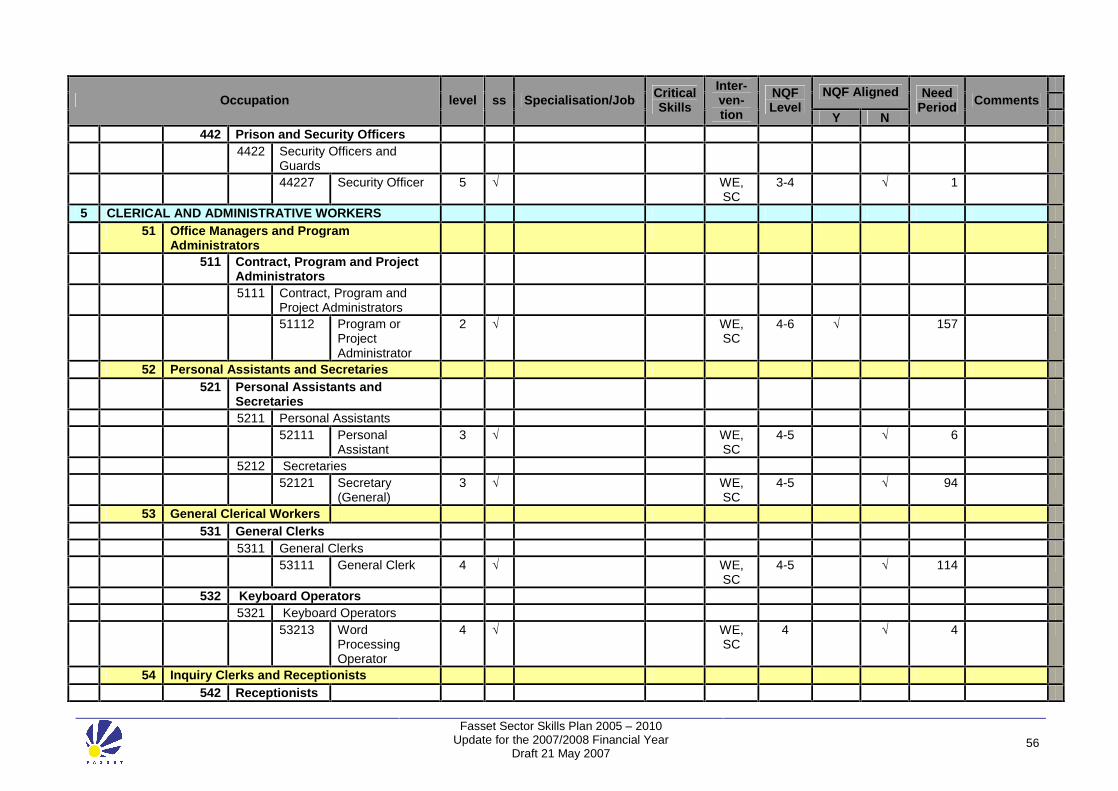
Fasset Sector Skills Plan 2005 � 2010 Update for the 2007/2008 Financial Year
Draft 21 May 2007 56
NQF Aligned Occupation level ss Specialisation/Job Critical
Skills
Inter-ven-tion
NQF Level
Y N
Need Period Comments
442 Prison and Security Officers 4422 Security Officers and
Guards
44227 Security Officer 5 √ WE, SC
3-4 √ 1
5 CLERICAL AND ADMINISTRATIVE WORKERS 51 Office Managers and Program
Administrators
511 Contract, Program and Project Administrators
5111 Contract, Program and Project Administrators
51112 Program or Project Administrator
2 √ WE, SC
4-6 √ 157
52 Personal Assistants and Secretaries 521 Personal Assistants and
Secretaries
5211 Personal Assistants 52111 Personal
Assistant 3 √ WE,
SC 4-5 √ 6
5212 Secretaries 52121 Secretary
(General) 3 √ WE,
SC 4-5 √ 94
53 General Clerical Workers 531 General Clerks 5311 General Clerks 53111 General Clerk 4 √ WE,
SC 4-5 √ 114
532 Keyboard Operators 5321 Keyboard Operators 53213 Word
Processing Operator
4 √ WE, SC
4 √ 4
54 Inquiry Clerks and Receptionists 542 Receptionists

Fasset Sector Skills Plan 2005 � 2010 Update for the 2007/2008 Financial Year
Draft 21 May 2007 57
NQF Aligned Occupation level ss Specialisation/Job Critical
Skills
Inter-ven-tion
NQF Level
Y N
Need Period Comments
5421 Receptionists 54211 Receptionist
(General) 4 √ WE,
SC 4 √ 23
55 Numerical Clerks
551 Accounting Clerks and Bookkeepers
5511 Accounting Clerks 55111 Accounts Clerk 4 √ Ed, Ls,
SC 4-5 √ 19
5512 Bookkeepers 55121 Bookkeeper 4 √ Ed, Ls,
SC 4-5 √ 36
5513 Payroll Clerks 55131 Payroll Clerk 4 √ Ed, Ls,
SC 4-5 √ 7
552 Financial and Insurance Clerks 5522 Credit and Loans Officers 55221 Credit or Loans
Officer 4 √ WE,
SC 4-5 √ 18
59 Other Clerical and Administrative Workers 599 Miscellaneous Clerical and
Administrative Workers
5993 Debt Collectors 59931 Debt Collector 4 √ WE,
LS 4 √ 5
5994 Human Resource Clerks 59941 Human
Resources Clerk 4 √ WE 4 √ 6
6 SALES WORKERS 61 Sales Representatives and Agents 611 Insurance Agents and Sales
Representatives
6113 Sales representatives 61135 Sales
Representatives 4 √ WS,
SC 4 √ 5
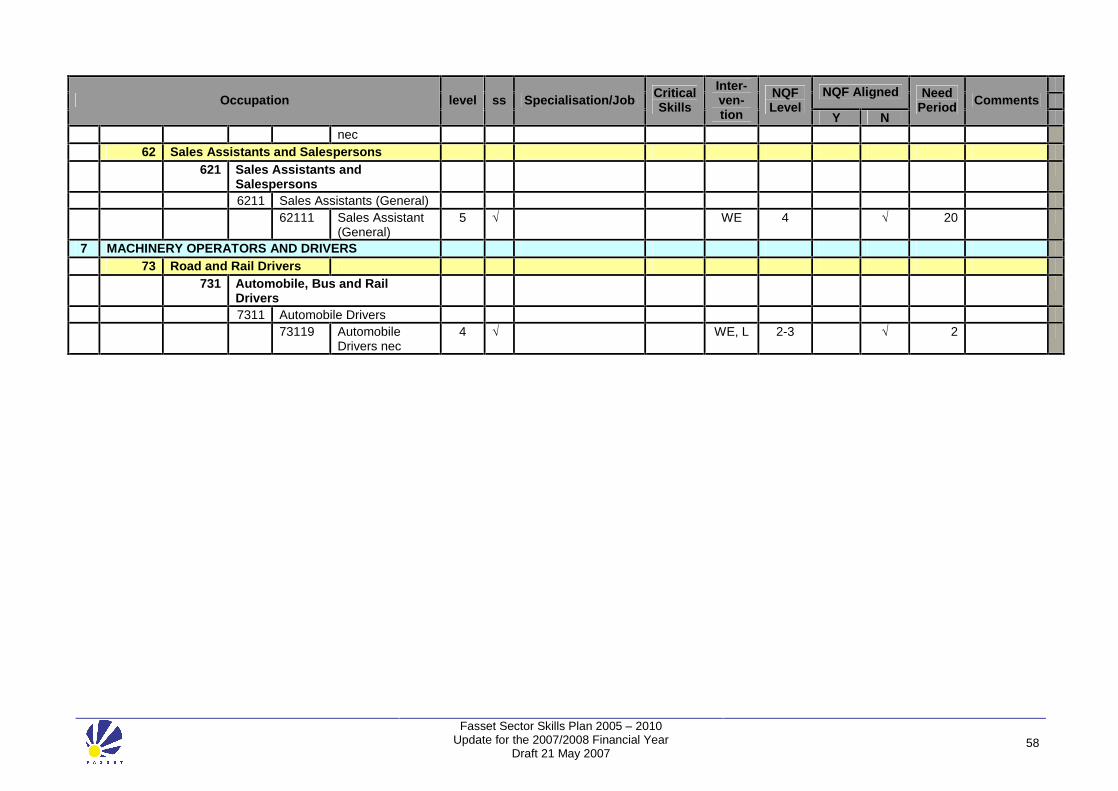
Fasset Sector Skills Plan 2005 � 2010 Update for the 2007/2008 Financial Year
Draft 21 May 2007 58
NQF Aligned Occupation level ss Specialisation/Job Critical
Skills
Inter-ven-tion
NQF Level
Y N
Need Period Comments
nec
62 Sales Assistants and Salespersons 621 Sales Assistants and
Salespersons
6211 Sales Assistants (General) 62111 Sales Assistant
(General) 5 √ WE 4 √ 20
7 MACHINERY OPERATORS AND DRIVERS 73 Road and Rail Drivers 731 Automobile, Bus and Rail
Drivers
7311 Automobile Drivers 73119 Automobile
Drivers nec 4 √ WE, L 2-3 √ 2