Icelandair Group Presentation of Q4 and FY 2017 Results · Presentation of Q4 and FY 2017 Results ....
38
Icelandair Group Presentation of Q4 and FY 2017 Results
Transcript of Icelandair Group Presentation of Q4 and FY 2017 Results · Presentation of Q4 and FY 2017 Results ....

Icelandair Group
Presentation of Q4 and FY 2017 Results
2
Highlights
Result in line
with last
EBITDA guidance:
USD 170.2 million
EBITDA
guidance
2018
USD 170-190
million
Continued
pressure on yield
Will yield development
follow higher fuel price
and other cost
increases?

Financials
Bogi Nils Bogason, CFO
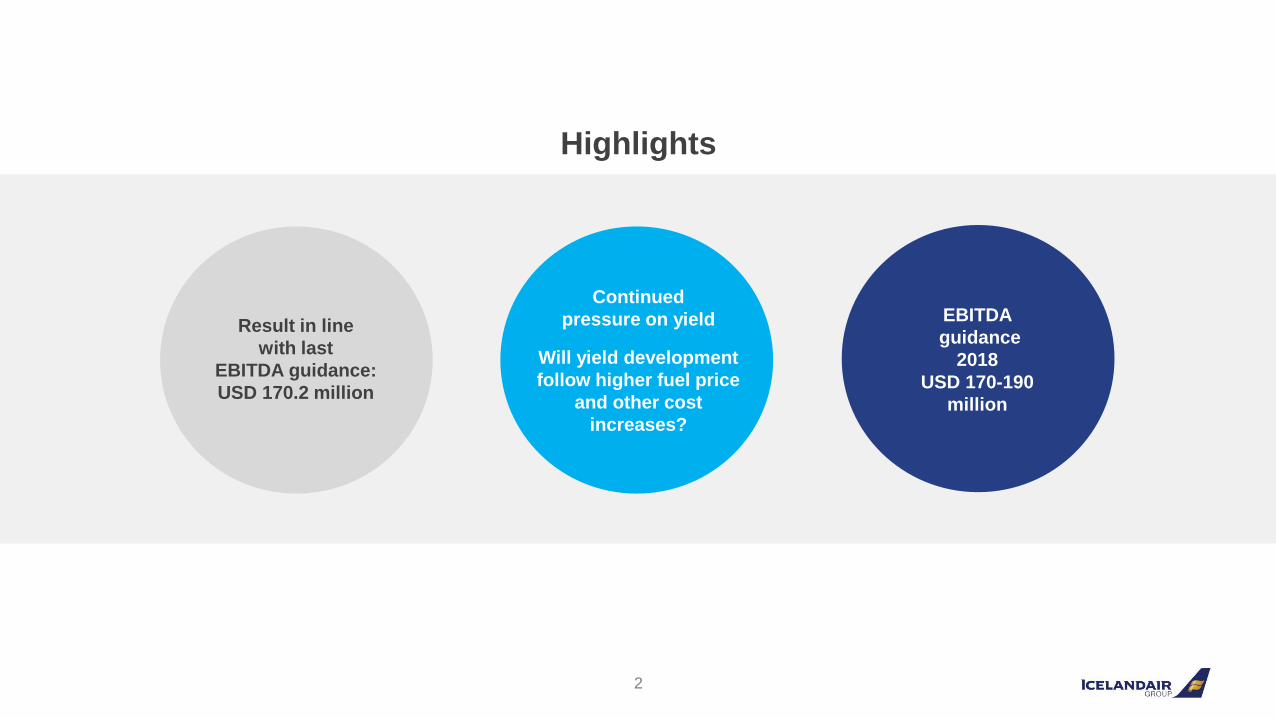
USD million Q4 2017 Q4 2016 % Chg.
Operating Income 292.2 256.5 14%
Salaries and related expenses 115.0 98.2 17%
Aircraft fuel 54.7 45.2 21%
Aircraft lease 5.7 5.4 7%
Aircraft handling, landing and comm. 29.2 21.1 39%
Aircraft maintenance expenses 20.5 17.0 21%
Other expenses 84.1 67.3 25%
Operating expenses 309.1 254.0 22%
EBITDA -16.9 2.5 -
EBIT -46.3 -24.4 -
EBT -48.1 -22.2 -
Loss for the period -40.0 -22.9 -
EBITDA ratio -5.8% 1.0% -6.7 ppt
EBITDAR -5.8 12.0 -
EBITDAR ratio -2.0% 4.7% -6.7 ppt
Higher fuel price, strike and restructuring cost main reason for lower Q4 results
4
EBITDA and loss | USD million
-16.9
2.5
22.9
-1.5
6.8
-40.0
-22.9
0.3
-15.0
-9.1
Q4 15 Q4 16Q4 14Q4 13 Q4 17
Net profit
EBITDA
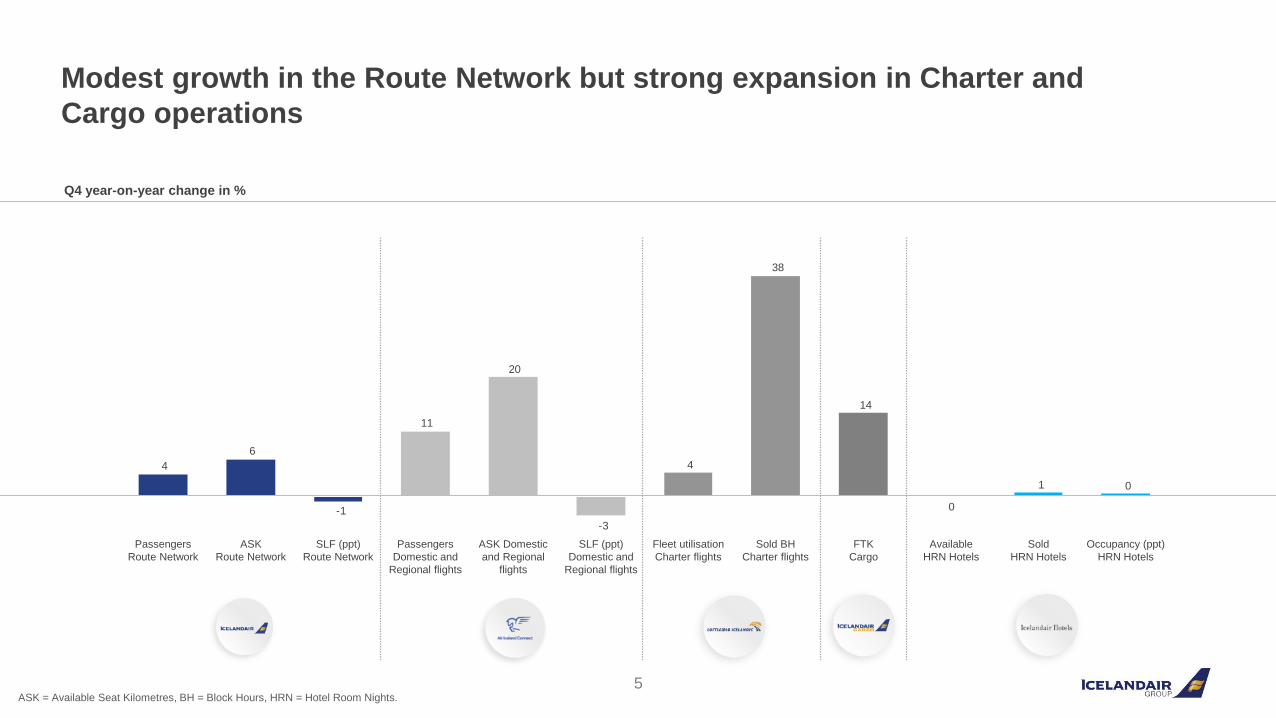
Modest growth in the Route Network but strong expansion in Charter and
Cargo operations
5
01
0
14
38
4
-3
20
11
-1
6
4
ASK
Route Network
Passengers
Route Network
Occupancy (ppt)
HRN Hotels
Fleet utilisation
Charter flights
SLF (ppt)
Route Network
Sold BH
Charter flights
Available
HRN Hotels
SLF (ppt)
Domestic and
Regional flights
ASK Domestic
and Regional
flights
Sold
HRN Hotels
FTK
Cargo
Passengers
Domestic and
Regional flights
Q4 year-on-year change in %
ASK = Available Seat Kilometres, BH = Block Hours, HRN = Hotel Room Nights.
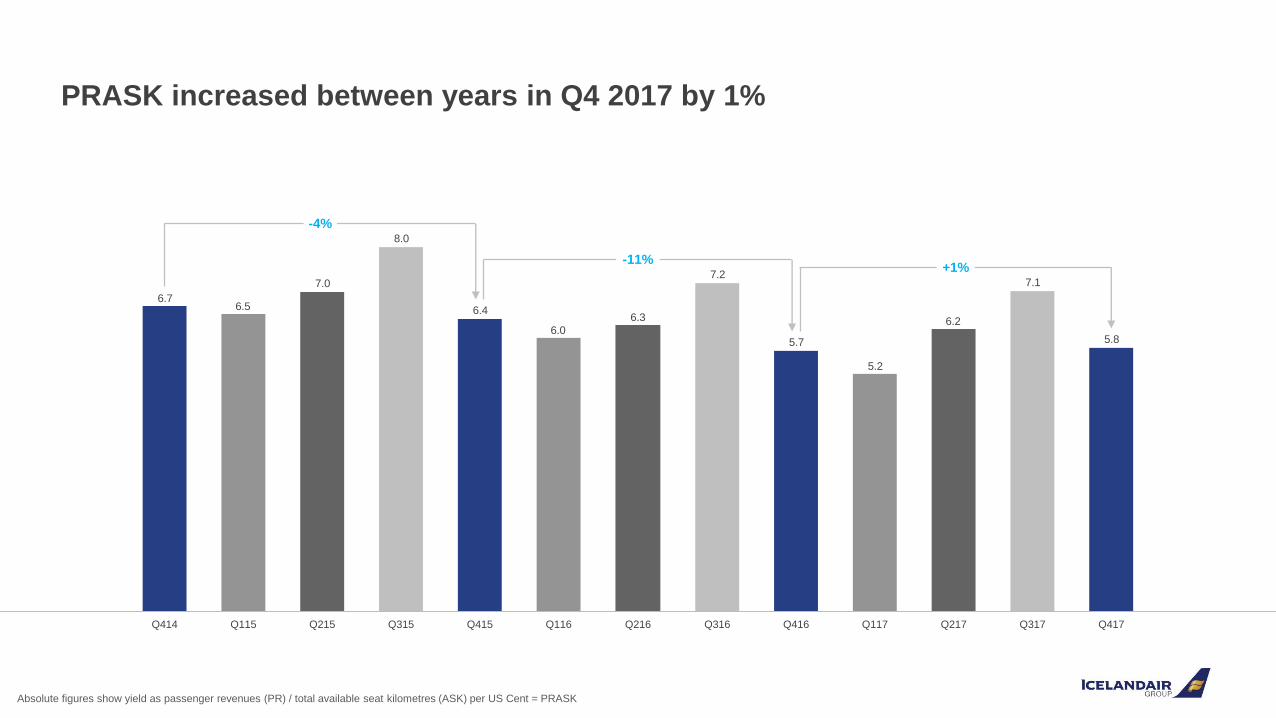
PRASK increased between years in Q4 2017 by 1%
Absolute figures show yield as passenger revenues (PR) / total available seat kilometres (ASK) per US Cent = PRASK
5.8
7.1
6.2
5.2
5.7
7.2
6.3
6.0
6.4
8.0
7.0
6.56.7
Q216 Q117Q316 Q417Q416
-4%
-11%
Q317Q217Q315 Q415 Q116Q115 Q215Q414
+1%
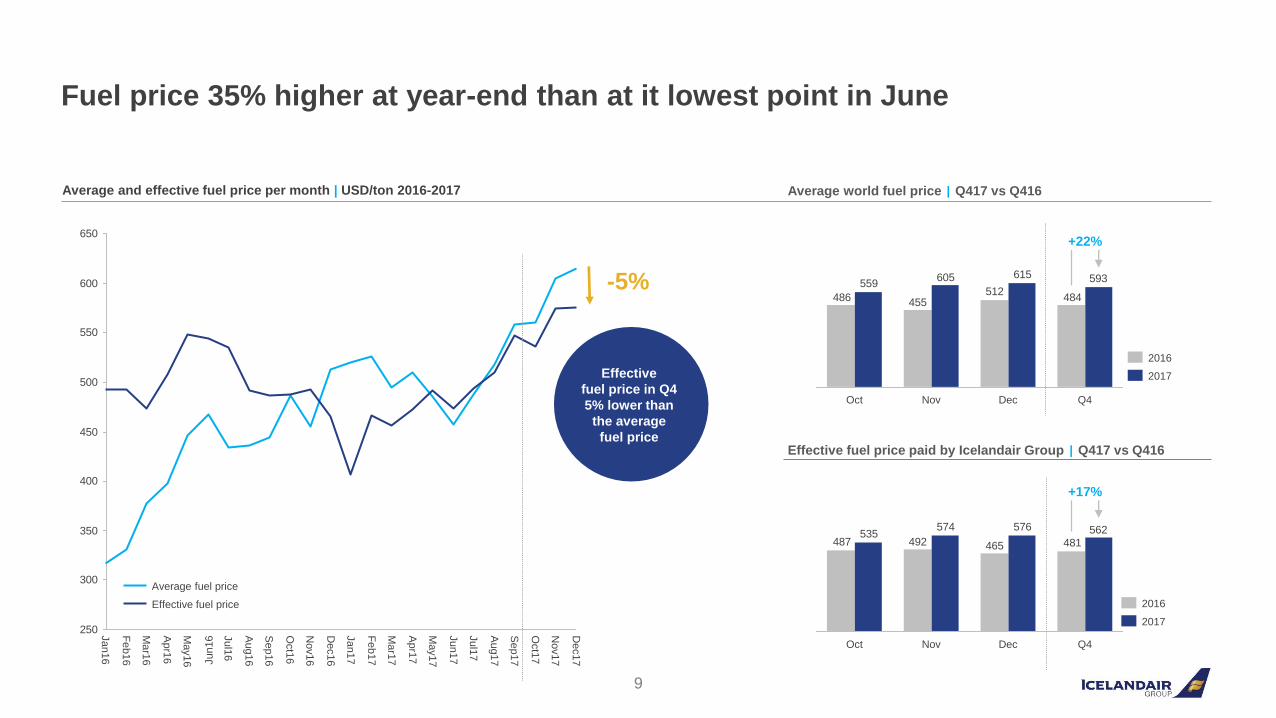
Fuel price 35% higher at year-end than at it lowest point in June
250
300
350
400
450
500
550
600
650
Dec17
Aug17
Oct1
7
Jul1
7
Nov17
Sep17
Jun17
Mar1
6
Apr1
7
Dec16
May17
May16
Oct1
6
Jan16
Jun16
Apr1
6
Jul1
6
Sep16
Fe
b17
Jan17
Nov16
Mar1
7
Fe
b16
Aug16
Average and effective fuel price per month | USD/ton 2016-2017
9
484512
455486
593615605559
Oct Nov Dec Q4
+22%
2017
2016
481465492487562576574
535
+17%
Q4Oct DecNov
2017
2016
Effective fuel price paid by Icelandair Group | Q417 vs Q416
Average world fuel price | Q417 vs Q416
Effective fuel price
Average fuel price
Effective
fuel price in Q4
5% lower than
the average
fuel price
-5%
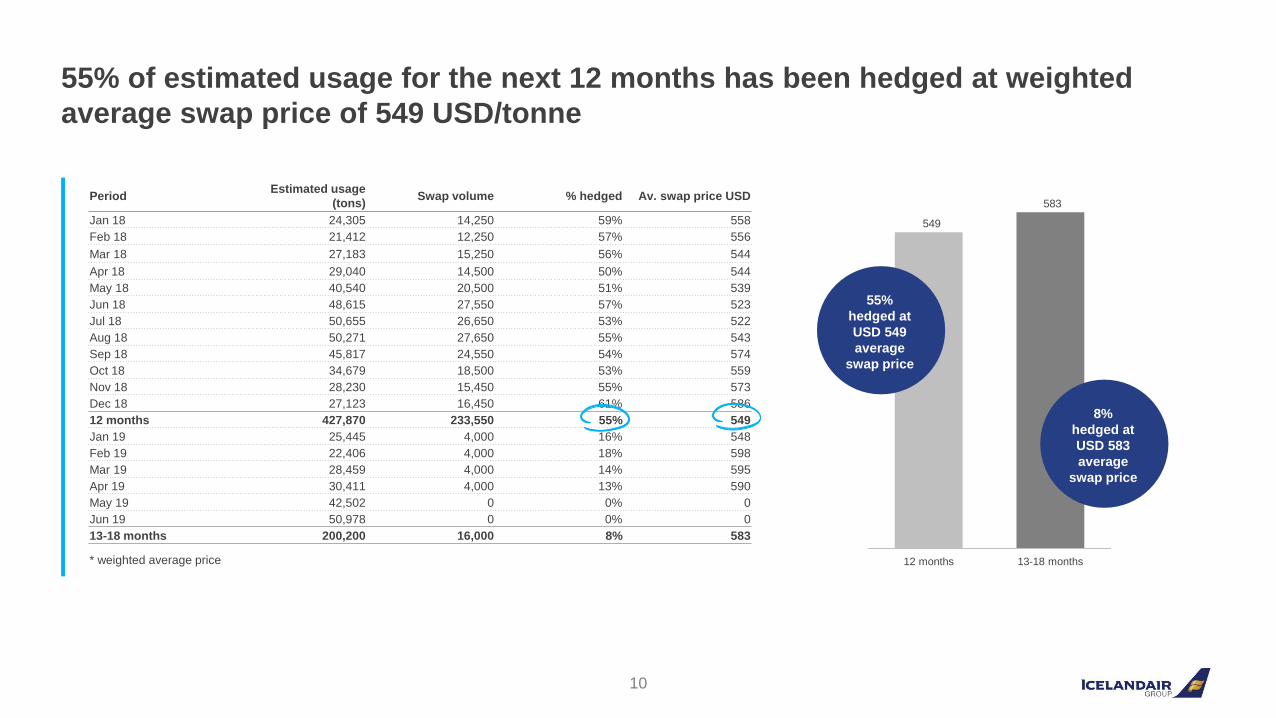
PeriodEstimated usage
(tons)Swap volume % hedged Av. swap price USD
Jan 18 24,305 14,250 59% 558
Feb 18 21,412 12,250 57% 556
Mar 18 27,183 15,250 56% 544
Apr 18 29,040 14,500 50% 544
May 18 40,540 20,500 51% 539
Jun 18 48,615 27,550 57% 523
Jul 18 50,655 26,650 53% 522
Aug 18 50,271 27,650 55% 543
Sep 18 45,817 24,550 54% 574
Oct 18 34,679 18,500 53% 559
Nov 18 28,230 15,450 55% 573
Dec 18 27,123 16,450 61% 586
12 months 427,870 233,550 55% 549
Jan 19 25,445 4,000 16% 548
Feb 19 22,406 4,000 18% 598
Mar 19 28,459 4,000 14% 595
Apr 19 30,411 4,000 13% 590
May 19 42,502 0 0% 0
Jun 19 50,978 0 0% 0
13-18 months 200,200 16,000 8% 583
* weighted average price
55% of estimated usage for the next 12 months has been hedged at weighted
average swap price of 549 USD/tonne
10
583
549
13-18 months12 months
55%
hedged at
USD 549
average
swap price
8%
hedged at
USD 583
average
swap price
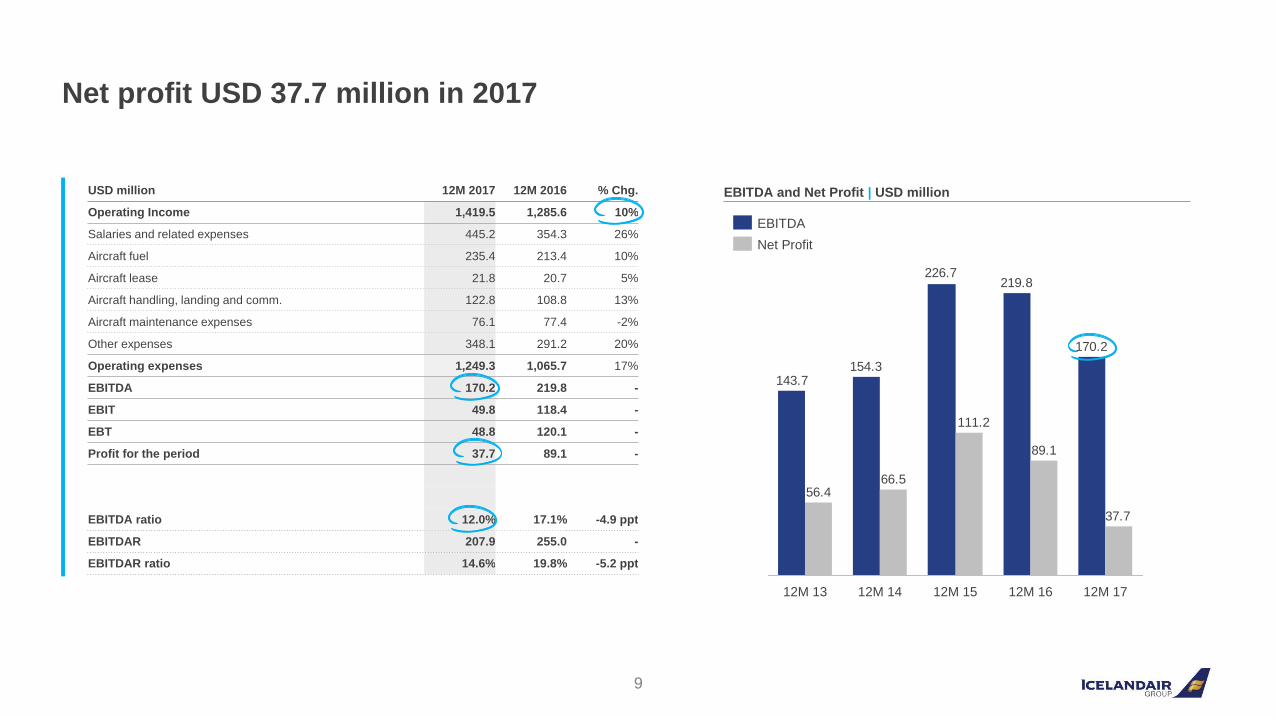
USD million 12M 2017 12M 2016 % Chg.
Operating Income 1,419.5 1,285.6 10%
Salaries and related expenses 445.2 354.3 26%
Aircraft fuel 235.4 213.4 10%
Aircraft lease 21.8 20.7 5%
Aircraft handling, landing and comm. 122.8 108.8 13%
Aircraft maintenance expenses 76.1 77.4 -2%
Other expenses 348.1 291.2 20%
Operating expenses 1,249.3 1,065.7 17%
EBITDA 170.2 219.8 -
EBIT 49.8 118.4 -
EBT 48.8 120.1 -
Profit for the period 37.7 89.1 -
EBITDA ratio 12.0% 17.1% -4.9 ppt
EBITDAR 207.9 255.0 -
EBITDAR ratio 14.6% 19.8% -5.2 ppt
Net profit USD 37.7 million in 2017
EBITDA and Net Profit | USD million
170.2
219.8226.7
154.3143.7
37.7
89.1
111.2
66.556.4
12M 1712M 14 12M 15 12M 1612M 13
EBITDA
Net Profit
9
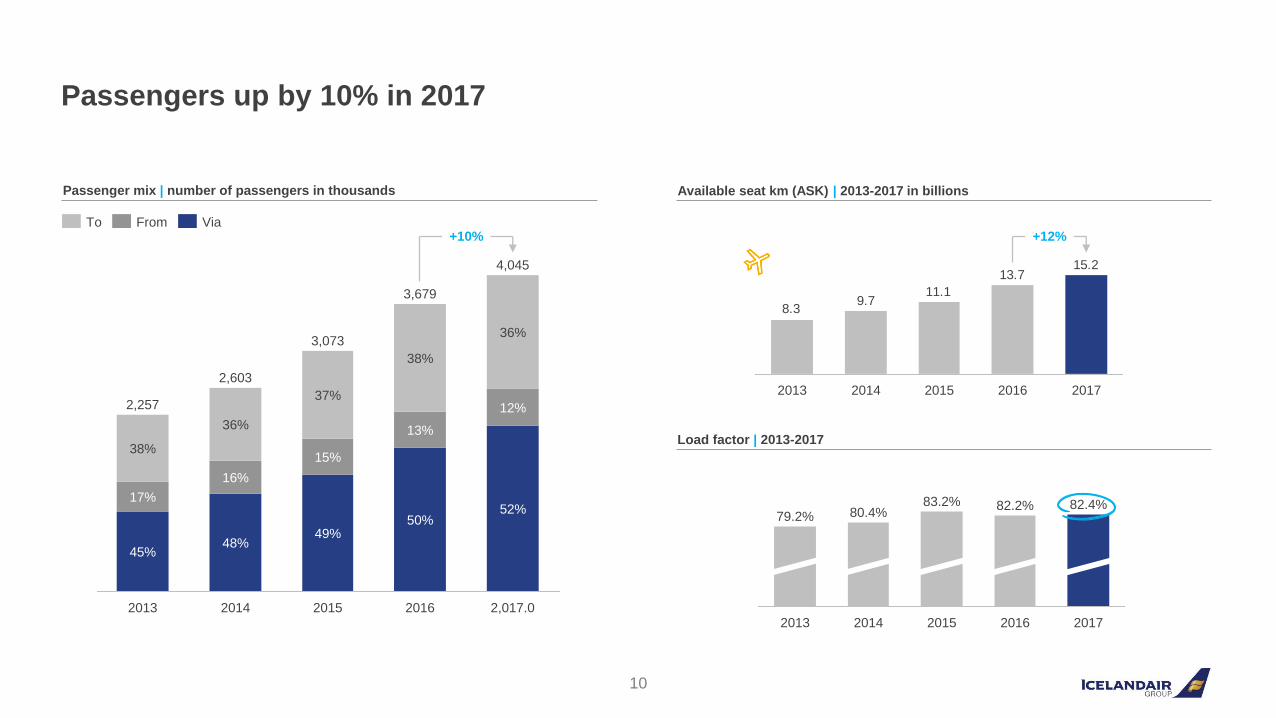
Passengers up by 10% in 2017
49%
37%
48%
2014
2,257
38%
2,603
36%
3,073
2013 2016
45%
38%
3,679
50%
2015
13%
52%
2,017.0
36%
15%
+10%
12%
4,045
16%
17%
FromTo Via
10
15.213.7
11.19.7
8.3
+12%
20172016201520142013
2013 201720152014
82.4%
2016
80.4%83.2%
79.2%82.2%
Passenger mix | number of passengers in thousands Available seat km (ASK) | 2013-2017 in billions
Load factor | 2013-2017
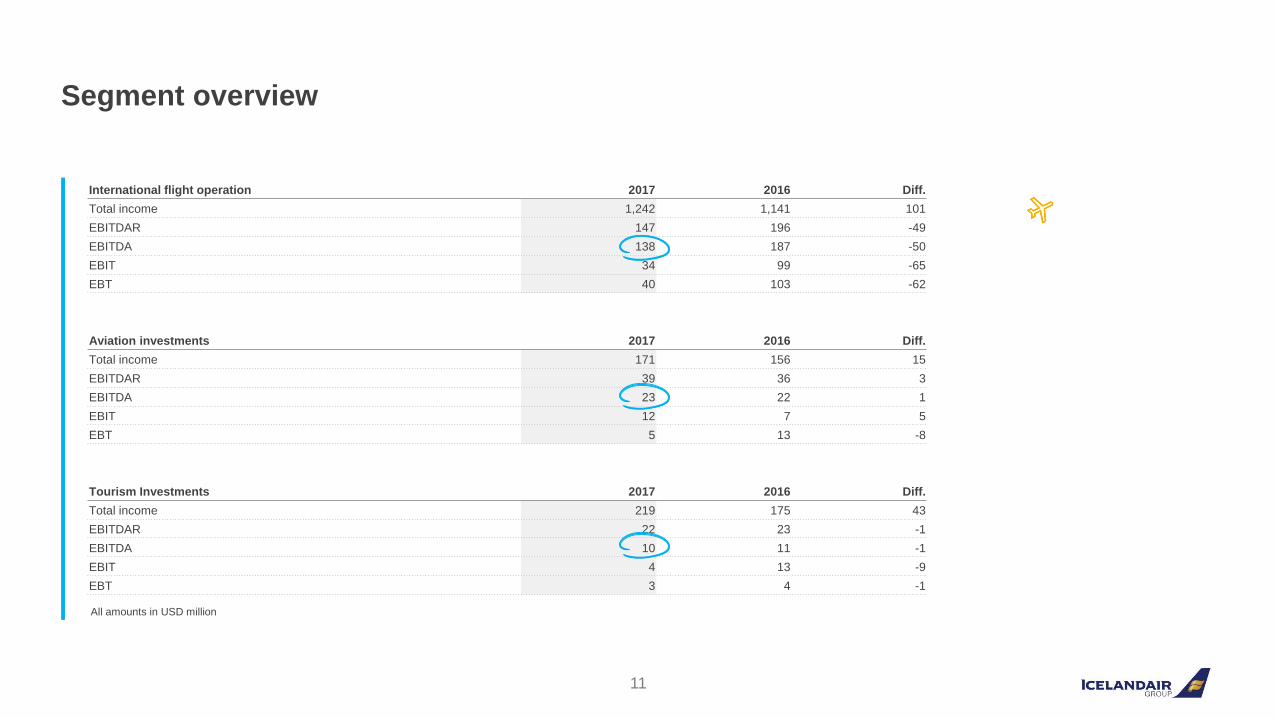
Segment overview
11
International flight operation 2017 2016 Diff.
Total income 1,242 1,141 101
EBITDAR 147 196 -49
EBITDA 138 187 -50
EBIT 34 99 -65
EBT 40 103 -62
Aviation investments 2017 2016 Diff.
Total income 171 156 15
EBITDAR 39 36 3
EBITDA 23 22 1
EBIT 12 7 5
EBT 5 13 -8
Tourism Investments 2017 2016 Diff.
Total income 219 175 43
EBITDAR 22 23 -1
EBITDA 10 11 -1
EBIT 4 13 -9
EBT 3 4 -1
All amounts in USD million
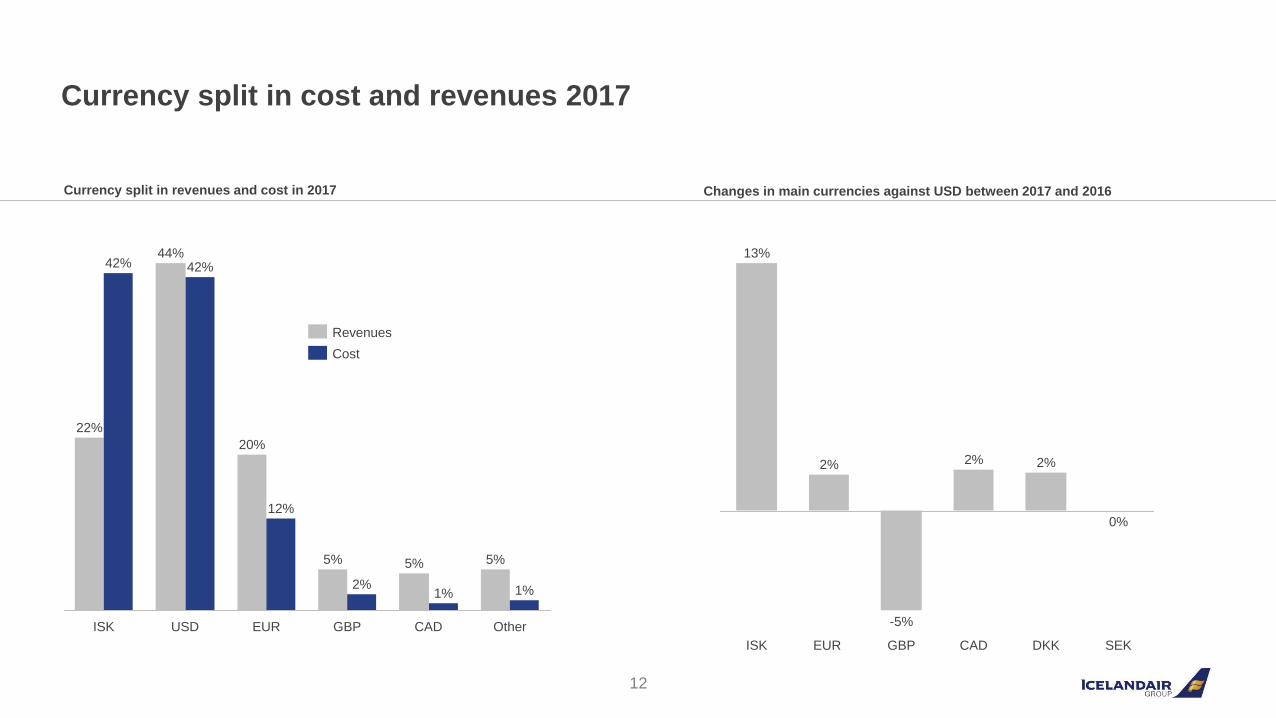
Currency split in cost and revenues 2017
12
GBPISK USD EUR
20%
5%
OtherCAD
44%
5%
22%
42% 42%
12%
5%
1%2%1%
Revenues
Cost
CADISK EUR GBP DKK
0%
13%
2%
-5%
2% 2%
SEK
Currency split in revenues and cost in 2017 Changes in main currencies against USD between 2017 and 2016
13
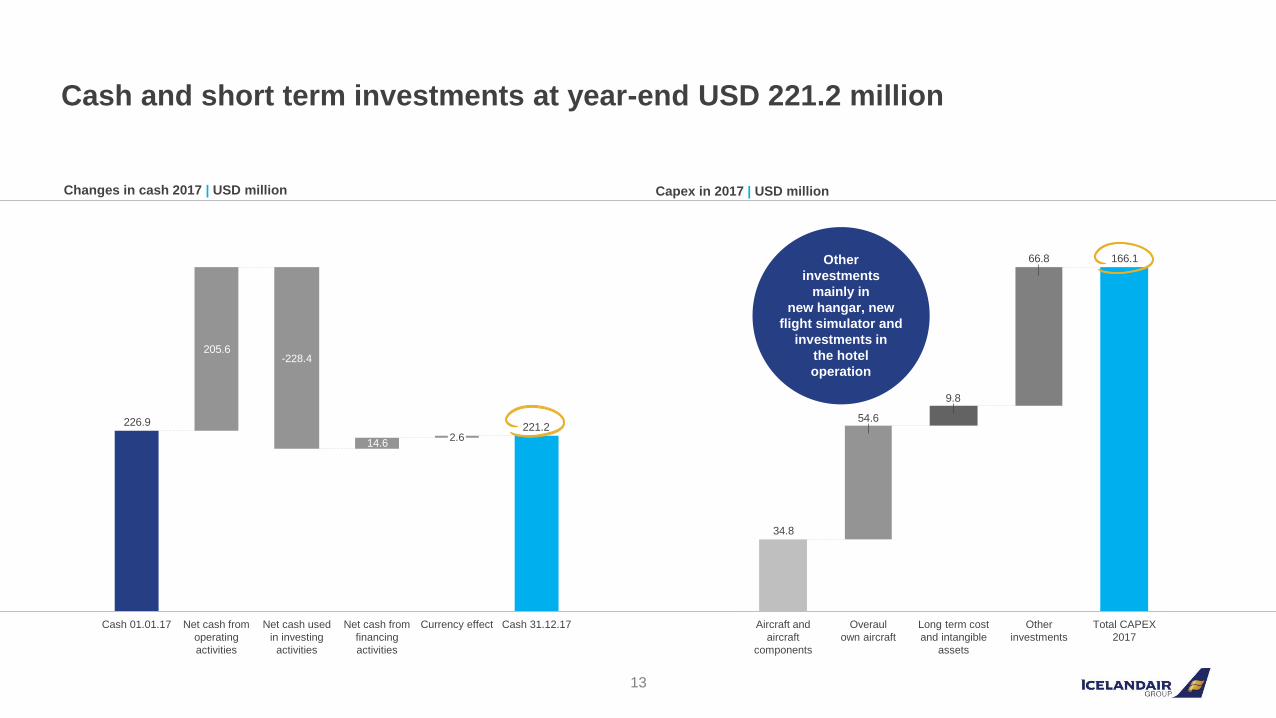
Cash and short term investments at year-end USD 221.2 million
Changes in cash 2017 | USD million
14.6
221.2226.9
205.6
Net cash used
in investing
activities
-228.4
Net cash from
operating
activities
Cash 01.01.17 Cash 31.12.17Currency effect
2.6
Net cash from
financing
activities
166.166.8
9.8
54.6
34.8
Total CAPEX
2017
Other
investments
Long term cost
and intangible
assets
Overaul
own aircraft
Aircraft and
aircraft
components
Capex in 2017 | USD million
Other
investments
mainly in
new hangar, new
flight simulator and
investments in
the hotel
operation
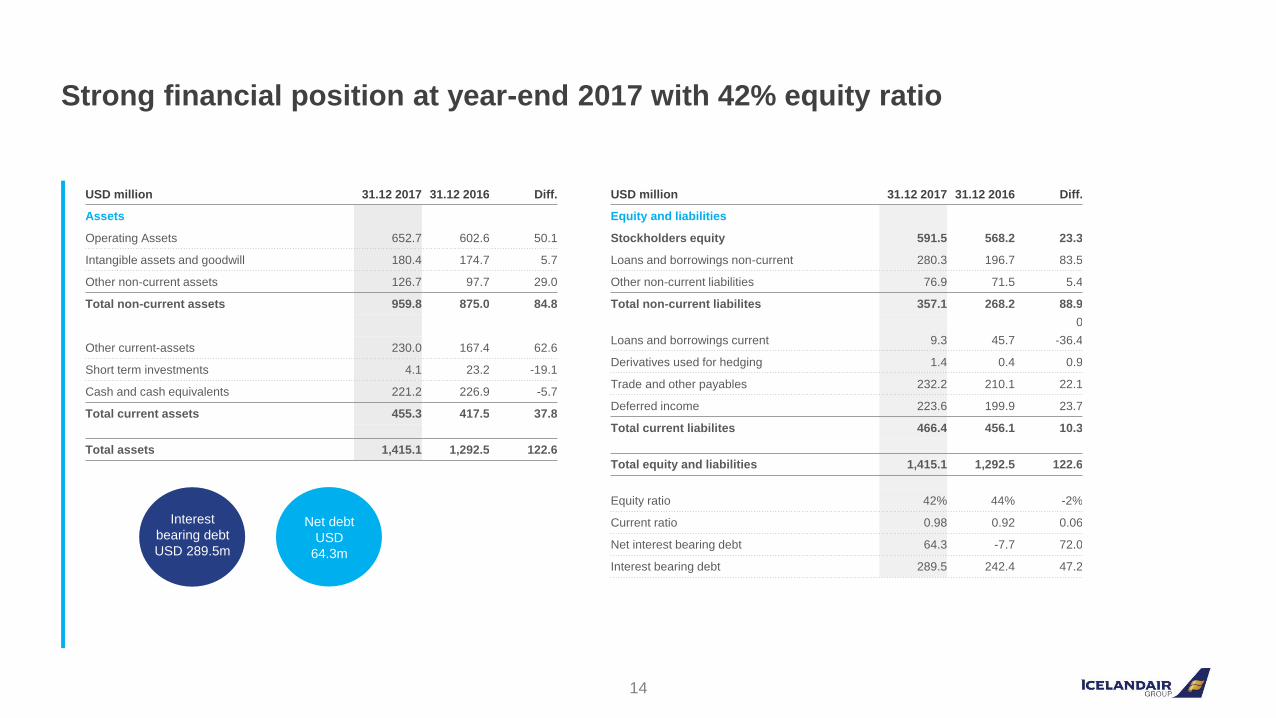
Strong financial position at year-end 2017 with 42% equity ratio
14
Interest
bearing debt
USD 289.5m
Net debt
USD
64.3m
USD million 31.12 2017 31.12 2016 Diff.
Assets
Operating Assets 652.7 602.6 50.1
Intangible assets and goodwill 180.4 174.7 5.7
Other non-current assets 126.7 97.7 29.0
Total non-current assets 959.8 875.0 84.8
Other current-assets 230.0 167.4 62.6
Short term investments 4.1 23.2 -19.1
Cash and cash equivalents 221.2 226.9 -5.7
Total current assets 455.3 417.5 37.8
Total assets 1,415.1 1,292.5 122.6
USD million 31.12 2017 31.12 2016 Diff.
Equity and liabilities
Stockholders equity 591.5 568.2 23.3
Loans and borrowings non-current 280.3 196.7 83.5
Other non-current liabilities 76.9 71.5 5.4
Total non-current liabilites 357.1 268.2 88.9
0
Loans and borrowings current 9.3 45.7 -36.4
Derivatives used for hedging 1.4 0.4 0.9
Trade and other payables 232.2 210.1 22.1
Deferred income 223.6 199.9 23.7
Total current liabilites 466.4 456.1 10.3
Total equity and liabilities 1,415.1 1,292.5 122.6
Equity ratio 42% 44% -2%
Current ratio 0.98 0.92 0.06
Net interest bearing debt 64.3 -7.7 72.0
Interest bearing debt 289.5 242.4 47.2
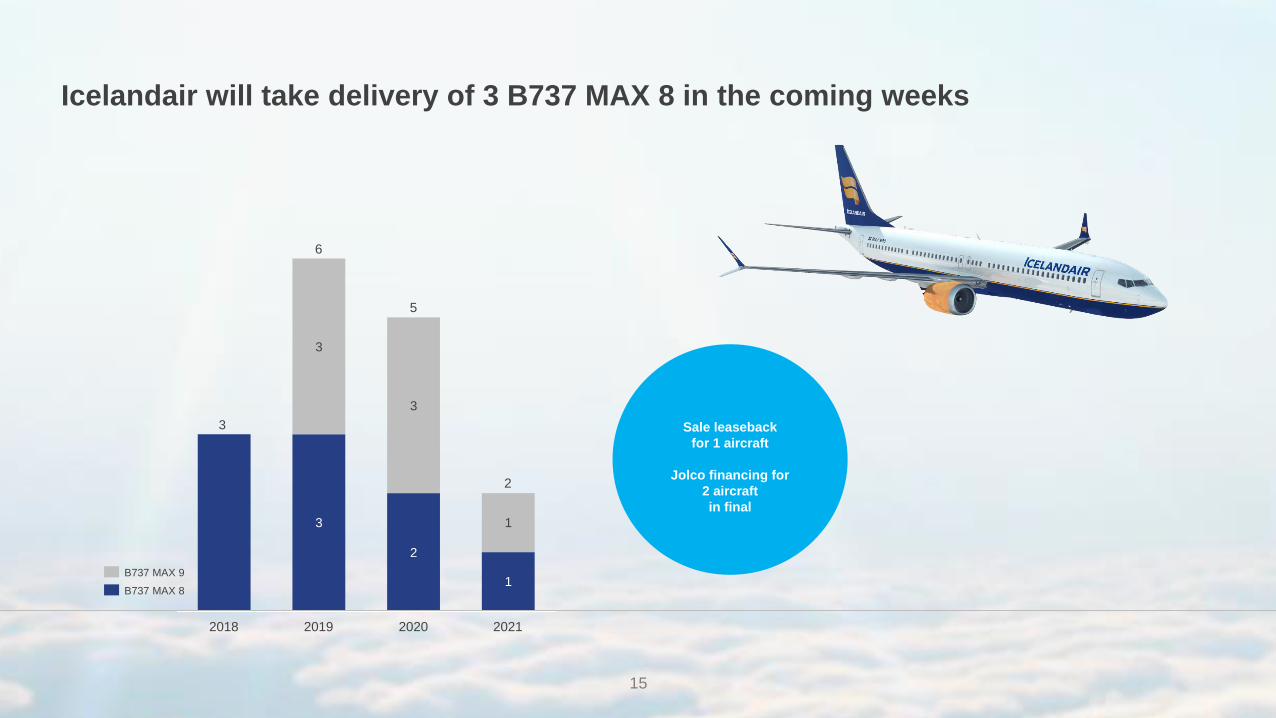
15
3
2
1
3
3
1
3
2
5
6
2021202020192018
B737 MAX 8
B737 MAX 9
Sale leaseback
for 1 aircraft
Jolco financing for
2 aircraft
in final
Icelandair will take delivery of 3 B737 MAX 8 in the coming weeks
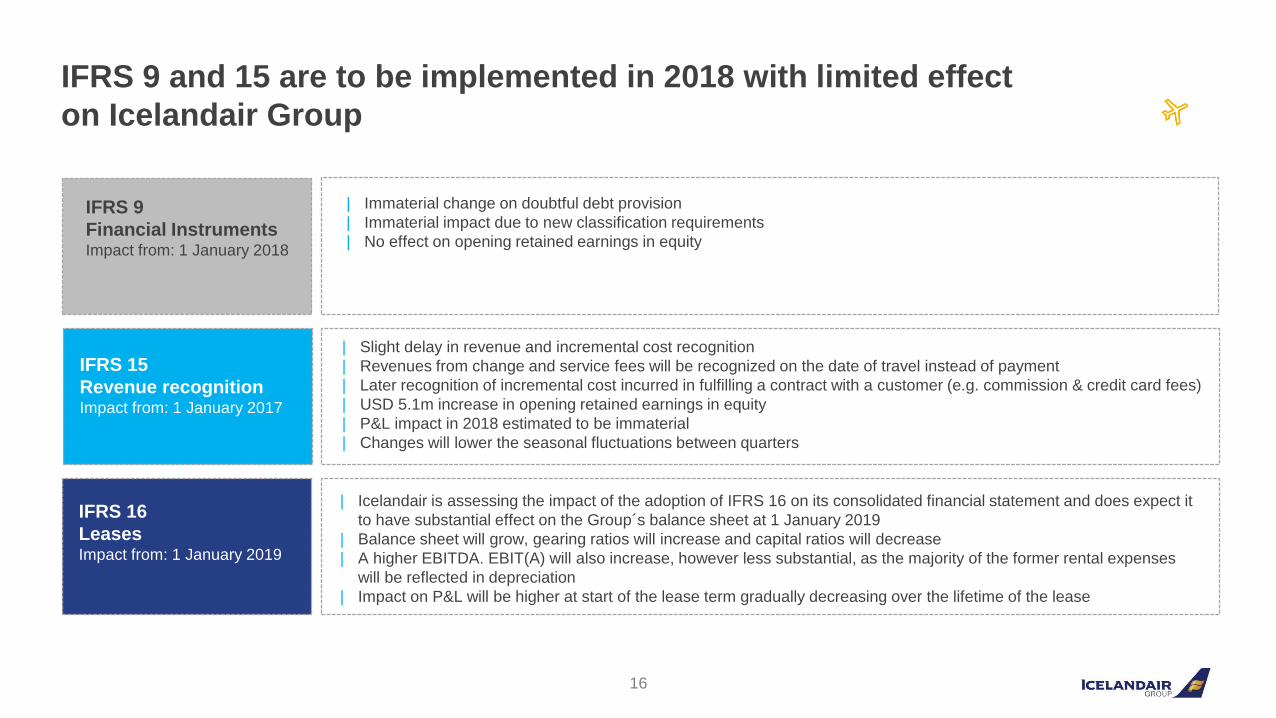
IFRS 9 and 15 are to be implemented in 2018 with limited effect
on Icelandair Group
16
| Immaterial change on doubtful debt provision
| Immaterial impact due to new classification requirements
| No effect on opening retained earnings in equity
| Slight delay in revenue and incremental cost recognition
| Revenues from change and service fees will be recognized on the date of travel instead of payment
| Later recognition of incremental cost incurred in fulfilling a contract with a customer (e.g. commission & credit card fees)
| USD 5.1m increase in opening retained earnings in equity
| P&L impact in 2018 estimated to be immaterial
| Changes will lower the seasonal fluctuations between quarters
IFRS 9
Financial InstrumentsImpact from: 1 January 2018
| Icelandair is assessing the impact of the adoption of IFRS 16 on its consolidated financial statement and does expect it
to have substantial effect on the Group´s balance sheet at 1 January 2019
| Balance sheet will grow, gearing ratios will increase and capital ratios will decrease
| A higher EBITDA. EBIT(A) will also increase, however less substantial, as the majority of the former rental expenses
will be reflected in depreciation
| Impact on P&L will be higher at start of the lease term gradually decreasing over the lifetime of the lease
IFRS 15
Revenue recognitionImpact from: 1 January 2017
IFRS 16
LeasesImpact from: 1 January 2019

Outlook
Björgólfur Jóhannsson, President and CEO
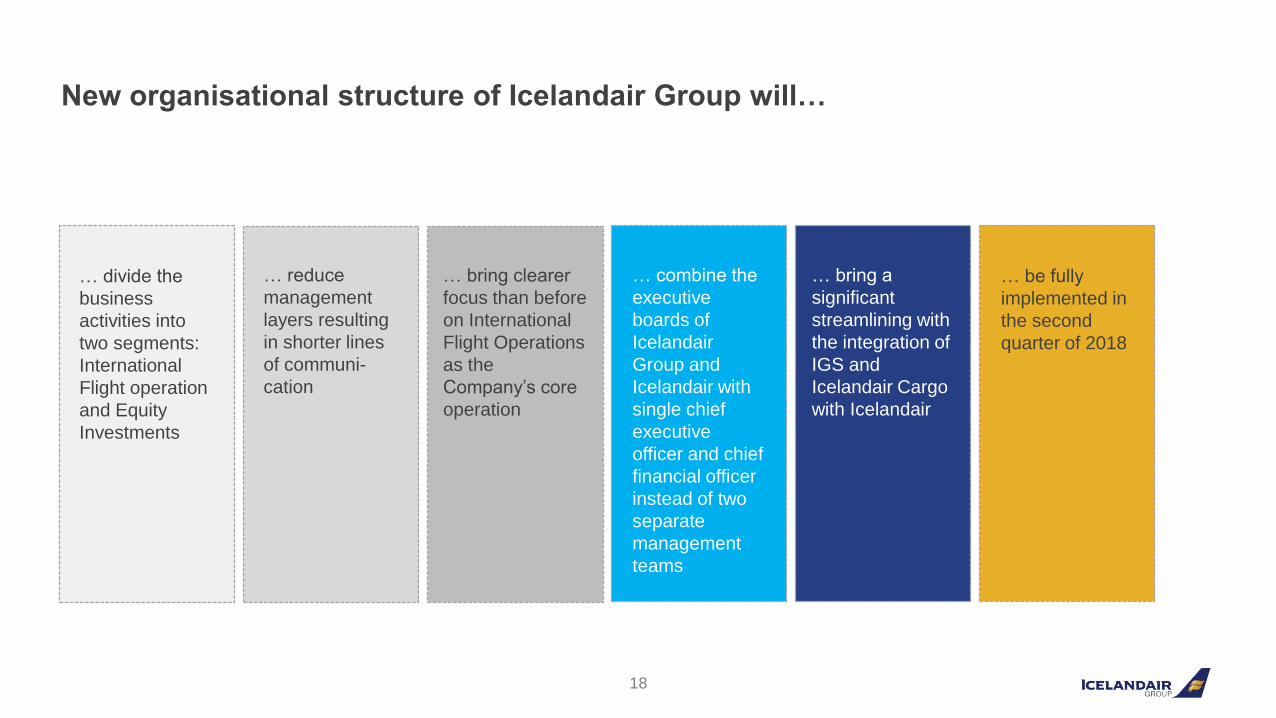
New organisational structure of Icelandair Group will…
18
… bring clearer
focus than before
on International
Flight Operations
as the
Company’s core
operation
… combine the
executive
boards of
Icelandair
Group and
Icelandair with
single chief
executive
officer and chief
financial officer
instead of two
separate
management
teams
… bring a
significant
streamlining with
the integration of
IGS and
Icelandair Cargo
with Icelandair
… be fully
implemented in
the second
quarter of 2018
… reduce
management
layers resulting
in shorter lines
of communi-
cation
… divide the
business
activities into
two segments:
International
Flight operation
and Equity
Investments
19
Chief Pilot
Director Cabin
Director Crew Planning
Director Training
Director Cam
Director Maintenance
Director Finance/Resources
Director Material
Director PM
Director Dev
Director Ground Ops
Director Network Control
VP flight Ops
VP Technical Ops
VP Ground Ops
VP Efficiency
Director Quality/Safety/Security
Director Finance
Director Emergency Responses
Simulator
Director Ground Ops
Director Training
Director Quality
Director HR
Director Kitchen/Catering
SV
P F
lig
ht
Op
s I
ce
lan
dair
S
VP
IG
S
Director
Flight
Director
Cabin
Director
Technical
Director
Maintenance
Director
Ground Handling KEF
Director
Outstations
Director
Training
Director
Quality/Safety/Security
Director
Operations Support
Director
Kitchen
CO
O I
ce
lan
dair
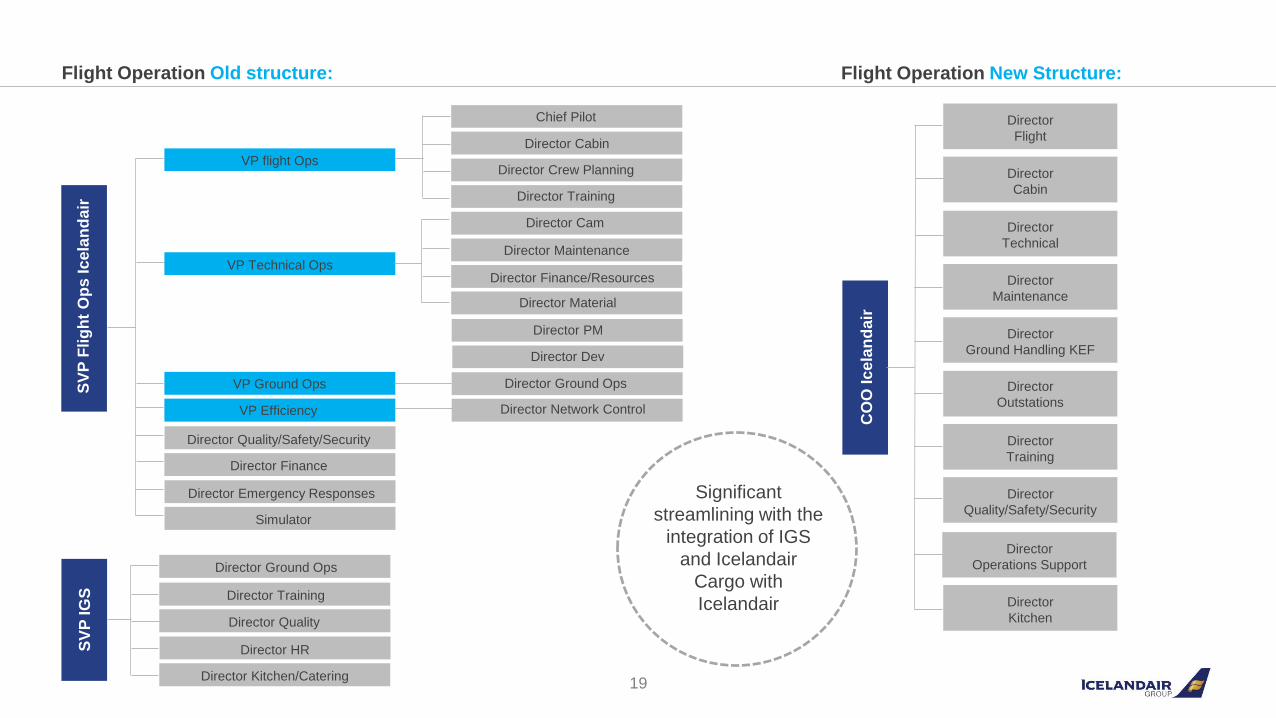
Flight Operation Old structure: Flight Operation New Structure:
Significant
streamlining with the
integration of IGS
and Icelandair
Cargo with
Icelandair
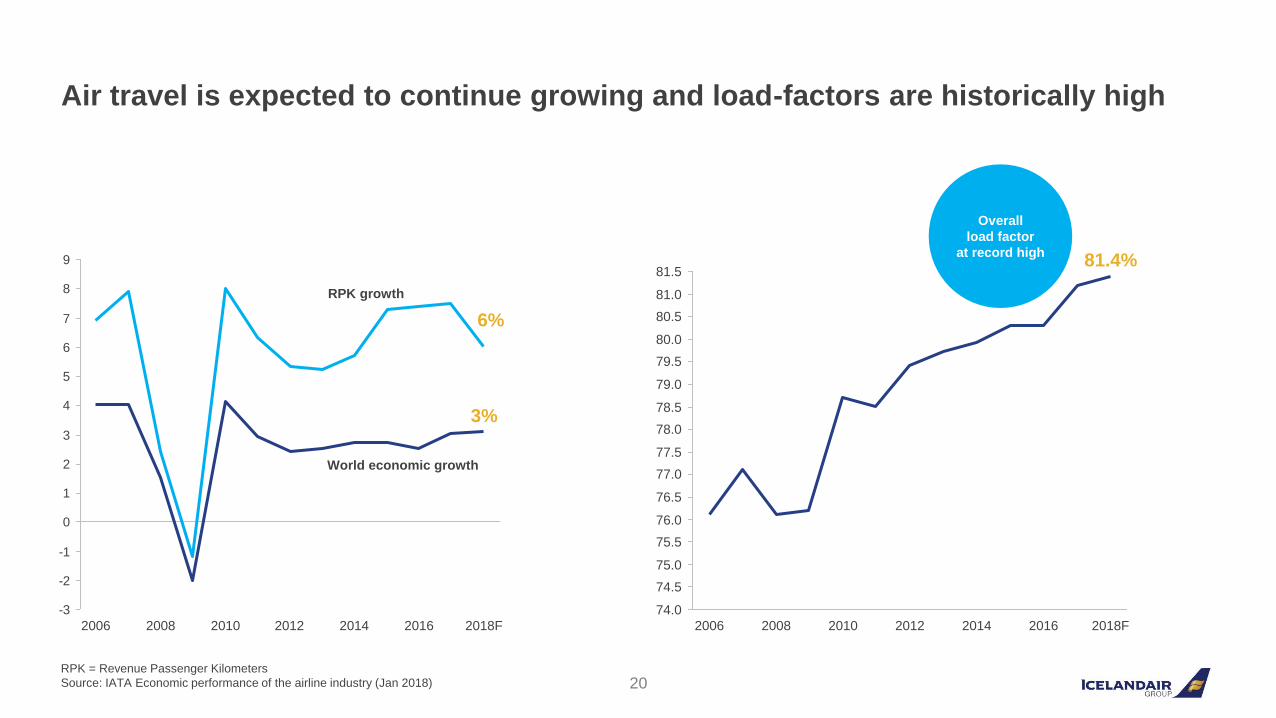
Air travel is expected to continue growing and load-factors are historically high
20
-3
-2
-1
0
1
2
3
4
5
6
7
8
9
20162012 201420102006 2018F2008
3%
6%
RPK = Revenue Passenger Kilometers
Source: IATA Economic performance of the airline industry (Jan 2018)
RPK growth
World economic growth
79.5
80.5
81.5
77.5
75.5
74.5
76.5
78.5
79.0
80.0
81.0
75.0
77.0
78.0
74.0
76.0
201420122006 2010 2018F2008 2016
81.4%
Overall
load factor
at record high

Rising fuel price – will it push yields upwards in the second half of the year?
21
280
300
320
340
360
380
400
420
440
460
480
500
520
540
560
580
600
620
640
1.3.20161.9.20151.3.2015 1.5.2015 1.11.20161.11.2015 1.3.20171.5.2016 1.9.2016 1.5.2017 1.9.2017 1.11.20171.1.2015 1.1.20181.7.20161.7.2015 1.1.2016 1.1.2017 1.7.2017
Source: Thomson Reuters
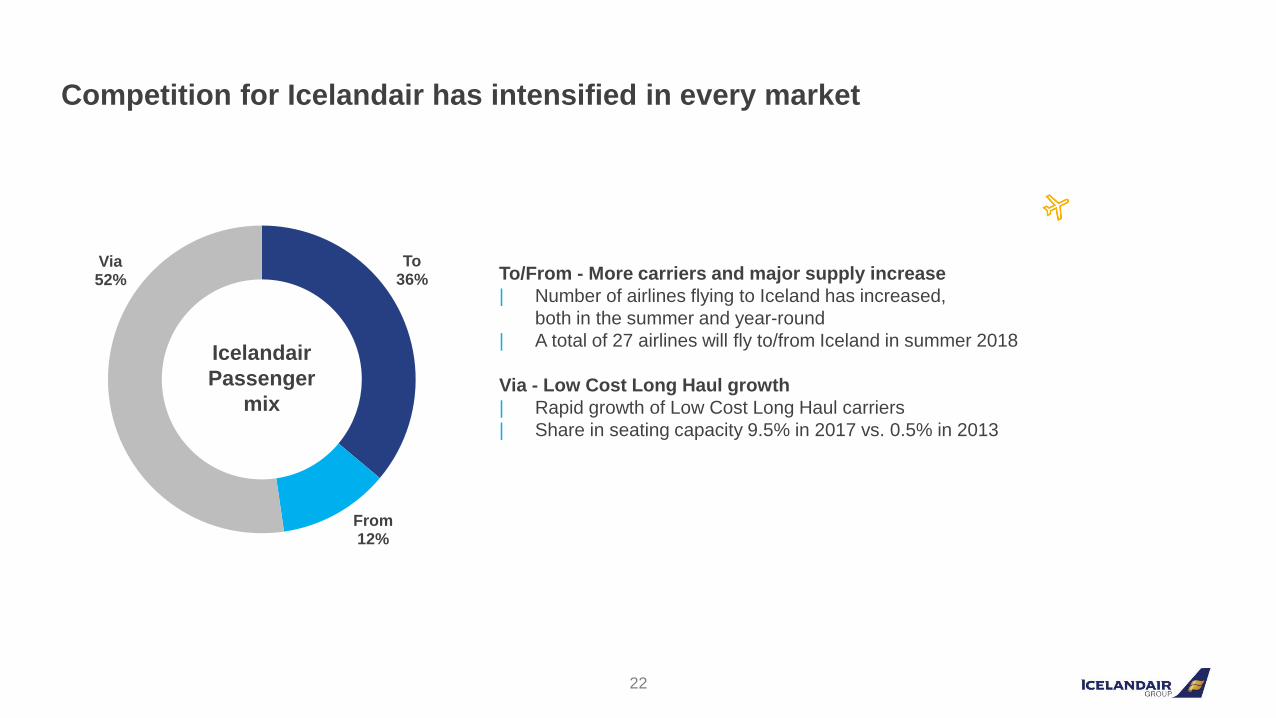
To36%
From12%
Via52%
Competition for Icelandair has intensified in every market
22
To/From - More carriers and major supply increase
| Number of airlines flying to Iceland has increased,
both in the summer and year-round
| A total of 27 airlines will fly to/from Iceland in summer 2018
Via - Low Cost Long Haul growth
| Rapid growth of Low Cost Long Haul carriers
| Share in seating capacity 9.5% in 2017 vs. 0.5% in 2013
Icelandair
Passenger
mix
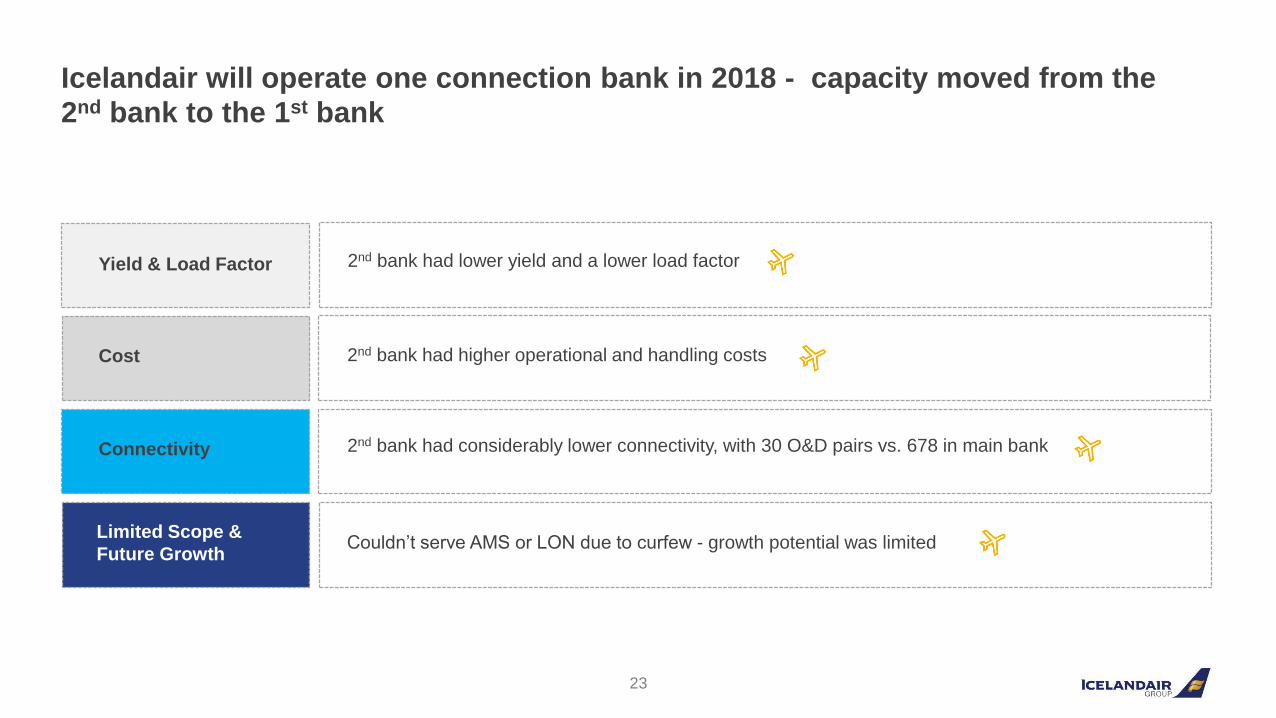
Icelandair will operate one connection bank in 2018 - capacity moved from the
2nd bank to the 1st bank
23
2nd bank had lower yield and a lower load factor
2nd bank had higher operational and handling costs
2nd bank had considerably lower connectivity, with 30 O&D pairs vs. 678 in main bank
Couldn’t serve AMS or LON due to curfew - growth potential was limited
Yield & Load Factor
Cost
Connectivity
Limited Scope &
Future Growth
Future Growth
24
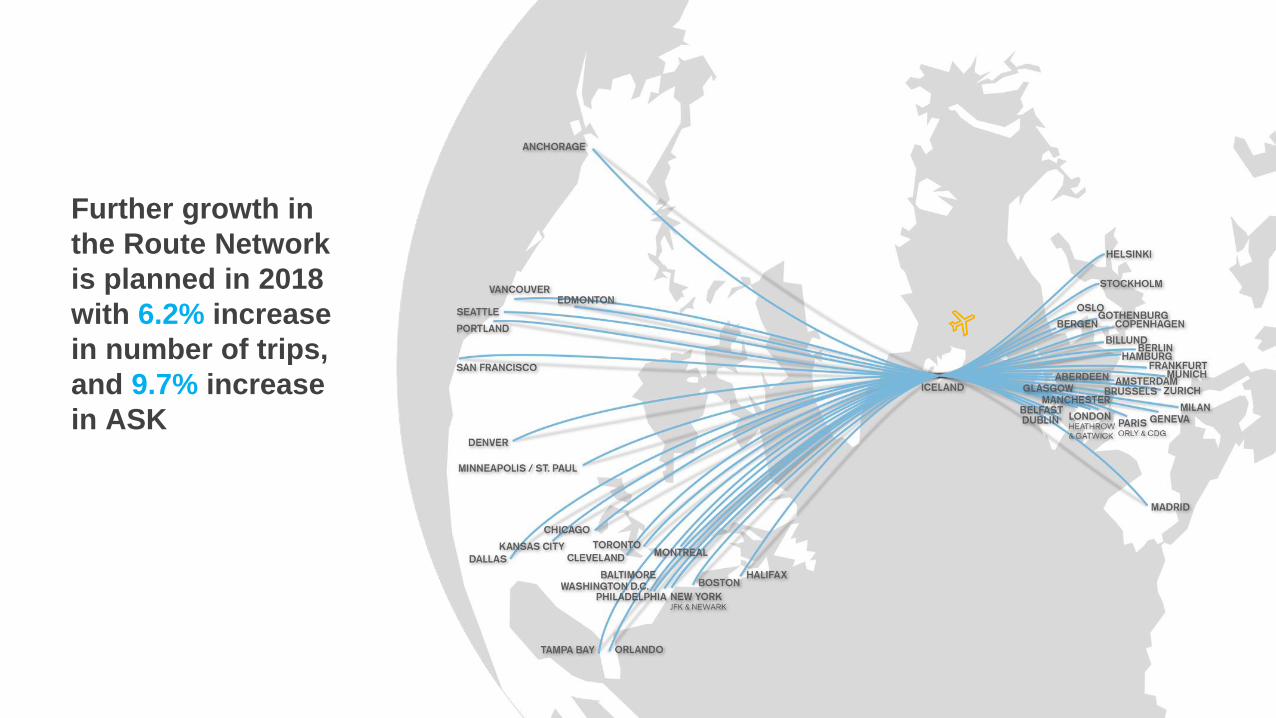
Further growth in
the Route Network
is planned in 2018
with 6.2% increase
in number of trips,
and 9.7% increase
in ASK

6new destinations

San Fransico
SAN FRANSISCO4 FLIGHTS PER WEEK
Kansas City
KANSAS CITY3 FLIGHTS PER WEEK

Baltimore
BALTIMORE4 FLIGHTS PER WEEK

CLEVELAND4 FLIGHTS PER WEEK

Dallas
DALLAS4 FLIGHTS PER WEEK

Dublin
DUBLIN6 FLIGHTS PER WEEK
0%0%0%0%
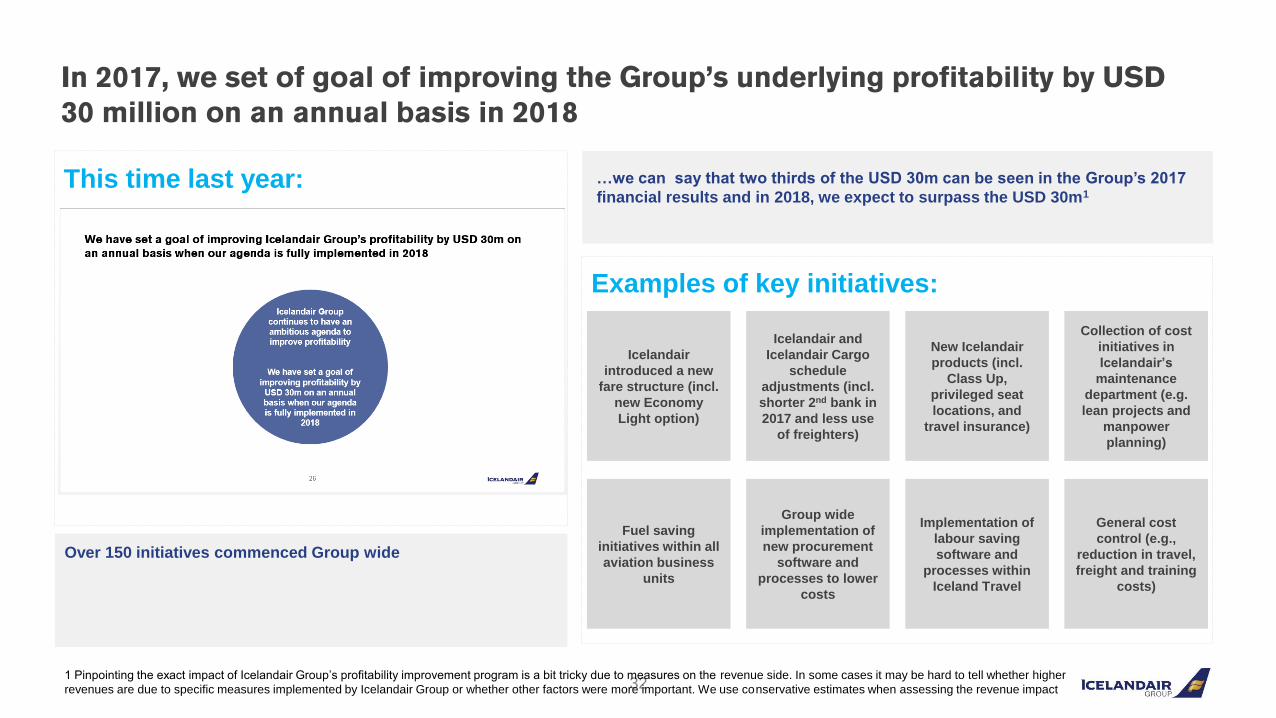
In 2017, we set of goal of improving the Group’s underlying profitability by USD
30 million on an annual basis in 2018
32
Over 150 initiatives commenced Group wide
…we can say that two thirds of the USD 30m can be seen in the Group’s 2017
financial results and in 2018, we expect to surpass the USD 30m1
1 Pinpointing the exact impact of Icelandair Group’s profitability improvement program is a bit tricky due to measures on the revenue side. In some cases it may be hard to tell whether higher
revenues are due to specific measures implemented by Icelandair Group or whether other factors were more important. We use conservative estimates when assessing the revenue impact
Examples of key initiatives:
This time last year:
Icelandair
introduced a new
fare structure (incl.
new Economy
Light option)
Icelandair and
Icelandair Cargo
schedule
adjustments (incl.
shorter 2nd bank in
2017 and less use
of freighters)
New Icelandair
products (incl.
Class Up,
privileged seat
locations, and
travel insurance)
Collection of cost
initiatives in
Icelandair’s
maintenance
department (e.g.
lean projects and
manpower
planning)
Fuel saving
initiatives within all
aviation business
units
Group wide
implementation of
new procurement
software and
processes to lower
costs
Implementation of
labour saving
software and
processes within
Iceland Travel
General cost
control (e.g.,
reduction in travel,
freight and training
costs)
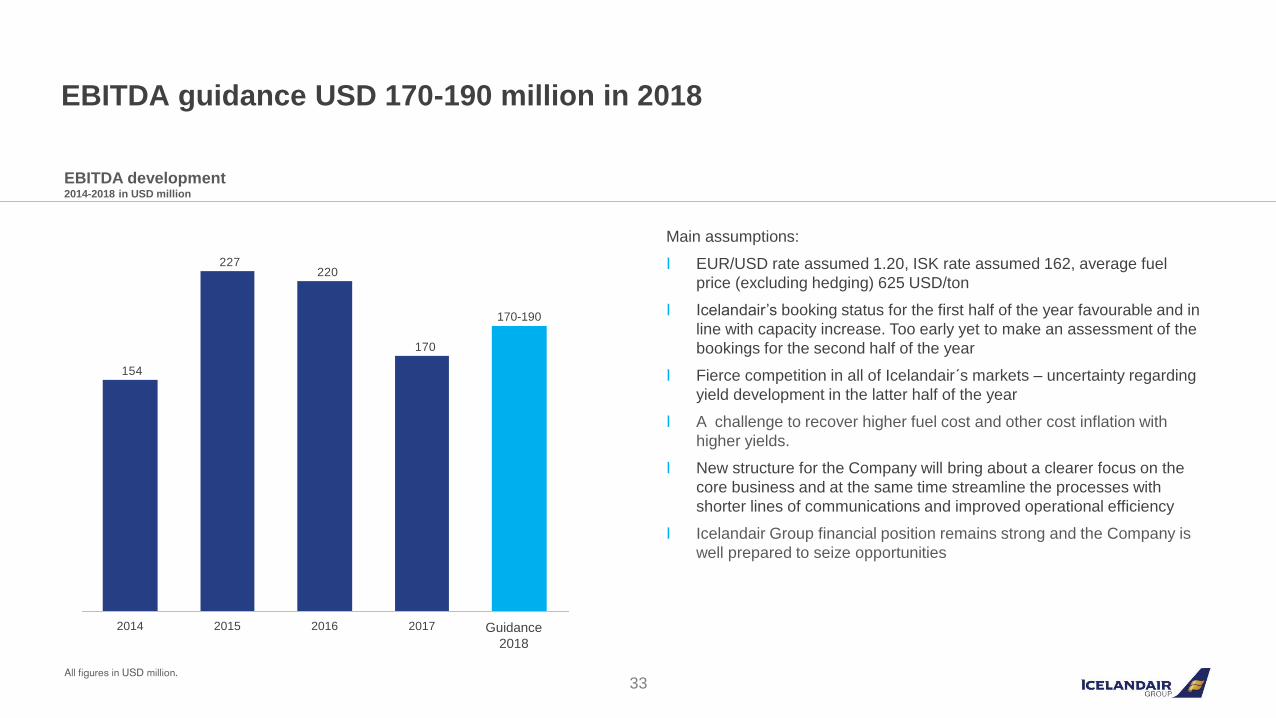
33All figures in USD million.
170
220227
154
20172016
170-190
2014 2015 Guidance
2018
EBITDA guidance USD 170-190 million in 2018
Main assumptions:
Ι EUR/USD rate assumed 1.20, ISK rate assumed 162, average fuel
price (excluding hedging) 625 USD/ton
Ι Icelandair’s booking status for the first half of the year favourable and in
line with capacity increase. Too early yet to make an assessment of the
bookings for the second half of the year
Ι Fierce competition in all of Icelandair´s markets – uncertainty regarding
yield development in the latter half of the year
Ι A challenge to recover higher fuel cost and other cost inflation with
higher yields.
Ι New structure for the Company will bring about a clearer focus on the
core business and at the same time streamline the processes with
shorter lines of communications and improved operational efficiency
Ι Icelandair Group financial position remains strong and the Company is
well prepared to seize opportunities
EBITDA development2014-2018 in USD million
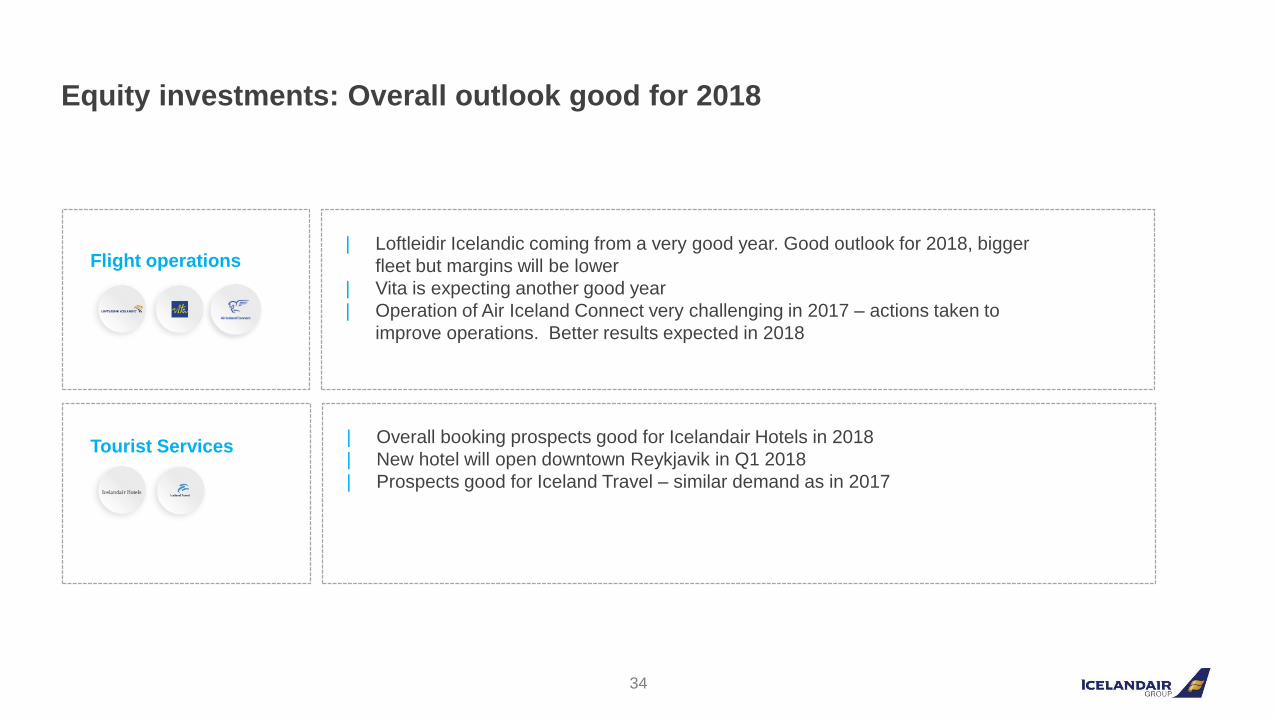
Equity investments: Overall outlook good for 2018
34
Flight operations
Tourist Services
| Loftleidir Icelandic coming from a very good year. Good outlook for 2018, bigger
fleet but margins will be lower
| Vita is expecting another good year
| Operation of Air Iceland Connect very challenging in 2017 – actions taken to
improve operations. Better results expected in 2018
| Overall booking prospects good for Icelandair Hotels in 2018
| New hotel will open downtown Reykjavik in Q1 2018
| Prospects good for Iceland Travel – similar demand as in 2017
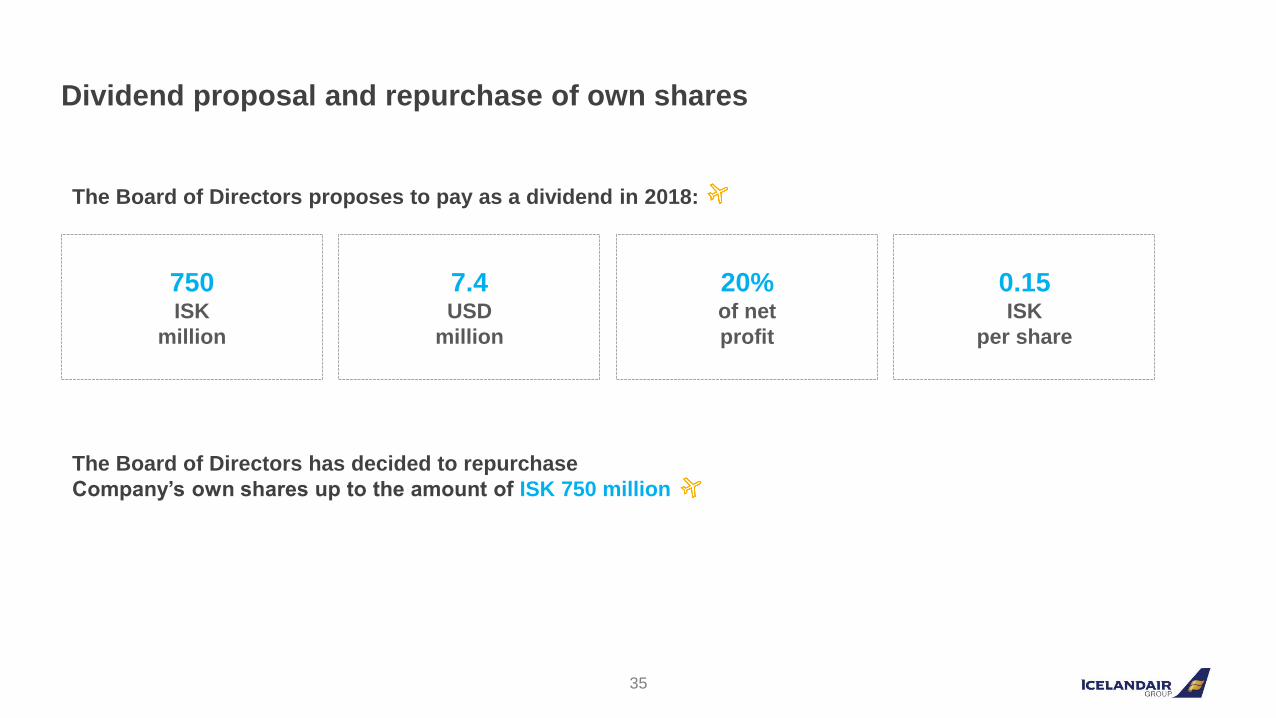
Dividend proposal and repurchase of own shares
35
The Board of Directors proposes to pay as a dividend in 2018:
20%of net
profit
750ISK
million
7.4USD
million
0.15ISK
per share
The Board of Directors has decided to repurchase
Company’s own shares up to the amount of ISK 750 million

36
Strong
financial
position…
Growth opportunities
within and beyond
current network…
More
certainty regarding
unions…
Leaner and simplified
organisational
structure…
…enables Icelandair Group to generate
long term profitable growth
Disclaimer
37
| This material has been prepared by Icelandair Group hf. It may include confidential information about Icelandair Group hf. unless stated otherwise all
information is sourced by Icelandair Group hf.
| The circulation of the information contained within this document may be restricted in some jurisdictions. It is the responsibility of the individual to comply with
any such jurisdictional restrictions.
| Forecasts, by their very nature, are subject to uncertainty and contingencies, many of which are outside the control of Icelandair Group. Past performance
should not be viewed as a guide to future performance. Where amounts involve a foreign currency, they may be subject to fluctuations in value due to
movements in exchange rates.
| Icelandair Group cannot guarantee that the information contained herein is without fault or entirely accurate. The information in this material is based on
sources that Icelandair Group believes to be reliable. Neither Icelandair Group nor any of its directors or employees can however warrant that all information
is correct. Furthermore, information and opinions may change without notice. Icelandair Group is under no obligation to make amendments or changes to this
presentation if errors are found or opinions or information change. Icelandair Group accepts no responsibility for the accuracy of its sources or information
provided herein and therefore can neither Icelandair Group nor any of its directors or employees be held responsible in any way for the contents of this
document.
| This document must not be construed as investment advice or an offer to invest.
| Icelandair Group is the owner of all works of authorship including, but not limited to, all design, test, sound recordings, images and trademarks in this material
unless otherwise explicitly stated. The use of Icelandair Group´s material, works or trademarks is forbidden without written consent except where otherwise
expressly stated.
| Furthermore, it is prohibited to publish, copy, reproduce or distribute further the material made or gathered by Icelandair Group without the company‘s explicit
written consent.

Icelandair Group
Reykjavík Airport
101 Reykjavík Iceland
Tel: +354 50 50 300
Copyright © Icelandair Group
All rights reserved.