IBM Research Reportdomino.watson.ibm.com/library/CyberDig.nsf/papers/BCD4ED19B6BD... · IBM...
31
RC22292 (W0201-025) January 3, 2002 Materials Science IBM Research Report Thermal Transformation of ZrO2, HfO2, and Al2O3 Mixed Oxide Films Deposited by Chemical Solution Deposition Deborah Neumayer, Eduard Cartier IBM Research Division Thomas J. Watson Research Center P.O. Box 218 Yorktown Heights, NY 10598 Research Division Almaden - Austin - Beijing - Delhi - Haifa - India - T. J. Watson - Tokyo - Zurich LIMITED DISTRIBUTION NOTICE: This report has been submitted for publication outside of IBM and will probably be copyrighted if accepted for publication. It has been issued as a Research Report for early dissemination of its contents. In view of the transfer of copyright to the outside publisher, its distribution outside of IBM prior to publication should be limited to peer communications and specific requests. After outside publication, requests should be filled only by reprints or legally obtained copies of the article (e.g. , payment of royalties). Copies may be requested from IBM T. J. Watson Research Center , P. O. Box 218, Yorktown Heights, NY 10598 USA (email: [email protected]). Some reports are available on the internet at http://domino.watson.ibm.com/library/CyberDig.nsf/home .
-
Upload
hoangduong -
Category
Documents
-
view
227 -
download
0
Transcript of IBM Research Reportdomino.watson.ibm.com/library/CyberDig.nsf/papers/BCD4ED19B6BD... · IBM...
RC22292 (W0201-025) January 3, 2002Materials Science
IBM Research Report
Thermal Transformation of ZrO2, HfO2, and Al2O3 MixedOxide Films Deposited by Chemical Solution Deposition
Deborah Neumayer, Eduard CartierIBM Research Division
Thomas J. Watson Research CenterP.O. Box 218
Yorktown Heights, NY 10598
Research DivisionAlmaden - Austin - Beijing - Delhi - Haifa - India - T. J. Watson - Tokyo - Zurich
LIMITED DISTRIBUTION NOTICE: This report has been submitted for publication outside of IBM and will probably be copyrighted if accepted for publication. It has been issued as a Research Reportfor early dissemination of its contents. In view of the transfer of copyright to the outside publisher, its distribution outside of IBM prior to publication should be limited to peer communications and specific requests.After outside publication, requests should be filled only by reprints or legally obtained copies of the article (e.g. , payment of royalties). Copies may be requested from IBM T. J. Watson Research Center , P. O. Box 218, Yorktown Heights, NY 10598 USA (email: [email protected]). Some reports are available on the internet at http://domino.watson.ibm.com/library/CyberDig.nsf/home .
THERMAL TRANSFORMATION OF ZRO2, HFO2 AND AL2O3 MIXED OXIDE
FILMS DEPOSITED BY CHEMICAL SOLUTION DEPOSITION
DEBORAH A. NEUMAYER, E. CARTIER, IBM, T.J. Watson Research Center, P.O. Box 218, Yorktown Heights, NY 10598
ABSTRACT
The thermal stability, and microstructure of zirconium aluminum oxide (ZAO) and hafnium
aluminum oxide (HAO) mixed oxides were evaluated. The films were prepared by chemical
solution deposition (CSD) using a solution prepared from zirconium, or hafnium butoxyethoxide,
and aluminum butoxyethoxide dissolved in butoxyethanol. The films were spun onto SiOxNy
coated Si wafers and furnace annealed at temperatures from 500-1200 oC in oxygen for 30
minutes. The microstructure and electrical properties of ZAO and HAO films were examined as
a function of Zr/Al and Hf/Al ratio and annealing temperature. The films were characterized by
X-ray diffraction, FTIR, RBS and AES. Crystallization/phase separation of ZrO2 and HfO2 in
ZAO and HAO films was observed to be concentration and annealing temperature dependent. At
low (<25%) ZrO2 or HfO2 concentrations at anneal temperatures less than 900 oC, an amorphous
γ-alumina like material was observed in the ZAO and HAO films. Phase partitioning of the ZAO
and HAO films was observed at higher ZrO2 or HfO2 concentrations and at higher anneal
temperatures. Addition of Al2O3 to ZrO2 or HfO2 was found to increase the crystallization
temperature of tetraganol ZrO2, enable the formation of the tetragonal HfO2 phase and increase
the annealing temperature at which transformation of the tetragonal to monoclinic phase of ZrO2
or HfO2 is observed. Transformation from the tetragonal to the monoclinic phase was observed
to occur more readily at lower temperatures in HAO films than ZAO films. Evidence of
enhanced oxygen conduction at elevated temperatures was observed for 90% Hf 10% Al mixed
oxide films.1
INTRODUCTION
In the quest for improved performance, CMOS circuits are becoming denser and the CMOS
devices smaller. The most common gate dielectric has been SiO2. Recently SiO2/Si3N4
combinations have begun to gain interest as a replacement for pure oxide. However, as the
thickness of SiO2 and SiO2/Si3N4 stack films approach 10-20 Å substantial problems appear,
including large leakage currents through the gate dielectric, concerns about the long term
dielectric reliability, and difficulty of manufacture and thickness control. A solution to the
problem is to use thick dielectric films having high dielectric constants (high K). Thus,
investigation of alternate gate oxides such as Al2O3, ZrO2, HfO2, and mixed oxides such as
zirconium and hafnium silicon oxide have been undertaken.1 Al2O3, ZrO2, and HfO2 are reported
to be thermodynamically stable in contact with silicon.2 ZrO2 doped Al2O3 and zirconium
aluminum oxide (ZAO) has been considered as a gate oxide replacement.3,4 In this study, we
have utilized butoxyethoxide based chemical solution deposition (CSD) route as a quick and
inexpensive means of screening ZAO and HAO. Unlike chemical vapor deposition or physical
vapor deposition, CSD requires no vacuum equipment, no deposition tool development, and no
process development time to obtain desired stoichiometry (solution concentration is film
concentration). By utilizing a stable butoxyethoxide based chemistry with no aging effects,
solutions can be prepared and stored indefinitely between spinnings and still obtain the same
quality film.5,6 Bulk powders of ZAO have been prepared by CSD with different solution
chemistries,7,8,9,10,11,12,13 However, no report exists describing the deposition of films of HAO or
ZAO utilizing a butoxyethoxide CSD chemistry. In an attempt to gain a better understanding of
the materials properties of ZAO and HAO we have prepared films of varying compositions of
ZAO and HAO and characterized their thermal stability and microstructural properties.
2
EXPERIMENTAL
Chemical Solution Deposition of ZAO and HAO
Zirconium aluminum oxide and hafnium aluminum oxide (HAO) mixed oxides of various
compositions in the xZr(100-x)AlOy (ZxAO, x = 17, 50 %), where x =17 is labeled as Z17AO, x=
50 is labeled as Z50AO, and similarily for the xHf(100-x)AlOy (HxAO, x= 25, 54, and 90) films
were fabricated by CSD. The CSD solutions were prepared from a mixture of zirconium,
hafnium and aluminum butoxyethoxides dissolved in butoxyethanol.5-6 The films were deposited
by spin casting on (5-20 Å) SiOxNy coated Si substrates. The Zr/Al and Hf/Al ratio was varied by
mixing either a Zr or Hf butoxyethoxide solution and a separate Al butoxyethoxide. Solution
composition was determined by ICP analysis by Galbraith Laboratories. After preparing spinning
solution and loading the spinning solution into a syringe, 0.45 and 0.1 µm syringe filters were
attached to the syringe and the spinning solution was syringed on the substrate until completely
wetted. The substrate was then spun for 20 sec at 2000-4000 rpm onto a SiOxNy coated Si
substrate which had been preheated on a 350 oC hot plate. After each spin-coating, the samples
were baked on a hot plate at 150 oC for 1-3 min, then at 350 oC for 3-10 minutes in air. ZAO and
HAO film thickness was varied by solution concentration, by spinning speed, and by depositing
multiple layers with a hot plate bake anneal between each layer. The final film was hot plate
baked at 350 oC for a minimum of 30 minutes before furnace annealing at 400, 500, 700, 800,
900, 1000, or 1100 oC for 30 min or 1200 oC for 60 min in flowing oxygen.
ZAO and HAO Film Characterization
X-ray diffraction (XRD) spectra were obtained using a Philips PW1729 diffractometer with
Cu Kα radiation. The FTIR spectra were recorded with a Nicolet Nexus 670 spectrometer using
DTGS KBR detector and KBR beam splitter for mid-IR (4000-400 cm-1) and using a DTGS
3
polyethylene detector and a solid substrate beam splitter for far-IR (600-50 cm-1) data collection.
The background for each spectrum was a piece of uncoated wafer that the ensuing films were
spun on. To minimize fringing effects and internal reflections, background and spectra were
collected at ~30o angle from the incident beam. The spectrum were analyzed using OMNIC v.
5.2 (Nicolet). After annealing at temperatures > 800 oC, absorption bands attributable to SiO2 at
1180 cm-1 and 1080 cm-1 from the LO and TO components of the asymmetric stretch of the SiO4,
810 cm-1 band attributed to skeletal network Si-O-Si symmetric stretching, and a band at 460 cm-1
attributed to skeletal network Si-O-Si symmetric bending was observed in the FTIR spectra.
Therefore, a representative thermal SiO2 spectra was subtracted from the ZAO and HAO
spectrums of all films discussed in this paper annealed at 800, 900, 1000, 1100 and 1200 oC using
the subtraction feature of the OMNIC v. 5.2 software. For FTIR and X-ray diffraction (XRD)
analysis, film thickness were at least 1000 Å thick. Film thickness was determined by n&k
analysis (n&k analyzer, n&k Technology, Santa Clara, Ca)14 and confirmed by single wavelength
ellipsometry. Electric properties were measured using backside contact with In/Ga or thermally
evaporated Al and topside contact with thermally evaporated Al dots. The two types of
electrodes yield similar electrical response apart from the flat band shift due to the work function
difference of the metals. An average dielectric constant from a minimum of three different films
at thickness varying from 500-4000 Å is reported. No dependence of thickness on dielectric
constant was observed.
RESULTS and DISCUSSION
X-ray diffraction (XRD) was performed at room temperature on undoped Al2O3, ZrO2 and
HfO2 films after annealing hot plate baked (350 oC 30 minutes in air) films at 400, 500, 700, 800,
900, 1000, 1100 oC for 30 minutes and 1200 oC for 60 minutes in flowing oxygen. The results are
summarized in Table 1. No evidence of any crystalline alumina phases was observed in the XRD
4
for undoped alumina films annealed at temperatures < 1200 oC, after annealing at 1200 oC for 60
minutes peaks attributable to α-alumina was observed. XRD spectra of annealed pure ZrO2 and
HfO2 agreed with earlier published results,15 crystallization of alumina free tetragonal ZrO2 was
observed after annealing at 500 oC, partial transformation from tetragonal to monoclinic ZrO2 was
observed in the XRD spectra after annealing at 800-900 oC, only monoclinic ZrO2 was observed
in the XRD spectra after annealing at 1000-1200 oC. Crystallization of HfO2 differed, in that,
only monoclinic HfO2 was observed after annealing at 500 -1200 oC.
X-ray diffraction was performed at room temperature on zirconium aluminum oxide and
hafnium aluminum oxide on various compositions in the xZr(100-x)AlOy where x =17 is labeled
as Z17AO, x= 50 is labeled as Z50AO, and similarily for the xHf(100-x)AlOy (HxAO, x= 25, 54,
films. X-ray diffraction was performed at room temperature on Z17AO, and Z50AO (zirconium
aluminum oxide) and H25AO, H54AO, and H90AO (hafnium aluminum oxide) binary oxides after
annealing hot plate baked (350 oC 30 minutes in air) films at 500, 700, 800, 900, 1100 oC for 30
minutes and 1200 oC for 60 minutes in flowing oxygen. A typical series of XRD diffraction
patterns are shown in Figure 1 for H25AO. At 800 and 900 oC, no XRD peaks are observed,
characteristic of an amorphous film, after annealing at 1000 and 1100 oC, peaks attributable to
tetragonal HfO2 are observed and after annealing at 1200 oC, peaks attributable to monoclinic
HfO2 are observed. Similar results were observed in the Z17AO, and Z50AO and H25AO, H54AO,
and H90AO films. The annealing temperatures at which tetragonal and monoclinic ZrO2 and
HfO2, and θ and α alumina are observed by XRD or FTIR spectra are listed in Table I.
As observed by XRD and in agreement with earlier results,7-13,16,17,18,19 we have observed that
combination of ZrO2 with alumina in the ZAO films delayed crystallization of tetragonal ZrO2
from 500 oC to at least 800 oC, and that transformation of the tetragonal to the monoclinic phase
was delayed from 900 oC to at least 1200 oC. As listed in Table I, Z50AO converted from
5
tetragonal to monoclinic after annealing at 1200 oC for 60 minutes and Z17AO did not convert.
No reports of HAO deposited by CSD are found in the literature. However, we have observed in
agreement with the ZAO results, that combination of HfO2 with Al2O3 in the H25AO, H54AO, and
H90AO films enabled the formation of the tetragonal phase of HfO2 which crystallized at a lower
annealing temperatures than the monoclinic HfO2 phase. The presence of the tetragonal HfO2 or
ZrO2 in the HAO or ZAO films at lower temperatures than the monoclinic phase might be
explained by the presence of Al2O3 hindering the grain growth of HfO2 or ZrO2 preventing the
attainment of the critical particle size necessary for the tetragonal-monoclinic transformation.4, 7,
11,13, 15-18
FTIR
The FTIR spectrum of undoped Al2O3 annealed at 400, 500, 700, 800, 900, 1100 oC for 30
minutes and 1200 oC for 60 minutes in flowing oxygen were collected and peaks assigned
according to the literature.19-35 In the FTIR spectrum of Al2O3 after annealing at 400-1100 oC
(Figure 2), a broad absorption band between 3700 and 3000 cm-1 is observed and assigned to O-H
stretching vibrations. The broadness of the OH band is indicative of great local disorder.20 The
center of this O-H band shifts upwards from 3372 cm-1 to 3546 cm-1 and the intensity decreases as
the annealing temperature was increased from 400 to 1100 oC. The upward shift of the center of
the OH absorption band agrees well with a loss of hydrogen bonding between adjacent layers
with observed vibrational modes 3500-3300 cm-1 and the retention of stronger hydrogen bonds
between hydroxy groups lying in the same plane with vibrational modes observed at higher
frequencies, 3600-3500 cm-1.21 However, the OH band does not completely disappear until
alumina has converted to the α phase after annealing at 1200 oC for 60 minutes. Weak absorption
bands at 2957, 2925, and 2850 cm-1 associated with C-H stretch are observed and attributed to
residual organics in the film. These bands persisted even after annealing at 1200 oC for 606
minutes and suggest the inclusion of organic fragments in the alumina network. Further support
for trapped organic fragments is provided by the observation of a weak absorption band at 2337
cm-1 which is assigned to trapped CO2 in the film.22,23 The intensity of the trapped CO2 band
increases with annealing temperature from 700-1100 oC and then decreases after annealing at
1200 oC. This band probably arises from pyrolysis of trapped organics in the film. The
absorption bands in the spectral region between 1700-1200 cm-1 attributed to adsorbed water,
organics and carbonates in the film were observed to decrease in intensity and vary peak position
as the annealing temperature is increased. A band at 1630 cm-1 is assigned to the H-OH bending
vibration of adsorbed water in the film.19,20,23,24,28,32,33 In the films annealed at 400 oC, absorption
bands at 1557, 1464, 1413, and 1345 cm-1 were observed; in the films annealed at 500-800 oC
annealed films, only a broad absorption between 1700-1300 cm-1 is observed, indicative of a
disordered microstructure and in the films annealed at 1000 and 1100 oC, absorption bands at
1596, 1527, 1446, and 1345 cm-1 are observed. These bands are attributed to water, organics
and/or carbonates in the film.19,20,24,2528,32,33 In the film annealed at 1200 oC, none of these
absorption bands are observed. In the films annealed at 350-800 oC, a broad two centered
absorption band is observed between 1000-200 cm-1. This two centered band with approximately
equal intensity bands has one center at ~650-700 cm-1 and one at 590 cm-1 with a shoulder at 410
cm-1. This two centered broad band is characteristic of γ-alumina.26,27,28,29,30 The broadness
absorption band is indicative of the disorder in the microstructure and is attributed to a wide
range of Al-O stretching modes for octahedral, AlO6 and tetrahedral, AlO4 units and complex
interactive vibrations.26-30 Generally, absorbance in the region 700-950 cm-1 is associated with
tetrahedral sites in alumina and absorbance less than 700 cm-1 is associated with octahedral sites
in alumina.19,20,25,31 After annealing at 1000 oC and 1100 oC, the two centered broad band no
longer has approximately equal intensity bands, the strong absorption band centered at 540 cm-1
7
increases in intensity, distinctive vibrational modes appear which are consistent with formation of
θ-Al2O3.26-29 The growth in intensity of the band centered at 540 cm-1 is most likely associated
with the conversion of tetrahedral to octahedral sites in the alumina which accompanies the γ−θ
phase transition. After annealing at 1200 oC, absorption bands attributable to α-Al2O3 are
observed at 635 (medium), 567 (strong), 501 (medium), 435 (strong) and 383 cm-1 (medium) and
the lack of absorptions below 700 cm-1 is consistent with the complete conversion of tetrahedral
to octahedral sites in α-Al2O3. 26-29, ,32
The FTIR spectra of Z17AO and Z50AO, H25AO, H54AO, and H90AO binary oxides baked at
350 oC in air on a hot plate for 30 minutes are shown in Fig. 3. The peaks in the ZAO and HAO
spectra have been assigned according to the literature.14,19-35 The broad band between 3700 and
3000 cm-1 is assigned to O-H stretching vibrations. The band at 1630 cm-1 and 1580 cm-1 is
assigned to the H-OH bending vibration of adsorbed water in the film19,20,23,24,28,32,33 The bands at
1450 and 1420 cm-1 are attributed to residual carbonates in the film. A band at 1100 cm-1 is
attributed to the symmetrical Al-OH bending modes.19,20,23,28, 33,34 Increasing ZrO2 or HfO2
content decreases the intensity of the bands at 3400, and 1630 associated with absorbed water in
the film. From surface area studies of ZrO2-Al2O3 powders, it is known that addition of ZrO2
decreases total surface area of ZrO2-Al2O3 powders indicative of a denser microstructure.7,9,13 This
reduction in surface area may account for the reduction in OH and HOH in the films with
increasing ZrO2 and HfO2 content. In the Z17AO and H25AO films, a broad two centered
absorption band is observed between 1000-200 cm-1. This two centered band with approximately
equal intensity bands has one center at ~650-700 cm-1 and one at 590 cm-1 with a shoulder at 410
cm-1 and is characteristic of γ-alumina.26-30 In the Z50AO, H54AO, and H90AO films, a broad
absorption band is observed between 1000-200 cm-1 centered at 440 cm-1 with a shoulder at 670
cm-1 and is attributed to a mixture of amorphous ZrO2 or HfO2 and γ-alumina.
8
To gain a better understanding of the microstructural transformations occurring in the ZAO
and HAO films during annealing at elevated temperatures, FTIR spectra were collected from
Z17AO (Fig. 4), and Z50AO (Fig. 5) and H25AO (Fig. 6), H54AO(Fig. 7) and H90AO(Fig. 8) films
annealed for 30 minutes in oxygen at 500, 700, 800, 900, 1000, 1100 oC for 30 minutes and 1200
oC for 60 minutes in flowing oxygen. A progressive change in the FTIR spectrum is observed as
the annealing temperature is increased. As the annealing temperature is increased, the absorption
bands associated with residual organics in the films decrease in intensity. A band at 2337 cm-1 is
observed in the FTIR spectrum after annealing at 700-1200 oC and is assigned to trapped CO2 in
the film.22,23 The intensity of the trapped CO2 band increases with annealing temperature from
700-1000 oC and then decreases after annealing at 1100 and 1200 oC. This band probably arises
from pyrolysis of organics in the film. However, the complete loss of residual organics from 17%,
and Z50AO and H25AO, 54% and H90AO films is not observed even after annealing at 1200 oC for
60m. As the annealing temperature is increased, the absorption bands associated hydroxyl and
adsorbed water in the films decrease in intensity and the center of the OH absorption band to
shifts 37-90 cm-1 upward from ~ 3400 to ~3490 cm-1. A weak peak at 1106 cm-1, with a shoulder
at 1260 cm-1 is observed after annealing at 350-700 oC and not after annealing at 800-1200 oC and
is assigned to the symmetrical and antisymmetrical Al-OH bending modes, respectively.
19,20,23,24,28,32,33 However, the complete loss of OH and H2O from Z17AO and Z50AO, H25AO, H54AO,
and H90AO films is only observed after annealing at 1200 oC for 60m.
Dependence of the microstructure on stoichiometry and process conditions is most clearly
seen in the FTIR spectrum from 1000-200 cm-1 which corresponds with M-O vibrations. In the
Z17AO films (Fig. 4) and H25AO films (Fig. 6) annealed at 350-900 oC, a broad two centered
absorption band between 1000-200 cm-1 with one center at ~630-680 cm-1 and one center at
~540-570 cm-1 and a shoulder at ~420 cm-1 characteristic of γ-alumina26-30 is observed and is
9
nearly identical to the observed FTIR spectrum of undoped Al2O3 annealed at 350-800 oC (Figure
2). The nearly identical FTIR spectrum of the pure Al2O3 film compared to the Z17AO and H25AO
films is indicative of interspersion of Zr and Hf throughout the amorphous alumina network.
However as the anneal temperature is increased, phase partitioning is observed in the Z17AO films
and H25AO films. After annealing Z17AO at 1000 oC, a strong absorption band centered at ~490
cm-1 with a shoulder at 394 cm-1 and a very weak absorption band ~180 cm-1 is observed and is
consistent with formation of tetragonal ZrO2. As the annealing temperature is increased to 1100
and 1200 oC, distinctive vibrational modes attributable to θ-alumina are observed on the broad
absorption band. The resultant FTIR spectrum are attributed to a mixture of tetragonal ZrO2 and
θ-Al2O3. Similar results are observed after annealing H25AO at 1000 oC. A strong absorption
band centered at ~490 cm-1 with a shoulder at 394 cm-1 is observed and is consistent with
formation of tetragonal HfO2. After annealing H25AO at 1100 and 1200 oC, distinctive vibrational
modes on the broad absorption band attributable to θ-alumina and monoclinic HfO2 are observed.
The H25AO films annealed at 1100 and 1200 oC appear to be a mixture of θ-alumina, and
monoclinic HfO2. The H25AO films differ from the Z17AO films in that monoclinic HfO2 forms
more readily at lower temperatures than monoclinic ZrO2.
In the FTIR spectrum of Z50AO films annealed at 350-500 oC (Fig. 5), and H54AO annealed at
350-800 oC (Fig. 7) annealed at 350-500 oC, a strong broad absorption band centered at 420 -440
cm-1 is observed and attributed to a mixture of γ-alumina and amorphous ZrO2 or HfO2. As the
anneal temperature is increased, additional phase partitioning is observed. After annealing Z50AO
at 800, 900, 1000, and 1100 oC, a strong absorption band centered at 440 cm-1 with a shoulder at
362 cm-1 and a weak absorption band at 140 cm-1 is observed and is consistent with formation of
tetragonal ZrO2. After annealing Z50AO at 1200 oC, distinctive vibrational modes are observed at
725, 572, 489, 447, 416, 347, 263, and 226 cm-1 and are attributed to monoclinic ZrO2. After
10
annealing H54AO at 900 oC, a broad strong absorption band centered at 480 cm-1 is observed and
is attributed to a mixture of γ-Al2O3 and tetragonal HfO2. After annealing H54AO at 1000 oC, the
absorption band at 480 cm-1 is broader with additional distinctive vibrational modes, suggestive
of a mixture of θ-Al2O3 and monoclinic HfO2. After annealing H54AO at 1200 oC, distinctive
vibrational modes are observed at 735, 632, 601, 513, 411, 325, 255, 235, and 183 cm-1 and are
attributed to monoclinic HfO2. Again, monoclinic HfO2 is observed to form more readily than
monoclinic ZrO2.
As shown in the FTIR spectrum of H90AO (Fig. 4), in the films annealed at 350-500 oC, a
strong absorption band centered at 420 cm-1 is observed and attributed to and amorphous HfO2.
After annealing at 700, 800, and 900 oC, a strong absorption band centered at ~424 cm-1 with a
shoulder at 355 cm-1 and a weak band at 250 cm-1 is observed and is consistent with formation of
monoclinic HfO2. After annealing at 900, 1000, and 1200 oC, distinctive vibrational modes
attributable to monoclinic HfO2 are observed. The H90AO films differ from pure HfO2, in that
tetraganol HfO2 was observed after annealing at 700 and 800 oC, and the crystallization
temperature of monoclinic HfO2 was increased to 900 oC instead of 500 oC for pure HfO2.
The average measured dielectric constant was 15 and 13 for the Z17AO, and Z50AO films,
respectively and 14 and 13 for the H25AO and H54AO films. A dielectric constant of 7 was
observed for the H90AO films which was attributed to extensive oxidation of the underlying Si
substrate increasing the interfacial oxide thickness and thus decreasing the dielectric constant.
This hypothesis is consistent with the observation of very intense FTIR peaks attributed to SiO2 in
the H90AO films after annealing at 1000 oC for 30 minutes.
Discussion
In the XRD and FTIR spectrum of pure Al2O3 deposited by CSD, no crystallization of Al2O3
was observed until transformation into the α-Al2O3 phase after annealing at 1200 oC for 60
11
minutes. The lack of observed crystallization might be attributable to the persistent OH and H2O
content as observed in the FTIR spectrum of the Al2O3 films. Even after annealing the films at
1100 oC for 30 minutes, OH was still observed in the FTIR spectrum. Apparently crystallization
and ordering of alumina is proceeded first by dehydroxylation and then by crystallization. In
agreement with previous results,19,20,26-29 we observed γ-Al2O3 at anneal temperatures <800 oC with
variable amounts of OH and H2O. θ-Al2O3 was observed at anneal temperatures of 900-1100 oC
with reduced amounts of OH. Complete loss of OH was only observed after conversion into
α-Al2O3 after annealing at 1200 oC.
As discussed in the literatue 19,20,26-29 the γ−θ phase transformations are continuous processes
and it is very difficult to have pure phases. The γ−θ transitions are displacive or topotactive (the
crystal structure transforms without destruction of the original crystal morphophogy) with the
oxygen anion array remaining cubic close packed. The only structural changes being a
redistribution of Al atoms between octahedral and tetrahedral sites.33 The FTIR spectrum are
consistent with this conjecture. Upon conversion to θ-Al2O3, an increased intensity of the
absorption band at 540 cm-1 which is generally associated with octahedral vibrations is observed.
The final explusion of OH from the alumina matrix was only observed after transformation
into α-Al2O3 after annealing at 1200 oC. The θ−α transition involves a reorganization of the
oxygen atoms from a cubic close packing in the γ and θ phases to a denser hexagonal
arrangement of oxygens. The transformation is associated with complete loss of tetrahedral sites
and condensation of octahedral sites, thus accounting for the final expulsion of OH from the
alumina matrix and the development of strong relatively narrow distinctive vibrational modes
observed in the FTIR spectra of α-alumina indicative of an ordered microstructure.
At low (<25%) ZrO2 or HfO2 concentrations at anneal temperatures less than 900 oC, an
amorphous γ-alumina like material was observed in the ZAO and HAO films, suggestive of a
12
nonequilbrium metastable mixture of Zr or Hf and Al. At higher ZrO2 or HfO2 concentrations or
at higher anneal temperatures, phase partitioning of the ZAO and HAO films was observed in
agreement with previously published results.7-13,15-18 Tetragonal ZrO2 or HfO2 was observed to
precipitate during transformation of γ-Al2O3 to θ-Al2O3, suggesting that Zr atoms are intimately
bound within the γ-Al2O3 matrix.
In the H90AO films with 10% Al no evidence of alumina phase separation was observed by
XRD or FTIR even after annealing at 1200 oC for 60 minutes suggesting a solubility of at least
10% Al in HfO2. A dramatic alteration of transformation temperatures and stabilization of
tetraganol HfO2 was observed relative to pure HfO2. In the H90AO films crystallization of
tetragonal HfO2 was observed after annealing at 700 and 800 oC. In contrast, pure HfO2 was
observed to only crystallize in the monoclinic phase at annealing temperatures > 500 oC.
The average measured dielectric constants are 15 and 13 for the Z17AO, and Z50AO films,
respectively, and 14, 13, and 7 for the H25AO, H54AO, and H90AO films, respectively. The
measured dielectric constant of 7 for the H90AO films is attributed to extensive oxidation of the
underlying Si substrate, despite H90AO film thickness ranging from 1500 to 3900 Å. As shown in
Figure 9, oxidation of the underlying Si increases with increasing HfO2 content. The calculated
area under the Si-O peaks at 1260 and 1070 cm-1 for the H90AO film is nine times as large as the
same Si-O peak area for the H17AO film. Ytrria stabilized zirconia is a known oxgen conductor at
elevated temperatures. Doping of zirconia with ytrria creates oxygen vacancies which play an
essential role in the conductivity mechanism. A maximum in oxygen conduction is observed at
8% Y in the ZrO2.35,36,37,38,39,40 10-25% Y doped HfO2 is also a known ionic conductor at elevated
temperatures.41 Similiar oxygen conduction is speculated to occur in the HAO films with the
H90AO film with 10% Al conducting more oxygen than the H25AO and H54AO films. To utilize
13
ZAO and HAO films in transistors, annealing conditions and stoichiometry will have to be
carefully selected to not only minimize phase partitioning but also to avoid interfacial oxidation.
CONCLUSIONS
Crystallization and ordering of pure alumina was observed to proceed first by
dehydroxylation and then by crystallization. We observed γ-Al2O3 at anneal temperatures <800
oC with variable amounts of OH and H2O. θ-Al2O3 was observed at anneal temperatures of
900-1100 oC with reduced amounts of OH. Complete loss of OH was only observed after
conversion into α-Al2O3 after annealing at 1200 oC.
Crystallization/phase separation of ZrO2 and HfO2 in ZAO and HAO films was observed to
be concentration and annealing temperature dependent. At low (<25%) ZrO2 or HfO2
concentrations at anneal temperatures less than 900 oC, an amorphous γ-alumina like material was
observed in the ZAO and HAO films. Phase partitioning of the ZAO and HAO films was
observed at higher ZrO2 or HfO2 concentrations and at higher anneal temperatures. Combination
of ZrO2 and HfO2 with Al2O3 in the ZAO and HAO films stabilized the tetragonal phase of ZrO2
or HfO2, and hindered the tetragonal to monoclinic transformation of ZrO2 and HfO2.
Transformation from the tetragonal to monoclinic phase was observed to occur more readily at
lower annealing temperatures in HAO films than ZAO films.
The dielectric constant of the Z17AO and Z50AO films and the H25AO and H54AO films was
greater than the dielectric constant of Al2O3 alone. However, extensive oxidation of the
underlying Si substrate was observed in the H90AO films and attributed to enhanced oxygen
conduction at elevated temperatures. Therefore, to successfully utilize ZAO and HAO films in
transistors, annealing conditions and stoichiometry will have to be carefully selected to not only
minimize phase partitioning but also to avoid interfacial oxidation.
14
ACKNOWLEDGEMENTS
The author would like to acknowledge Sufi Zafar, Steve Cohen and Dave Klaus for electricalmeasurements.
.
15
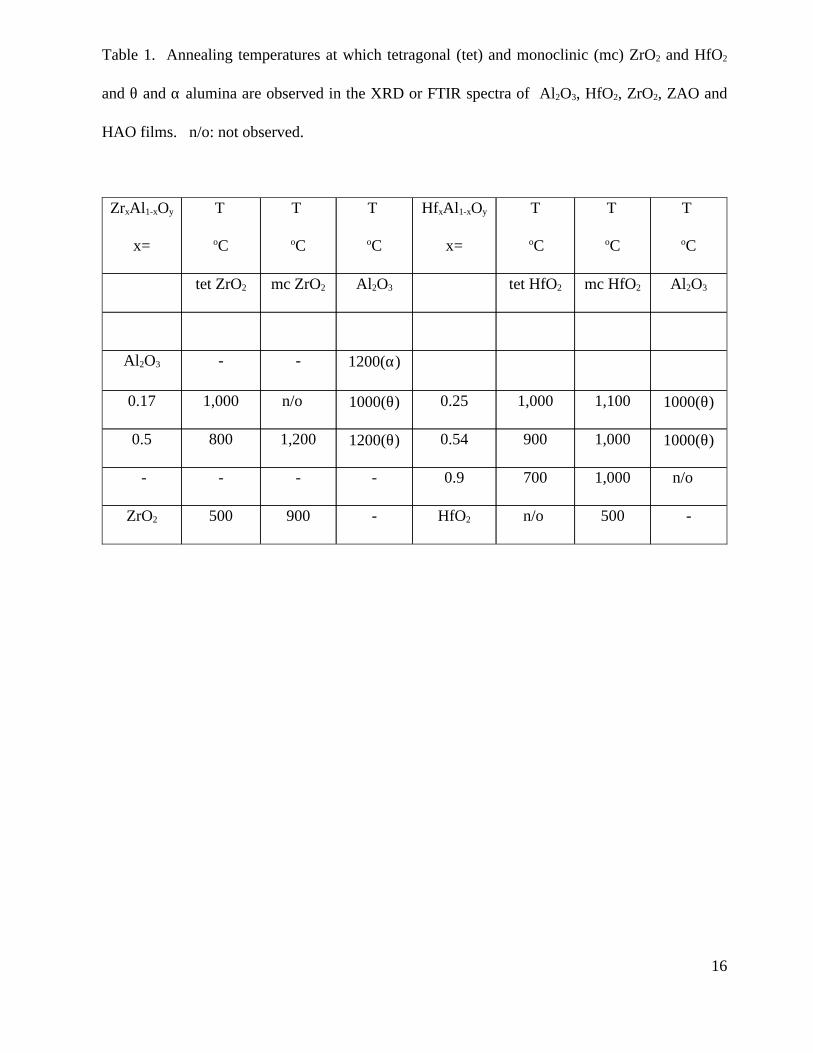
Table 1. Annealing temperatures at which tetragonal (tet) and monoclinic (mc) ZrO2 and HfO2
and θ and α alumina are observed in the XRD or FTIR spectra of Al2O3, HfO2, ZrO2, ZAO and
HAO films. n/o: not observed.
-500n/o HfO2-900500ZrO2
n/o 1,0007000.9--- -
1000(θ)1,0009000.541200(θ)1,2008000.5
1000(θ)1,1001,0000.251000(θ)n/o 1,0000.17
1200(α)--Al2O3
Al2O3mc HfO2tet HfO2Al2O3mc ZrO2tet ZrO2
T
oC
T
oC
T
oC
HfxAl1-xOy
x=
T
oC
T
oC
T
oC
ZrxAl1-xOy
x=
16
FIGURE CAPTIONS
Figure 1. X-ray diffraction pattern of H25AO film annealed at 800, 900, 1000, 1100 and 1200 oC.
Figure 2. FTIR spectra of Al2O3 films after annealing at 350, 400, 500, 700, 800, 1000, 1100 oC
for 30 minutes and 1200 oC for 60 minutes in flowing oxygen.
Figure 3. FTIR specta of Z17AO, Z50AO, H25AO, H54AO, and H90AO films after hot plate bake at
350 oC for 30 minutes in air.
Figure 4. FTIR spectra of Z17AO films after annealing at 350, 700, 800, 900, 1000, 1100 oC for
30 minutes and 1200 oC for 60 minutes in flowing oxygen.
Figure 5. FTIR spectra of Z50AO films after annealing at 350, 500, 800, 900, 1000, 1100 oC for
30 minutes and 1200 oC for 60 minutes in flowing oxygen.
Figure 6. FTIR spectra of H25AO films after annealing at 350, 700, 800, 900, 1000, 1100 oC for
30 minutes and 1200 oC for 60 minutes in flowing oxygen.
Figure 7. FTIR spectra of H54AO films after annealing at 350, 700, 800, 900, 1000 oC, and 1100
oC for 30 minutes in flowing oxygen.
Figure 8. FTIR spectra of H90AO films after annealing at 350, 500, 700, 800, 900, 1000 oC for 30
minutes and 1200 oC for 60 minutes in flowing oxygen.
17
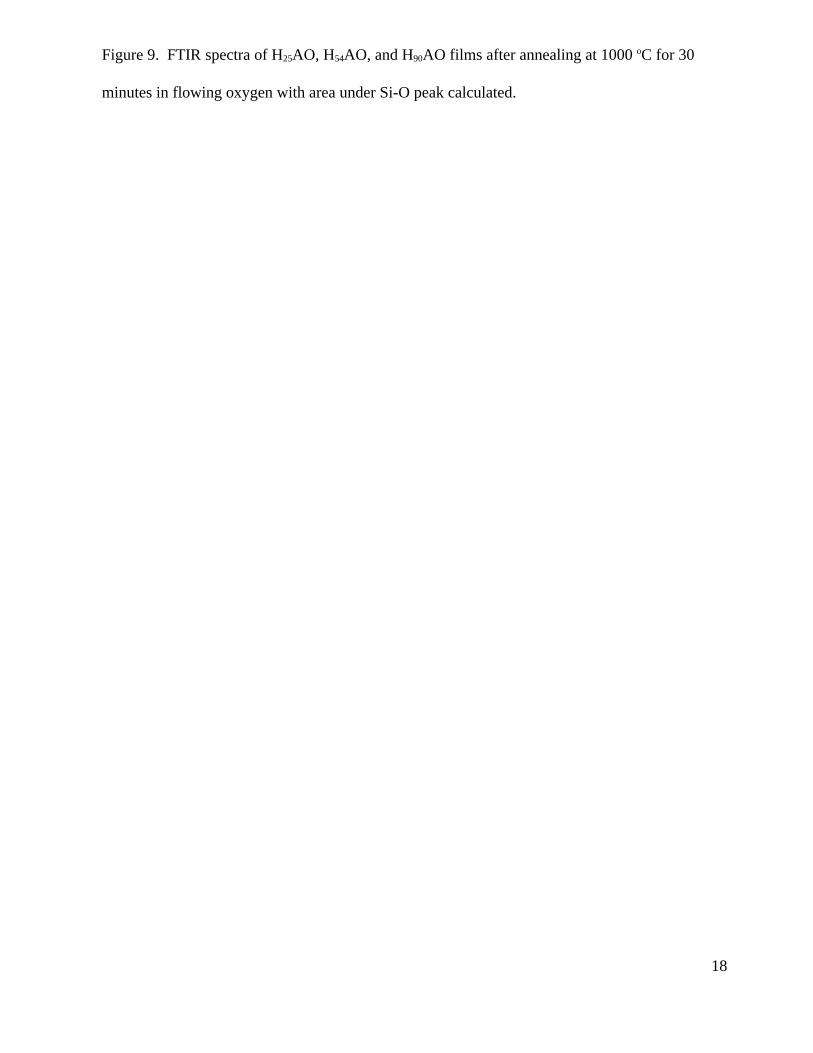
Figure 9. FTIR spectra of H25AO, H54AO, and H90AO films after annealing at 1000 oC for 30
minutes in flowing oxygen with area under Si-O peak calculated.
18
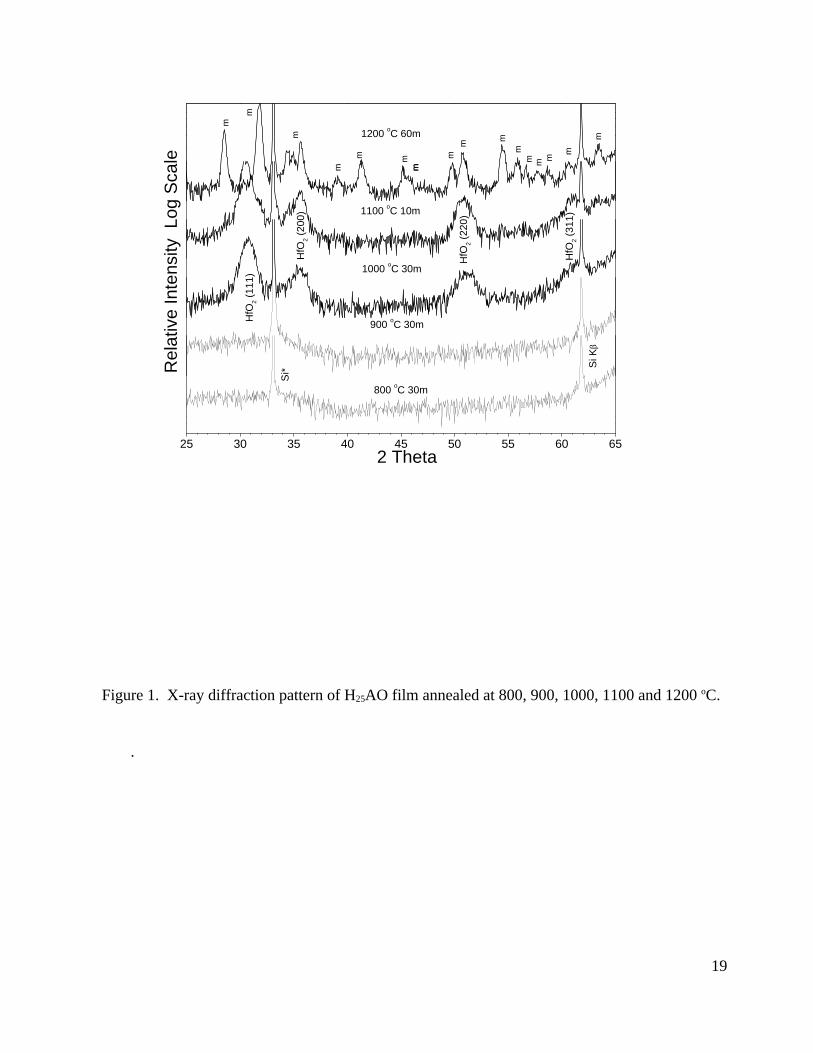
Figure 1. X-ray diffraction pattern of H25AO film annealed at 800, 900, 1000, 1100 and 1200 oC.
.
19
25 30 35 40 45 50 55 60 65
800 oC 30m
Si K
β
Si*R
elat
ive
Inte
nsity
Log
Sca
le
2 Theta
1200 oC 60m
1000 oC 30m
900 oC 30m
1100 oC 10m
m
mmm
m
mm
m
m
m
m m mm
m
m
m
HfO
2 (31
1)
HfO
2 (22
0)
HfO
2 (11
1)
HfO
2 (20
0)
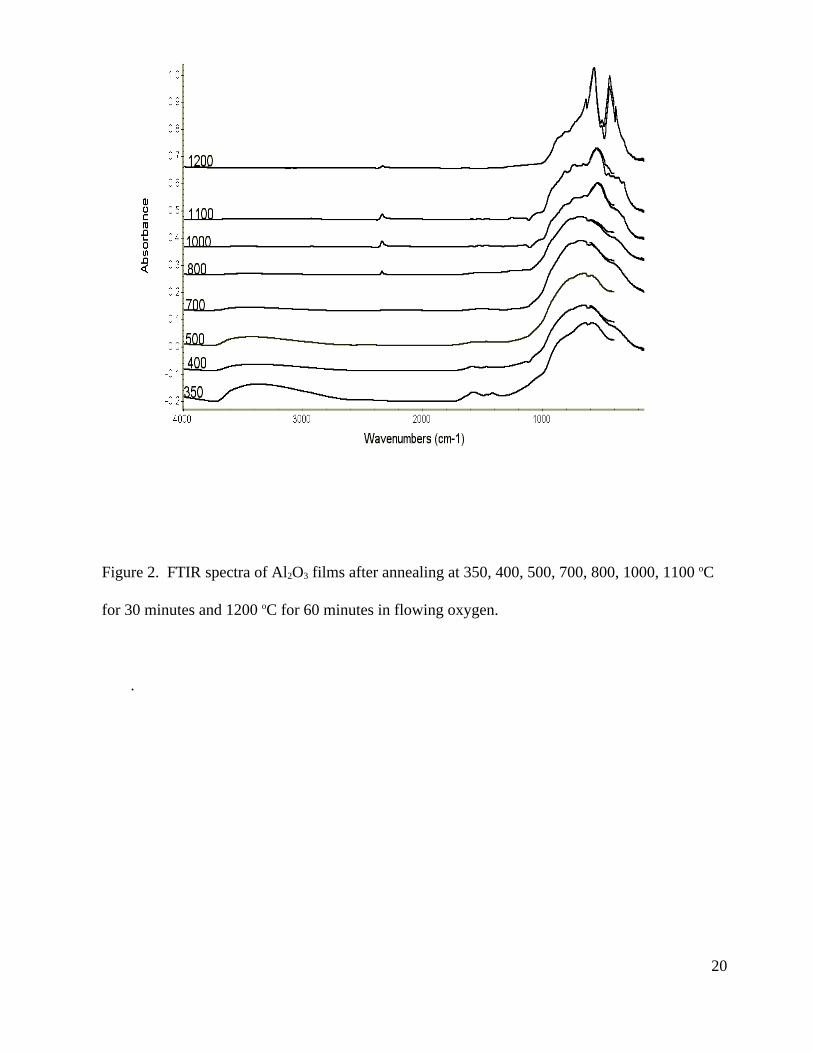
Figure 2. FTIR spectra of Al2O3 films after annealing at 350, 400, 500, 700, 800, 1000, 1100 oC
for 30 minutes and 1200 oC for 60 minutes in flowing oxygen.
.
20
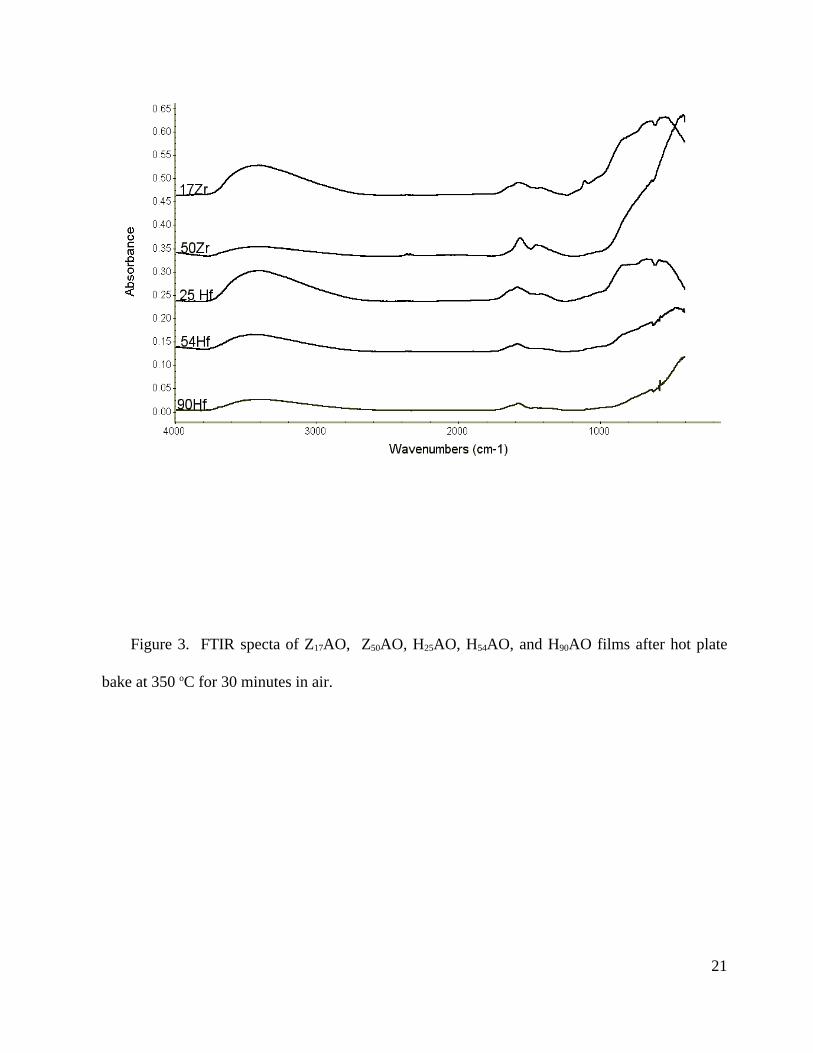
Figure 3. FTIR specta of Z17AO, Z50AO, H25AO, H54AO, and H90AO films after hot plate
bake at 350 oC for 30 minutes in air.
21
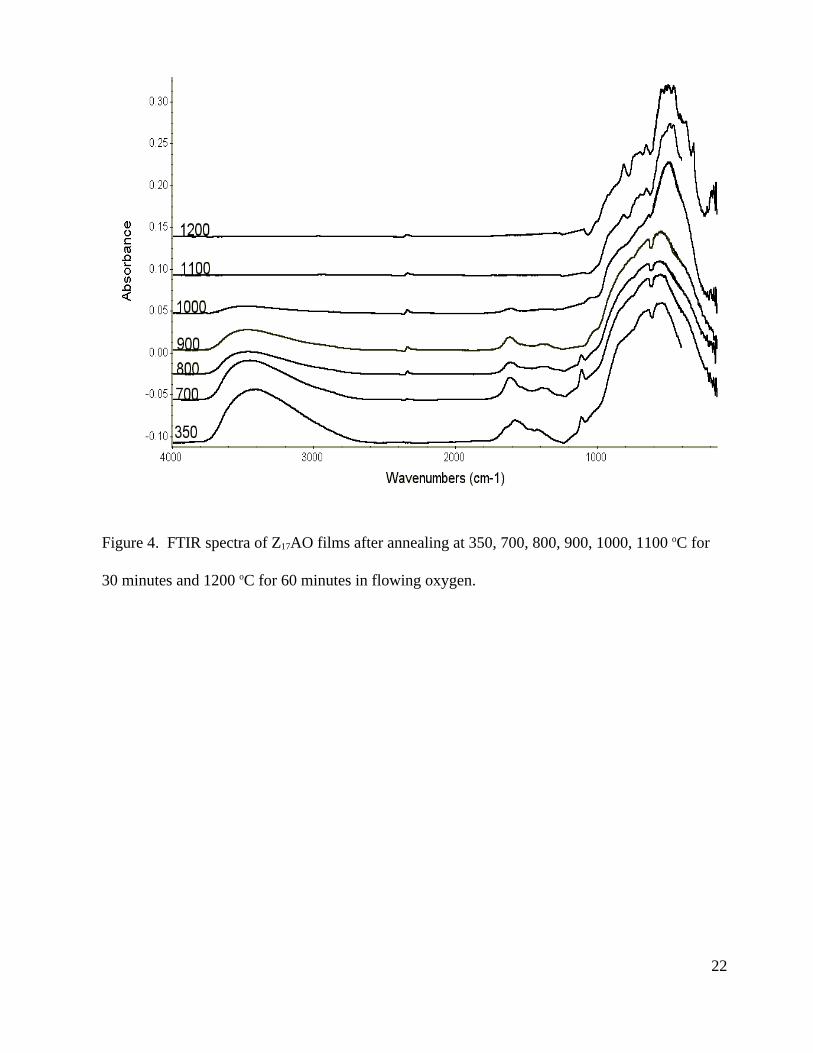
Figure 4. FTIR spectra of Z17AO films after annealing at 350, 700, 800, 900, 1000, 1100 oC for
30 minutes and 1200 oC for 60 minutes in flowing oxygen.
22
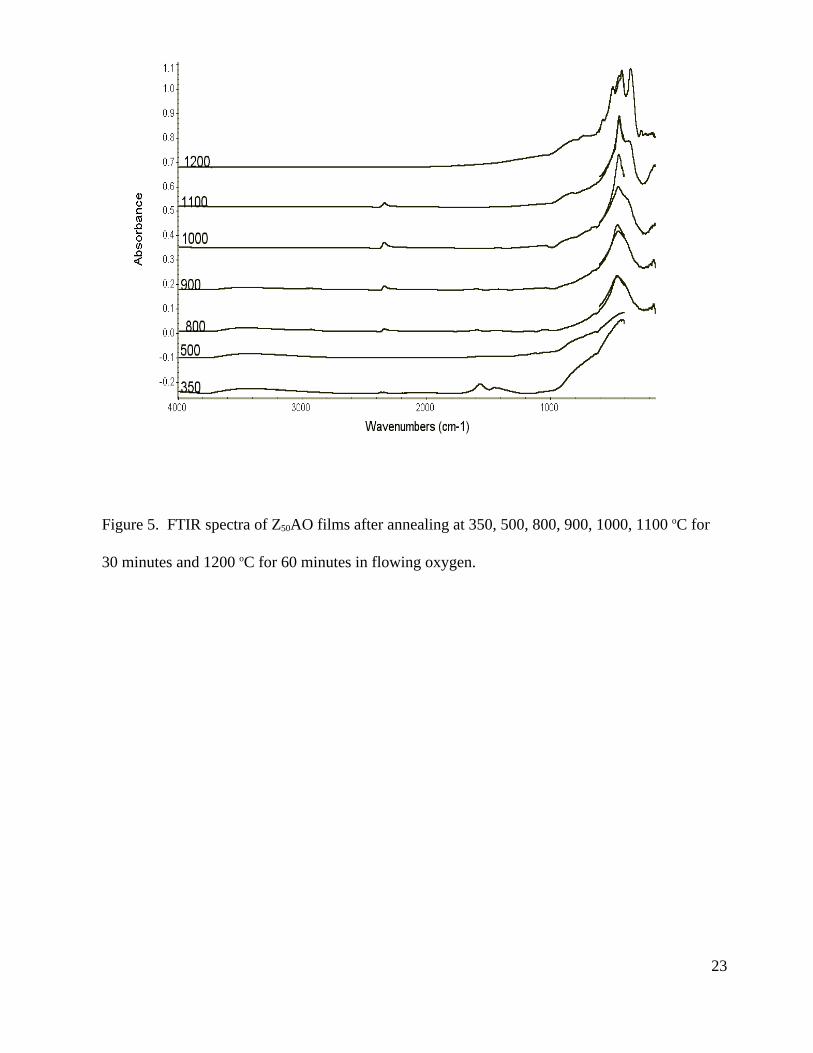
Figure 5. FTIR spectra of Z50AO films after annealing at 350, 500, 800, 900, 1000, 1100 oC for
30 minutes and 1200 oC for 60 minutes in flowing oxygen.
23
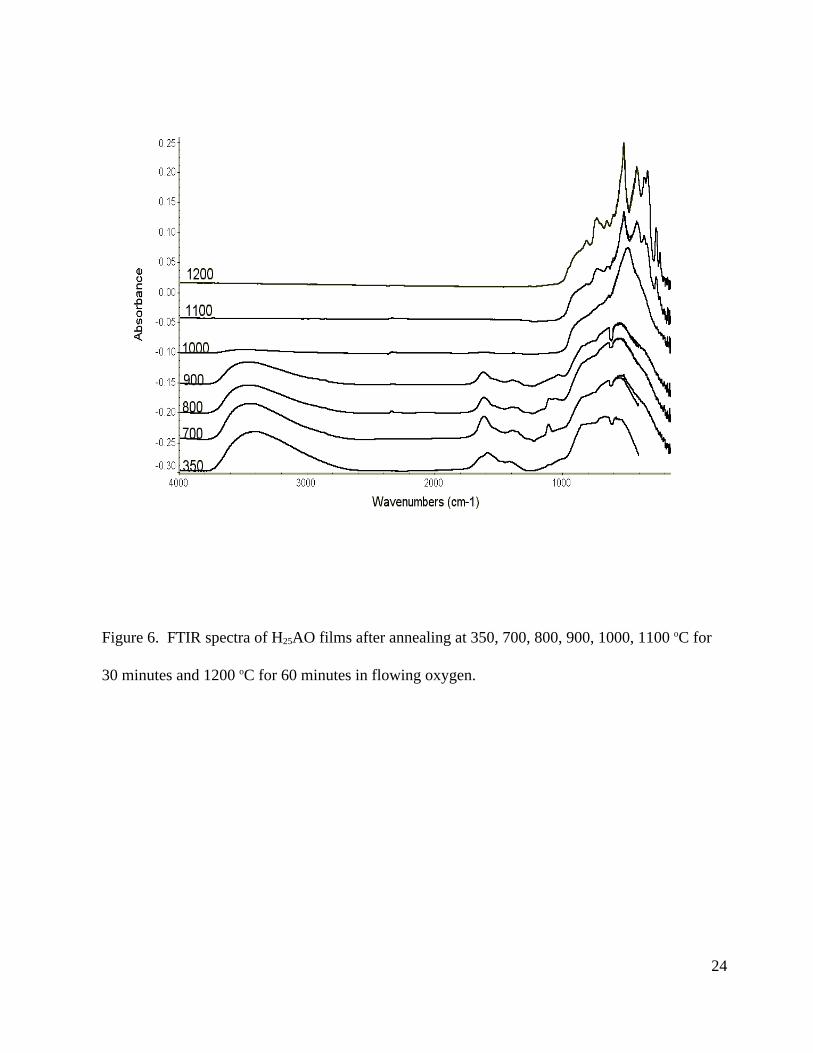
Figure 6. FTIR spectra of H25AO films after annealing at 350, 700, 800, 900, 1000, 1100 oC for
30 minutes and 1200 oC for 60 minutes in flowing oxygen.
24
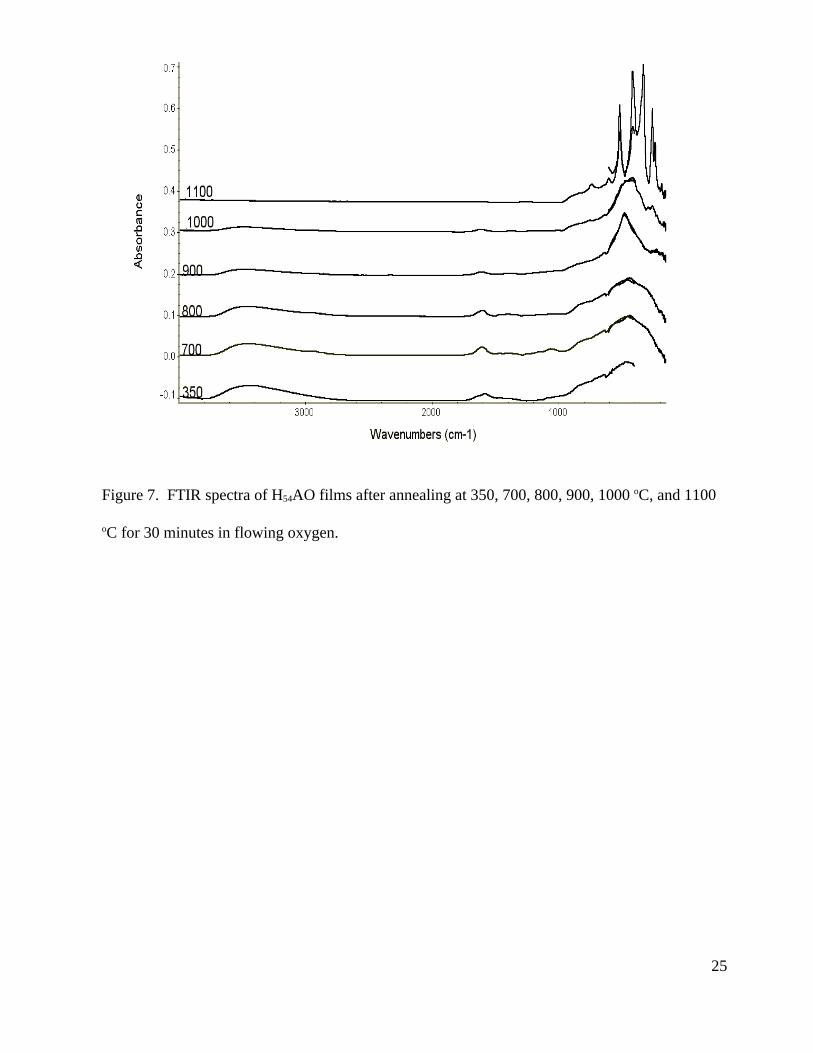
Figure 7. FTIR spectra of H54AO films after annealing at 350, 700, 800, 900, 1000 oC, and 1100
oC for 30 minutes in flowing oxygen.
25
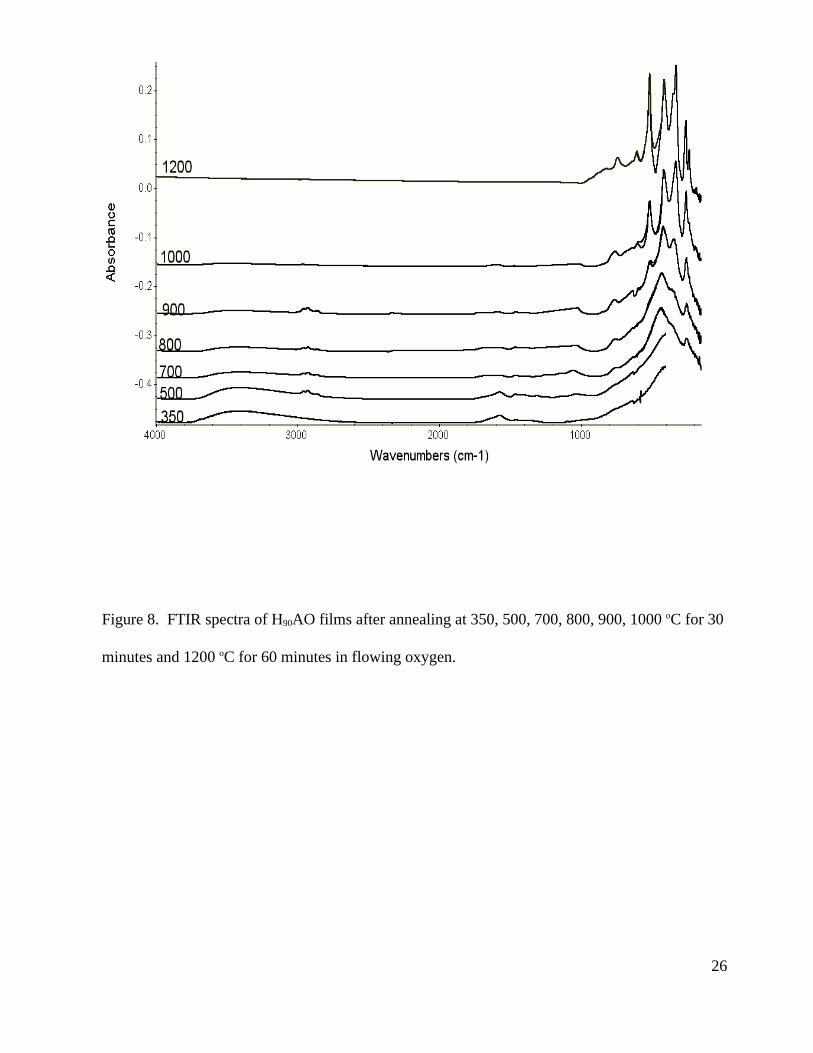
Figure 8. FTIR spectra of H90AO films after annealing at 350, 500, 700, 800, 900, 1000 oC for 30
minutes and 1200 oC for 60 minutes in flowing oxygen.
26
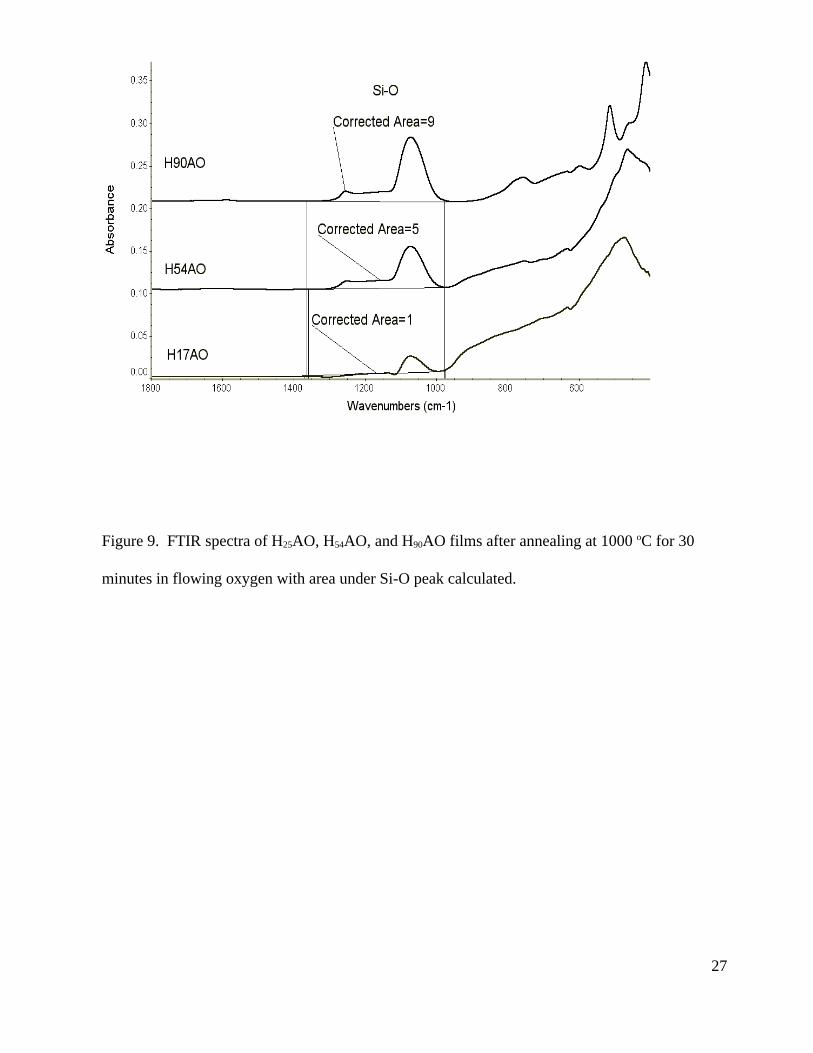
Figure 9. FTIR spectra of H25AO, H54AO, and H90AO films after annealing at 1000 oC for 30
minutes in flowing oxygen with area under Si-O peak calculated.
27
REFERENCES
16 Y. Murase, E. Kato, K. Daimon, J. Am. Ceram. Soc. 69, 83 (1986).
15 D.A.Neumayer and E. Cartier, J. Appl. Phys. 90, (2001)
14 A. Callegari, E. Cartier, M. Gribelyuk, H. F. Okorn-Schmidt, T. Zabel, submitted to J. Appl.
Phys.
13 E.A. Pugar, P.E.D. Morgan, J. Am. Ceram. Soc. 69, C120 (1986).
12 M.L. Balmer, F.F. Lange, C.G. Levi, J. Am. Ceram. Soc. 77, 2069 (1994).
11 M.L. Balmer, F.F. Lange, V. Jayaram, C.G. Levi, J. Am. Ceram. Soc. 78, 1489 (1995).
10 L. Gao, Q. Liu, J.S. Hong, H. Miyamoto, S.D. DeLaTorre, A. Kakitsuji, K. Liddel, D.P.
Thompson, J. Mater. Sci. 33, 1399, (1998).
9 J. Klein and W. Maier, Chem. Mater. 11, 2584 (1999).
8 S. Moreau, M. Gervais, A. Douy, Solid State Ionics 101-103, 625 (1997).
7 C. Li, Y.-W. Chen, T.-M. Yen, J. Sol-Gel Science and Technology, 4, 205-212, (1995)
6 D.A. Neumayer, P.R. Duncombe, U.S. Patent No. 6,002,031, (14 December 1999).
5 D.A. Neumayer, P.R. Duncombe, U.S. Patent No. 5 962 654 (5 October 1999).
4 R.B. Van Dover, D.V. Lang, M.L. Green, L. Manchanda, in press J. Vac. Sci. Technol.
(2001).
3 L. Manchanda, W.H. Lee, J.E. Bower, F.H. Baumann, W.L. Brown, C.J. Case, R.C. Keller,
Y.O. Kim, E.J. Laskowski, M.D. Morris, R.L. Opila, P.J. Silverman, T.W. Sorsch, G.R.
Weber, IEDM, 21.6, 1, (1998).
2 Billman, C.A. Tan, P.H. Hubbard, K.J. Schlom, D.G., Materials Research Society
Symposium - Proceedings v 567 1999. p 409-414
1 G.D. Wilk, R.M. Wallace, J.M. Anthony, accepted to J. Appl. Physics
28
35 T.H. Etsell and S.N. Flengas, Chem Rev. 70, 339 (1970).
34 K. Sinko, R. Mezei, J. Rohonczy, P. Fratzl, Langmuir, 15, 6631 (1999).
33 M.C. Stegmann, D. Viven, C. Mazieres, Spectochimica Acta, 29A, 1653 (1973).
32 P. Raharjo, C. Ishizake, K. Ishizaki, J. Ceram. Soc. Jap. 108, 1 (2000).
31 G. Busca, V. Lorenzelli, G. Ramis, R.J. Willey, Langmuir 9, 1492 (1993).
30 J.M. Saniger, Mater. Lett., 22, 109 (1995).
29 G. Urretavizcaya, A.L. Cavalieri, J.M. Porto Lopez, I. Sobrados, J. Sanz, J. Mater. Synth.
Process. 6[1], 1 (1998).
28 C.H. Shek, J.K.L. Lai, T.S. Gu, G.M. Lin Nanostructured Mater., 8, 605 (1997).
27 M.I. Baratron, P.J. Quintard, J. Mol. Struct. 79, 337 (1982).
26 P. Tarte, Spectrochimica Acta, 23A, 2127 (1967).
25 N. Ozer, J.P. Cronin, Y.-J. Yao, A.P. Tomsia, Solar Energy Mater. & Solar Cells, 59, 355
(1999).
24 V. Jayaraman, T. Gnanasekaran, G. Periaswami, Mater. Letters 30, 157 (1997).
23 H.S. Gopalakrishnamurthy, R. Subba Rao, T.R. Narayanan Kutty, J. Inorg. Nucl. Chem., 37,
891 (1975).
22 D.A. Neumayer, P.R. Duncombe, R.B. Laibowitz, A. Grill Integrated Ferroelectrics, 18, 297
(1997).
21 V.J. Ingram-Jones, R.C.T. Slade, T.W. Davies, J.C. Southern, S. Salvador, J. Mater. Chem.
6, 73
20 Ph. Colomban, J. Mater. Sci. 24, 3002 (1989).
19 A.H. Heuer, N. Claussen, W.M. Kriven, M. Ruhle J. Am. Ceram. Soc. 65, 642 (1982).
18 F.F. Lange, M.M. Hirlinger, J. Am. Ceram. Soc. 67, 164 (1984).
17 M. Kagawa, M. Kikuchi, Y. Syono, J. Am. Ceram. Soc. 66, 751 (1983).
29
41 J.E. Zhuiykov, Ceram. Soc. 20, 967 (2000).
40 M. S. Khan, M. S. Islam, D.R. Bates, J. Mater. Chem. 8, 2299 (1998).
39 Y. Yamamura, S. Kawasaki, H. Sakai, Solid State Ionics, 126, 181 (1999)
38 J.P. Goff, W. Hayes, S. Hull, M.T. Hutchings, K.N. Clausen Phys Rev. B 59, 14202 (1999)
37 C.R.A Catlow J. Chem. Soc. Faraday Trans. 86 1167 (1990).
36 E.C. Subbarao, H.S. Maiti, Solid State Ionics, 11, 317 (1984).
30