IBM Mainframe to Server Enterprise Editionâ„¢
15
Communications of the Association for Information Systems Volume 16 Article 39 December 2005 Global Diffusion of the Internet VIII: Maximum Resolution Dichotomy for Global Diffusion of the Internet James K. Ho University of Illinois at Chicago, [email protected] Follow this and additional works at: hps://aisel.aisnet.org/cais is material is brought to you by the AIS Journals at AIS Electronic Library (AISeL). It has been accepted for inclusion in Communications of the Association for Information Systems by an authorized administrator of AIS Electronic Library (AISeL). For more information, please contact [email protected]. Recommended Citation Ho, James K. (2005) "Global Diffusion of the Internet VIII: Maximum Resolution Dichotomy for Global Diffusion of the Internet," Communications of the Association for Information Systems: Vol. 16 , Article 39. DOI: 10.17705/1CAIS.01639 Available at: hps://aisel.aisnet.org/cais/vol16/iss1/39
Transcript of IBM Mainframe to Server Enterprise Editionâ„¢

Communications of the Association for Information Systems
Volume 16 Article 39
December 2005
Global Diffusion of the Internet VIII: MaximumResolution Dichotomy for Global Diffusion of theInternetJames K. HoUniversity of Illinois at Chicago, [email protected]
Follow this and additional works at: https://aisel.aisnet.org/cais
This material is brought to you by the AIS Journals at AIS Electronic Library (AISeL). It has been accepted for inclusion in Communications of theAssociation for Information Systems by an authorized administrator of AIS Electronic Library (AISeL). For more information, please [email protected].
Recommended CitationHo, James K. (2005) "Global Diffusion of the Internet VIII: Maximum Resolution Dichotomy for Global Diffusion of the Internet,"Communications of the Association for Information Systems: Vol. 16 , Article 39.DOI: 10.17705/1CAIS.01639Available at: https://aisel.aisnet.org/cais/vol16/iss1/39

Communications of the Association for Information Systems (Volume 16, 2005)797-809 797
Global Diffusion of the Internet VIII: Maximum Resolution Dichotomy for Global Diffusion of the Internet by J.K. Ho
GLOBAL DIFFUSION OF THE INTERNET VIII: MAXIMUM RESOLUTION DICHOTOMY
FOR GLOBAL DIFFUSION OF THE INTERNET
James K. Ho Information & Decision Sciences University of Illinois at Chicago [email protected]
ABSTRACT
The Global Diffusion of the Internet (GDI) framework was used to study the progress in the adoption of the Internet in close to 30 countries since 1997. A new methodology in data mining is presented to extend the use of Kiviat diagrams to visualize the framework cast in a supply-demand dichotomy. A maximum resolution topology is derived as an additional tool for exploratory data analysis of such GDI dichotomies.
Key Words: global diffusion of the Internet, data mining, data visualization, exploratory data analysis, multi-attribute dichotomies
I. INTRODUCTION
Initiated by The Mosaic Group in 1997, the Global Diffusion of the Internet (GDI) Project focuses on measuring and analyzing the growth of the Internet throughout the world. Using the nation-state as the unit of analysis, nearly 30 countries have been studied since its inception1. Mosaic Group researchers and others observe that the Internet is a cluster of related technologies, including servers, networks, software, end user devices, and communication content, that must be in place in any country to support adoption by end users. Therefore, its diffusion cannot be captured by a single measurement variable as in traditional diffusion studies of the adoption of a single innovation. Instead, a well-defined analytic framework was developed by Wolcott et al. [2001] with the six dimensions summarized in Table 1.
Each of the six dimensions describes an essential and measurable feature of the status of the Internet in a country. Collectively, they cover the bundle of requisite technologies, from
1 The Mosaic Group [2005] compiled a list of published reports on the state of the Internet in various countries at a particular point in time
798 Communications of the Association for Information Systems (Volume 16, 2005)797-809
Global Diffusion of the Internet VIII: Maximum Resolution Dichotomy for Global Diffusion of the Internet by J.K. Ho
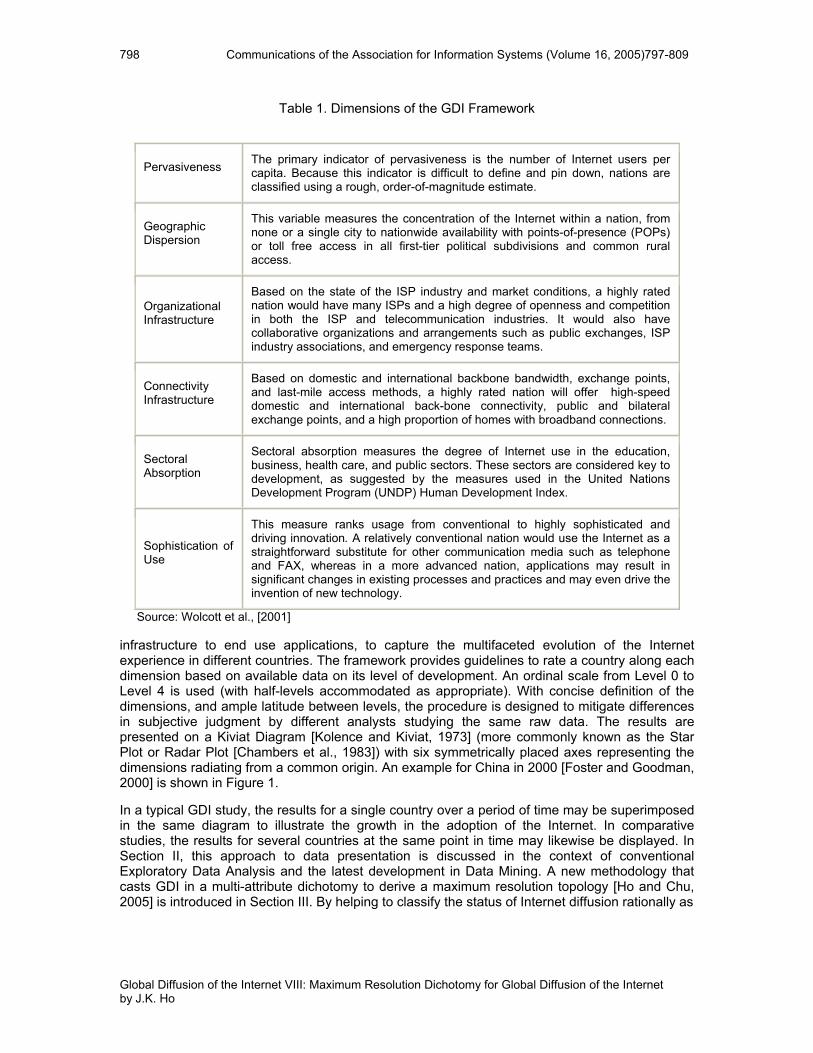
Table 1. Dimensions of the GDI Framework
Pervasiveness The primary indicator of pervasiveness is the number of Internet users per capita. Because this indicator is difficult to define and pin down, nations are classified using a rough, order-of-magnitude estimate.
Geographic Dispersion
This variable measures the concentration of the Internet within a nation, from none or a single city to nationwide availability with points-of-presence (POPs) or toll free access in all first-tier political subdivisions and common rural access.
Organizational Infrastructure
Based on the state of the ISP industry and market conditions, a highly rated nation would have many ISPs and a high degree of openness and competition in both the ISP and telecommunication industries. It would also have collaborative organizations and arrangements such as public exchanges, ISP industry associations, and emergency response teams.
Connectivity Infrastructure
Based on domestic and international backbone bandwidth, exchange points, and last-mile access methods, a highly rated nation will offer high-speed domestic and international back-bone connectivity, public and bilateral exchange points, and a high proportion of homes with broadband connections.
Sectoral Absorption
Sectoral absorption measures the degree of Internet use in the education, business, health care, and public sectors. These sectors are considered key to development, as suggested by the measures used in the United Nations Development Program (UNDP) Human Development Index.
Sophistication of Use
This measure ranks usage from conventional to highly sophisticated and driving innovation. A relatively conventional nation would use the Internet as a straightforward substitute for other communication media such as telephone and FAX, whereas in a more advanced nation, applications may result in significant changes in existing processes and practices and may even drive the invention of new technology.
Source: Wolcott et al., [2001]
infrastructure to end use applications, to capture the multifaceted evolution of the Internet experience in different countries. The framework provides guidelines to rate a country along each dimension based on available data on its level of development. An ordinal scale from Level 0 to Level 4 is used (with half-levels accommodated as appropriate). With concise definition of the dimensions, and ample latitude between levels, the procedure is designed to mitigate differences in subjective judgment by different analysts studying the same raw data. The results are presented on a Kiviat Diagram [Kolence and Kiviat, 1973] (more commonly known as the Star Plot or Radar Plot [Chambers et al., 1983]) with six symmetrically placed axes representing the dimensions radiating from a common origin. An example for China in 2000 [Foster and Goodman, 2000] is shown in Figure 1.
In a typical GDI study, the results for a single country over a period of time may be superimposed in the same diagram to illustrate the growth in the adoption of the Internet. In comparative studies, the results for several countries at the same point in time may likewise be displayed. In Section II, this approach to data presentation is discussed in the context of conventional Exploratory Data Analysis and the latest development in Data Mining. A new methodology that casts GDI in a multi-attribute dichotomy to derive a maximum resolution topology [Ho and Chu, 2005] is introduced in Section III. By helping to classify the status of Internet diffusion rationally as

Communications of the Association for Information Systems (Volume 16, 2005)797-809 799
Global Diffusion of the Internet VIII: Maximum Resolution Dichotomy for Global Diffusion of the Internet by J.K. Ho
Figure 1. Kiviat Diagram for China 2000
either supply or demand dominant at any point of development, this dichotomy provides an additional analytic tool for use in GDI studies, especially for the roughly 85% of all countries in the world that are yet to be considered. Illustrative examples of the supply-demand dichotomy based on previous studies are given in Section IV. Directions for future work are discussed in Section V.
II. KIVIAT DIAGRAMS IN EXPLORATORY DATA ANALYSIS
Data visualization, as with the use of Kiviat Diagrams, is an essential aspect of Exploratory Data Analysis (EDA) [Tukey, 1977]. In contrast to traditional inferential statistics, which focuses on hypothesis testing designed to verify a priori hypotheses about relations among variables, EDA does not presume any relationships model. It is a philosophy, rather than a collection of techniques, to use primarily graphical visualization to gain insight into a data set. With open-minded exploration, the goal is to uncover hidden structure and systematic patterns that may lead to further discovery of knowledge. While EDA was pioneered in the days of hand-drawn graphics, advances in database technology and computer graphics enable more sophisticated specializations. EDA on large and complex databases now falls under the rubric of Data Mining [Chen et al., 1996]. Computerized graphical methods are known as Data Visualization [Hoffman and Grinstein, 2001; Keim, 2002].
The primary objective of Data Mining is Knowledge Discovery in Databases, one popular definition of which is the non-trivial process of identifying valid, novel, potentially useful, and understandable patterns in data. One major topic is the discovery of association rules2, which shed light on correlations in the data. Such knowledge has practical use for decision support when combined with appropriate decision-analytic models [Bohanec and Zupan, 2001]. Another major topic is classification, which subsumes the more traditional subjects of cluster analysis and pattern recognition [Ankerst et al., 2000]. This work is a contribution to classification.
2 An example of association rules is buys (x,milk) -> buys (x, bread)

800 Communications of the Association for Information Systems (Volume 16, 2005)797-809
Global Diffusion of the Internet VIII: Maximum Resolution Dichotomy for Global Diffusion of the Internet by J.K. Ho
In Kiviat Diagrams (or Star Plots), the polygonal glyph obtained by connecting the plotted values gives “shape” to the data (See Figure 1 above and Figure 2 below). Pattern and structure of such shapes can then provide useful visual cues for EDA. While the shape of the star glyphs depends on the configuration of the attributes along the radial dimensions of the plots, EDA to date simply encourages analysts to investigate the variations on an ad hoc basis. A first step toward a more systematic approach is motivated by the topological analysis of online auction markets [Ho, 2004]. To address the question “What is the Kiviat Diagram shape of an online auction market?” twelve attributes are identified. These attribu5tes fall into two groups, giving rise to a buyer-seller dichotomy. By arranging the seller attributes on the left side and buyer attributes on the right side of a star plot, a glyph for the buyer-seller dichotomy can be drawn. Moreover, if the areas covered by the two parts can be used as a meaningful aggregate measure of their relative dominance, the result will be both visually and intuitively appealing. A larger area on the left (right) side of the glyph means dominance by the left (right) part. In the case of online auction markets, this asymmetry can be interpreted as market conditions being advantageous to either buyers or sellers. Before explaining how such interpretation can be done meaningfully, we show why it may be applied to the GDI framework.
III. GDI AS A MULTI-ATTRIBUTE DICHOTOMY
In general, a multi-attribute dichotomy (MAD) is any multi-dimensional dataset in which the dimensions can be partitioned into two groups, each contributing to one part of the dichotomy. In the GDI framework, the six dimensions do fall into a supply-demand dichotomy. As presented in Wolcott et al., [2001],
• Pervasiveness pertains to individual users; • Sectoral Absorption pertains to organizational users, while • Sophistication of Use refers to both.
Therefore, we can group these three dimensions into the demand side of the dichotomy. On the supply side, we have the other three dimensions:
• Organizational Infrastructure pertaining to the Internet services infrastructure; • Connectivity Infrastructure pertaining to the telecommunications infrastructure; and • Geographic Dispersion which refers to both.
Note that, for example, the terminology of users versus infrastructure, or application versus technology, may be used in lieu of supply versus demand, depending on whatever is more appropriate within specific context of analysis.
To complete the model, two dummy dimensions, named arbitrarily as Top and Bottom, are introduced to serve as boundaries on a vertical axes. For reasons to be explained below, the average value for the six original dimensions is plotted on these two axes. Leaving the ordering of the dimensions within each group arbitrary for the time being, we show China 2000 data in a multi-attribute dichotomy in Figure 2. Note that, in general, it is not necessary for the number of dimensions in each group to be the same.
The concept of using the area of the parts of a dichotomy as an aggregate measure of their relative dominance is plausible, since increasing value of an attribute contributes positively to its designated part, and to the area in the glyph. However, the concept must be refined to realize meaningful interpretation. Refinement can be achieved by exploiting the degrees of freedom allowed by the topology of the glyph, namely, the configuration of the attributes and the angles between adjacent pairs of attributes. For any given arrangement of the attributes, the standard star plot produces a glyph along symmetrically spaced radial axes. Variations from this symmetry, together with permutations of the configuration, offer the choice of topologies that may make the

Communications of the Association for Information Systems (Volume 16, 2005)797-809 801
Global Diffusion of the Internet VIII: Maximum Resolution Dichotomy for Global Diffusion of the Internet by J.K. Ho
Figure 2. Multi-Attribute Dichotomy (MAD) for China 2000
enclosed areas a meaningful aggregate measure of the relative dominance of the two parts of the dichotomy.
To this end, we use the concept of a reference subset of the data instances to help define dichotic dominance. This concept is best explained in a medical scenario. Suppose a certain disease is monitored by a number of symptoms and tests, with a dichotic prognosis of “life” or “death”. Judging from the combination of data for any particular case, it may be difficult to predict. A reference subset is a collection of non-trivial, non-obvious cases with known outcomes, namely life or death. Then an optimization model is used to derive a topology with maximum resolution in discerning dominance with respect to the reference subset [Ho and Chu, 2005].
IV. A MAXIMUM RESOLUTION DICHOTOMY FOR GDI
In the case of GDI, two options are open in choosing the reference subset of dichotomies. First, in the absence of significant insight into the classification of the dichotomies, especially in the early stages of EDA, any initial dataset can be used on an ad hoc basis. An arbitrary configuration of the attributes within each part of the dichotomy is selected with the attributes evenly spaced. The classification of the dichotomies according to this topology is entered into the optimization model. The resulting optimal topology with respect to this reference set provides a working definition of dominance for the dichotomies. This approach is analogous to selecting a portfolio of stocks to provide an index for a stock market. The performance of any stock can be gauged relative to the index, which may be arbitrarily chosen initially. With better knowledge of the significance of individual stocks, more useful indices can be established. By the same token, the maximum resolution topology for multi-attribute dichotomies can be adaptively refined as the EDA for GDI progresses.
Second, when expert opinion is available, the reference subset can be chosen subjectively. An expert (or a panel of experts) is asked to identify some GDI cases that he or she judges with confidence to be “supply-side-dominant”, and others (preferably more or less equal in number) that are “demand-side-dominant”. Consistency is expected of the subjective judgment for the optimization to be feasible.
Subject to the constraints of preserving the prejudged dominance in the reference subset of dichotomies, an optimal topology (configuration of attributes and angles between adjacent pairs)

802 Communications of the Association for Information Systems (Volume 16, 2005)797-809
Global Diffusion of the Internet VIII: Maximum Resolution Dichotomy for Global Diffusion of the Internet by J.K. Ho
is sought that maximizes the discriminating power (sum of absolute differences in left and right areas) for the reference subset.
For any given configuration of the attributes, maximizing the discriminating power can be formulated as a linear program (LP). However, LP produces extreme-point solutions, which may reduce some of the angles between attributes to zero, thus collapsing the glyph. To avoid such degeneration, maximization with bounded variation of the angles is modeled as a goal program (GP) [Ho and Chu, 2005], as summarized in Appendix I. With only 36 combinations of configurations, they are explicitly evaluated to arrive at the optimal topology.
In this context, maximum resolution does not imply the classification of the most dichotomies. Any topology can classify all instances in a dataset3. The critical factor is that as aggregate measures, different topologies may classify the same dichotomy differently. The maximum resolution model rationalizes the choice of one that best “enforces” the classifications in the reference subset. Also, the choice of setting the data values on the dummy dimensions at the average of the original six dimensions is necessary to preserve symmetry under optimization. In this way, a GDI case in which all dimensions are at equal levels will produce equal areas in both parts of the dichotomy.
For illustrative purposes, since no expert opinion is on hand, the first option of selecting the reference subset is used. Data from the 24 GDI cases for the following countries in 1999:
Armenia Azerbaijan Belarus Bulgaria Cameroon Canada Chile Egypt Estonia France Georgia India Kenya Madagascar Mauritius Mexico Nepal, Sri Lanka Tunisia Turkmenistan Uganda United
Kingdom Uzbekistan Vietnam
is adapted from Press [1999]. This input to the optimization model produces a maximum resolution topology (MRT) with the ordering (from the Top axis) shown in Table 2.
Table 2. Maximum Resolution Typology for the 24 GDI Cases
Supply Dimension Demand Dimension
Connectivity Infrastructure (CON) Geographic Dispersion (GEO) Organizational Infrastructure (ORG)
Sophistication of Use (SOP) Pervasiveness (PER) Sectoral Absorption (SEC)
The optimal angles (in units of π from the Top axis) are (0.1250, 0.1250, 0.4125, 0.3375) for the supply dimensions, and (0.1250, 0.1958, 0.5542, 0.1250) for the demand dimensions, respectively. When a MAD is plotted in a MRT, the resulting glyph is called a Maximum Resolution Dichotomy (MRD). Figure 3 plots China 2000 in the MRT in Table 2. Since the star glyph topology accentuates pair-wise correlation among the attributes, we observe that Geographic Dispersion and Organizational Infrastructure have the highest correlated effect for the supply dimensions whereas Pervasiveness and Sectoral Absorption do so for the demand dimensions, with assigned weights of 0.4125 and 0.5542, respectively.
3 Except in degenerate cases where the areas are numerically equal.

Communications of the Association for Information Systems (Volume 16, 2005)797-809 803
Global Diffusion of the Internet VIII: Maximum Resolution Dichotomy for Global Diffusion of the Internet by J.K. Ho
Figure 3. Maximum Resolution Dichotomy (MRD) for China 2000
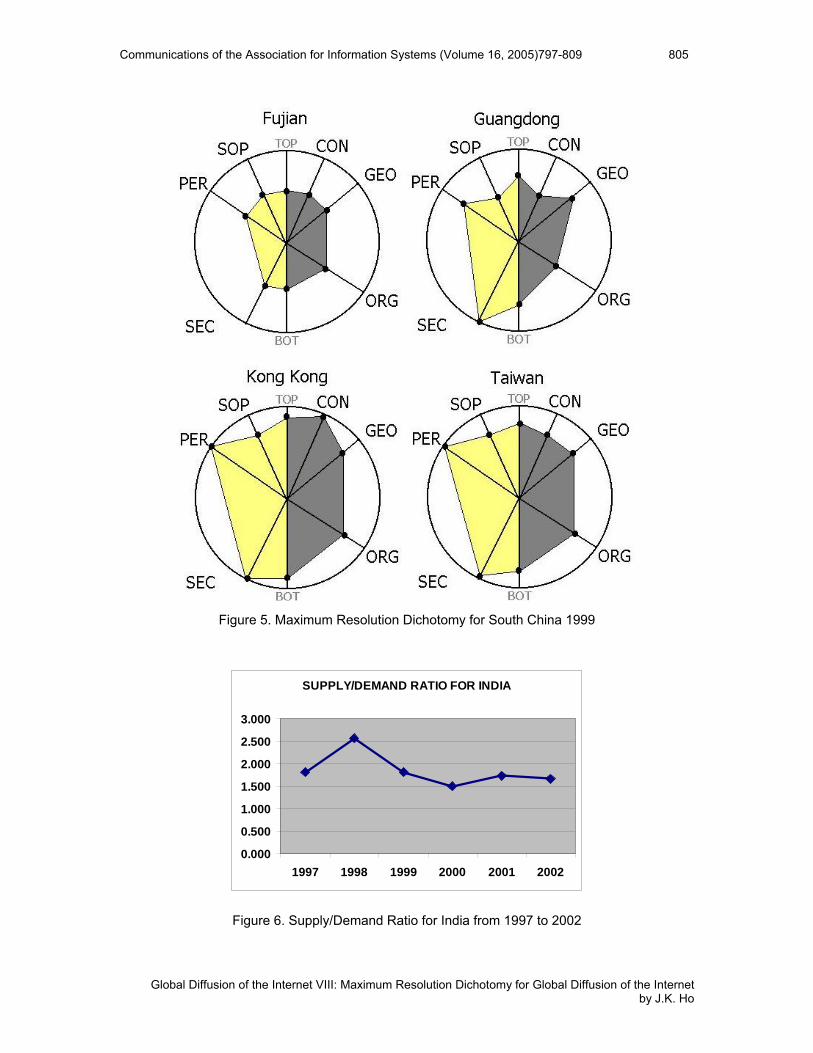
Figure 4 presents the results of applying the MRT based on the 24-case reference set of 1999 to the time study of India from 1997 to 2002 [Wolcott and Goodman, 2003]. Observe that India can be classified as “supply-side-dominant” throughout these years. In contrast, three of the four regions in South China [Foster et al., 1999]--Guangdong, Hong Kong, and Taiwan--are classified “demand-side-dominant” (Figure 5). The fourth, Fujian, is symmetrically rated and hence “neutral”. For further quantitative comparisons in either inter-temporal or inter-regional studies, the computed results for the dichotomies can be analyzed and displayed in other graphical forms than Kiviat diagrams. For example, in the case of India from 1997 to 2002, the ratios of supply-side area to demand-side area, which can serve as an index of supply-side dominance, are 1.818, 2.563, 1.811, 1.505, 1.735, 1.667, respectively. They are plotted as a time series in Figure 6.
V. DISCUSSION
The paper presents an optimization approach to derive a maximum resolution topology for the GDI framework. The framework is cast as a multi-attribute dichotomy, with a supply side and a demand side. As an extension of the Kiviat Diagram to display multi-dimensional data, the areas spanned by the supply-side and demand-side attributes of a data instance in GDI suggest an aggregate measure of the relative dominance of the corresponding parts. By optimizing over the ordering of the attributes as well as the angles among them, we obtain a configuration with maximum resolution with respect to a reference subset of pre-classified cases. Preliminary results demonstrate the methodology rather than establish actual benchmarks in GDI. Our choice of dimensions, dichotomy, and reference set, while based on well known models and data in the literature, is by no means definitive. It is an illustration of the approach which promises interesting results. Future work includes expounding the application of this dichotomy as a significant output of Exploratory Data Analysis for GDI, and refining the selection of the reference set by, for example, incorporating expert judgment from researchers in the field.
Editor’s Note: This article was received on June 22, 2005 and was published on December 7, 2005. It was with the author three weeks for 2 revisions.

804 Communications of the Association for Information Systems (Volume 16, 2005)797-809
Global Diffusion of the Internet VIII: Maximum Resolution Dichotomy for Global Diffusion of the Internet by J.K. Ho
Figure 4. Maximum Resolution Dichotomy for India 97-02
Communications of the Association for Information Systems (Volume 16, 2005)797-809 805
Global Diffusion of the Internet VIII: Maximum Resolution Dichotomy for Global Diffusion of the Internet by J.K. Ho
Figure 5. Maximum Resolution Dichotomy for South China 1999
SUPPLY/DEMAND RATIO FOR INDIA
0.000
0.500
1.000
1.500
2.000
2.500
3.000
1997 1998 1999 2000 2001 2002
Figure 6. Supply/Demand Ratio for India from 1997 to 2002

806 Communications of the Association for Information Systems (Volume 16, 2005)797-809
Global Diffusion of the Internet VIII: Maximum Resolution Dichotomy for Global Diffusion of the Internet by J.K. Ho
REFERENCES
EDITOR’S NOTE: The following reference list contains the address of World Wide Web pages. Readers who have the ability to access the Web directly from their computer or are reading the paper on the Web, can gain direct access to these references. Readers are warned, however, that
1. these links existed as of the date of publication but are not guaranteed to be working thereafter.
2. the contents of Web pages may change over time. Where version information is provided in the References, different versions may not contain the information or the conclusions referenced.
3. the authors of the Web pages, not CAIS, are responsible for the accuracy of their content.
4. the author of this article, not CAIS, is responsible for the accuracy of the URL and version information.
Ankerst M., M. Ester, H. P. Kriegel. 2000. Towards an Effective Cooperation of the Computer and the User for Classification, Proc. ACM SIGKDD Int. Conf. on Knowledge Discovery & Data Mining (KDD 2000), Boston, MA, pp. 179-188.
Bohanec, M., B. Zupan. 2001. Integrating Decision Support and Data Mining by Hierarchical Multi-Attribute Decision Models,” in Giraud-Carrier, C., Lavrač, N., Moyle, S., Kavšek, B.(eds) IDDM-2001: ECML/PKDD-2001 Workshop Integrating Aspects of Data Mining, Decision Support and Meta-Learning Freiburg, Germany pp. 25-36.
Chambers, J., W. Cleveland, B. Kleiner, P. Tukey. 1983. Graphical Methods for Data Analysis, Belmont, CA: Wadsworth Press.
Chen, M. S., J. Han, P. S. Yu. 1996. Data Mining: An Overview from a Database Perspective, IEEE Transactions on Knowledge and Data Engineering 8(6) pp. 866 - 883.
Foster, W., S. E. Goodman, Z. Tan, Z., G. Burkhart. 1999. The Internet and Greater South China (Taiwan, Hong Kong, Fujian, and Guangdong), http://mosaic.unomaha.edu/schina.pdf; accessed on June 6, 2005.
Foster, W., S. E. Goodman. 2000. The diffusion of the Internet in China, Center for International Security and Cooperation (CISAC), Stanford University, November. http://mosaic. unomaha.edu/china_2000.pdf accessed on June 6, 2005.
Ho, J. K. 2004. Topological Analysis of Online Auction Markets, International Journal of Electronic Markets 14(3) 202-213.
Ho, J. K., S. C. K. Chu. 2005. Maximum Resolution Topology for Multi-Attribute Dichotomies, INFORMATICA (to appear).
Hoffman, P., G. Grinstein. 2001. A Survey of Visualizations for High-Dimensional Data Mining, in U. Fayyad et al (eds.) Information Visualization in Data Mining and Knowledge Discovery, San Francisco, CA: Morgan Kaufmann, pp. 47-82.
Keim, D. A. 2002. Information Visualization and Visual Data Mining, IEEE Transactions on Visualization and Computer Graphics, 7(1) 100-107.
Kolence, K., P. Kiviat. 1973. Software Unit Profiles and Kiviat Figures. ACM SIGMETRICS, Performance Evaluation Review, 2(3) September, 2-12.
Mosaic Group. 2005. Global Diffusion of the Internet (GDI) Project: http://mosaic.unomaha.edu/ gdi.html accessed on June 6, 2005.
Press, L. 1999. Second Internet Diffusion Survey, OnTheInternet 5(6), Nov/ Dec.
http://som.csudh.edu/fac/lpress/gdiff/otidevnations.htm accessed on June 6, 2005. Tukey, J. W. 1977. Exploratory Data Analysis. Reading, MA: Addison-Wesley, Wolcott, P., Press, L., McHenry, W., Goodman, S.E. and Foster, W. 2001. A Framework for
Assessing the Global Diffusion of the Internet, Journal of the AIS, 2(6), 2001. http://jais.isworld.org/articles/default.asp?vol=2&art=6 accessed on October 19, 2005.

Communications of the Association for Information Systems (Volume 16, 2005)797-809 807
Global Diffusion of the Internet VIII: Maximum Resolution Dichotomy for Global Diffusion of the Internet by J.K. Ho
Wolcott, P., S. E Goodman. 2003. Global diffusion of the Internet I: India: Is the Elephant Learning to Dance?", Communications of the AIS, (11) pp. 560-646. http://mosaic.unomaha.edu/India_2003.pdf accessed on June 6, 2005.
APPENDIX I. THE GOAL PROGRAMMING MODEL FOR MAXIMUM RESOLUTION TOPOLOGY (MRT-GP)4
In the Kiviat diagram, denote the angles between attributes xi-1 and xi by αi, i ∈ I, and that
between attributes yj-1 and jy by βj, j ∈ J, for all |K| records in the reference set, as illustrated in
the figure. Let the weights be .,Sinand;,Sin JjbIia jjii ∈≡∈≡ βα
The |K| records are partitioned according to prejudgment in the reference set, such that
,−+ ∪≡ KKK for “left-” and “right-” dominance, respectively. The MRT-GP with decision variables ai, i ∈ I and bj, j ∈ J is then given by
Max TtlMRT Min TtlDev Min TtlVar
Subject to
4 [Ho and Chu, 2005]:

808 Communications of the Association for Information Systems (Volume 16, 2005)797-809
Global Diffusion of the Internet VIII: Maximum Resolution Dichotomy for Global Diffusion of the Internet by J.K. Ho
∑∑
∑∑
−+ ∈∈
∈∈
−+
+=
∈≥∈≥
==
∈=−∈=−
Kk
k
Kk
k
ii
Jjj
Iii
kkkkkk
ED
JjbIia
baKkEABKkDBA
TtlMRT
,0;,0
;1;1,and,
∑∑
∑∑
∈∈
∈∈
+++=
+++=
JjIi
JjIi
jj|J|
ii|I|
jj|J|
ii|I|
)]()([1)]()([1
)]()([1)]()([1
NVarYPVarYNVarXPVarXTtlVar
NDevYPDevYNDevXPDevXTtlDev
(Deviation bounds)
Jj|J|
F|J|
b|J|
F|J|
Ii|I|
F|I|
a|I|
F|I|
i
i
∈⎟⎟⎠
⎞⎜⎜⎝
⎛−∗+≤≤∗−
∈⎟⎟⎠
⎞⎜⎜⎝
⎛−∗+≤≤∗−
,11111
,11111
(Deviation goal constraints)
Jj|J|
jjb
Ii|I|
iia
j
i
∈=+−
∈=+−
,1)()(
,1)()(
NDevYPDevY
NDevXPDevX
(Variation/smoothing goal constraints)
)(,0)()()(,0)()(
011
011
bbJjjjbbaaIiiiaa
njj
mii
≡∈=+−−≡∈=+−−
++
++
NVarYPVarY
NVarXPVarX
The 0 < F < 1 parameter in the MRT-GP formulation above is the fraction of deviation from equal weights allowed for the weight variables a and b.

Communications of the Association for Information Systems (Volume 16, 2005)797-809 809
Global Diffusion of the Internet VIII: Maximum Resolution Dichotomy for Global Diffusion of the Internet by J.K. Ho
LIST OF ACRONYMS
EDA Exploratory Data Analysis GDI Global Diffusion of the Internet GP Goal Program LP Linear Program MAD Multi-Attribute Dichotomy MRD Maximum Resolution Dichotomy MRT Maximum Resolution Topology
ABOUT THE AUTHOR
James K. Ho is professor of information and decision sciences in the College of Business Administration at the University of Illinois at Chicago. He graduated from Columbia University in 1970 and obtained his Ph.D from Stanford University in 1974. His recent work focuses on parallel natural language generation in multilingual online communication, and topological analysis of online auction markets.
Copyright © 2005 by the Association for Information Systems. Permission to make digital or hard copies of all or part of this work for personal or classroom use is granted without fee provided that copies are not made or distributed for profit or commercial advantage and that copies bear this notice and full citation on the first page. Copyright for components of this work owned by others than the Association for Information Systems must be honored. Abstracting with credit is permitted. To copy otherwise, to republish, to post on servers, or to redistribute to lists requires prior specific permission and/or fee. Request permission to publish from: AIS Administrative Office, P.O. Box 2712 Atlanta, GA, 30301-2712 Attn: Reprints or via e-mail from [email protected].

ISSN: 1529-3181 EDITOR-IN-CHIEF
Paul Gray Claremont Graduate University
AIS SENIOR EDITORIAL BOARD Jane Webster Vice President Publications Queen’s University
Paul Gray Editor, CAIS Claremont Graduate University
Kalle Lyytinen Editor, JAIS Case Western Reserve University
Edward A. Stohr Editor-at-Large Stevens Inst. of Technology
Blake Ives Editor, Electronic Publications University of Houston
Reagan Ramsower Editor, ISWorld Net Baylor University
CAIS ADVISORY BOARD Gordon Davis University of Minnesota
Ken Kraemer Univ. of Calif. at Irvine
M.Lynne Markus Bentley College
Richard Mason Southern Methodist Univ.
Jay Nunamaker University of Arizona
Henk Sol Delft University
Ralph Sprague University of Hawaii
Hugh J. Watson University of Georgia
CAIS SENIOR EDITORS Steve Alter U. of San Francisco
Chris Holland Manchester Bus. School
Jaak Jurison Fordham University
Jerry Luftman Stevens Inst.of Technology
CAIS EDITORIAL BOARD Tung Bui University of Hawaii
Fred Davis U.ofArkansas, Fayetteville
Candace Deans University of Richmond
Donna Dufner U.of Nebraska -Omaha
Omar El Sawy Univ. of Southern Calif.
Ali Farhoomand University of Hong Kong
Jane Fedorowicz Bentley College
Brent Gallupe Queens University
Robert L. Glass Computing Trends
Sy Goodman Ga. Inst. of Technology
Joze Gricar University of Maribor
Ake Gronlund University of Umea,
Ruth Guthrie California State Univ.
Alan Hevner Univ. of South Florida
Juhani Iivari Univ. of Oulu
Claudia Loebbecke University of Cologne
Michel Kalika U. of Paris Dauphine
Munir Mandviwalla Temple University
Sal March Vanderbilt University
Don McCubbrey University of Denver
Michael Myers University of Auckland
Seev Neumann Tel Aviv University
Dan Power University of No. Iowa
Ram Ramesh SUNY-Buffalo
Kelley Rainer Auburn University
Paul Tallon Boston College
Thompson Teo Natl. U. of Singapore
Doug Vogel City Univ. of Hong Kong
Rolf Wigand U. of Arkansas,LittleRock
Upkar Varshney Georgia State Univ.
Vance Wilson U.of Wisconsin,Milwaukee
Peter Wolcott U. of Nebraska-Omaha
Ping Zhang Syracuse University
DEPARTMENTS Global Diffusion of the Internet. Editors: Peter Wolcott and Sy Goodman
Information Technology and Systems. Editors: Alan Hevner and Sal March
Papers in French Editor: Michel Kalika
Information Systems and Healthcare Editor: Vance Wilson
ADMINISTRATIVE PERSONNEL Eph McLean AIS, Executive Director Georgia State University
Reagan Ramsower Publisher, CAIS Baylor University