IAB report on Online Ad Spend The Netherlands 2013 · IAB report on Online Ad Spend The Netherlands...
43
IAB report on Online Ad Spend The Netherlands 2013 March 2014
Transcript of IAB report on Online Ad Spend The Netherlands 2013 · IAB report on Online Ad Spend The Netherlands...

IAB report on Online Ad Spend The Netherlands 2013
March 2014
interactiveadvertisingbureau

IAB report on Online Ad Spend The Netherlands 2013 2
Introduction and summary

IAB report on Online Ad Spend The Netherlands 2013 3
This years edition is based on data supplied by 46 companies, which allows us to gain extensive insight in the market. Deloitte also conducted validation discussions on the preliminary results with different parties including publishers, advertisers and media planners.
Due to improvements in the survey and better internal reporting by survey respondents, we have made adjustments in the previous figures for industry revenue splits and sales channels. Increased knowledge in Programmatic trading enabled us to better estimates regarding not participating industry players.
Since 2010, IAB and Deloitte are publishing the online advertising spend report for The Netherlands every half year. In the previous years, the study has received positive feedback from the online community and the current edition – which covers 2013 FY has great participation from key industry players.
Introduction
Joris van HeukelomIAB | Chairman
"2013 was a year of uncertainty, the stagnation shown in the results of last half year of 2012 continued at the start of 2013. The big question was if this negative trend would continue. However, last half year of 2013 showed an upward trend, resulting in an overall growth in 2013 compared to 2012. 2013 was also the year that the numbers on video and mobile advertising finally represented the buzz in the advertising market. Expectations are that growth of these formats will continue in 2014. Partly due to the improvement in economic conditions online advertising is expected to provide further growth in 2014. Also we expect budgets on branding to continue to shift from TV to online advertising, so we expect 2014 to be a year of growth."
Roel van RijsewijkDeloitte | Deloitte Digital
“The year 2013 shows the strength of digital as a marketing instrument and marks a turning point concerning mobile media. A deeper analysis of the figures shows that the local digital media-players are rapidly loosing their competitive ground while almost all the growth in digital last year is coming for international entities. This should be a wake up call for the local players to perform better.”
IAB report on Online Ad Spend The Netherlands 2013 4
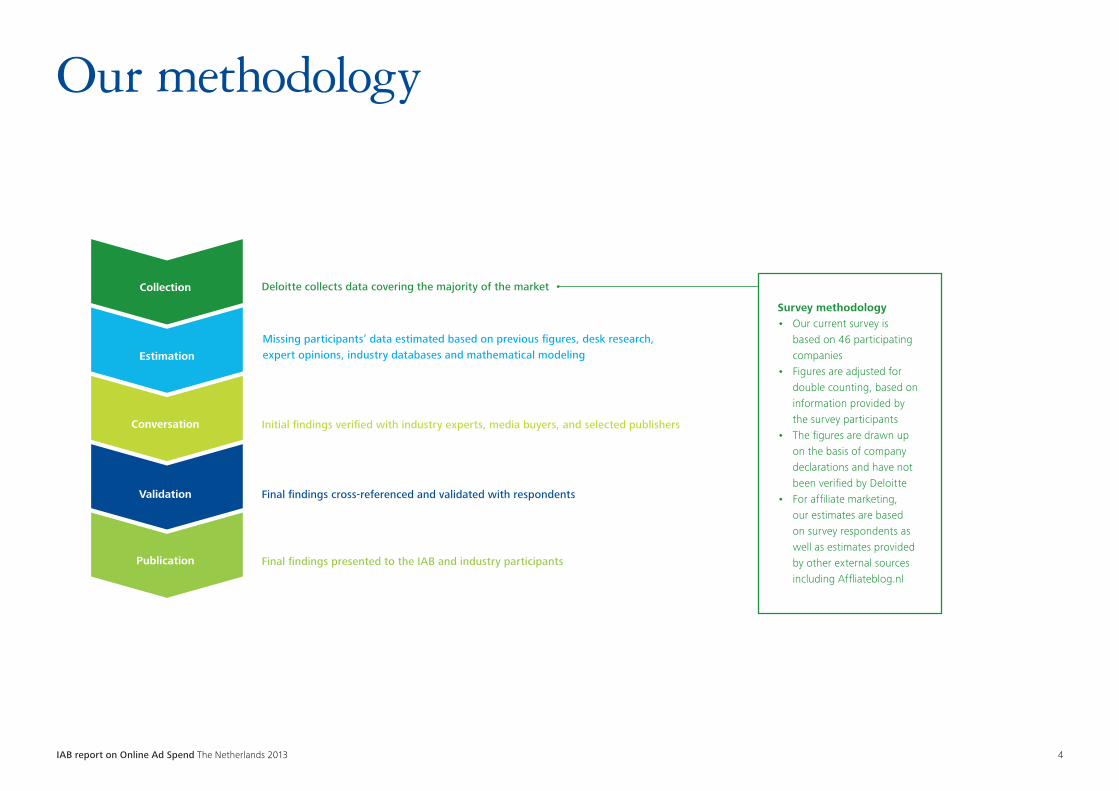
Our methodology
Publication
Estimation
Conversation
Validation
Collection
Missing participants’ data estimated based on previous figures, desk research, expert opinions, industry databases and mathematical modeling
Deloitte collects data covering the majority of the market
Final findings cross-referenced and validated with respondents
Final findings presented to the IAB and industry participants
Initial findings verified with industry experts, media buyers, and selected publishers
Survey methodology• Our current survey is
based on 46 participating companies
• Figures are adjusted for double counting, based on information provided by the survey participants
• The figures are drawn up on the basis of company declarations and have not been verified by Deloitte
• For affiliate marketing, our estimates are based on survey respondents as well as estimates provided by other external sources including Affliateblog.nl
IAB report on Online Ad Spend The Netherlands 2013 5
Executive summary
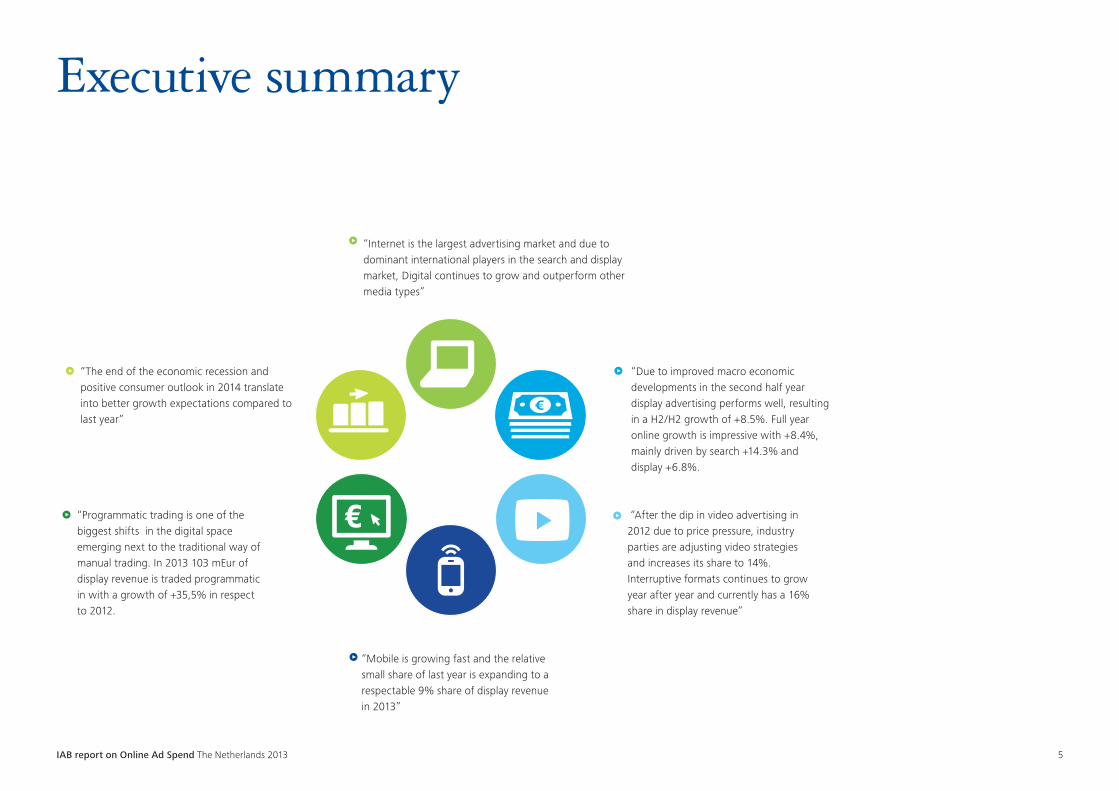
“Internet is the largest advertising market and due to dominant international players in the search and display market, Digital continues to grow and outperform other media types”
“Due to improved macro economic developments in the second half year display advertising performs well, resulting in a H2/H2 growth of +8.5%. Full year online growth is impressive with +8.4%, mainly driven by search +14.3% and display +6.8%.
“The end of the economic recession and positive consumer outlook in 2014 translate into better growth expectations compared to last year”
“After the dip in video advertising in 2012 due to price pressure, industry parties are adjusting video strategies and increases its share to 14%. Interruptive formats continues to grow year after year and currently has a 16% share in display revenue”
“Mobile is growing fast and the relative small share of last year is expanding to a respectable 9% share of display revenue in 2013”
“Programmatic trading is one of the biggest shifts in the digital space emerging next to the traditional way of manual trading. In 2013 103 mEur of display revenue is traded programmatic in with a growth of +35,5% in respect to 2012.

IAB report on Online Ad Spend The Netherlands 2013 6
Background

IAB report on Online Ad Spend The Netherlands 2013 7
GDP
Total advertising growth rate YoY
GDP Growth rate YoY
555550
547
GD
P (€
b)
Yea
r on
Yea
r gr
owth
(%)
-2%
-1%
0%
1%
2%
500
525
550
575
600
2011 2012 2013E 2014F 2015F
Dutch GDP projections
553
562
The economic outlook for the Netherlands shows that 2013 was a challenging year. For 2014 the end of the economic recession is expected, having a positive impact on advertising spend.
Dutch economy
Comments• GDP is expected to grow with
positive number after 2013, with +1,1% in 2014 and +1,6% in 2015 Given the close relationship between GDP and the advertising market we expect the outlook to improve.
Note: Real GDP based on constant prices
Source: IMF, Zenith Optimedia, SPOT, STIR, RAB, GroupM, Company annual reports, Deloitte analysis
IAB report on Online Ad Spend The Netherlands 2013 8
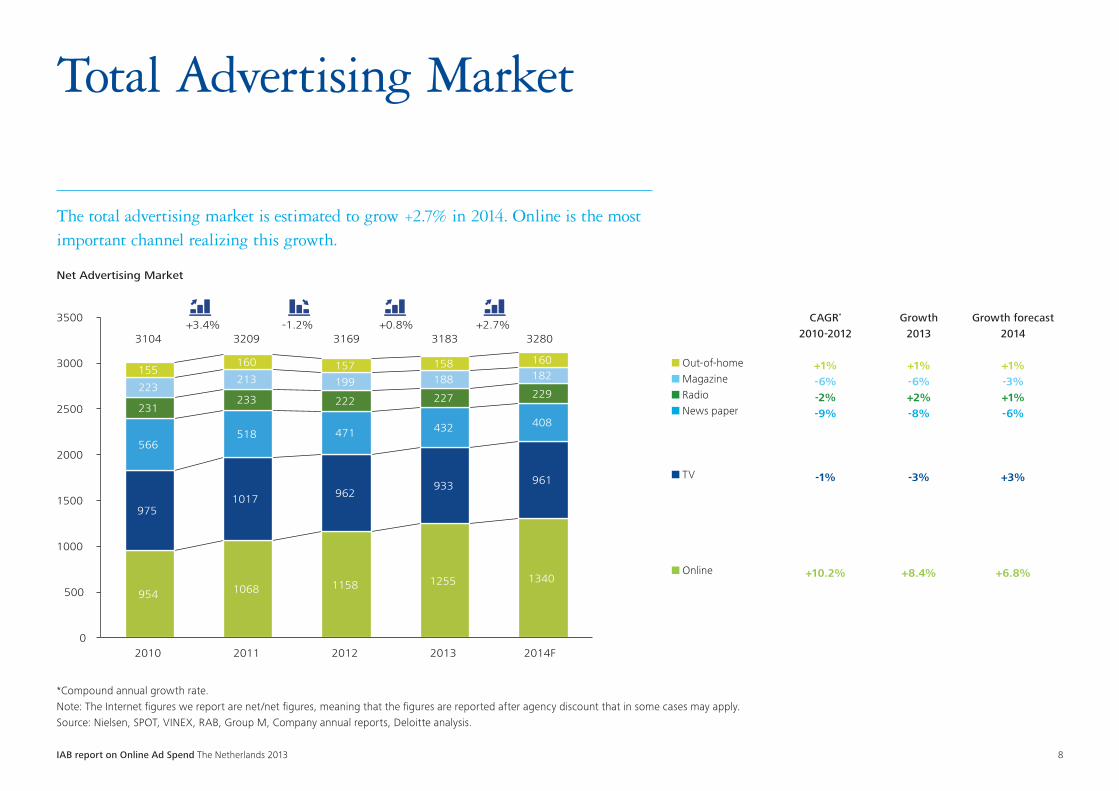
The total advertising market is estimated to grow +2.7% in 2014. Online is the most important channel realizing this growth.
Total Advertising Market
CAGR*
2010-2012
+1%-6%-2%-9%
-1%
+10.2%
Growth forecast2014
+1%-3%+1%-6%
+3%
+6.8%
Growth2013
+1%-6%+2%-8%
-3%
+8.4%
954 1068 1158 1255 1340
9751017 962
933 961
566 518 471 432 408
231 233 222 227 229 223 213 199 188 182 155 160 157 158 160
0
500
1000
1500
2000
2500
3000
3500
2010
3104 +3.4%
3209 3169 3183 3280
2011 2012 2013 2014F
Net Advertising Market
Out-of-home
Magazine
Radio
News paper
TV
Online
+0.8% +2.7% -1.2%
Out-of-home Magazine Radio News paper
TV
Online
*Compound annual growth rate. Note: The Internet figures we report are net/net figures, meaning that the figures are reported after agency discount that in some cases may apply. Source: Nielsen, SPOT, VINEX, RAB, Group M, Company annual reports, Deloitte analysis.

IAB report on Online Ad Spend The Netherlands 2013 9
2013 Results
IAB report on Online Ad Spend The Netherlands 2013 10
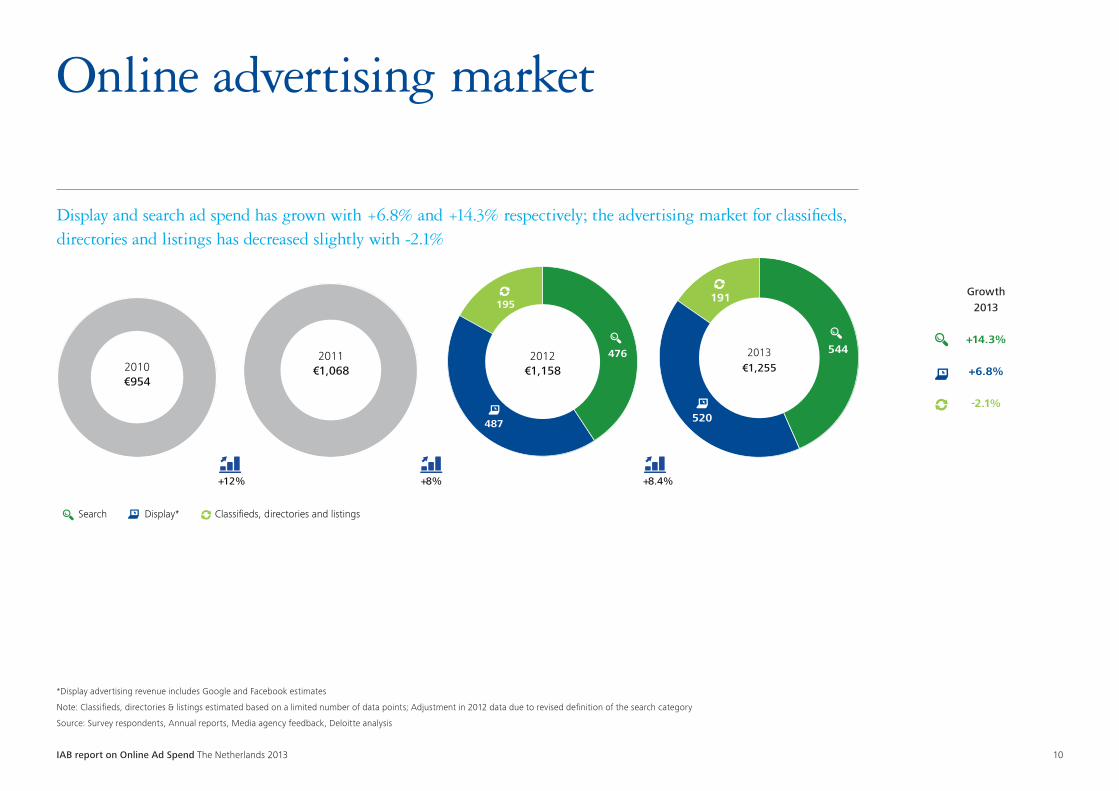
*Display advertising revenue includes Google and Facebook estimates
Note: Classifieds, directories & listings estimated based on a limited number of data points; Adjustment in 2012 data due to revised definition of the search category
Source: Survey respondents, Annual reports, Media agency feedback, Deloitte analysis
Display and search ad spend has grown with +6.8% and +14.3% respectively; the advertising market for classifieds, directories and listings has decreased slightly with -2.1%
Online advertising market
Growth2013
+14.3%
+6.8%
-2.1%
+12% +8% +8.4%
2011€1,0682010
€954
Display*Search Classifieds, directories and listings
476
487
195
544
520
191
2013€1,255
2012€1,158

IAB report on Online Ad Spend The Netherlands 2013 11
Display

IAB report on Online Ad Spend The Netherlands 2013 12
Display advertising
Total display advertising spend has increased with +33m€ in 2013 due to good performance of the second half of 2013
*Estimated display revenue of Google and Facebook
Note: Note: Adjustment in 2012 data due to revised respondent data
Source: Survey respondents, Annual reports, Media agency feedback, Deloitte analysis
168
73
170
73
165
88
76
2013€ 520
2012€ 487
93
174
+5.0%
+8.5%
+6.8%
Display advertising revenue (€m)
Display revenue from Dutch publishers excl. Google and FacebookDisplay revenue of Google and Facebook*
H2 2012€ 246
H1 2012€ 241
H1 2013€ 253
H2 2013€ 267
"The growth in the display advertising market was led by the strong performance of international players. As inventory of display advertising continues to grow, Dutch publishers need to find better ways to enrich the ad impressions to increase their CPM rates"
Gagandeep SethiSenior Manager Strategy | Deloitte Consulting
IAB report on Online Ad Spend The Netherlands 2013 13
Details display advertising
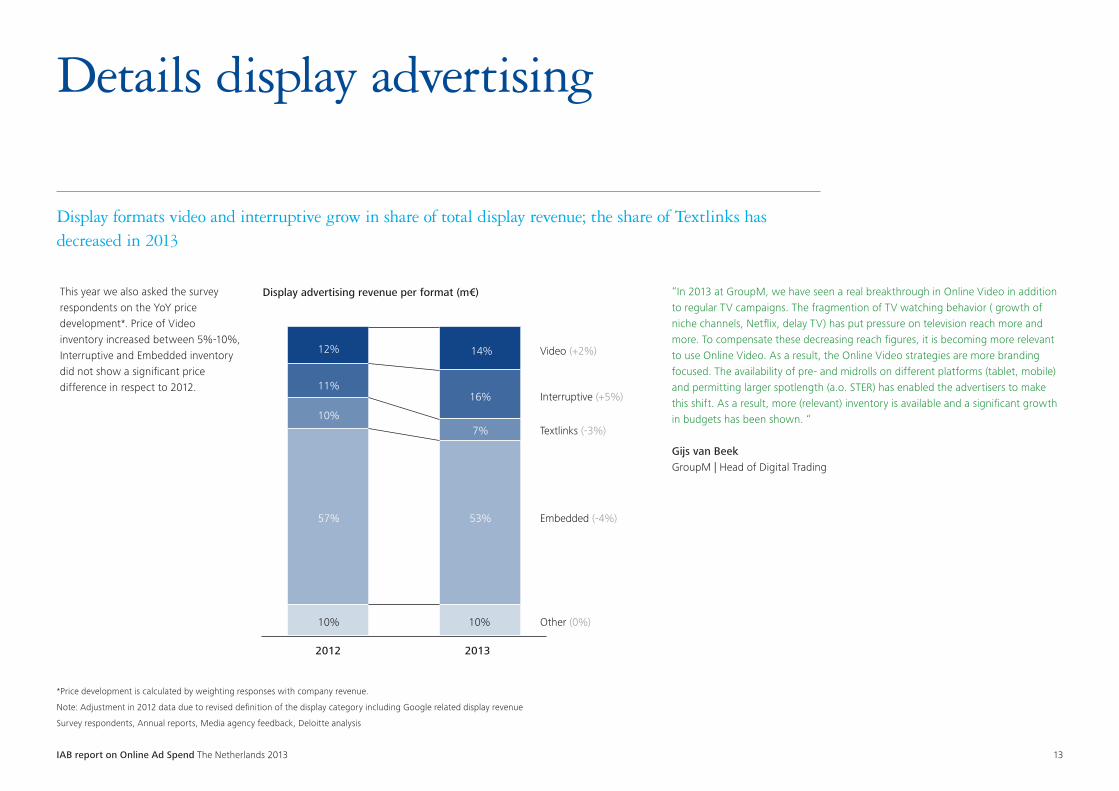
Display formats video and interruptive grow in share of total display revenue; the share of Textlinks has decreased in 2013
*Price development is calculated by weighting responses with company revenue.
Note: Adjustment in 2012 data due to revised definition of the display category including Google related display revenue
Survey respondents, Annual reports, Media agency feedback, Deloitte analysis
10% 10%
57% 53%
10% 7%
11% 16%
12% 14%
2012 2013
Display advertising revenue per format (m€)
Video (+2%)
Interruptive (+5%)
Textlinks (-3%)
Embedded (-4%)
Other (0%)
This year we also asked the survey respondents on the YoY price development*. Price of Video inventory increased between 5%-10%, Interruptive and Embedded inventory did not show a significant price difference in respect to 2012.
“In 2013 at GroupM, we have seen a real breakthrough in Online Video in addition to regular TV campaigns. The fragmention of TV watching behavior ( growth of niche channels, Netflix, delay TV) has put pressure on television reach more and more. To compensate these decreasing reach figures, it is becoming more relevant to use Online Video. As a result, the Online Video strategies are more branding focused. The availability of pre- and midrolls on different platforms (tablet, mobile) and permitting larger spotlength (a.o. STER) has enabled the advertisers to make this shift. As a result, more (relevant) inventory is available and a significant growth in budgets has been shown. “
Gijs van BeekGroupM | Head of Digital Trading

IAB report on Online Ad Spend The Netherlands 2013 14
Display formats: video & interruptive
The advertising spend on interruptive formats continues to increase in share of display revenue. Video is regaining share after loss in 2012; the figure excludes Google and Facebook.
Source: Survey respondents, Deloitte analysis
0%
5%
10%
15%
20%
2011 2012 2013 2014
Video and Interruptive formats share of display revenue
Display, interruptive
Display, video

IAB report on Online Ad Spend The Netherlands 2013 15
Display spend seasonality
Display advertising spend in November and December increased in respect to last year; the figure excludes Google and Facebook.
*MoM% is the Month-over-Month growth
Note: Adjustment in 2012 data due to revised respondent data
Source: Survey respondents, Deloitte analysis
26 26 29 28 29 30
24 23
28 29 30
36
27 24
29 27
29 29
24 23
28 29 31
39
-10%
-5%
0%
5%
10%
0
10
20
30
40
Jan Feb Mar Apr May Jun Jul Aug Oct Sep Nov Dec
Display advertising revenue per month 2012-2013
2012 2013 MoM%
Dis
play
adv
ertis
ing
reve
nue
(m€)
MoM
%
IAB report on Online Ad Spend The Netherlands 2013 16
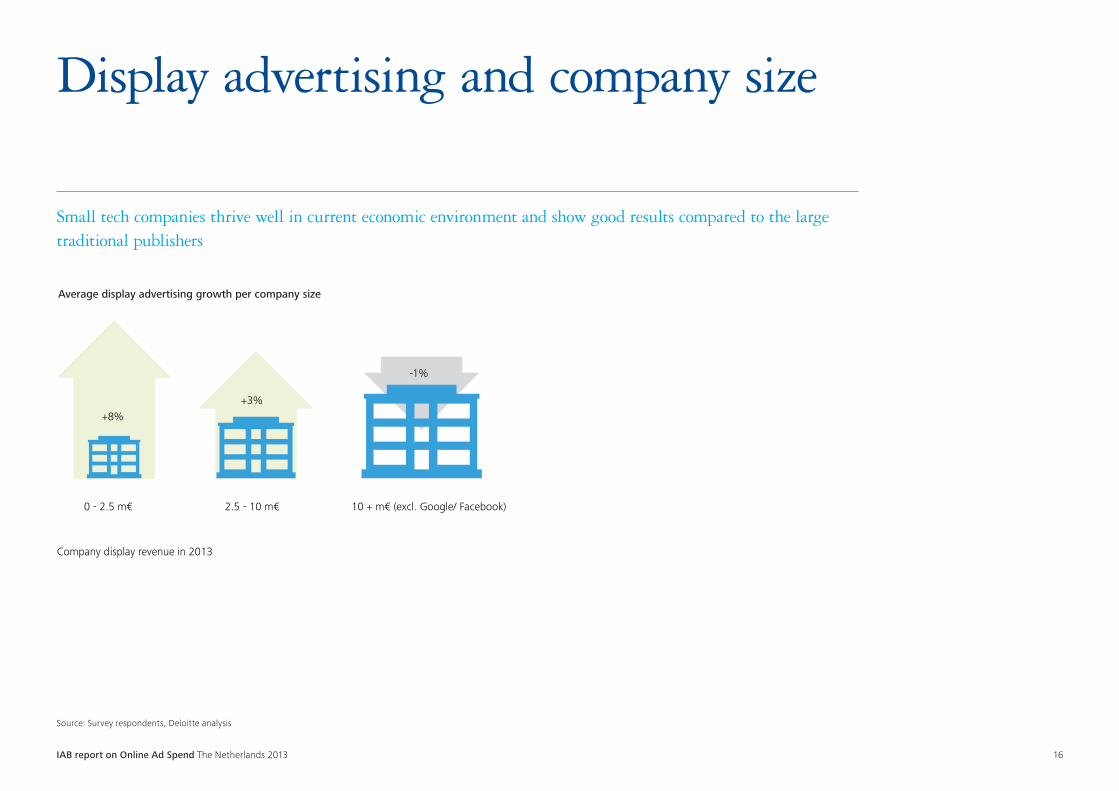
Display advertising and company size
Small tech companies thrive well in current economic environment and show good results compared to the large traditional publishers
Source: Survey respondents, Deloitte analysis
Average display advertising growth per company size
+8%
Company display revenue in 2013
0 - 2.5 m€ 2.5 - 10 m€ 10 + m€ (excl. Google/ Facebook)
+3%
-1%

IAB report on Online Ad Spend The Netherlands 2013 17
4% 5%
7% 6%
3%
12%
2% 3%
2%
6%
18%
7%
9%
7% 7%
9% 8%
5%
14%
3% 3% 2%
5%
16%
5%
7%
Consumergoods
ICTServices
Automotive Retail Free time Telecom Energy Publicsector
Personalcare
Fashion Financialservices
Hardware& electronics
Travel
Industries by revenue share 2012 - 2013
2012 2013
Industry loss in revenue share Industry growth in revenue share
Display industry
Travel and hardware have lost relative share in advertising spend, whilst consumer goods and ICT have shown most growth
Note: Excluding classifieds, directories & listings, search and industry category other. Adjustment in 2012 data due to revised respondent data
Source: Survey respondents, Deloitte analysis

IAB report on Online Ad Spend The Netherlands 2013 18
Display payment model
CPM has increased its share as dominant payment model for display advertising in favor of Fixed and Non-CPM payment models
Note: Adjustment in 2012 data due to revised respondent data
Source: Survey respondents, Deloitte analysis
17% (-3%)
9% (-1%)
2% (-1%) 1% (0%)
CPS CPC CPL Other
Breakdown Non-CPM 2013
51% 51%
57%
37% 34%
29%
12% 15% 14%
0%
20%
40%
60%
2011 2012 2013
CPM
Non-CPM*
Fixed
Display advertising revenue per payment model 2011-2013 "CPM shows significant growth at cost of the more performance oriented models as CPS , CPC and CPL, which is mainly due to the increase in programmatic trading. However, it needs to be noted that deals can still be based on performance targets, but that the final cost calculation is based on CPM rates, influencing the results of this study."
Roel van RijsewijkDeloitte | Deloitte Digital
IAB report on Online Ad Spend The Netherlands 2013 19
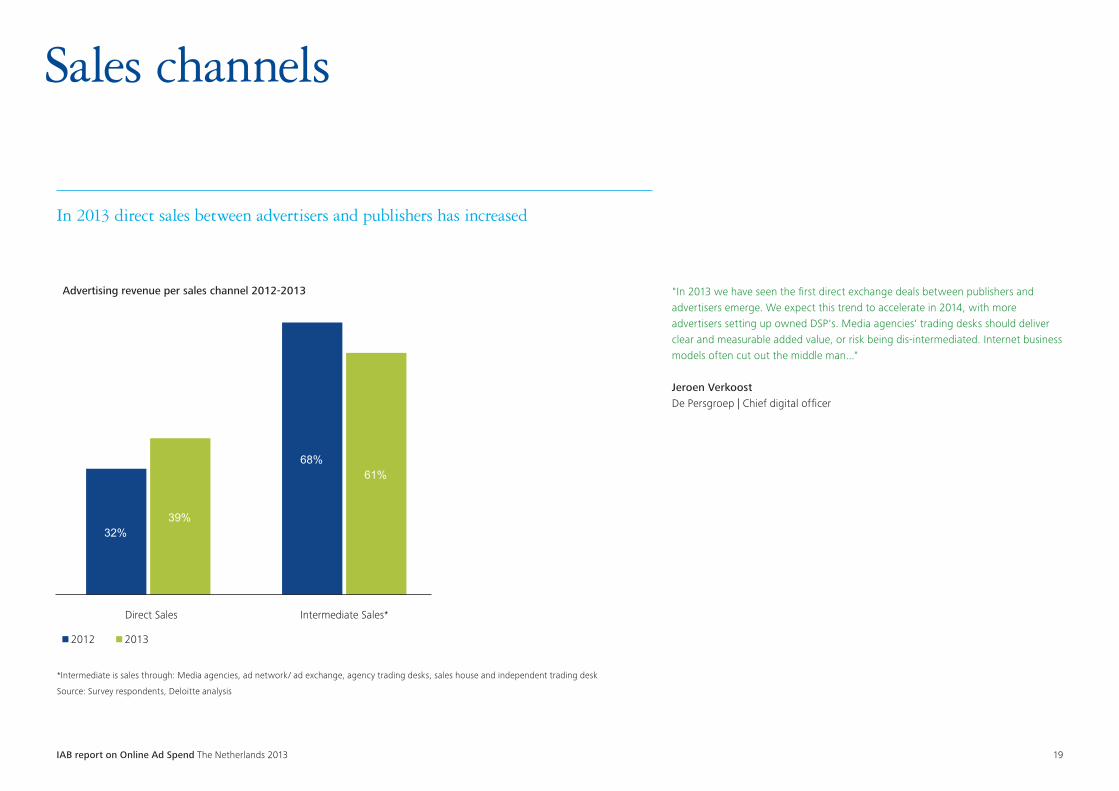
Sales channels
In 2013 direct sales between advertisers and publishers has increased
*Intermediate is sales through: Media agencies, ad network/ ad exchange, agency trading desks, sales house and independent trading desk
Source: Survey respondents, Deloitte analysis
32%
68%
39%
61%
Direct Sales Intermediate Sales*
Advertising revenue per sales channel 2012-2013
2012 2013
"In 2013 we have seen the first direct exchange deals between publishers and advertisers emerge. We expect this trend to accelerate in 2014, with more advertisers setting up owned DSP's. Media agencies' trading desks should deliver clear and measurable added value, or risk being dis-intermediated. Internet business models often cut out the middle man..."
Jeroen VerkoostDe Persgroep | Chief digital officer
IAB report on Online Ad Spend The Netherlands 2013 20
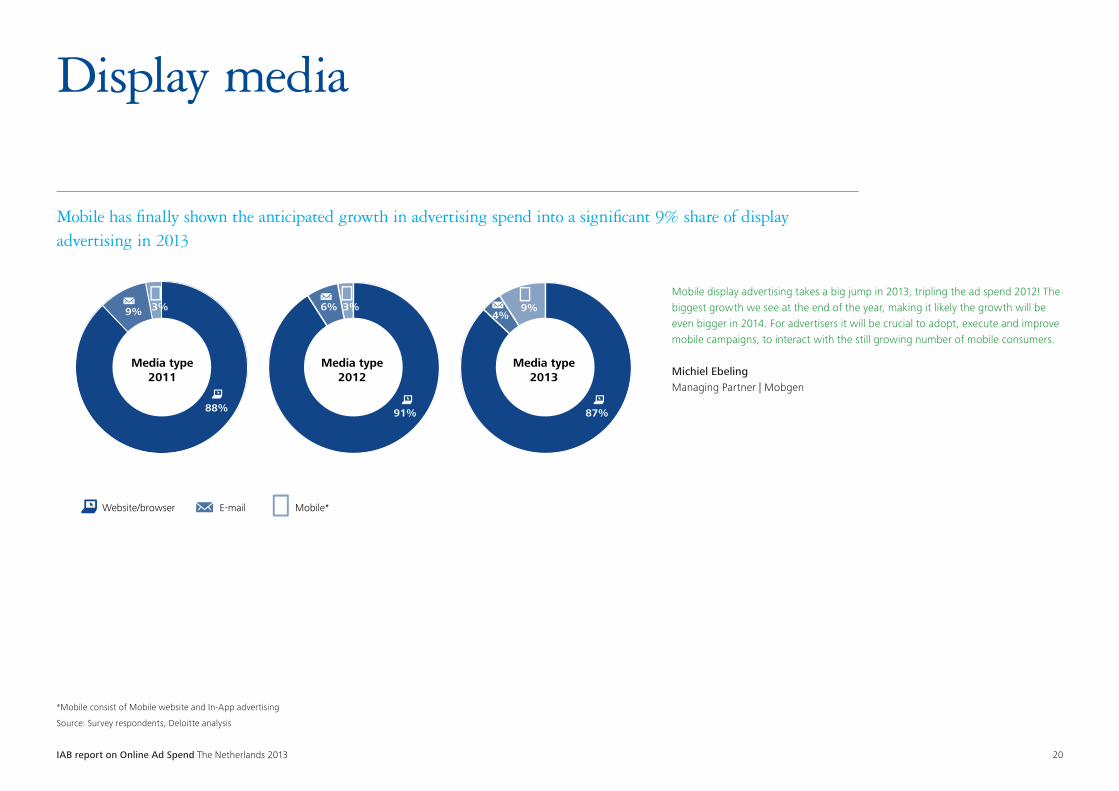
Display media
Mobile has finally shown the anticipated growth in advertising spend into a significant 9% share of display advertising in 2013
*Mobile consist of Mobile website and In-App advertising
Source: Survey respondents, Deloitte analysis
9%
88%
Media type2011
Media type2012
91%
6% 3%3%
Media type2013
87%
4%9%
Mobile* E-mailWebsite/browser
Mobile display advertising takes a big jump in 2013, tripling the ad spend 2012! The biggest growth we see at the end of the year, making it likely the growth will be even bigger in 2014. For advertisers it will be crucial to adopt, execute and improve mobile campaigns, to interact with the still growing number of mobile consumers.
Michiel Ebeling Managing Partner | Mobgen

IAB report on Online Ad Spend The Netherlands 2013 21
Mobile

IAB report on Online Ad Spend The Netherlands 2013 22
Mobile display advertising
Mobile ad spend, combined of mobile website & in-app advertising, has reached more than 10% share of display at the end of 2013
Source: Survey respondents, Deloitte analysis
0%
1%
2%
3%
4%
5%
6%
2011 2012 2013 2014
Mobile website and In-App advertising share of display revenue (%)
In-app
Mobile website
"In this study we specifically focus on ad spend, meaning that mobile advertising is considered mobile when the advertiser explicitly targets it as a mobile campaign and advertisements are served on mobile websites or in-app. However, expectations are that big publishers will transform their website to responsive sites in 2014, and targeting is not based on the browser type anymore, blurring the line between mobile and online."
Roel van RijsewijkDeloitte | Deloitte Digital
"Last year advertisers embraced mobile advertising. Consumers embraced mobile devices long before, yet 2013 is the year more and more advertisers found the role for mobile advertising in their digital strategy. 2014 will surely be the year of mobile, as it becomes more clear to everyone that mobile will not only play a role in digital strategies, it will play a central role in any digital strategy."
Diederick UbelsMobile Professionals| Co-Founder & General Manager
IAB report on Online Ad Spend The Netherlands 2013 23
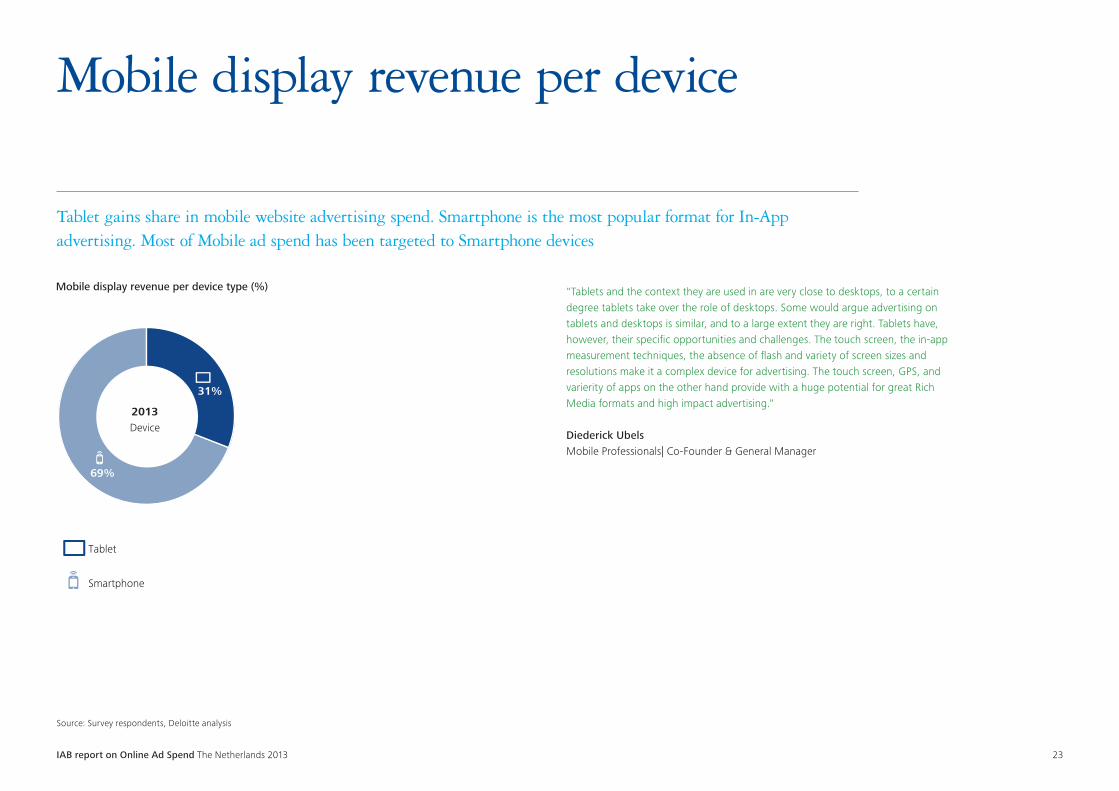
Mobile display revenue per device
Tablet gains share in mobile website advertising spend. Smartphone is the most popular format for In-App advertising. Most of Mobile ad spend has been targeted to Smartphone devices
Source: Survey respondents, Deloitte analysis
Mobile display revenue per device type (%)
Smartphone
Tablet
31%
69%
2013Device
"Tablets and the context they are used in are very close to desktops, to a certain degree tablets take over the role of desktops. Some would argue advertising on tablets and desktops is similar, and to a large extent they are right. Tablets have, however, their specific opportunities and challenges. The touch screen, the in-app measurement techniques, the absence of flash and variety of screen sizes and resolutions make it a complex device for advertising. The touch screen, GPS, and varierity of apps on the other hand provide with a huge potential for great Rich Media formats and high impact advertising."
Diederick UbelsMobile Professionals| Co-Founder & General Manager

IAB report on Online Ad Spend The Netherlands 2013 24
Programmatic Trading
IAB report on Online Ad Spend The Netherlands 2013 25
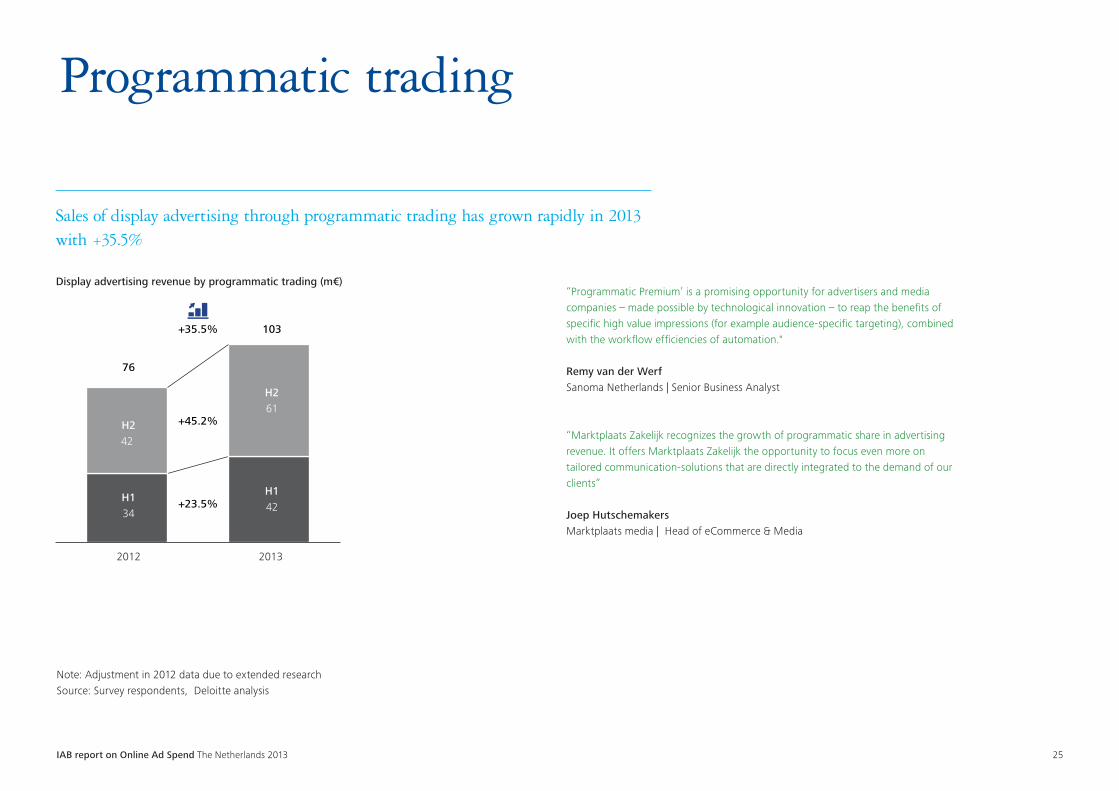
H134
H142
H242
H261
2012 2013
Display advertising revenue by programmatic trading (m€)
+23.5%
+45.2%
103
76
+35.5%
Note: Adjustment in 2012 data due to extended researchSource: Survey respondents, Deloitte analysis
Programmatic trading
Sales of display advertising through programmatic trading has grown rapidly in 2013 with +35.5%
“Programmatic Premium’ is a promising opportunity for advertisers and media companies – made possible by technological innovation – to reap the benefits of specific high value impressions (for example audience-specific targeting), combined with the workflow efficiencies of automation."
Remy van der WerfSanoma Netherlands | Senior Business Analyst
“Marktplaats Zakelijk recognizes the growth of programmatic share in advertising revenue. It offers Marktplaats Zakelijk the opportunity to focus even more on tailored communication-solutions that are directly integrated to the demand of our clients”
Joep Hutschemakers Marktplaats media | Head of eCommerce & Media

IAB report on Online Ad Spend The Netherlands 2013 26
Source: Survey respondents, Deloitte analysis
Programmatic trading
Programmatic trading has grown from 15% to a 35% revenue share of total display spend in the last 2 years; the figure excludes Google and Facebook
Shar
e pr
ogra
mm
atic
Dis
play
adv
ertis
ing
spen
d (m
€)
Display advertising spend split into Manual and Programmatic trade
0%
10%
20%
30%
40%
0
10
20
30
40
Programmatic Manual Share Programmatic
Dec
Nov
Oct
Sept
Aug
July
June
May
Apr
Mar
Feb
Jan
Dec
Nov
Oct
Sept
Aug
July
June
May
Apr
Mar
Feb
Jan
2012 2013
IAB report on Online Ad Spend The Netherlands 2013 27
*RTB: Real time bidding (auction model)Note: Non-RTB are all pre-negotiated impressions through programmatic channels; for more details, see IAB Programmatic Trading study Source: Survey respondents, Deloitte analysis
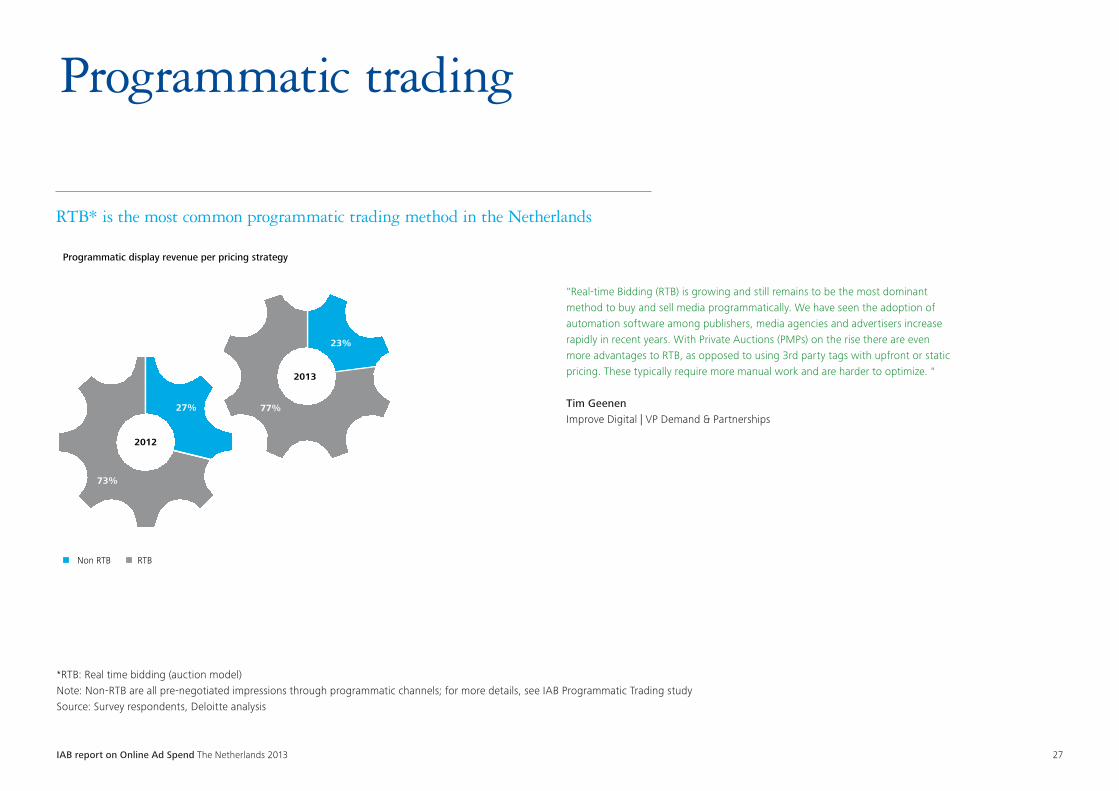
Programmatic trading
RTB* is the most common programmatic trading method in the Netherlands
Programmatic display revenue per pricing strategy
27%
2012
RTB
73%
2013
23%
Non RTB
77%
"Real-time Bidding (RTB) is growing and still remains to be the most dominant method to buy and sell media programmatically. We have seen the adoption of automation software among publishers, media agencies and advertisers increase rapidly in recent years. With Private Auctions (PMPs) on the rise there are even more advantages to RTB, as opposed to using 3rd party tags with upfront or static pricing. These typically require more manual work and are harder to optimize. "
Tim GeenenImprove Digital | VP Demand & Partnerships

IAB report on Online Ad Spend The Netherlands 2013 28
Classifieds
IAB report on Online Ad Spend The Netherlands 2013 29
Note: Classifieds, directories & listings estimated based on a limited number of data pointsSource: Survey respondents, Deloitte analysis
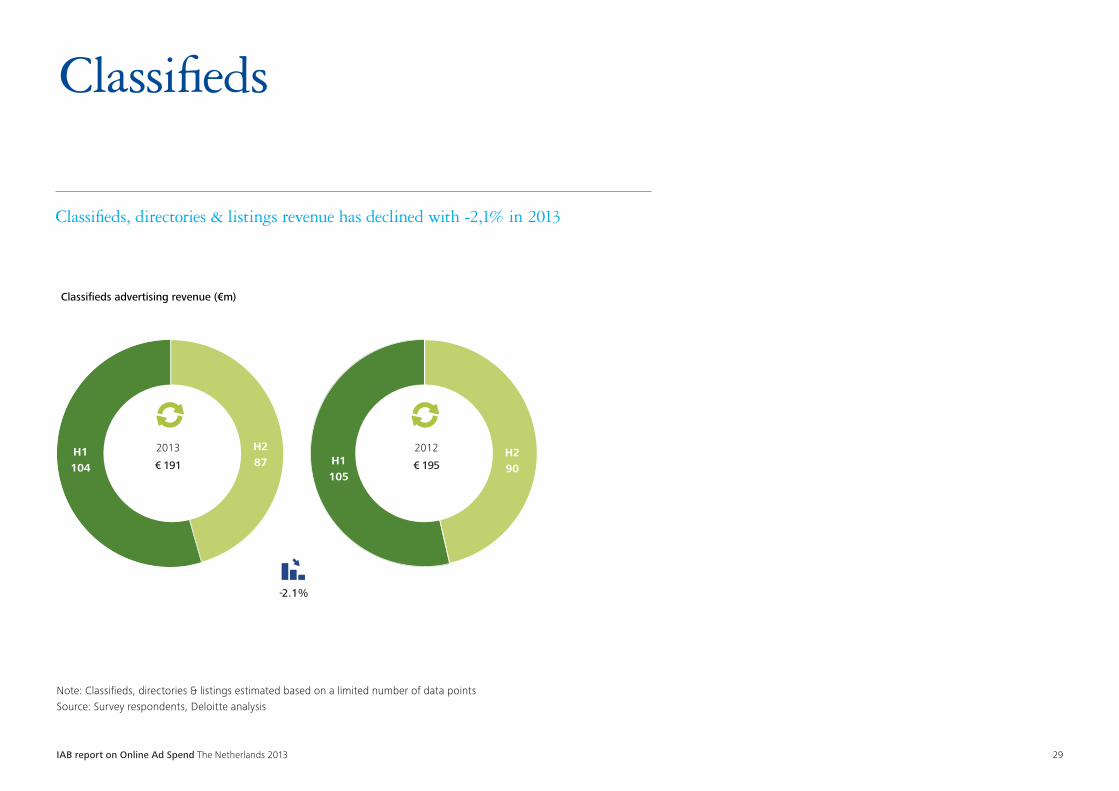
Classifieds
Classifieds, directories & listings revenue has declined with -2,1% in 2013
2012
€ 195H290
H1105
69
2013
€ 191
H287
H1104
-2.1%
Classifieds advertising revenue (€m)
IAB report on Online Ad Spend The Netherlands 2013 30
Note: Classifieds, directories & listings estimated based on a limited number of data pointsSource: Survey respondents, Deloitte analysis
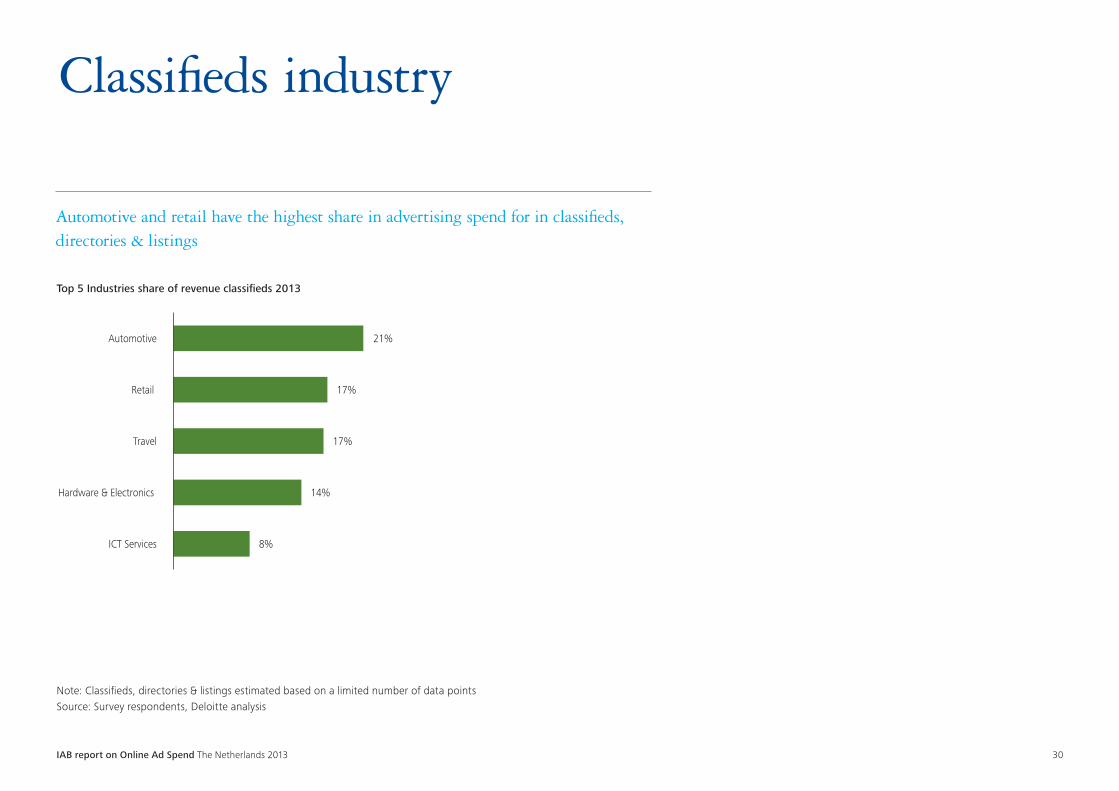
Classifieds industry
Automotive and retail have the highest share in advertising spend for in classifieds, directories & listings
8%
14%
17%
17%
21%
ICT Services
Hardware & Electronics
Travel
Retail
Automotive
Top 5 Industries share of revenue classifieds 2013

IAB report on Online Ad Spend The Netherlands 2013 31
Affiliate

IAB report on Online Ad Spend The Netherlands 2013 32
Source: Survey respondents, Deloitte analysis, Jochem Vroom (Affiliateblog.nl & Imbull.com) , Annual reports
Affiliate market
The affiliate market has been struggling to keep up in second half of 2013 and has shown negative growth over the full year
H162
H161
H269
H266
2012 2013
Spend on affiliate marketing (€m)
H1
H2
-3,1% 127
-4,3%
-1,6%
131
"First half of the year the affiliate market experienced heavy pressure by several factors (cookie law, duplication, lack of advertiser entrants , heavy competition). At the end of the year the decrease of switchers of health insurances resulted in a negative year for the affiliate business in the Netherlands. However, we believe that 2014 will be positive again, the first few months have shown good figures. "
Jochem VroomImbull & Flipit.com | Co-founder & Managing Director Affiliateblog.nl | Owner
IAB report on Online Ad Spend The Netherlands 2013 33
Source: Survey respondents, Deloitte analysis
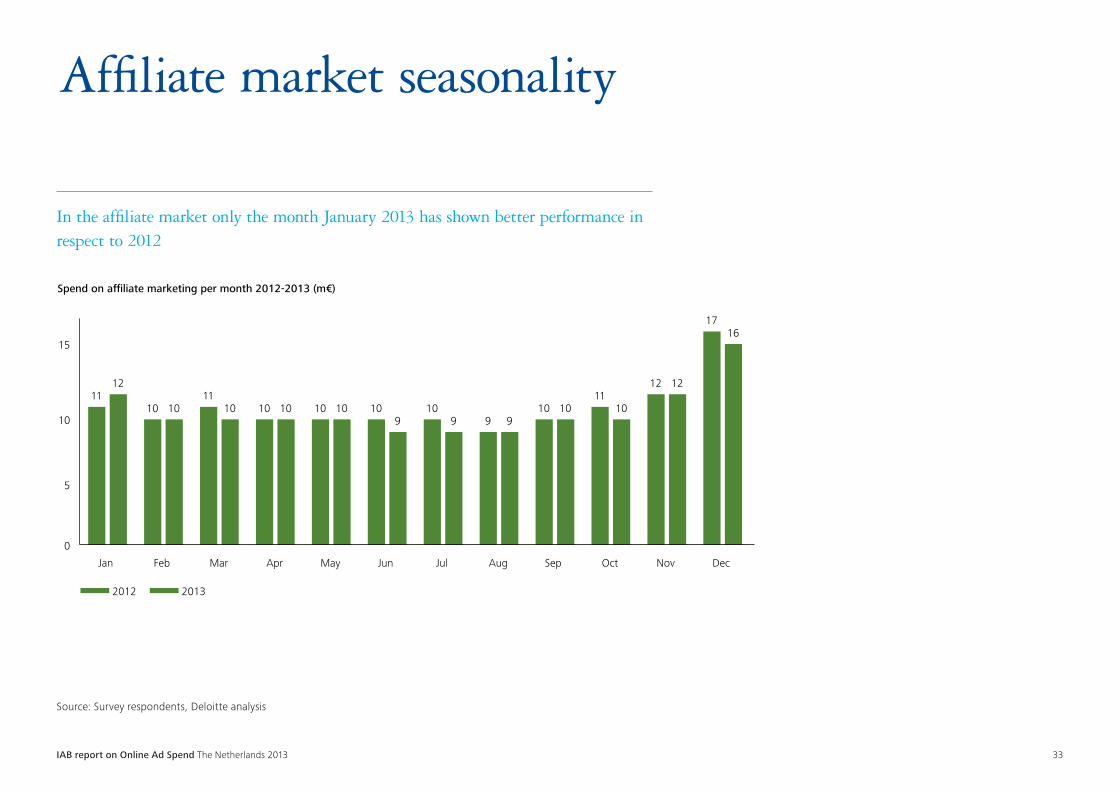
Affiliate market seasonality
In the affiliate market only the month January 2013 has shown better performance in respect to 2012
11 10
11 10 10 10 10
9 10
11 12
17
12
10 10 10 10 9 9 9
10 10
12
16
0
10
5
15
Jan Feb Mar Apr May Jun Jul Aug Sep Oct Nov Dec
Spend on affiliate marketing per month 2012-2013 (m€)
2012 2013
IAB report on Online Ad Spend The Netherlands 2013 34
Note: Division of revenue by publisher model based on data from an estimated 70% of the total marketSource: Survey respondents, Deloitte analysis
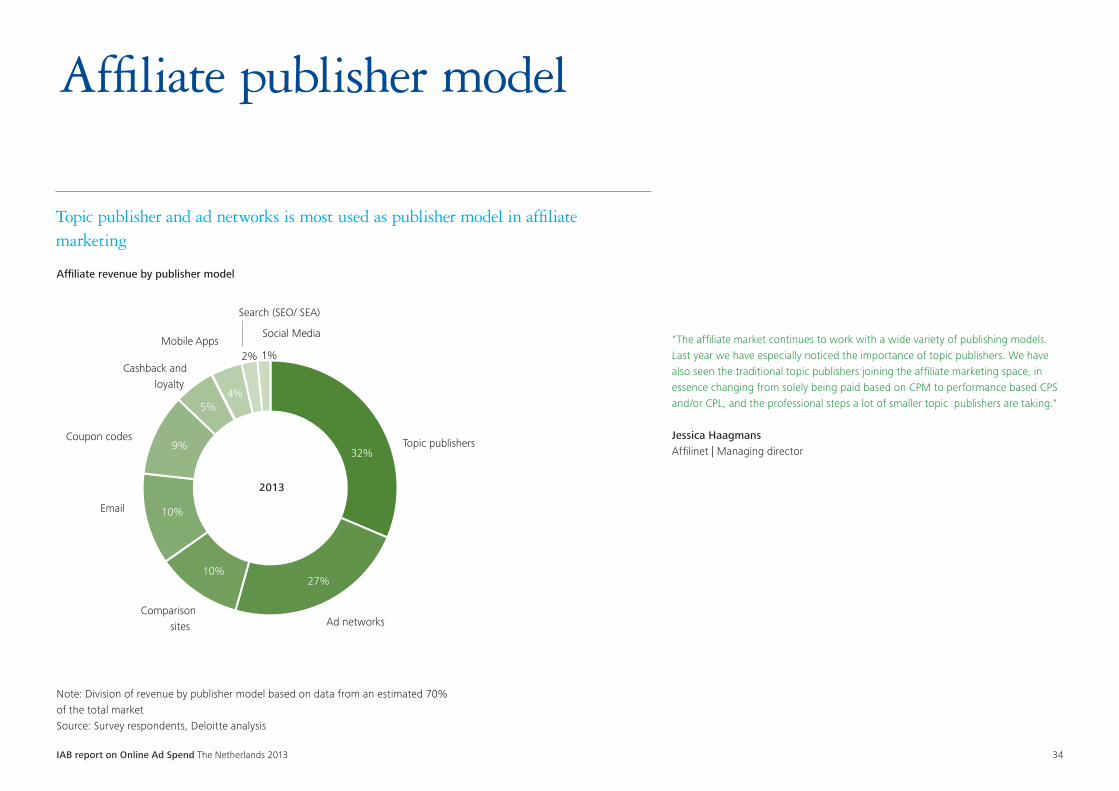
Affiliate publisher model
Topic publisher and ad networks is most used as publisher model in affiliate marketing
Topic publishers
Ad networks Comparison
sites
Coupon codes
Cashback andloyalty
Mobile Apps
Search (SEO/ SEA)
Social Media
Affiliate revenue by publisher model
32%
27%10%
10%
9%
5%4%
2% 1%
2013
"The affiliate market continues to work with a wide variety of publishing models. Last year we have especially noticed the importance of topic publishers. We have also seen the traditional topic publishers joining the affiliate marketing space, in essence changing from solely being paid based on CPM to performance based CPS and/or CPL, and the professional steps a lot of smaller topic publishers are taking."
Jessica Haagmans Affilinet | Managing director

IAB report on Online Ad Spend The Netherlands 2013 35
Outlook

IAB report on Online Ad Spend The Netherlands 2013 36
* Growth expectation calculated by weighting responses with company revenueSource: Survey respondents, Deloitte analysis
Revenue growth expectations
Respondents predict a +8,4% market growth and +9,4% company growth in 2014
1 1 1
12
6
1 0
2
0
2
4
6
8
10
12
14
-15% -5% 0% 5% 10% 15% 20% 25%
1
8
4
2
4
1 1 2
0
2
4
6
8
10
0% 5% 10% 15% 20% 25% 30% >35%
Num
ber
of r
espo
nden
ts (n
=24)
Expected market growth
Expected company growth
+8,4%*
Num
ber
of r
espo
nden
ts (n
=23)
+9,4%*

IAB report on Online Ad Spend The Netherlands 2013 37
Growth expectations 2014
* Growth expectation calculated by weighting responses with company revenueSource: Survey respondents, Deloitte analysis
CPM15
Expect growth(n=21)
Payment model
Expect decline(n=17)
1CPM 3
CPC3
CPL
2CPS
2Other
1CPA5
Fixed
CPC4
Fixed0
Other0
CPA0
CPL1
CPS1
Num
ber o
f res
pond
ents
Display,
interruptive
formats 48%
Display,
embedded
formats 38%
Display, video
12%
Online
classifieds
2%
Format growth expectation*
Respondents predict that interruptive formats continue to grow and CPM increases to become the default payment model
IAB report on Online Ad Spend The Netherlands 2013 38
Note: Forecast excludes Facebook and GoogleSource: Survey respondents, Deloitte analysis
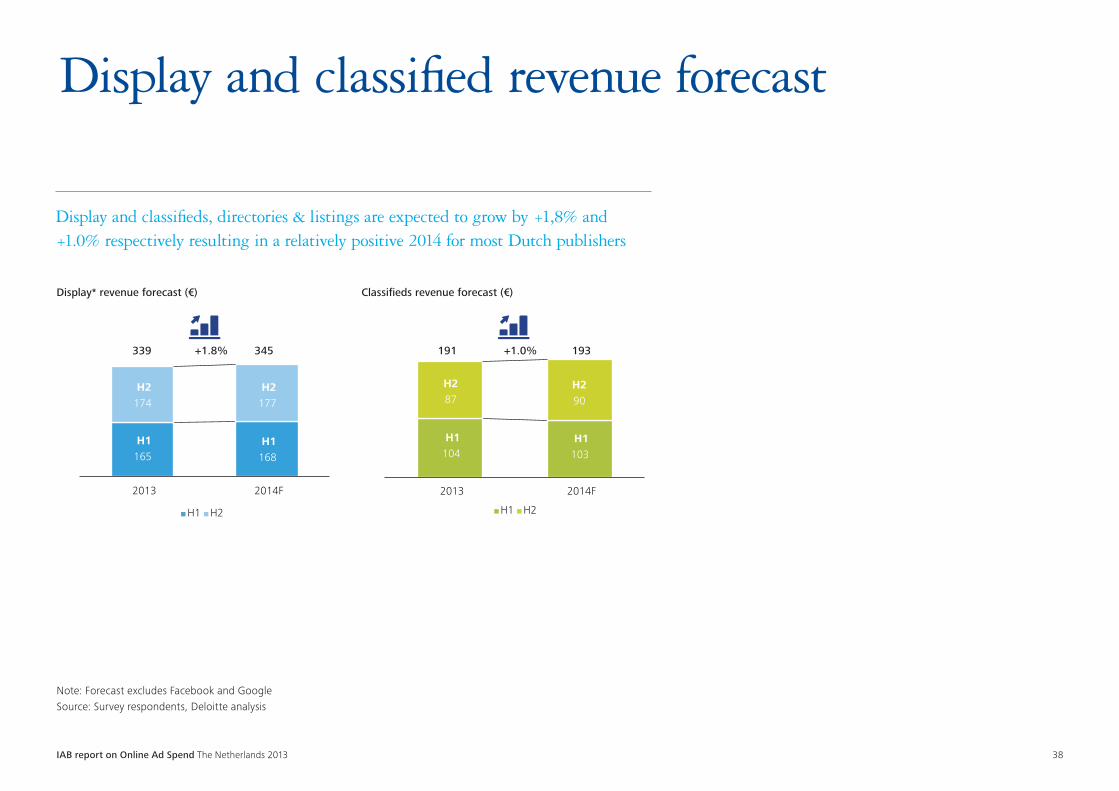
Display and classified revenue forecast
Display and classifieds, directories & listings are expected to grow by +1,8% and +1.0% respectively resulting in a relatively positive 2014 for most Dutch publishers
H1104
H1103
H287
H290
2013 2014F
Classifieds revenue forecast (€)
H1 H2
H1165
H1168
H2174
H2177
2013
339 191 193345 +1.8%
2014F
Display* revenue forecast (€)
H1 H2
+1.0%
IAB report on Online Ad Spend The Netherlands 2013 39
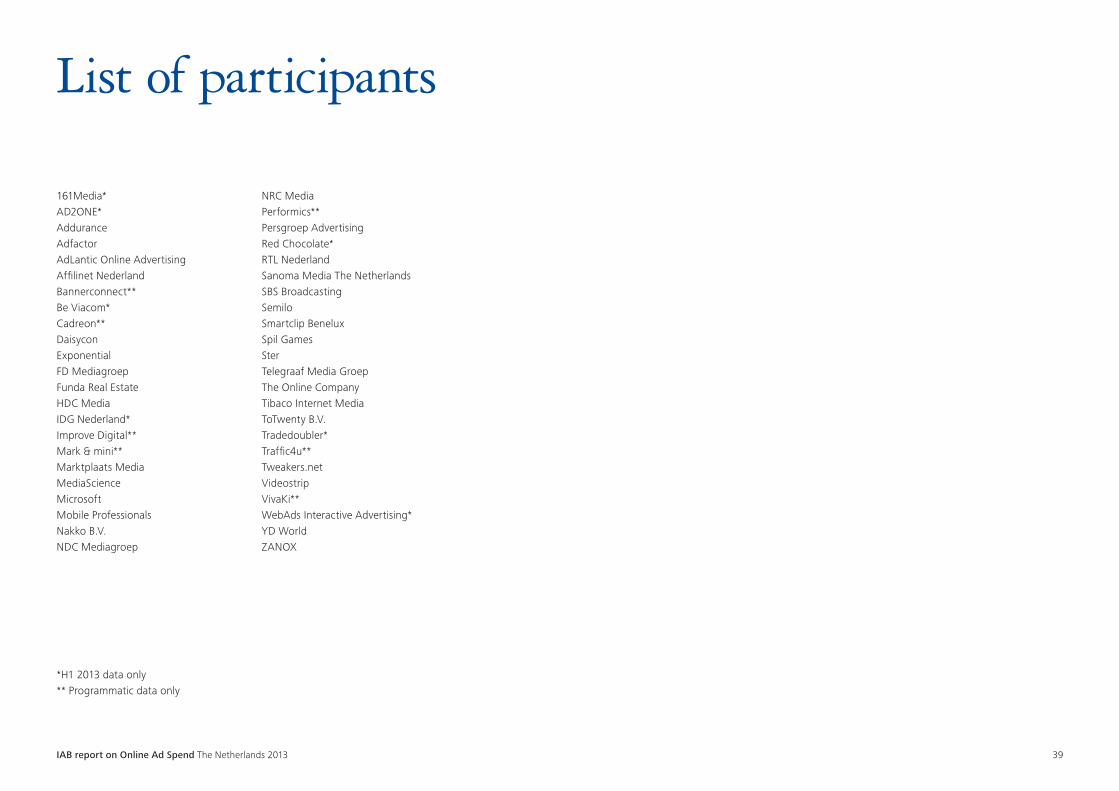
List of participants
161Media*AD2ONE*AdduranceAdfactorAdLantic Online AdvertisingAffilinet NederlandBannerconnect**Be Viacom*Cadreon**DaisyconExponentialFD MediagroepFunda Real EstateHDC MediaIDG Nederland*Improve Digital**Mark & mini**Marktplaats MediaMediaScienceMicrosoftMobile ProfessionalsNakko B.V.NDC Mediagroep
NRC MediaPerformics**Persgroep AdvertisingRed Chocolate*RTL NederlandSanoma Media The NetherlandsSBS BroadcastingSemiloSmartclip BeneluxSpil GamesSterTelegraaf Media GroepThe Online CompanyTibaco Internet MediaToTwenty B.V.Tradedoubler*Traffic4u**Tweakers.netVideostripVivaKi**WebAds Interactive Advertising*YD WorldZANOX
*H1 2013 data only** Programmatic data only
IAB report on Online Ad Spend The Netherlands 2013 40
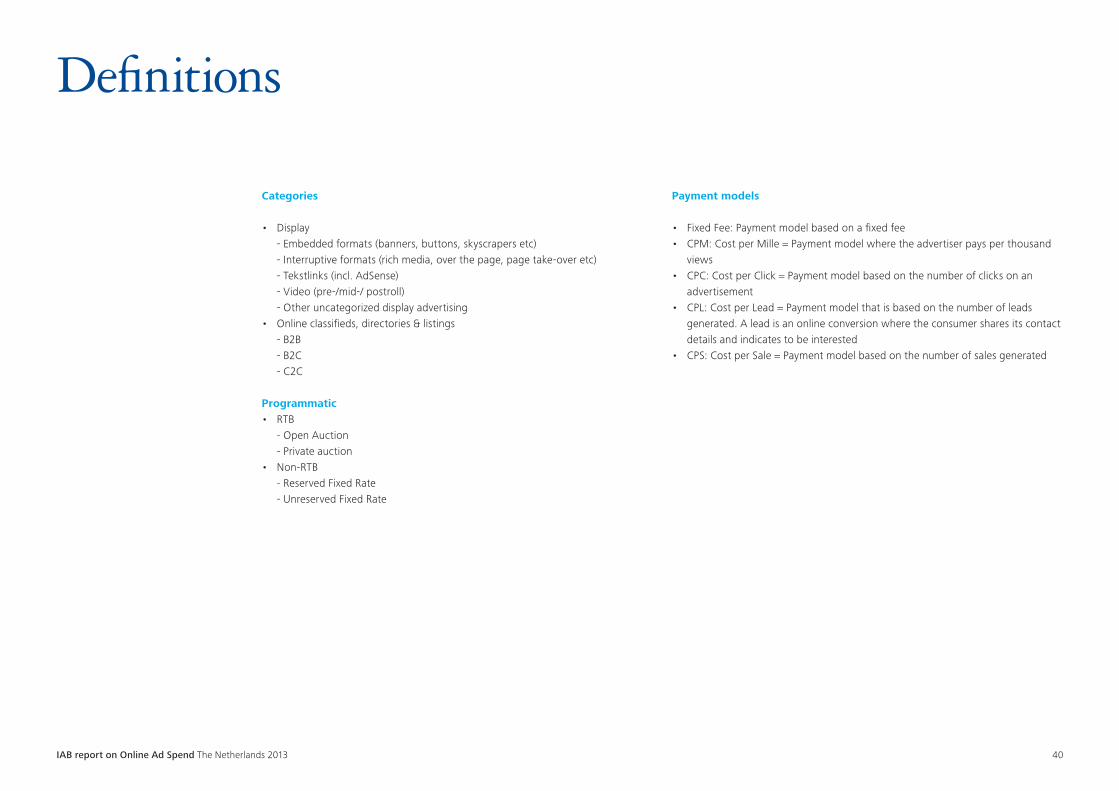
Definitions
Categories
• Display- Embedded formats (banners, buttons, skyscrapers etc)- Interruptive formats (rich media, over the page, page take-over etc)- Tekstlinks (incl. AdSense)- Video (pre-/mid-/ postroll)- Other uncategorized display advertising
• Onlineclassifieds,directories&listings- B2B- B2C- C2C
Programmatic• RTB
- Open Auction- Private auction
• Non-RTB- Reserved Fixed Rate- Unreserved Fixed Rate
Payment models
• FixedFee:Paymentmodelbasedonafixedfee• CPM:CostperMille=Paymentmodelwheretheadvertiserpaysperthousand
views• CPC:CostperClick=Paymentmodelbasedonthenumberofclicksonan
advertisement• CPL:CostperLead=Paymentmodelthatisbasedonthenumberofleads
generated. A lead is an online conversion where the consumer shares its contact details and indicates to be interested
• CPS:CostperSale=Paymentmodelbasedonthenumberofsalesgenerated

IAB report on Online Ad Spend The Netherlands 2013 41
Methodology
Online advertising market
• 46companiesreportedtheirdatabasedonthequestionnaire
• Thefiguresaredrawnuponthebasisofsitedeclarationandhavenotbeenverified
• Whereverneededwehaveusedtoolssuchasregressionanalysistomakeestimations regarding issues like total advertising spend
• Basedontheinformationprovidedbysurveyparticipants,figureshavebeen adjusted for double counting
Search, Display and classifieds market
• Duetolimitedavailabilityofcompanydatawehadtoestimatethemarketsizefor search and classifieds based on market data
• DisplaymarketsizeofGoogleandFacebookarebasedonmediaagenciesandprogrammatic inventory buyers feedback
• Googleregulationsforbidcommentingonoursearchmarketestimates
• Theclassifiedmarketisbasedonpublicavailablemarketestimates.Duetolimited data points, current classified market size could not be verified
IAB report on Online Ad Spend The Netherlands 2013 42
Nathalie la VergeIAB NederlandTel: +31 (0)85 401 0802Email: [email protected]
Dutch IAB research includes the IAB / Deloitte Ad Spend Study, all IAB commissioned research and assisting IAB members with their research projects. Also responsible for shaping the IAB knowledge base so that it meets members' needs moving forward
Roel van RijsewijkDeloitte | Deloitte DigitalTel: +31 (0)6 52 615 087Email: [email protected]
Roel van Rijsewijk is a Partner with the Risk Services practice from Deloitte with more than 10 years of experience in risk consulting for companies in the Technology, Media & Telecommunications (TMT) industry. Roel leads one of Deloitte’s main innovation projects on ethics and trust in a digital world
Jorrit SlootDeloitte | Deloitte Risk ServicesTel: +31 (0)6 82 019 387Email: [email protected]
Jorrit Sloot is a data analyst within the Deloitte Risk Services practice and specialized in datamodelling and mathematical, quantitative data analyses.
For questions concerning this research feel free to contact:
Contact details

Deloitte refers to one or more of Deloitte Touche Tohmatsu Limited, a UK private company limited by guarantee, and its network of member firms, each of which is a legally separate and independent entity. Please see www.deloitte.nl/about for a detailed description of the legal structure of Deloitte Touche Tohmatsu Limited and its member firms. Deloitte provides audit, tax, consulting, and financial advisory services to public and private clients spanning multiple industries. With a globally connected network of member firms in more than 150 countries, Deloitte brings world-class capabilities and high-quality service to clients, delivering the insights they need to address their most complex business challenges. Deloitte has in the region of 200,000 professionals, all committed to becoming the standard of excellence. This communication contains general information only, and none of Deloitte Touche Tohmatsu Limited, its member firms, or their related entities (collectively, the “Deloitte Network”) is, by means of this publication, rendering professional advice or services. Before making any decision or taking any action that may affect your finances or your business, you should consult a qualified professional adviser. No entity in the Deloitte Network shall be responsible for any loss whatsoever sustained by any person who relies on this communication. © 2014 Deloitte The Netherlands Designed and produced by Communications at Deloitte, Rotterdam.