I NELE-CTE
46
AL-TR-1992-0006 AD-A252 322 /II" A COMPUTER SIMULATION MODELING A APPROACH TO ESTIMATING UTILITY IN R SEVERAL AIR FORCE SPECIALTIES M Brice M. Stone S Kathryn L. Turner T Jonathan C. Fast R Metrlca Incorporated 3833 Texas Avenue, Suite 207 I ( Bryan, TX 77802 "I - NELE-CTE i N Guy L. Curry JUL019E T Texas A&M University U College Station, TX 77843 Larry T. Looper L Sheree K. Engquist, Captain, USAF A B HUMAN RESOURCES DIRECTORATE MANPOWER AND PERSONNEL RESEARCH DIVISION Brooks Air Force Base, TX 78235-5000 R A May 1992 T Final Technical Report for Period February 1990 - March 1991 0 R Approved for public release; distribution is unlimited. 92-17094 1111 11111 1111/l/l Ill/I /l 1111111 111 ( Il Itl 92 6 AIR FORCE SYSTEMS COMMAND BROOKS AIR FORCE BASE, TEXAS 78235-5000
Transcript of I NELE-CTE

AL-TR-1992-0006 AD-A252 322/II"
A COMPUTER SIMULATION MODELINGA APPROACH TO ESTIMATING UTILITY INR SEVERAL AIR FORCE SPECIALTIES
M Brice M. Stone
S Kathryn L. Turner
T Jonathan C. Fast
R Metrlca Incorporated3833 Texas Avenue, Suite 207 I (
Bryan, TX 77802 "I -NELE-CTE iN Guy L. Curry JUL019E T
Texas A&M University UCollege Station, TX 77843
Larry T. LooperL Sheree K. Engquist, Captain, USAF
AB HUMAN RESOURCES DIRECTORATE
MANPOWER AND PERSONNEL RESEARCH DIVISIONBrooks Air Force Base, TX 78235-5000
RA May 1992
T Final Technical Report for Period February 1990 - March 1991
0R Approved for public release; distribution is unlimited.
92-170941111 11111 1111/l/l Ill/I /l 1111111 111 ( Il Itl
92 6
AIR FORCE SYSTEMS COMMANDBROOKS AIR FORCE BASE, TEXAS 78235-5000

NOTICES
When Government drawings, specifications, or other data are used for anypurpose other than in connection with a definitely Government-related procure-ment, the United States Government incurs no responsibility or any obligationwhatsoever. The fact that the Government may have formulated or in any waysupplied the said drawings, specifications, or other data, is not to be regarded byimplication, or otherwise in any manner construed, as licensing the holder, or anyother person or corporation; or as conveying any rights or permission tomanufacture, use, or sell any patented invention that may in any way be relatedthereto.
The Office of Public Affairs has reviewed this paper, and it is releasable to theNational Technical Information Service, where it will be available to the generalpublic, Including foreign nationals.
This paper has been reviewed and is approved for publication.
RRYT.LOOPER WILLIAM E. ALLEY, Technical Director 1
Project Scientist Manpower and Personnel Research Di ls6n
D3.Chief, Manpower and Personnel Research Division

Form ApoeREPORT DOCUMENTATION PAGE OMB o ot.0704
eposngfl buren for tisis co1llton of informa~tio is esitedlt to avelrag~e 1 hour pe resoe indluding the time for reviewing instnorts, searching existing data sources,gahrn nd antann th datla neeed ancmpetn an reviewing the colletion of information. Sen comments reg<arding tis burden etimat or any other aspet of thiscolcinof ,nformation. nCludng' f or reducin this burden, to waington Headuarters Services. Directorat fo Information Opeations and Reports 5215 JeffersonDai Hgwy. Sute 1204. Arlington. VA 2220a-4302, and to the Office of Management and Budget. Paperwork Reduction Pr oject (0704-0168) washington. DC 20503.
1. AGENCY USE ONLY (Leave blank) I 2. REPORT DATE 3. REPORT TYPE AND DATES COVERED
IU 1Q::l.n1 Umrjh 11004. TITLE AND SUBTITLE S. FUNDING NUMBERS
A Computer Simulation Modeling Approach to Estimating C - F41689-88-D-0251I lNift In 4@=ml Air Fnr-a . INA-ti,. PE - 62205F
6. AUTHOR(S) PR - 7719Brice M. Stone Guy L. Curry TA - 20Kathryn L. Turner Larry T. Looper WU - 20Jnrathan r Farl QhrA K Frini~t
7. PERFORMING ORGANIZATION NAME(S) AND ADDRESS(L3) " 8. PERFORMING ORGANIZATIONREPORT NUMBER
Metrica Incorporated3833 Texas Avenue, Suite 207Bryan, TX 77802
9. SPONSORING I MONITORING AGENCY NAME(S) AND ADDRESS(ES) 10. SPONSORING / MONITORING
AGENCY REPORT NUMBER
Armstrong LaboratoryHuman Resources DirectorateManpower and Personnel Research Division AL-TR-1992-0006Brooks Air Force Base. TX 78235-5000
11. SUPPLEMENTARY NOTESArmstrong Laboratory Technical Monitor: Larry Looper, (512) 536-3551.
12a. DISTRIBUTION /AVAILABILITY STATEMENT 12b. DISTRIBUTION CODE
Approved for public release; distribution is unlimited.
13. ABSTRACT (Maximum 200words)This research produced a prototype of an interdependent, multiple-job utility assessment system. The simula-
tion utility management system (SUMS) prototype can be used to determine the effects of changes in manpowerpolicy and programs on individual job and total system utility. The model development involved identifying appro-priate costs associated with acquisition, training, maintenance, and separation of enlisted personnel and deter-mining a dollar value of services rendered during a potential 30-year service tenure. The prototype includes majorpersonnel programs used by the Air Force to access, train, upgrade, reenlist, and separate enlisted personnel.SUMS maximizes overall system utility through an optimal allocation of accessions, given the expected quality mixof the accession pool. The prototype was tested using data for four Air Force Specialties (AFSs) and determinedsystem utilities resulting from six different personnel management scenarios: force drawdown, increasing mini-mum aptitude requirements, accession pool reduction, increasing the size of the force drawdown, imposing ,ini-mum manning requirements, and determining aptitude cutoff scores.
14. SUBJECT TERMS 15. NUMBER OF PAGESComputer simulation model Productive value 52Force analysis Utility 16. PRICE CODEProductive capacity
17. SECURITY CLASSIFICATION 16. SECURITY CLASSIFICATION 19. SECURITY CLASSIFICATION 20. LIMITATION OF ABSTRACTOr REPORT OF THIS PAGE OF ABSTRACT
Unclassified Unclassified Unclassified ULNSN 7540-01-280-5500 Standard Form 298 (Rev. 2-89)
Prescribed by ANSI Std. 031-IS296-102

CONTENTS
INTRODUCTION ...................................................................................................................... 1
CONCEPTUAL DEVELOPMENT OF SUMS ................................................................ 3Personnel Flow Module ........................................................................................... 4Accession Allocation Module ................................................................................ 5Utility Assessment Module ..................................................................................... 8
SIM ULATION USING SUMS ........................................................................................ 11Data Development ................................................................................................... 11Initial Specification of SUMS ................................................................................ 14Baseline - Force Drawdown ................................................................................ 18Scenario 1: Imposing Minimum Aptitude Requirements ................................ 23Scenario 2: Reducing the Accession Pool ....................................................... 23Scenario 3: Force Drawdown of 25% ................................................................ 24Scenario 4: Minimum Manning Requirements ............................................... 24Scenario 5: Establishing Aptitude Cutoff Scores ............................................. 25
CONCLUSIONS AND RECOMMENDATIONS .......................................................... 26Conclusions ................................................................................................................... 27Recom mendations ................................................................................................ 28
REFERENCES ....................................................................................................................... 29
APPENDIX .............................................................................................................................. 31
List of Tables
Table1 OLS Coefficients and t-values for the Four Productive
Capacity Equations ........................................................................................... 14
2 Scenario Sequence ........................................................................................ 15
3 Inventory and Manning Levels ..................................................................... 17
4 Utility ......................................................................................................................... 18
.,III

List of Tables (Concluded)
law&5 Simulation Results for a 2-Year Projection: Year I ................................... 19
6 Net Returns for Aptitude Groups by AFS: Year 1 ....................................... 20
7 Accessions by Aptitude for a 2-Year Projection ........................................ 21
8 Simulation Results for a 2-Year Projection: Year 2 .................................. 22
A-1 Run.run File Example ..................................................................................... 31
A-2 Scenario.scn File Example ........................................................................... 32
A-3 The 'axxxx.afs" File Example ........................................................................ 34
A-4 The "cxxxxyzz.cls" File Example .................................................................. 36
A-5 Net Returns for Aptitude Groups by AFS: Year 1 ....................................... 40
A-6 Simulation Results for 5-Year Projection: Year 1 ..................................... 41
iv

PREFACE
This research and development effort was accomplished as part of Project 7719,Force Acquisition and Distribution Systems and Task 771920, Manpower and Person-nel Models. The purpose of this effort was to evaluate applicability of computer simu-lation modeling (CSM) to assessing the utility of Air Force personnel systemcomponents.
We wish to thank Dr. Bryan Deuermeyer, Mr. Vince Wiggins, Ms. LavonneGrossmann, and Mr. Carlton Hubbard for their valuable technical contributions to thiseffort. In addition, we would like to express appreciation to Ms. Barbara Randall(computer programmer), Mr. Gary Petersen (systems analyst), and Mr. Daryl Hand(computer programmer).
Acoosion f'or
NTIS GRA&IDTIC TAB 0Unannounced 0justificatlon-
ByDistribut On .
Availability Codes
Avai an /rDist Special
v

A COMPUTER SIMULATION MODELINGAPPROACH TO ESTIMATING UTILITYIN SEVERAL AIR FORCE SPECIALTIES
SUMMARY
The objective of this research effort was to evaluate computer simulationmodeling (CSM) as an alternative to traditional (algebraic) approaches for assessinghuman resource management (HRM) program utility. The research used recent worklinking individual aptitude and experience to job performance to develop an inter-dependent multiple-job personnel utility assessment system.
A prototype model was developed using four Air Force Specialties (AFSs):122X0 (Aircrew Life Support), 272X0 (Air Traffic Controllers), 426X2 (Jet Engine Me-chanics), and 492X1 (Information Systems). The model development involved identi-fying appropriate costs associated with acquisition, training, maintenance, and sepa-ration of enlisted personnel and a dollar value of services rendered during a potential30-year service tenure. The prototype includes major personnel programs used bythe Air Force to access, train, upgrade, reenlist, and separate enlisted personnel.
The simulation utility management system (SUMS) prototype incorporates theCSM technology into a computer-based system to determine the effects of changes inmanpower policy and programs on individual job and total system utility. SUMSmaximizes overall system utility through an optimal allocation of accessions, given theexpected quality mix of the accession pool.
INTRODUCTION
Utility analysis is a methodology often compared to cost/benefit analysis which isused to assess the value of HRM programs. Utility analysis can be defined as thedetermination of institutional gain or loss (outcomes) anticipated from various coursesof resource management action (Cascio, 1982) or the assessment of the economic orsocial impact of organizational programs (Hunter & Schmidt, 1982). Boudreau (1988)indicates that utility analysis is a set of cost/benefit models originally developed byindustrial psychologists concerned with personnel selection and recently extended toother HRM programs and decisions. The aim of these models is to predict, explain,and improve the usefulness of various HRM decisions.
Utility analysis can be traced back nearly 70 years (Hull, 1928; Kelley, 1923), butBrogden's (1949) and Cronbach and Gleser's (1965) developments laid the groundwork for more recent elaborations (Schmidt, Hunter, McKenzie, & Muldrow, 1979).Original utility research focused on employee acquisitions. The traditional equationused for estimating the change in system utility, AU, developed by Brogden (1949)and further discussed by Cronbach and Gleser (1965) can be expressed as:
i " I f i l i H I J i l i i ... . .. ...1

AU =[(N)(T)(d) (S D)]-C (1)
where:
N = number of employees subjected to the acquisition program, i.e., the
selected cohort (treated group),
T = mean length of stay,
d= true difference in average job performance between the selectedand selected groups in standard deviation units (Landy, Farr, &Jacobs, 1982),
S Dy = the standard deviation of the dollar-valued payoff in the group ofapplicants, and
C = cost of systematic selection for all tested applicants.
Traditional utility models have several limitations to their application to determineHRM program value to the military, some of which have already been identified.Traditional approaches tc utility analysis (a) assume a linear (or transformable tolinear) functional relationship, (b) seek algebraic solutions to utility estimates, (c) arelimited to static, or at least stationary, processes, (d) have been limited to single jobsystems, and (e) have assessed the impact of HRM policies in dollar terms. Therecent development of a Time-to-Proficiency (TTP) model (Carpenter, Monaco, &O'Mara, 1989) for one AFS addressed several of these shortcomings. The refinedTTP model (Faneuff, Valentine, Stone, Curry, & Hageman, 1990) permits a longi-tudinal assessment of airman productive capacity and cost/benefit relationsassociated with training and attrition.
Simulation models use the computational power of computers to obtain estimatesof system characteristics. CSM provides a viable alternative to assessing HRMprogram utility and is not subject to the limitations of conventional analytical utilitymodels. CSM provides the opportunity for estimating system utilities simultaneouslyfor multiple and interrelated (a) criterion variables, (b) productivity-enhancing HRMinterventions, and (c) multiple job systems.
Computer simulation modeling of utility provides an alternative to traditional utilityanalysis, eliminating the need to estimate means for tenure, expected payoff, anddifferences in productivity for the entering cohort. In addition, CSM of utility accountsfor the effect of training and acquisition programs on retention and separations, aswell as provides a means to estimate the effect of other postacquisition and trainingprograms on total system utility, e.g., selective reenlistment bonuses.
2

The mean length of stay, T, is the inverse of an accession cohort's simulatedattrition rate over a selected time horizon. For example, a 25% attrition rate translatesinto a mean length of stay of 4 years, (1/0.25) = 4. This example implies that over thefirst 4 years of tenure, every entering cohort will lose 25% of its population. The actualdifference in job performance, dt, is the difference in dollar productivity between thetreated group and the control group in a simulation. The standard deviation in thedollar-valued payoff to be accrued from an entering cohort over the mean length ofstay, S D., is estimated by the simulation of dollar-valued productivity by the enteringcohort for each projected time period. The cost of systematic selection for all testapplicants, C, is reflected in the change in the acquisition/training costs for the systemsimulation. Thus, CSM of utility should provide more accurate estimates of thechange in total system utility.
For this study, a SUMS was developed which employs CSM to model the flow ofAir Force enlisted personnel, combined with cost and productive value estimates fromthe Value of Air Force Experience (VAFE) research effort (Stone, Rettenmaier, Saving,& Looper, 1989a) to assess a dollar-valued utility payoff for alternative HRM programs.The next section presents three primary components of SUMS: the personnel flowmodule, the accession allocation module, and the utility assessment module. Then asection describes the data sources used for the implementation of SUMS andprovides examples of HRM program assessments using SUMS. The final section pro-vides a brief conclusion and suggestions for future research and extension of SUMS.
CONCEPTUAL DEVELOPMENT OF SUMS
The development of SUMS is based on a methodology used for the assessmentof HRM system utility initially presented by Boudreau and Berger (1985) as a multiple-cohort acquisition and retention utility model. This methodology results in a dollar-valued workforce utility for a given time horizon taking into account the quantity andquality of accessions, separations, and retentions in each of the time periods. SUMSemploys this methodology in the calculation of total net utility for each specifiedsimulation scenario. Thus, SUMS reflects parameters relevant to a fully integratedutility model which includes accession, training, upgradion, separation, and retentionof personnel.
For each projected time period, total system utility is calculated based on produc-tive capacity and costs which are affected by the quality and quantity of accessions,separations, and continuations. Changes in policy and/or personnel parameters canbe assessed in terms of AFS-specific and/or total system utility, as well as tradeoffsbetween force structures composed of more/less experienced personnel.
SUMS is comprised of three primary components which provide the necessaryinformation for the calculation of total system utility:
3

(1) Personnel Flow Module (PFM) - simulates flows within a multi-jobsystem,
(2) Accession Allocation Module (AAM) - allocates accessions from a givenaccession pool across jobs, and
(3) Utility Assessment Module (UAM) - estimates a dollar utility value of theworkforce across jobs.
Total system utility is only one of several measures (e.g., Inventory levels,upgradions, separations, costs) provided by SUMS to evaluate the personnel flowsand policies of the multi-job system.
Personnel Flow Module
The personnel flow module is a simulation flow model of an enlisted multi-jobsystem with the capability to analyze any single or multiple combination of AFSs. Thesimulation model encompasses accessions, upgrades, and separations. Simulationsextend over selected time horizons in years (e.g., 5 years). The simulation starts withan initial inventory of personnel which has to be aged, separated, and upgraded foreach time period of the selected horizon. First, the Inventory is separated usingaptitude- and AFS-specific continuation rates. Secondly, the remaining population isupgraded in order to fill the vacancies created by the separations and maintained bythe manning requirements. Thirdly, the accession goals are determined based on theremaining inventory and the manning requirements. Given the size and aptitude mixof the accession pool, accessions are allocated across AFSs in order to meetaccession goals. The beginning inventory for each time period is comprised of thecontinuations and accessions from the previous time period.
SUMS has the capacity to simulate under various continuation (reenlistment/retention) scenarios, providing the user with policy parameters which can be ini-tialized to represent personnel policy decisions and/or programs. Subgroups withinthe personnel inventory of an AFS can be defined by aptitude, year of service (YOS),and skill level. Each AFS uses one of the four composite scores from the Armed Ser-vices Vocational Aptitude Battery (ASVAB): mechanical, administrative, general, orelectronic (MAGE) divided into ten levels of capability. The ten aptitude levels includescores within the ranges of 0 to 9, 10 to 19, 20 to 29, ..., 90 to 99. The skill levels re-present the four AFS-specific skill levels which can be achieved: skill level 3 for semi-skilled, skill level 5 for skilled (journeyman), skill level 7 for advanced (technician), andskill level 9 for superintendent/manager. YOS includes 0 to 30 years of service.
Accession Allocation Module
SUMS allocates accessions to AFSs to fulfill AFS-specific manning vacanciescaused by the attrition/promotion process and manning requirements. SUMS selectsrecruits from a given accession pool comprised of a given aptitude mix based on the
4

four ASVAB composite scores (mechanical, administrative, general, and electronic)and their designated cohorts. The allocation of aptitude-specific accessions to AFSsis performed using a methodology which maximizes the total net utility resulting froman allocation of aptitude-specific accessions to multiple AFSs. The AAM used inSUMS considers several factors: productive capacity, value of services produced bypersonnel in the Air Force (Stone et al., 1989a), probability of attrition, training costs,recruitment costs, and personnel maintenance costs (regular military compensation).These factors are combined into a single measure of expected net utility for anyaptitude cohort in any AFS in SUMS.
AAM allocates accessions to the various AFSs such that the total net utility fromthe accession allocation is maximized. The expected net utility for an individual withaptitude x is defined simply as the difference between expected value and expectedcost over 30 years of service. Thus, the objective function being maximized is thesummation of expected net utility across all accessions allocated to all AFSs. Todetermine the allocation which maximizes total expected net utility for the system(across AFSs), a linear programming routir,3 is used. This linear programmingalgorithm determines the number of individuals from each aptitude category to beassigned to each AFS across all AFSs specified in the system. The relativedifferences in the expected net utility accruable from the allocation of aptitude-specificaccessions to specific AFSs directly affects the optimum accession allocation. Thesolution is obtained by maximizing:
K M£_ 1 (EN U,,kxn,.k) (2)
k=1 x=1
subject to:
KI nXk:<a for all x (3)k=1
MI n,.kgrk for all k (4)x=1
n, ,O for all x and k (5)
where:
5

x is the aptitude level,
M is the number of aptitude levels,
k is the kth AFS,
K is the number of AFSs,
nxk is the number of accessions with aptitude x assigned to AFS k,
rk is the accession requirement for AFS k which is necessary to meet thedesired manning level,
E N (JUk is the expected net utility to be accrued to the system from allocatingan accession with aptitude x to AFS k, and
ax is the number of accessions of aptitude x.
The objective function (Equation 2) Is the total expected net utility of allaccessions assigned to all AFSs from all aptitude levels. The allocation problem issolved by finding the maximum value for this function. The first constraint expressedin Equation 3 is that the number of accessions assigned from an aptitude level cannotexceed the number of accessions availablg. The second constraint, Equation 4, isthat no additional accessions will be assigned to an AFS once the establishedmanning level has been met. However, if there is a manpower shortage, feweraccessions than required can be allocated to an AFS. The third constraint, Equation5, simply specifies that a negative number of accessions with aptitude x cannot beassigned to an AFS.
To allocate accessions to the AFSs in SUMS, a measure of expected net utility,E N Ux,k, is required for the kth AFS. This value is estimated in three steps: estimationof expected value, estimation of expected costs, and estimation of expected net utility.
Estimation of Expected Value
The expected value for an individual with aptitude x equals the summation over30 years of service of the products of the probability that an individual with aptitude xwill remain in service through YOS e multiplied by the value accruing to the Air Forceof an individual with aptitude x in YOS e multiplied times the productive capacity(Faneuff et al., 1990) of an individual with aptitude x in YOS e. The expected value ofan individual with aptitude x over 30 years of service, E V, can be expressed as:
30E Vz = E [ %,.xV ,oxP,,,] (6)
e=0
6

where:
S,., is the probability that an individual with aptitude x willremain in service through YOS e,
VI,. is the value to the Air Force of the services provided byan individual in VOS e, and
P,., is the productive capacity of an individual with aptitude x
in YOS e.
Estimation of Expected Cost
The expected cost of an individual with aptitude x over 30 years of service, E C=,equals the summation over 30 years of service of the products of the probability thatan individual with aptitude x will remain in service through YOS e multiplied by thecost to the Air Force of an individual with aptitude x in YOS e (Faneuff et al., 1990),which can be expressed as:
30E Cx = Y, [ S,,xC,.J (7)
e=0
where:
Cx,. is the cost to the Air Force of maintaining and/or training an individualwith aptitude x in YOS e and
S ,. is the same as in Equation 6.
Estimation of Expected Net Utility
Thus, the expected net utility of an individual with aptitude x over 30 years ofservice, E N U,, is the difference between expected value and expected cost over 30years of service and can be expressed as:
ENU.=EV,-EC (8)
or
7

30 30ENU,,= I [S.,xV,.xP,.J- I [S,.xC3 ,j (9)
0=0 e=O
The probability an individual will remain in service through YOS • declines as •increases. Higher aptitude individuals exhibit lower probabilities of prematurelyseparating from service during the first 4 years, but are more likely to separate at thefirst and second term decision points (Stone, Looper, & McGarrity, 1989b). Productivecapacity is directly related to aptitude and experience (Carpenter et al., 1989 andFaneuff et al., 1990). Thus, differences in expected net utility by aptitude are primarilydue to differences in productive capacity and attrition rates. Differences in expectednet utility by AFS are due to differences in service value, productive capacity, andattrition rates.
Utility Assessment Module
The utility assessment module calculates the dollar-valued workforce utility forthe total system resulting for each of the projected time periods. The dollar-valuedworkforce utility accounts for both the quantity and quality of accessions, continua-tions, and separations which occur in each projected time period considering bothvalue and costs generated by the workforce.
SUMS accesses, promotes, and separates personnel of a specified quantity/quality-defined workforce where quality is defined by the mix of four ASVAB compositescores of the workforce and the accession pool. The calculation of total system utilityincludes value produced and costs incurred by new accessions, separations, andcontinuations. To facilitate understanding of the total system utility calculation, theformulation of each component will be presented and then combined into the totalestimate.
The contribution to total system utility of new accessions for a single time period,U,,t, can be expressed as:
M
U@,,=0.x . [Na,,,x(V ,,,,-C,,,,)] (10)x=1
where:
N.,t,.,s equals the number of accessions in time period t of aptitude x withexperience 9=0,
8

V.,.,,,. equals the value of accessions in time period t of aptitude x withexperience e=O,
,. equals the cost of accessions in time period t of aptitude x withexperience 9=0, and
M equals the number of aptitude groups.
The value of the accessions, V,.,.,, in time period t of aptitude x with experience eequal to 0 Is defined as:
V..t.,.,= S,.,.,xV,.X.,XPt'x.,(1
where:
S,,., Vix,., and Pt,,, are as defined in Equation 6 and e takes the value of 0 for thefirst YOS. The multiplication of total net utility for new accessions by 0.5 implies thatthe costs and values are assumed to be spread evenly over the time period. Ifaccessions predominantly flow into the system in the earlier part of the time period,then the 0.5 is not a good approximation.
The contribution to total system utility of separations for a single time period, U.,t,can be expressed as:
30 M
U .,t= 0.5xZ I [ N.,,,,,. x( V.t,,,.- C.,,,,) (12)e=0 x=1
where:
N,.,.=,, equals the number of separations in time period t with aptitude x andYOS e,
V.,,,,.. equals the value of separations in time period t with aptitude x andYOS e, and
C,,t,. equals the cost of separations in time period t with aptitude x andYOS e.
The multiplication of total net utility for separations by 0.5 implies, once again, that thecosts and values accrued from separations are assumed to be spread evenly over thetime period t.
9

The contribution to total system utility of airmen identified as continuations for asingle time period, U.,j, can be expressed as:
30 MU .,=z L [ N,,,.,x(V,,t,, 1.- COt,,.)] (13)
0--0 x=1
where:
N.,,,,, equals the number of continuations in time period t with aptitude xand YOS 9,
V, 1,,. equals the value of the continuations in time period t with aptitude xand YOS e, and
C,,,. equals the cost of the continuations in time period t with aptitude xand YOS e.
Thus, total system utility for a single time period t, U,, is defined as:
M 30 MUt=(0.5xl [N.,,,1x(V,,,-C,,,tj])+(0.5x1. I [N.,,,,,.x( V.,,,,.- C.,,,,.)])
x=1 0--0 x-1 (14)
30 M
=0 x=1
or
Uj= U..,+ us,,+ Ue,,. (15)
For multiple time periods, discounting is used to account for the future value ofmoney (Stone et al., 1989a). If Equation 15 is represented by Ut, then total systemutility for T time periods, UT, can be expressed as:
10

T Ut
T t=l (11+r)t
where r is the discount rate. Thus, Equation 16 represents the discounted, net of cost,dollar-valued workforce utility in future time periods 1 through T taking into accountthe quantity and quality of acquisitions, separations, and retentions in those futureperiods (Boudreau & Berger, 1985).
SIMULATION USING SUMS
This section will describe the data sources used for the implementation of SUMS,present several examples of analyzing particular personnel and policy issues usingSUMS, and highlight the potential of SUMS for other analyses. Values and costswere estimated for each AFS in the scenarios using information from Air Forcepersonnel data bases, Bureau of Census population surveys, and various Air Forceregulations and published documents.
Data Development
In previous research, grade and skill level were used as the criteria for the defini-tion of service states (Stone et al., 1989a). For the present examples using SUMS,YOS was used as the basis for service states. Each YOS from 0 to 30 represents aservice state. In the calculation of formal and informal training, skill level was used asa secondary criteria in determining the appropriate service state training costs.
Service State Costs
The source for the dollar costs of recruitment, basic military training (BMT), andformal technical training was the Air Training Command's FY88 Cost Factors Manual(1988). All costs were estimated or allocated by YOS. Acquisition costs which includerecruitment and BMT are not considered to be AFS-specific while technical trainingand on-the-job training (OJT) varied by AFS. The information provided in the AirTraining Command's FY88 Cost Factors Manual (1988) provided technical trainingcourse costs for each AFS. These costs were used in conjunction with informationfrom the (ORDB) concerning courses taken by airmen at specific stages of their careerto estimate the costs of formal technical training for each AFS by YOS (Longmire &Short, 1989). The technical training costs allocated to each YOS were estimated as aweighted average based upon the proportion of individuals who had taken a course ineach YOS (Stone et al., 1989a).
OJT was estimated primarily for individuals in skill levels 3 and 5; i.e., thoseindividuals with the rank of either E-2, E-3, or E-4 and with a skill level of 3 (semi-
11

skilled) or 5 (skilled). Since minimal OJT occurs beyond skill level 5, no OJT costsbeyond that level were included. To estimate the level of OJT which individualsreceived while in these two skill levels, data from the ORDB were analyzed to providean estimate of the relationship between time in service and proficiency. Theapproaches used to estimate the OJT costs and supervisor costs were the same asthat used by Stone et al., (1989a).
Military compensation was comprised of basic pay, basic allowance for quarters(BAQ), basic allowance for subsistence (BAS), and the tax advantage accruing fromthe nontaxable nature of BAQ and BAS. Military compensation also accounted forpromotion rates by AFS determined from the June 1985 and June 1986 UniformAirman Records (UARs).
Service State Values
The value to the Air Force of the services provided by an individual in YOS • wasbased on the civilian earnings surveys administered monthly by the Bureau of theCensus (U.S. Department of Commerce, 1986). The civilian earnings represents theopportunity cost to the airman of remaining in the service, i.e., income which theairman could have made in the private sector for providing similar services (Stone etal., 1989a). The survey respondents were categorized by individual AFSs. AFS-specific earnings were then estimated based on age, e.g.,
earnings=a0 +a,(age)+a2 (age2). (17)
The service values estimated for each YOS assumed that the average age atenlistment was 18. Thus, an age-earnings function was estimated for each AFS usedin SUMS which represents the value to the Air Force of a recruit entering an AFS atage 18 and progressing through 30 years of service.
Continuation Rates and Probabilities. The UARs in the Historical Airman Data(HAD) base (Saving, Stone, Looper, & Taylor, 1985) were used to estimate theprobability of an individual with aptitude x continuing from one YOS to another. Tocalculate the continuation rates for the enlisted AFSs, data were obtained from theUAR files for June 1985 and June 1986. The June 1985 to June 1986 time periodwas selected because that time period was before enlisted force drawdowns hadbegun to reach sizeable numbers in fiscal year 1986 (Stone, Saving, Turner, Looper &Engquist, 1991). Since SUMS provides the ability to specify a force/AFS drawdown,the continuation rates used should reflect airman decision-making absent of force-outs caused by a force reduction program. Continuation rates were calculated byYOS, AFS, and aptitude. To obtain AFS specific rates which varied by aptitude,continuation rates were calculated at the 2-digit level, e.g., 27XXX for AFS 272X0. Atthe 5-digit AFS level aptitude group sizes were very small, especially for the low
12

aptitude groups. By estimating at the 2-digit AFS level, cell sizes were large enoughto use with reliability in the model.
Once the continuation rates were estimated, the probability that an individual withaptitude x will remain in service through YOS a was calculated as the product of allprobabilities (continuation rates) prior to YOS e. For example, if the continuation ratesfor individuals with aptitude x for YOSs 0, 1, 2, and 3 were 0.85, 0.90, 0.90, 0.85,respectively, then the probability that an individual with aptitude x will remain inservice through YOS 3 is the product of (0.85 x 0.90 x 0.90 x 0.85), which equals0.5852. The probability that an individual with aptitude x will remain in servicethrough YOS e is used in the calculation of expected net utility in the allocationmodule.
Pructiky. Data from the Air Force Job Performance Measurement (JPM)research program for each of the four AFSs included in SUMS were used to estimatethe productive capacity of an individual with aptitude x in YOS e. JPM's Walk-Through Performance Interview - Phase I Test score was used (Hedge, 1984). Theinterview test score of the jth individual, T1, was divided by the standard level ofproductivity for an individual in the career field, T*, to determine productive capacity,P1, as shown below:
p TjTI :(18)
where:
Tj is the interview test score for the jth individual
T* is the interview test score for the 75th percentile.
T* was based on the T, value which approximately 75% of the 3 and 5 skill levelrespondents had. Productive capacity ranged between 0 and 2, though mostproductive capacity values were smaller than 1.2. Thus, the estimate of T*represented the productivity level at the 75th percentile.
The relationship between the productive capacity measure, aptitude, andexperience formed the basis for the productive capacity estimates used for each AFS.Using the interview test score data for each of the four AFSs, productive capacityequations were estimated using:
PI,k= bo+ b el,+ b2 X,k (19)
13

where:
P.k is the productive capacity measure for the Jth individual in AFS k,
ei, is YOS (experience) for the jth individual in AFS k, and
xj. is aptitude for the jth individual in AFS k.
Equation 19 was estimated for each AFS using ordinary least squares and providesan estimate of productive capacity for any individual j in AFS k with aptitude x andYOS (experience) e. In addition to the explanatory variables presented, the interceptwas computed to account for the variation in productive capacity occurring withinAFSs due to differences in raters and bases. A summary of the coefficients, t-values,number of observations, and R-squared is found in Table 1.
TABLE 1. OLS COEFFICIENTS AND T-VALUES FOR THE FOURPRODUCTIVE CAPACITY EQUATIONS
Variable/AFS 122X0 272X0 426X2 492X1(Aptitude Score) (General) (General) (Mechanical) (Administrative)
TAFMS (TotalActive Federal 0.0084 0.0032 0.0035 0.0062Military Service) (4.792)- (2.110) (2.812)* (3.649)*
Aptitude Score 0.0006 0.0025 0.0047 0.0009(0.541) (2.655). (5.767)* (0.616)
Number ofObservations 171 172 197 126
R-square 0.4435 0.2772 0.4200 0.2530
Statistically significart at the .01 level.
Experience (TAFMS) was found to be statistically significant in three of the fourequations while aptitude was statistically significant in two.
14

Initial Specification of SUMS
SUMS includes numerous policy and personnel parameters which can bemodified to allow a wide range of "what-if" scenarios. For a detailed discussion of howthe user initializes and operates SUMS refer to the Appendix. Several of theparameters modified in this section were changed sequentially in the six scenariosthat follow to demonstrate SUMS' capability to address the effects of policy andpersonnel system changes, as well as to provide an overview of the analyticalcapabilities of SUMS. The scenarios are:
(1) baseline,
(2) increase in the minimum aptitude score required for an enteringaccession in each AFS,
(3) reduction in the size of the accession pool,
(4) increase the size of the force drawdown in year 2,
(5) impose minimum manning requirements for each AFS and reduce theaccession pool, and
(6) determine the optimal aptitude cut-off scores for each AFS for enteringaccessions.
The values for each scenario can be found in Table 2.
TABLE 2. SCENARIO SEQUENCE
Scenario Minimum Accession Minimum Force DrawdownAptitude Pool Manning in Year 2
Baseline 40 1300 0% 10%1 50 1300 0% 10%2 40 1170 0% 10%3 40 1300 0% 25%4 40 1170 85% 10%5 Determine 1300 0% 10%
Other factors which will remain constant throughout the simulation and
discussion are:
15

(1) The analysis involves four career fields:
Number Q in Relevant Composite
122X0 Aircrew Life Support General272X0 Air Traffic Control General426X2 Jet Engine Mechanic Mechanical492X1 Information Systems Administrative
(2) Two-year projections are simulated beginning in 1990,
(3) the accession aptitude mix applied to each projected year's accession poolis constant. The actual FY89 Air Force Military Entry Processing Stations(MEPS) applicant file was used as the basis for estimating the aptitudemix for each of the 2 projected years,
(4) the beginning inventory and manning goals for each career field for eachprojection year by skill level remain the same and are presented in Table3. The manning goals are decreased in Year 2 by approximately 10%across skill levels and across AFSs with the exception of example 3which simulates a 20% manning reduction,
(5) upgrade proportions are set at 1.0 across all skill levels and AFSs. The 1.0upgrade proportion implies that no individual in a YOS group will bepassed over for upgrade if he/she meets the minimum YOS criteria forthat skill level,
(6) force out proportions are set at 1.0 across all skill levels and AFSs. The 1.0force out proportion implies that 100% of the personnel necessary toreduce the overage in a skill level will be forced out of service,
(7) the minimum years of service for upgrade are 1 year for skill level 3 to 5, 6years for skill level 5 to 7, and 16 years for skill level 7 to 9, and
(8) all costs are assumed to increase by 5% per projection year though regularmilitary compensation (RMC) wage will increase by 4.1% per year.
16

TABLE 3. INVENTORY AND MANNING LEVELS
3 5 7 9 Total
122X0
Initial Inventory 121 720 386 46 1,273Manning Goals (Year 1) 120 720 385 50 1,275Manning Goals (Year 2) 108 648 347 45 1,148
272X0
Initial Inventory 249 1,218 1,105 173 2,745Manning Goals (Year 1) 250 1,220 1,105 175 2,750Manning Goals (Year 2) 234 1,097 995 158 2,484
426X2
Initial Inventory 488 1,842 947 127 3,404Manning Goals (Year 1) 490 1,840 950 125 3,405Manning Goals (Year 2) 441 1,656 855 113 3,065
492X1
Initial Inventory 145 579 340 34 1,098Manning Goals (Year 1) 145 580 340 35 1,100Manning Goals (Year 2) 131 522 306 31 990
Baseline - Force Drawdown
The total system utility (see Table 4) accruing to the personnel system in Year 1was approximately $87.8 million, which is the SUMS productivity estimate from a pop-ulation of 8,525 enlisted personnel in the four AFSs. The dollar value of utility shouldonly be used for comparison to other simulation utility values and not as an actual dol-lar value. Table 5 presents the Baseline scenario simulation results for Year 1 whichis prior to the force drawdown in Year 2. The only manning shortage in Year 1occurred in AFS 492X1. Total recruits accessed in Year 1 were 1,221. Based on th6relative net utilities presented in Table 6, AFSs 122X0 was the only AFS to not be allo-cated accessions with aptitudes above 69, see Table 7. Because of the low net utilityvalues for high aptitude accessions for AFS 122X0, all the high aptitude accessionswere assigned to the other AFSs. Only at aptitude level 60 did AFS 122X0 have a netutility value of any magnitude and therefore accessions came in at this level.
17

TABLE 4. UTILITY
Year Total Population Total Cost Total Value Net Utility
0 8,5201 8,525 $220,575,680 $308,421,120 $87,845,4402 7,680 215,633,728 311,074,560 95,440,832
Year 2 results are presented in Table 8. Forced separations were required in twoof the four AFSs, 122X0 and 426X2, to meet the 10% force reduction. Accessions forYear 2 dropped approximately 73.9% from Year 1 to 319 total accessions. Though thetotal enlisted force fell from 8,525 to 7,680, the total system net utility rose over 8.6%from the previous year to approximately $95.4 million (see Table 4). This dramatic risein total system utility is due to the reduced training costs of accessing fewer but higheraptitude recruits and the higher productivity of a more experienced work force. In fact,even with the 10% reduction in the total force, total value increased by $2.65 millionwith a smaller force. The fewer-in-number but higher-in-aptitude recruits for Year 2more than offset the loss in productivity due to separations and a smaller number ofaccessions. This implies that a more experienced force with higher aptitude recruitscan potentially offset the loss in productivity due to a smaller force. Also, it can benoted from Table 6, the relationship between aptitude and utility is nonlinear.
Scenario 1: Increasing Minimum Aptitude Requirements
Scenario 1 examined the effects of a change in the minimum aptitude require-ments for entering a career field. The specifications of the previous example weremaintained with the exception that minimum aptitude requirements were increasedfrom 40 to 50 for each of the career fields based on the relevant composite score. Thechange in the aptitude requirements did not significantly affect the flow of personnelthrough three of the AFSs, but AFS 122X0 experienced a shortage as the result of thechange in aptitude requirements. In the Baseline example, approximately 21% of theaccessions allocated to AFS 122X0 were from the aptitude group with scores between40 and 49. The higher aptitude requirements eliminated this potential pool ofaccessions for AFS 122X0, as well as for the other AFSs. Without this potential poolof accessions, the remaining eligible pool was reallocated among the four AFSS. Dueto the relative net utilities exhibited in Table 6, higher aptitude accessions were onceagain allocated to AFSs 272X0, 426X2, and 492X1, leaving AFS 122X0approximately 42% short of its accession goal. The accession flow of Year 2 (393)was sufficiently small to be unaffected by the increased aptitude requirements. Giventhe large accession pool (1,300 applicants) relative to the accession goal, theallocation of accessions to each AFS by aptitude was not affected in Year 2.
18

TABLE 5. SIMULATION RESULTS FOR A2-YEAR PROJECTION: YEAR 1
Skill Levels3 5 7 9 Total
122X0Manning Goals 120 720 385 50 1,275Initial Inventory 121 720 386 46 1,273Separations 16 138 31 17 203Upgrades 0 105 51 21 177Accessions 205 0 0 0 205Forced Outs 0 0 0 0 0Shortage (Overage) 85 -85 0 0 0Ending Inventory 205 635 385 50 1,275
272X0Manning Goals 250 1,220 1,105 175 2,750Initial Inventory 249 1,218 1,105 173 2,745Separations 27 209 108 32 375Upgrades 0 222 142 34 398Accessions 380 0 0 0 380Forced Outs 0 0 0 0 0Shortage (Overage) 130 -130 0 0 0Ending Inventory 380 1,090 1,105 175 2,750
426X2Manning Goals 490 1,840 950 125 3,405Initial Inventory 488 1,842 947 127 3,404Separations 48 353 67 29 499Upgrades 0 440 98 27 565Accessions 499 0 0 0 499Forced Outs 0 0 0 0 0Shortage (Overage) 9 -9 0 0 0Ending Inventory 499 1,831 950 125 3,4G5
492X1Manning Goals 145 580 340 35 1,100Initial Inventory 145 579 340 34 1,098Separations 13 87 35 6 140Upgrades 0 129 41 7 177Accessions 137 0 0 0 137Forced Outs 0 0 0 0 0Shortage (Overage) -5 0 0 0 -5Ending Inventory 140 580 340 35 1,095
19

TABLE 6. NET UTILITY FOR APTITUDE GROUPS BY AFS
AFS Aptitude Value Cost Net Utility
90 $103,303 $ 96,718 $ 6,58680 128,792 108,920 19,87270 122,810 106,084 16,72560 146.582 122,363 24,219
122X0 50 110,929 100,509 10,42140 124,004 106,420 17,58430 113,307 103,976 9,33220 8,818 8,037 78110 8,790 8,037 753
90 141,428 103,744 37,68580 152,672 110,269 42,40470 159,761 113,397 46,36560 139,181 99,900 39,282
272X0 50 135,106 98,262 36,84440 138,793 99,608 39,18530 141,085 101,685 40,40020 13,024 8,037 4,98810 13,024 8,037 4,988
90 140,935 105,665 35,27180 140,156 105,216 34j94070 137,840 104,313 33,52760 132,345 100,264 32,081
426X2 50 127,521 96,927 30,59540 128,529 98,141 30,38830 128,155 98,576 29,57920 113,364 87,409 25,95510 104,416 79,634 24,782
90 114,755 105,133 9,62380 130,971 118,184 12,78770 102,256 97,074 5,18360 115,584 105,714 9,871
492XI 50 117,081 107,753 9,32940 118,943 108,425 10,51830 133,709 121,407 12,30320 116,011 105,973 10,03810 9,193 8,037 1,156
20
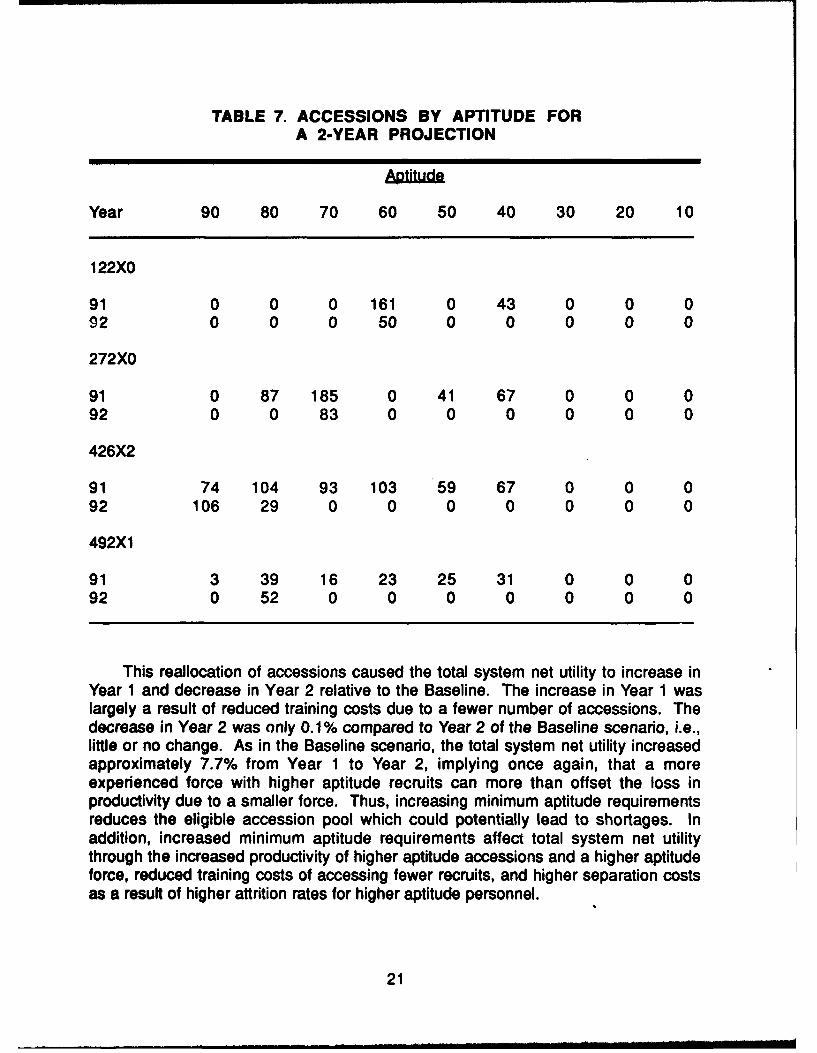
TABLE 7. ACCESSIONS BY APTITUDE FORA 2-YEAR PROJECTION
Year 90 80 70 60 50 40 30 20 10
122X0
91 0 0 0 161 0 43 0 0 0
92 0 0 0 50 0 0 0 0 0
272X0
91 0 87 185 0 41 67 0 0 092 0 0 83 0 0 0 0 0 0
426X2
91 74 104 93 103 59 67 0 0 092 106 29 0 0 0 0 0 0 0
492X1
91 3 39 16 23 25 31 0 0 092 0 52 0 0 0 0 0 0 0
This reallocation of accessions caused the total system net utility to increase inYear 1 and decrease in Year 2 relative to the Baseline. The increase in Year 1 waslargely a result of reduced training costs due to a fewer number of accessions. Thedecrease in Year 2 was only 0.1% compared to Year 2 of the Baseline scenario, i.e.,little or no change. As in the Baseline scenario, the total system net utility increasedapproximately 7.7% from Year 1 to Year 2, implying once again, that a moreexperienced force with higher aptitude recruits can more than offset the loss inproductivity due to a smaller force. Thus, increasing minimum aptitude requirementsreduces the eligible accession pool which could potentially lead to shortages. Inaddition, increased minimum aptitude requirements affect total system net utilitythrough the increased productivity of higher aptitude accessions and a higher aptitudeforce, reduced training costs of accessing fewer recruits, and higher separation costsas a result of higher attrition rates for higher aptitude personnel.
21

TABLE 8. SIMULATION RESULTS FOR A
2-YEAR PROJECTION: YEAR 2
3 5 7 9 Total
122X0Manning Goals 108 648 347 45 1,148Initial Inventory 206 635 385 50 1,275Separations 8 125 26 15 175Upgrades 0 138 0 10 148Accessions 50 0 0 0 50Forced Outs 0 0 2 0 2Shortage (Overage) 0 0 0 0 0Ending Inventory 108 648 347 45 1148
272X0Manning Goals 225 1,098 995 158 2,476Initial Inventory 380 1,090 1,105 175 2,750Separations 32 190 96 39 357Upgrades 0 205 8 22 235Accessions 83 0 0 0 83Forced Outs 0 0 0 0 0Shortage (Overage) 0 0 0 0 0Ending Inventory 225 1,098 995 158 2,476
426X2Manning Goals 441 1,656 855 113 3,065Initial Inventory 499 1,830 950 125 3,405Separations 30 338 60 31 460Upgrades 0 164 0 19 183Accessions 135 0 0 0 135Forced Outs 0 0 15 0 15Shortage (Overage) 0 0 0 0 0Ending Inventory 441 1,656 855 113 3,065
492X1Manning Goals 131 522 306 32 991Initial Inventory 140 580 340 35 1,095Separations 9 97 39 12 157Upgrades 0 53 14 9 75Accessions 52 0 0 0 52Forced Outs 5 8 10 0 23Shortage (Overage) 0 0 0 0 0Ending Inventory 131 522 306 32 991
22
Scenario 2: Reducing the Accession Pool
The size of the accession pool not only affects the allocation of accessions butalso determines the level of productivity since productivity is a function of aptitude andexperience. The accession pool for Scenario 2 was decreased by 10% to 1,170, withthe aptitude distribution within the accession pool remaining the same. In Year 1, theprimary effect of a smaller accession pool was the inability to attain accession goals.AFSs 122X0 and 492X1 experienced shortages of 74 and 49 people, respectively.These shortages were mitigated in Year 2 with the reduction in force levelrequirements.
As compared to the Baseline scenario, total system net utility rose approximately1.1% in Year I and decreased 0.1% in Year 2. The increased utility in Year 1 was dueto the shortage of personnel which reduced training costs relatively more than itreduced productivity. Since BMT training costs affected only first year accessions andfirst year accessions did not contribute significantly to force productivity, the loss invalue was more than offset by the reduction in training costs. The decrease in Year 2was only 0.1%.compared to Year 2 of the Baseline scenario, i.e., little or no change.As in the Baseline scenario, the total system net utility increased approximately 7.3%from Year 1 to Year 2, implying once again, that a more experienced force with higheraptitude recruits can more than offset the loss in productivity due to a smaller force.
Scenario 3: Force Drawdown of 25%
Scenario 3 increased the force drawdown in Year 2 of the Baseline scenario to25%. The results for Year 1 are exactly identical to the Baseline results for Year 1. InYear 2, the 25% force drawdown caused forced separations in all of the AFSs whileonly two AFSs exhibited forced separations in the Baseline scenario. In the Baselinescenario only 17 airmen were forced to separate, while 978 forced separationsoccurred in Scenario 3. In addition, 319 accessions were allocated in Year 2 of theBaseline scenario while no accessions were allocated in Scenario 3.
Total system net utility decreased approximately 8.6% in Year 2 from the Baselinescenario to Scenario 3. Both value and cost declined in the Year 2 of Scenario 3 astotal system net utility decreasing by 0.7%. Whereas the more experienced workforceof the Baseline scenario with its higher aptitude recruits more than offset the loss inproductivity due to a smaller force, the Scenario 3 decrease in the size of theworkforce was too large to be offset. Thus, experience and higher aptitude recruitscan offset losses in productivity from force reductions but there is a limit to the extentthat the tradeoff remains favorable for total system net utility.
Scenario 4: Minimum Manning Requirements
To ensure that each career field is able, at least partially, to meet its desiredaccession goal, SUMS provides the ability to state desired minimum manning levels.
23

goals, the accessions will be allocated to the AFSs in order to maximize total systemnet utility, and, thus, the minimum manning levels will not affect the allocation ofaccessions or total system net utility. If minimum aptitude requirements restrict theavailable pool below the number required to fulfill recruiting goals, SUMS will performa constrained maximization of total system net utility subject to the minimum manninggoals across AFSs. Minimum manning requirements were established at 85% acrossthe four AFSs. Thus, if the accession goal for AFS 272X0 is 209, then SUMS willattempt to access at least 177 recruits for AFS 272X0, as well as 85% of the desiredaccession goals across all other AFSs.
In addition, the accession pool was reduced by 10% from 1,300 to 1,170. Withthe accession pool at 1,300, the results exactly replicate the Baseline scenariobecause the shortage which occurred did not cause the AFS to fall below theminimum manning requirement of 85%. For this reason an accession pool size of1,170 was used to illustrate the effects of minimum manning requirements on totalsystem net utility. This scenario is comparable to Scenario 2 which assumed a 10%reduction in the accession pool.
The key difference between Scenario 2 and Scenario 4 in Year 1 occurred in theallocation of accessions across AFSs. In Scenario 2, only two of the AFSs exhibitedshortages, 74 for AFS 122X0 and 49 for AFS 492X1. Since manning requirementswere met first, shortages were spread among three of the four AFSs in Scenario 4: 31for AFS 122X0, 71 for AFS 426X2, and 21 for AFS 492X1. The total forceexperienced a shortage of 123 accessions in both scenarios. The total system netutility for Year 1 decreased from Scenario 2 to Scenario 5 by slightly less than 0.6%,which resulted from the less than optimal allocation of accessions caused by theminimum manning requirements.
Year 2 for both scenarios showed similar results to the Year 1 comparison. Thus,imposing minimum manning requirements leads to less than optimal allocations ofaccessions as measured by total system net utility. The higher the level at whichminimum manning requirements are established the more likely a less than optimalallocation of accessions will occur and the greater the impact on total system net utility.
Scenario 5: Establishing Aptitude Cutoff Scores
Scenario 5 is identical to the Baseline scenario with the exception that theallocation module of SUMS was allowed to establish the optimal aptitude cutoffscores given the aptitude mix and size of the accession pool. The allocation moduleis not restricted by a minimum aptitude score when allocating accessions amongAFSs. In this scenado the "cutoff score" established for an AFS is determined by thelowest aptitude accession allocated to that AFS. This "cutoff score" for each AFS isonly relevant for the accession pool used in determining the "cutoff score." In otherwords, given a different aptitude mix and size accession pool the "cutoff score" wouldbe different.
24

The key factor in determining the cutoff score for an AFS is the expected net utilityfor accessions with aptitude x. As discussed in the previous section, the expected netutility used in SUMS is discounted over 30 years of service accounting for productivity,attrition, value, and cost. In the expected net utilities presented in Table 6, thevariation in expected net utility by aptitude is caused by two key factors: productivityand probability of continuation from YOS e to YOS e+l. In the example presented inTable 6, value and cost within an AFS do not vary by aptitude, only by YOS. Asdiscussed earlier, productivity is directly related to aptitude, i.e., for a given level ofexperience (years of service), e, as aptitude, x, increases productivity, P,., rises. Ifproductivity were the only factor which affected expected net utility, then expected netutility would always increase with aptitude.
Of course, the other key factor in the expected net utility calculation, is theprobability of continuation from YOS e to YOS e+1. Continuation rates wereestimated that accounted for variations by AFS and aptitude. Different continuationrates were observed for each decile of aptitude. For example, expected net utility forAFS 122X0 increases from aptitude group 90 to aptitude group 80, decreases fromaptitude group 80 to aptitude group 70, increases from aptitude group 70 to aptitudegroup 60, decreases from aptitude group 60 to aptitude group 50, etc. Obviously,attrition is not always directly or inversely related to aptitude but changes throughoutthe whole range of aptitude. Similar patterns are exhibited by AFSs 272X0 and492X1 in Table 6 while AFS 426X2 exhibits a consistent downward trend in expectednet utility. With the variations in expected net utility exhibited by AFSs 122X0, 272X0,and 492X1, it would not be surprising to find the accession allocation moduleallocating accessions from lower aptitude groups, if necessary, to fulfill accessiongoals.
In Year 1, a cutoff score of 40 on the relevant composite was established for AFS122X0, while scores of 30 were established for AFSs 272X0 and 426X2. AFS 492X1had a low score of 20 established as its cutoff. In Year 2, the established cutoff scoresrose dramatically due to the fall in the accession goals from 1,225 to 316 resultingfrom the 10% force reduction. This implies that cutoff scores only become an issuewhen accession goals are sufficiently high relative to the accession pool to requireconsideration of recruits with low aptitude scores. Year 1 is an example of a, relativelyhigh accession goal compared to the available accession pool. The system can eitherincur the consequences of manning shortages and high aptitude requirements as inYear 1 of the Baseline scenario or accept lower quality recruits in some AFSs and nomanning shortages as in Year 1 of Scenario 5.
The total system net utility decreased by 0.06% in Year 1 between the Baselinescenario and Scenario 5. Total value increased in Year 1 by only 0.01% between theBaseline scenario and Scenario 5 while costs rose by approximately 0.04% due to thehigher training costs associated with more accessions. In addition, the fall in totalsystem net utility between the Baseline scenario and Scenario 5 for Year 1 can beconsidered a short-run phenomenon. Since the accession allocation module is
25

maximizing expected total system net utility over 30 years of service, the equilibriumposition for the system will be established at a higher total system net utility than if theminimum aptitude requirements of the Baseline scenario are maintained. Theexpected net utility values used to optimize the allocation of recruits were based onthe same continuation rates which caused separations and losses by YOS, AFS, andaptitude group and, thus, affected the value calculated for total system net utility.
CONCLUSIONS AND RECOMMENDATIONS
SUMS is a prototype developed to provide manpower managers and policymakers with a tool to analyze the effects of manpower decisions and personnel policyon the career field specific and overall system utility. SUMS utilizes research acrossseveral areas: economic and econometric analysis of accession and retention (Stoneet al., 1989b), human resource accounting applications (Stone et al., 1989a), andutility analysis (Boudreau & Berger, 1985). SUMS combines the methodologies ofthese areas of research with the inventory flow aspects of the Air Force enlistedpersonnel system, accession, upgrade, separation, and continuation, to assess adollar payoff for alternative HRM programs.
Conclusions
The scenarios presented in this report provided several conclusions:
1. A more experienced force with higher aptitude recruits can more than offsetthe loss in productivity due to a smaller force.
2. Increasing minimum aptitude requirements reduces the eligible accessionpool, which could contribute to potential shortages, and indirectly affects total systemnet utility through increased productivity of entering accessions, reduced trainingcosts, etc.
3. Within a limited range, reduction of the size of the available accession poolcan lead to shortages (whether as a function of accession pool characteristics or userspecified minimum aptitude cutoff scores), but once again, a more experienced forcewith higher aptitude recruits can offset the loss in productivity due to a smaller force.
4. Losses in productivity due to increased force reductions can be offset with amore experienced workforce and higher aptitude recruits, but there is a limit to theextent to which the tradeoff remains favorable for total system net utility.
5. Imposing minimum manning requirements leads to less than optimalallocations of accessions as measured by total system net utility. The higher the levelat which minimum manning requirements are established the more likely a less thanoptimal allocation of accessions will occur and the greater the impact on total systemnet utility.
26

6. Initial declines in total system net utility from establishing low aptitude cutoffsscores can be considered a short-run phenomenon. Since the accession allocationmodule is maximizing expected total system net utility over 30 years of service, theequilibrium position for the system will be established at a higher total system net utilitythan if across-the-board minimum aptitude requirements are maintained.
Recommendations
SUMS is presently a prototype with several obvious avenues for future research:
1. Expansion of SUMS to a fully operating, force level software package,
2. Modification of SUMS to account for a two-tier upgrade system,
3. Extension of SUMS to allow analysis of more personnel policy decisions andmanagement programs such as cross-training, severance pay, upgrade programs,etc.,
4. Extension of SUMS to account for other costs and values associated withenlisted personnel flows through the manpower system such as losses in productivitydue to temporary duty assignments, moving costs associated with permanent changeof stations, commissary costs and value, etc.,
5. Revision of SUMS' present utility theory to include additional analysiscapability such as training program assessment, reenlistment bonus programassessment, cross-training assessment, etc.,
6. Consideration of methodologies for implementing economic and demographiceffects on reenlistment/retention within the SUMS present continuation rate structure,and
7. Expansion of SUMS' capability to account for effects of premature attrition inthe first year of service and the affects of premature attrition on costs.
8. Capability to fix output and solve for least cost.
9. Extension of SUMS to allow a front end analysis of recruiting resources andthe size or quality of the accession pool.
10. Extension of SUMS to allow use of alternative productivity measuremethodologies.
27

REFERENCES
FY88 Cost Factors, (1988). Director of Cost: DCS, Comptroller, HQ ATC, RandolphAFB, TX
Boudreau, J.W. (1988). Human resource management, evolving roles andresponsibilities. Washington, D.C.: Bureau of National Affairs, Inc.
Boudreau, J.W., & Berger, C.J. (1985). Decision-theoretic utility analysis applied to
employee separations and acquisitions. Journal of Applied Psychology 70.
Brogden, H.E. (1949). When testing pays off. Personnel Psychology, 2.
Carpenter, M.A., Monaco, S.J., & O'Mara, S.J. (1989). Time to proficiency. Paperprepared for the Training Systems Division, Brooks AFB, TX: Air Force HumanResources Laboratory.
Cascio, W.F. (1982). Costing Human Resources: The Financial Impact of Behavior inOrganizations. Boston, MA: Kent.
Cronbach, L.J., & Gleser, G.C. (1965). Psychological tests and personnel decisions.Urbana: University of Illinois Press.
Faneuff, R.S., Valentine, L.D., Stone, B.M., Curry, G.L., & Hageman, D.C. (1990).Extending the time to proficiency model for simultaneous application to multiplejobs. (AFHRL-TP-90-42, AD A245 854). Brooks AFB, TX: Training SystemsDivision, Air Force Human Resources Laboratory.
Flemming, K., Cowardin, L.J., Reynolds, K., & Nielson, D. (1986). A methodology forestimating the full cost of replacing trained Air Force personnel (Working paper).Colorado Springs, CO: Department of Economics, Air Force Academy.
Hedge, J.W. (1984). The methodology of walk-through performance testing. Paperpresented at the annual meeting of the American Psychological Association,Toronto.
Hull, C.L. (1928). Aptitude testing. New York: World Book.
Hunter, J.E., & Schmidt, F.L. (1982). Fitting people to jobs: the impact of personnelselection on national productivity. In Human Performance and Productivity.Hillsdale, NJ: Eribaum.
Kelley, T.L. (1923). Statistical method. New York: Macmillan.
28

landy, F.J., Farr, J.L., & Jacobs, R.R. (1982). Utility concepts in performancemeasurement. Organizational Behavior and Human Performance, 30.
Longmire, K.M., & Short, L.O., (1989). Occupational research data bank: A key toMPTS analysis support. AFHRL-TP-88-71, AD-A210-804. Brooks AFB, TX:Manpower and Personnel Division.
Saving, T.R., Stone, B.M., Looper, L.T., & Taylor, J., (1985). Retention of Air Forceenlisted personnel: An empirical examination. (AFHRL-TP-85-6, AD A158 091).Brooks AFB, TX: Manpower and Personnel Division.
Schmidt, F.L., Hunter, J.E., McKenzie, R.C., & MuIdrow, T.W. (1979). Impact of validselection procedures on work-force productivity. Journal of Applied Psychology,64.
Stone, B.M., Looper, LT., & McGarrity, J.R, (1989b). Validation and reestimation of anAir Force reenlistment analysis model. Brooks Air Force Base, TX: Manpowerand Personnel Division, Air Force Human Resources Laboratory.
Stone, B.M., Rettenmaier, A.J., Saving, T.R., & Looper, L.T. (1989a). Cost-basedvalue models of Air Force experience. (AFHRL-TP-89-20, A212 771). Manpowerand Personnel Division, Air Force Human Resources Laboratory, Brooks AFB,TX.
Stone, B.M., Saving, T.R., Turner, K.L., Looper, L.T., & Engquist, S.K. (1991). Asimultaneous estimation model of Air Force accession and retention. (AL-TR-1991-0063, AD A240 064). Manpower and Personnel Research Division,Human Resources Directorate, Armstrong Laboratory, Brooks AFB, TX.
U.S. Department of Commerce, Bureau of the Census, (1986). Current PopulationSurvey. Microdata File.
29

APPENDIXINITIALIZING AND IMPLEMENTING SUMS
SUMS is comprised three major components: (1) an accession allocation model,(2) personnel flow model, and (3) utility assessment model. Each componentprovides necessary information to the other components which comprises the basisfor the simulation. This appendix presents a detailed discussion of the mechanics ofinitializing and running SUMS. In addition, examples of the output of a SUMSsimulation are explained.
Initializing SUMS
SUMS has the capability to run numerous alternative scenarios involving singleor multiple career fields and one or more projection periods (up to 10 years). TheSUMS prototype can run a maximum of four AFSs and project a maximum of 10years. Numerous files are involved in the initialization of SUMS. The first file to beinitialized is the "run.run" file. The "run.run" file sets:
(1) the file to which the output will be sent when the simulation has beencompleted. For example, sums.out as indicated in Table A-i,
TABLE A-1. RUN.RUN FILE EXAMPLE
sums.out
2 90
1
pool
1
scenario
TOTALPOP
TOTALUTILTOTALVALUETOTALCOST
(2) the number of time periods to be simulated up to a maximum of 10. Table A-
1 has indicated 2 time periods to be simulated,
31
(3) the beginning time period. For example, 90 if the first time period is 1990(Table A-i),
(4) the name of the file containing the aptitude mix of the accession pool (poolin Table A-1),
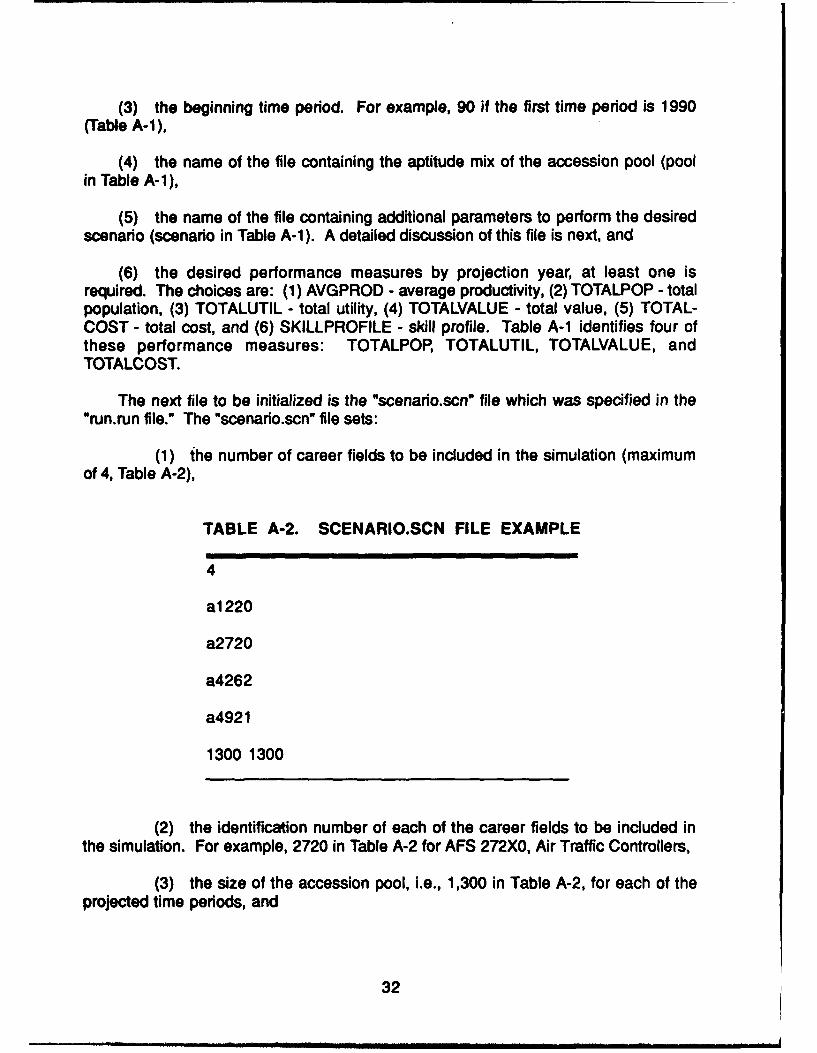
(5) the name of the file containing additional parameters to perform the desiredscenario (scenario in Table A-i). A detailed discussion of this file is next, and
(6) the desired performance measures by projection year, at least one isrequired. The choices are: (1) AVGPROD - average productivity, (2) TOTALPOP - totalpopulation, (3) TOTALUTIL - total utility, (4) TOTALVALUE - total value, (5) TOTAL-COST - total cost, and (6) SKILLPROFILE - skill profile. Table A-1 identifies four ofthese performance measures: TOTALPOP, TOTALUTIL, TOTALVALUE, andTOTALCOST.
The next file to be initialized is the "scenario.scn" file which was specified in the"run.run file.' The "scenario.scn" file sets:
(1) the number of career fields to be included in the simulation (maximumof 4, Table A-2),
TABLE A-2. SCENARIO.SCN FILE EXAMPLE
4
a1220
a2720
a4262
a4921
1300 1300
(2) the identification number of each of the career fields to be included inthe simulation. For example, 2720 in Table A-2 for AFS 272X0, Air Traffic Controllers,
(3) the size of the accession pool, i.e., 1,300 in Table A-2, for each of theprojected time periods, and
32

Next, a file is initialized for each of the career fields to be included in the analysis,"axxxx.afs" files, where the xxxx Is the 4-digit code Identifying the career field, e.g.,2720 for air traffic controllers. The "axxxx.afs" file sets:
(1) the ASVAB composite score used to allocate accessions to the careerfield, i.e., M for mechanical, A for administrative, G for general, or E for electronic.Career fields are presently restricted to one of the four composite scores. Forexample, G in Table A-3 represents the general composite score which is used forAFS 122X0,
(2) the number of aptitude categories. Presently, SUMS provides for 10categories of aptitude (Table A-3): 90 to 99, 80 to 89, 70 to 79, 60 to 69, ..., 10 to 19, 0to 9,
(3) the number of skill categories for the career field. Presently, SUMSprovides for 4 skill categories (Table A-3): 3 for semi-skilled, 5 for skilled, 7 foradvanced, and 9 for superintendent/manager,
(4) the class files for each of the aptitude/skill/AFS cohorts. For example,file "c1 220570.cls" (Table A-3) includes data for AFS 122x0, skill level 5, and aptitude70,
(5) the OJT costs by YOS for the career field (Table A-3),
(6) the technical training costs by YOS for the career field (Table A-3),
(7) the BMT for the career field. Presently, BMT does not differ by careerfield. For example, $6,415.00 in Table A-3,
(8) the minimum aptitude score allowed for accessions to enter the careerfield (40 in Table A-3),
(9) the manning levels for each designated skill level for the career field.For example, 120, 720, 385, and 50 for Year 1 of AFS 122X0 in Table A-3,
(10) the portion of an overage, if one occurs, which will be forced out of thecareer field by skill level (1.0 in Table A-3),
(11) the portion of personnel who need to be upgraded to the next skill levelby skill level for the career field (1.0 in Table A-3). This fraction is applied equallyagainst each YOS group and causes the specified fraction to be skipped over in theupgrade phase,
(12) the minimum number of years of service required to be qualified forupgrade from one skill level to the next for each designated skill level. For example, 1,6, and 16 for AFS 122X0 in Table A-3,
33

TABLE A-3. THE "AXXXX.AFS" FILE EXAMPLE
G990 80 70 60 50 40 30 20 10
43579
90 3 c1 220390 90 5 c1 220590 90 7 c1 220790 90 9 c1 22099080 3 c1220380 80 5 c1220580 80 7 c1220780 80 9 c122098070 3 c1 220370 70 5 c1 220570 70 7 c1 220770 70 9 c1 22097060 3 c1 220360 60 5 c1 220560 60 7 c1 220760 60 9 c1 22096050 3 c1220350 50 5 c1220550 50 7 c1220750 50 9 c122095040 3 c1 220340 40 5 c1 220340 40 7 c1 220740 40 9 c1 22094030 3 c1 220330 30 5 c1 220530 30 7 c1 220730 30 9 ci 22093020 3 c1 220320 20 5 c1 220520 20 7 c1 220720 20 9 ci 22092010 3 c1220310 10 5 c1220510 10 7 c1220710 10 9 c1220910
1616.41 6066.58 7949.22 6204.21 0.00 0.00 0.00 0.00 0.00 0.00 0.00 0.00 0.00 0.000.00 0.00 0.00 0.00 0.00 0.00 0.00 0.00 0.00 0.00 0.00 0.00 0.00 0.00 0.00 0.00 0.00
1916.61 4181.42 4228.85 733.85 1225.02 605.67 89.65 373.39 278.00 389.21518.94 370.67 0.000.00 0.00 0.00 0.00 0.00 0.00 0.00 0.00 0.00 0.00 0.00 0.00 0.00 0.00 0.00 0.00 0.000.00
6415.00
40 120.0 1.0 1.0 1 720.0 1.0 1.0 6 385.0 1.0 1.C 16 50.0 1.0 1.0 040 90.0 1.0 1.0 1 540.0 1.0 1.0 6 289.0 1.0 1.0 16 38.0 1.0 1.0 0
1.05 1.10251.025 1.0511.041 1.0841.025 1.0511.025 1.0511.025 1.0511.0 1.0
34

(13) the minimum manning requirement for the AFS (0 in Table A-3).Accessions are allocated to insure that minimum manning requirements for each AFSare met based on the AFS-specific demand for accessions and the availability ofaccessions to meet the minimum manning levels across AFSs, and
(14) the proportional change expected to occur in each projected timeperiod for each of seven factors. Changes are based on the starting value for thefactor. For example, a desired change of 5% per year for a 2-year projection would bepresented as 1.05 for Year 1 and 1.1025 for Year 2 (Table A-3). The seven factors (inorder presented in Table A-3) are service state values, separation costs, regularmilitary compensation, OJT costs, technical training costs, BMT costs, and productivity.
Finally, a file for each of the aptitude/skill level/AFS cohorts is initialized,"cxxxxyzz.cis" files, where the xxxx is the 4-digit code identifying the career field, e.g.,2720 for air traffic controllers, y is a code identifying the skill level, e.g., 3 for semi-skilled, and zz is a 2-digit code identifying the aptitude category, e.g., 20 for aptitudecohort 20 to 29. The "cxxxxyzz.cls" file sets six groups of values as presented in TableA-4:
(1) the productivity values by YOS,
(2) the continuation rates by YOS,
(3) the beginning inventory by YOS,
(4) the service state values by YOS,
(5) the separation costs by YOS, and
(6) the RMC by YOS.
The "run.run," "scenario.scn," "axxxx.afs," and "cxxxxyzz.cls" files provide theparameters necessary to initialize SUMS.
35

TABLE A-4. THE "CXXXXYZZ.CLS" FILE EXAMPLE
0.973 0.983 0.994 1.004 1.013 1.023 1.032 1.040 1.049 1.0571.064 1.072 1.079 1.085 1.092 1.098 1.103 1.109 1.114 1.1181.123 1.127 1.131 1.134 1.137 1.140 1.142 1.144 1.146 1.1471.148
-1.906 .911 .889 .600 .895 .900 .958 .867 .842 .7691.000 1.000 1.000 1.000 .909 1.000 1.000 1.000 1.000 .833.857 .600 .500 .000 .000 .000 .000 .000 1.000 .000.000
0.000 10.000 29.000 20.000 18.000 14.000 9.000 3.000 2.000 0.0000.000 1.000 0.000 0.000 0.000 0.000 0.000 0.000 0.000 0.0000.000 0.000 0.000 0.000 0.000 0.000 0.000 0.000 0.000 0.0000.000
17887.896 20384.938 22811.885 25168.729 27455.47729893.064 32310.094 34706.539 37082.402 38746.56340341.719 41867.871 43325.027 44532.746 45670.36346737.887 47735.312 48662.652 49519.895 50307.04351024.094 51671.059 52247.922 52754,707 53191.39553557.988 53854.477 54080.883 54237.195 54323.40654339.520
0.000 0.000 0.000 0.000 781.200 0.000 0.000 0.000 0.000 0.0000.000 0.000 0.000 0.000 0.000 0.000 0.000 0.000 0.000 0.0000.000 0.000 0.000 0.000 0.000 0.000 0.000 0.000 0.000 0.0000.000
15582.38 15946.380 16777.600 18079.699 19172.46119214.59 19887.539 20159.369 26923.770 26220.36926036.47 25840.320 26717.211 26641.080 27133.76027580.46 26954.410 26954.410 26954.410 26954.41026954.41 26954.410 26954.410 26954.410 26954.41026954.41 2696 ,'.410 26954.410 26954.410 26954.41026954.41
36

SUMS Simulation
SUMS evaluates the utility of varying force structures, personnel managementprograms, accession policies, compensation issues, upgrade policies, andreenlistment/retirement policies through several performance/value/cost relatedmeasures. These measures are the product of personnel flow simulations based on atime dependent model of the enlisted personnel system. The simulation model isconcerned with time dependent updating of the manpower profiles; computingseparations, upgrades and accessions; and evaluating the requested measures ofeffectiveness for the various scenarios defined. This is accomplished by a yearly timestep updating procedure which performs three basic functions in the following order:
(1) updating AFS profiles by aging the manpower profile and computingnatural separations,
(2) computing upgrades and/or forced separations, if necessary, and
(3) computing accessions to be drawn from the recruit pool.
SUMS begins with user initialization of its parameters and then performs thesimulation of the desired scenario. The continuation rates by YOS for each AFS skilland aptitude class are used to obtain the natural attrition from the force for the specificjob classification. Then the manning goals for the scenario by AFS skill category areapplied. If the post-separation force levels are above the skill level goals, then forcedseparations are imposed. Flexibility in the meeting of these goals is imbedded intothe system by allowing the user to specify a number which determines how strictly thegoals are to be met. The base number of 1.0 requires that forced separations beimposed so as to exactly meet the specific AFS/skill level goal. Specifying a fraction(a number less than 1.0) allows forced separations to be less severe, while a numberlarger than 1.0 allows for creating manning vacancies into which upgrades can occur.
Starting at the highest skill level, upgrades from the immediate preceding skilllevel are computed to fill the manning level deficiencies which may or may not occur.The number of upgrades from any skill level are constrained by an eligibilityrequirement based on YOS and specified by the user. Upgrades are also constrainedby a user-specified proportion representing the number of potential upgradepersonnel being passed over for upgrade. This procedure is repeated for each skilllevel in turn, proceeding from the highest to the lowest skill category. The deficiencycreated at the entry level skill category plus any deficiencies after upgrade of anyhigher skill levels is then used as the accession goal for that AFS in the accessionallocation process.
The accession allocation routine uses the manpower demands by AFS alongwith a supply pool to optimally allocate accessions by aptitude category to the variousAFS's. The measure used to make this allocation is the expected net utility from beingallocated to a particular AFS over a 30 YOS career horizon of an individual of
37

specified aptitude. The pool population is segmented into 104 categories based onthe four aptitude scores (10,000 categories). Each group is further segmented intocategories of individuals who are allocated to each of the AFS's. The resultingoptimization problem is solved using a transportation algorithm (a linear programmingapproach) with as many demands for accessions as there are AFS's and 10,000 timesthe number of AFS's as the number of supplies (Faneuff et al., 1990).
Upon completion of the accession allocation, SUMS calculates the total netsystem utility accruing from the force for the time period. The simulation is repeatedfor each projected time period. The system facilitates comparison of different multi-period force scenarios by permitting several scenarios to be submitted at the sametime. A variety of performance measures are made available addressing inventorymanagement, costs, value, and system utility.
SUMS derives its uniqueness from the scope and flexibility of its analysiscapabilities. For example, if there are four skill level categories (3, 5, 7 and 9) for eachAFS and the force profile can be categorized into ten aptitude categories (90, 80, 70,... , 10, 0), then each AFS in the analysis would consist of 4 times 10 "cxxxxyzz.cls"files. Thus, each analysis of a scenario consisting of four AFS's would require themaintaining and updating of 160 "cxxxxyzz.cls" files. Since SUMS allows the user toexpand the number of skill and aptitude categories, the number of class files and thecomplexity of the analysis can be increased significantly.
SUMS Output
Output from SUMS is comprised of: (1) the net utilities used for accessionallocations and the resulting accession allocation into each AFS by aptitude, and (2)the total system measures of performance by year such as total manpower levels, totalcosts, net utility, actual manning levels, accessions, separations, upgrades, etc.
Utilities For Accession Allocation
The value, cost and net utility of allocating an individual of a given aptitude to anAFS can vary over time. The simulation periods are 1 year, so these utility factors areprinted at the beginning of each yearly iteration. Table A-5 presents an example ofvalue, cost, and net utility for a single projection year. The net utility column is anexpected net utility measure associated with accessing a recruit with a given aptitudeinto a particular career field and progressing him/her through 30 years of service. Theexpected part of the net utility estimate results from the probability of separation ateach YOS.
Expected net utility by AFS and aptitude is used in the optimization of theaccession allocation (Faneuff et al., 1990). The optimization scheme searches for anallocation of the available accession pool which maximizes the total net utilityaccruing to the Air Force across all accessions and career fields included in thescenario.
38

Measures of Performance from the Simulation Output
Table A-6 presents an example of the output provided from the first year of a 5-year simulation. The same information is provided for each year of a simulation foreach career field included in the scenario. Manning goals represent the targetedgoals set by the user for each skill level. Initial inventory is the number of enlistedpersonnel present in each skill level at the beginning of the simulation. Separationsare the number of personnel who separate from active duty by skill level during theprojected time period. Separations are responsible for opening slots for upgradeduring the projected time period since SUMS upgrades to fill.
Upgrades are the number of personnel upgraded from one skill level to the nextduring the projected time period. Accessions are the number of new recruits requiredto meet overall manning goals for the career field. At present, accessions only occurin skill level 3, thus, cross-training and prior service accessions are not presentlyincluded in SUMS capability. Force outs represent the number of personnel whowere forced out of active duty due to an overage in the career field. Shortage(Overage) is the number of personnel short or over the career field goal after theprojected time period. Ending inventory is the number of personnel in each skill levelat the end of the projection period.
Four additional sets of information are provided for each projected year acrossAFSs concerning the total system population, the total personnel cost, the total value,and the total net utility.
UTILITY
Total Total Total Netr Ppuln Value
90 7,54091 9,530 $215,625,392 $254,812,480 $39,187,09092 8,687 211,809,104 262,623,568 50,814,460
Thus, the user is provided with a means of assessing total system utility resulting fromvarying accession/retention policies and alternative force structures.
39

TABLE A-5. NET RETURNS FOR APTITUDE
GROUPS BY AFS: YEAR I
AM~ ApithudeVlu o Nt Utld
90 $140,657 $134,891 $5,76680 140,232 134,891 5,34170 139,819 134,891 4,92860 139,364 134,891 4,474
122X0 50 138,956 134,891 4,06540 138,539 134,891 3,64830 138,116 134,891 3,22520 137,703 134,891 2,81210 137,284 134,891 2,393
90 166,052 135,602 30,45180 165,908 135,602 30,30770 165,765 135,602 30,16460 165,685 135,602 30,084
272X0 50 165,555 135,602 29,95340 165,405 135,602 29,80330 165,274 135,602 29,67220 165,148 135,602 29,54610 165,066 135,602 29,465
90 147,142 132,154 14,98980 146,420 132,154 14,26770 145,692 132,154 13,53860 144,979 132,154 12,826
426X2 50 144,232 132,154 12,07840 143,504 132,154 11,35130 142,773 132,154 10,61920 142,040 132,154 9,88710 141,326 132,154 9,173
90 155,191 148,087 7,10480 154,747 148,087 6,66070 154,302 148,087 6,21560 153,877 148,087 5,790
492X1 50 153,435 148,087 5,34840 153,009 148,087 4,92230 152,550 148,087 4,46420 152,105 148,087 4,01910 151,682 148,087 3,595
40

TABLE A-6. SIMULATION RESULTS FOR A5-YEAR PROJECTION: YEAR 1
3 5 7 9 Total
122X0Manning Goals 120 720 385 50 1,275Initial Inventory 121 720 386 46 1,273Separations 10 87 26 8 131Upgrades 0 111 37 12 159Accessions 133 0 0 0 133Forced Outs 0 0 0 0 0Shortage (Overage) 13 -13 0 0 0Ending Inventory 133 707 385 50 1,275
272X0Manning Goals 250 1,220 1,105 175 2,750Initial Inventory 249 1,218 1,105 173 2,745Separations 17 141 75 31 264Upgrades 0 232 108 33 373Accessions 269 0 0 0 269Forced Outs 0 0 0 0 0Shortage (Overage) 19 -19 0 0 0Ending Inventory 269 1,201 1,105 175 2,750
426X2Manning Goals 490 1,840 950 125 3,405Initial Inventory 488 1,842 947 127 3,404Separations 38 225 58 27 348Upgrades 0 310 86 25 421Accessions 349 0 0 0 349Forced Outs 0 0 0 0 0Shortage (Overage) 0 0 0 0 0Ending Inventory 490 1,840 950 125 3,405
492X1Manning Goals 145 580 340 35 1,100Initial Inventory 145 579 340 34 1,098Separations 11 51 17 5 83Upgrades 0 74 23 6 102Accessions 85 0 0 0 85Forced Outs 0 0 0 0 0Shortage (Overage) 0 0 0 0 0Ending Inventory 145 580 340 35 1,100
41*U.&. Ie ]T IREINTInw OFF1IE 1gg2O. 4-Om/6OOS