I L Z I A T U T I E O R N A C N H D T L E A X E P H E N D ... · SDR, malignant neoplasms, all...
27
Indicator Serbia European Region EU 13 DEMOGRAPHIC AND SOCIO-ECONOMIC INDICATO.. Mid-year populaon % of populaon aged 0–14 years Percentage of populaon aged 65 years and over Total ferlity rate Percentage of urban populaon Unemployment rate (%) Real gross domesc product, PPP$ per capita Government expenditure as percentage of GDP MORTALITY-BASED INDICATORS Life expectancy at birth (years) Reducon of life expectancy through death before 65 years Infant deaths per 1000 live births Probability of dying before age 5 per 1000 live births Maternal deaths per 100 000 live births SDR all causes, all ages, per 100 000 SDR, all causes, 0–64, per 100 000 SDR, all causes, 65+, per 100 000 HEALTH CARE UTILIZATION AND EXPENDITURE Total health expenditure as % of GDP, WHO esmates Total health expenditure, PPP$ per capita, WHO esmates Public expenditure on health, PPP$ per capita, WHO esmates Public-sector expenditure on health as % of GDP, WHO esmates Public-sector health expenditure as % of total health expenditure, WHO esmates Public-sector expenditure on health as % of total government expenditure, WHO esmates Private households' out-of-pocket payments on health as % of total health expenditure Private households' out-of-pocket payments on health as % of private-sector health expenditure 42 20,750 11 63 1 15 15 107,341,040 42 25,923 9 70 2 15 17 898,525,440 47 11,731 24 56 1 17 15 7,258,753 4,968 310 818 9 7 6 6 76 4,424 317 794 11 9 7 6 77 6,073 307 930 15 7 6 6 75 84 23 12 72 5 1,023 1,417 7 75 24 13 69 6 1,702 2,301 8 96 36 14 62 6 732 1,183 10 Country health profile of Serbia
Transcript of I L Z I A T U T I E O R N A C N H D T L E A X E P H E N D ... · SDR, malignant neoplasms, all...

Indicator Serbia European Region EU 13
DEM
OG
RAPH
IC A
ND
SO
CIO
-ECO
NO
MIC
IND
ICAT
O..
Mid-year popula on
% of popula on aged 0–14 years
Percentage of popula on aged 65 years and over
Total fer lity rate
Percentage of urban popula on
Unemployment rate (%)
Real gross domes c product, PPP$ per capita
Government expenditure as percentage of GDP
MO
RTAL
ITY-
BASE
D IN
DIC
ATO
RS
Life expectancy at birth (years)
Reduc on of life expectancy through death before 65 years
Infant deaths per 1000 live births
Probability of dying before age 5 per 1000 live births
Maternal deaths per 100 000 live births
SDR all causes, all ages, per 100 000
SDR, all causes, 0–64, per 100 000
SDR, all causes, 65+, per 100 000
HEA
LTH
CAR
E U
TILI
ZATI
ON
AN
D E
XPEN
DIT
URE Total health expenditure as % of GDP, WHO es mates
Total health expenditure, PPP$ per capita, WHO es mates
Public expenditure on health, PPP$ per capita, WHO es mates
Public-sector expenditure on health as % of GDP, WHO es mates
Public-sector health expenditure as % of total health expenditure, WHO es mates
Public-sector expenditure on health as % of total government expenditure, WHO es mates
Private households' out-of-pocket payments on health as % of total health expenditure
Private households' out-of-pocket payments on health as % of private-sector health expenditure
42
20,750
11
63
1
15
15
107,341,040
42
25,923
9
70
2
15
17
898,525,440
47
11,731
24
56
1
17
15
7,258,753
4,968
310
818
9
7
6
6
76
4,424
317
794
11
9
7
6
77
6,073
307
930
15
7
6
6
75
84
23
12
72
5
1,023
1,417
7
75
24
13
69
6
1,702
2,301
8
96
36
14
62
6
732
1,183
10
Country health profile of Serbia

Life expectancy trends
1986 1988 1990 1992 1994 1996 1998 2000 2002 2004 2006 2008 2010 2012
Life
exp
ect
an
cy a
t b
irth
(ye
ars
), m
ale
s
55
60
65
70
75
80
85
90
Life expectancy at birth, in years, male
1986 1988 1990 1992 1994 1996 1998 2000 2002 2004 2006 2008 2010
Life
exp
ect
an
cy a
t b
irth
(ye
ars
), f
em
ale
s
55
60
65
70
75
80
85
90
Life expectancy at birth, in years, female
1986 1988 1990 1992 1994 1996 1998 2000 2002 2004 2006 2008 2010
Life
exp
ect
an
cy a
t a
ge 6
5 (y
ea
rs),
fe
ma
les
10
12
14
16
18
20
22
24
Life expectancy at 65 years, in years, female
1986 1988 1990 1992 1994 1996 1998 2000 2002 2004 2006 2008 2010
Life
exp
ect
an
cy a
t a
ge 6
5 (y
ea
rs),
ma
les
10
12
14
16
18
20
22
24
Life expectancy at 65 years, in years, male
Country Serbia European Region EU 13

Sex Agegroup
Year
1990 2010 2030 2050
0% 2% 4% 6% 8%
Percentage of popula on
0% 2% 4% 6% 8%
Percentage of popula on
0% 2% 4% 6% 8%
Percentage of popula on
0% 2% 4% 6% 8%
Percentage of popula on
Female 80 +
75-79
70-74
65-69
60-64
55-59
50-54
45-49
40-44
35-39
30-34
25-29
20-24
15-19
10-14
5-9
1-4
0
Male 80 +
75-79
70-74
65-69
60-64
55-59
50-54
45-49
40-44
35-39
30-34
25-29
20-24
15-19
10-14
5-9
1-4
0
Age and sex popula on distribu on trends
Sex Female Male
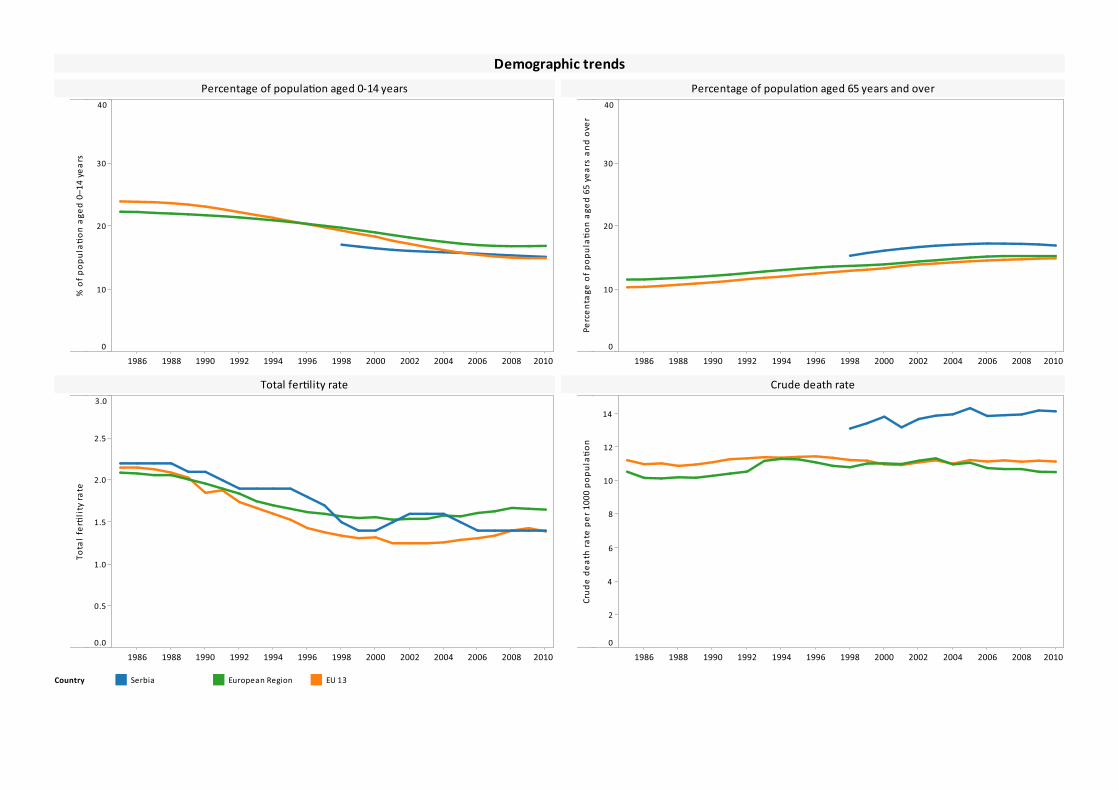
Demographic trends
1986 1988 1990 1992 1994 1996 1998 2000 2002 2004 2006 2008 2010
Tota
l fe
rli
ty r
ate
0.0
0.5
1.0
1.5
2.0
2.5
3.0
Total fer lity rate
1986 1988 1990 1992 1994 1996 1998 2000 2002 2004 2006 2008 2010
% o
f p
op
ula
on
age
d 0
–14
yea
rs
0
10
20
30
40
Percentage of popula on aged 0-14 years
1986 1988 1990 1992 1994 1996 1998 2000 2002 2004 2006 2008 2010
Perc
en
tage
of
po
pu
lao
n a
ged
65
yea
rs a
nd
ove
r
0
10
20
30
40
Percentage of popula on aged 65 years and over
1986 1988 1990 1992 1994 1996 1998 2000 2002 2004 2006 2008 2010
Cru
de
de
ath
ra
te p
er
1000
po
pu
lao
n
0
2
4
6
8
10
12
14
Crude death rate
Country Serbia European Region EU 13

Infant and maternal mortality
1986 1988 1990 1992 1994 1996 1998 2000 2002 2004 2006 2008 2010 2012
Infa
nt
de
ath
s p
er
1000
liv
e b
irth
s
0
5
10
15
20
25
30
35
40
45
50
55
60
Infant deaths per 1000 live births
1986 1988 1990 1992 1994 1996 1998 2000 2002 2004 2006 2008 2010 2012
Ma
tern
al
de
ath
s p
er
100
000
live
bir
ths
0
5
10
15
20
25
30
35
40
45
50
55
60
Maternal deaths per 100000 live births
Country
Serbia European Region EU 13

Overall and premature mortality from broad groups of causes of death, 2010-2012
Indicator
0 50 100 150 200 250 300 350 400 450 500 550 600 650 700
SDR, di s e a s e s of ci rcul a torys ys te m, a l l a ge s , pe r 100 000
SDR, ma l i gna nt ne opl a s ms , a l la ge s , pe r 100 000
SDR, di s e a s e s of re s pi ra torys ys te m, a l l a ge s , pe r 100 000
SDR, di s e a s e s of di ge s ves ys te m, a l l a ge s , pe r 100 000
SDR, e xte rna l ca us e s of i njury a ndpoi s oni ng, a l l a ge s , pe r 100 000, ..
SDR, i nfe c ous a nd pa ra s i cdi s e a s e s , a l l a ge s , pe r 100 000
SDR, all ages, per 100000, by broad groups of causes of death
Indicator
0 50 100 150 200 250 300 350 400 450 500 550 600 650 700
SDR, di s e a s e s of ci rcul a torys ys te m, 0–64, pe r 100 000
SDR, ma l i gna nt ne opl a s ms , 0–64,pe r 100 000
SDR, di s e a s e s of re s pi ra torys ys te m, 0–64, pe r 100 000
SDR, di s e a s e s of di ge s ves ys te m, 0–64, pe r 100 000
SDR, e xte rna l ca us e s of i njury a ndpoi s oni ng, 0–64, pe r 100 000
SDR, i nfe c ous a nd pa ra s i cdi s e a s e s , 0–64, pe r 100 000
SDR, 0-64 years, per 100000, by broad groups of causes of death
Country Serbia European Region EU 13

Mortality trends from broad groups of causes of death
1986 1988 1990 1992 1994 1996 1998 2000 2002 2004 2006 2008 2010
SDR
, dis
ea
ses
of
circ
ula
tory
sys
tem
, all
age
s, p
er
100
000
0
100
200
300
400
500
600
700
SDR, diseases of the circulatory system, all ages per 100000
1986 1988 1990 1992 1994 1996 1998 2000 2002 2004 2006 2008 2010 2012
SDR
, ma
lign
an
t n
eo
pla
sms,
all
age
s, p
er
100
000
0
50
100
150
200
SDR, malignant neoplasms, all ages per 100000
1986 1988 1990 1992 1994 1996 1998 2000 2002 2004 2006 2008 2010 2012
SDR
, ext
ern
al
cau
ses
of
inju
ry a
nd
po
iso
nin
g, a
ll a
ges,
..
0
50
100
150
200
250
300
SDR, external cause injury and poison, all ages per 100000
1986 1988 1990 1992 1994 1996 1998 2000 2002 2004 2006 2008 2010
SDR
, dis
ea
ses
of
resp
ira
tory
sys
tem
, all
age
s, p
er
100
0..
0
50
100
150
200
SDR diseases of the respiratory system, all ages per 100000
Country Serbia European Region EU 13

Premature mortality trends from ischaemic heart disease and cerebrovascular disease, by sex
1986 1988 1990 1992 1994 1996 1998 2000 2002 2004 2006 2008 2010 2012
SDR
, isc
ha
em
ic h
ea
rt d
ise
ase
, 0–6
4, p
er
100
000,
ma
les
0
50
100
150
200
250
300
SDR, ischeamic heart disease, 0-64 years, per 100000,male
1986 1988 1990 1992 1994 1996 1998 2000 2002 2004 2006 2008 2010 2012
SDR
, isc
ha
em
ic h
ea
rt d
ise
ase
, 0–6
4, p
er
100
000,
fe
ma
les
0
50
100
150
200
250
300
SDR, ischeamic heart disease, 0-64 year, per 100000, female
1986 1988 1990 1992 1994 1996 1998 2000 2002 2004 2006 2008 2010 2012
SDR
, ce
reb
rova
scu
lar
dis
ea
ses,
0–6
4, p
er
100
000,
ma
les
0
20
40
60
80
100
120
140
SDR, cerebrovascular disease, 0-64 years, per 100000, male
1986 1988 1990 1992 1994 1996 1998 2000 2002 2004 2006 2008 2010 2012
SDR
, ce
reb
rova
scu
lar
dis
ea
ses,
0–6
4, p
er
100
000,
fem
ale
0
20
40
60
80
100
120
140
SDR, cerebrovascular disease, 0-64 years, per 100000, female
Country Serbia European Region EU 13

Lung cancer premature mortality trends, by sex
1986 1988 1990 1992 1994 1996 1998 2000 2002 2004 2006 2008 2010 2012
SDR
, tra
che
a/b
ron
chu
s/lu
ng
can
cer,
0–6
4, p
er
100
000
0
10
20
30
40
50
60
70
80
90
100
SDR, trachea/bronchus/lung cancer, 0-64 years, per 100000, male
1986 1988 1990 1992 1994 1996 1998 2000 2002 2004 2006 2008 2010 2012
SDR
, tra
che
a/b
ron
chu
s/lu
ng
can
cer,
0–6
4, p
er
100
000,
fe
ma
les
0
10
20
30
40
50
60
70
80
90
100
SDR, trachea/bronchus/lung cancer, 0-64 years, per 100000, female
Country
Serbia European Region EU 13

Fermale breast and cervical cancer premature mortality trends
1986 1988 1990 1992 1994 1996 1998 2000 2002 2004 2006 2008 2010 2012
SDR
, ma
lign
an
t n
eo
pla
sm f
em
ale
bre
ast
, 0–6
4, p
er
100
000
0
2
4
6
8
10
12
14
16
18
20
22
24
26
28
30
SDR, malignant neoplasm female breast, 0-64 per 100000
1986 1988 1990 1992 1994 1996 1998 2000 2002 2004 2006 2008 2010 2012
SDR
, ca
nce
r o
f th
e c
erv
ix u
teri
, 0–6
4, p
er
100
000
0
2
4
6
8
10
12
14
16
18
20
22
24
26
28
30
SDR, cancer of the cervix, 0-64 per 100000
Country Serbia European Region EU 13

Motor vehicle mortality trends, by sex
1986 1988 1990 1992 1994 1996 1998 2000 2002 2004 2006 2008 2010 2012
SDR
, mo
tor
veh
icle
tra
ffic
acc
ide
nts
, all
age
s, p
er
100
000,
ma
les
0
5
10
15
20
25
30
35
40
45
SDR, motor vehicle accidents, all ages, per 100000, male
1986 1988 1990 1992 1994 1996 1998 2000 2002 2004 2006 2008 2010 2012
SDR
, mo
tor
veh
icle
tra
ffic
acc
ide
nts
, all
age
s, p
er
100
000,
fe
ma
les
0
5
10
15
20
25
30
35
40
45
SDR, motor vehicle accidents, all ages, per 100000, female
Country Serbia European Region EU 13

Suicide and homicide mortality trends, by sex
1986 1988 1990 1992 1994 1996 1998 2000 2002 2004 2006 2008 2010 2012
SDR
, su
icid
e a
nd
se
lf-i
nfli
cte
d i
nju
ry, a
ll a
ges,
pe
r 10
0 0.
.
0
20
40
60
80
SDR, suicide and self-inflicted injury, all ages, per 100000, male
1986 1988 1990 1992 1994 1996 1998 2000 2002 2004 2006 2008 2010 2012
SDR
, su
icid
e a
nd
se
lf-i
nfli
cte
d i
nju
ry, a
ll a
ges,
pe
r 10
0 0.
.
0
20
40
60
80
SDR, suicide and self-inflicted injury,all ages per 100000, female
1986 1988 1990 1992 1994 1996 1998 2000 2002 2004 2006 2008 2010 2012
SDR
, ho
mic
ide
an
d i
nte
no
na
l in
jury
, 0–6
4, p
er
100
000,
..
0
10
20
30
40
50
60
SDR, homicide and inten onal injury, all ages, per 100000 female
1986 1988 1990 1992 1994 1996 1998 2000 2002 2004 2006 2008 2010 2012
SDR
, ho
mic
ide
an
d i
nte
no
na
l in
jury
, all
age
s, p
er
100
0..
0
10
20
30
40
50
60
SDR, homicide and inten onal injury,all ages, per 100000,male
Country Serbia European Region EU 13

Respiratory diseases premature mortality trends, by sex
1986 1988 1990 1992 1994 1996 1998 2000 2002 2004 2006 2008 2010 2012
SDR
, bro
nch
is/
em
ph
yse
ma
/ast
hm
a, 0
–64,
pe
r 10
0 00
0, ..
0
5
10
15
20
25
30
SDR, bronchi s/emphysema/asthma, 0-64 per 100000, male
1986 1988 1990 1992 1994 1996 1998 2000 2002 2004 2006 2008 2010 2012
SDR
, bro
nch
is/
em
ph
yse
ma
/ast
hm
a, 0
–64,
pe
r 10
0 00
0, ..
0
5
10
15
20
25
30
SDR, bronchi s/emphysema/asthma, 0-64 per 100000, female
1986 1988 1990 1992 1994 1996 1998 2000 2002 2004 2006 2008 2010 2012
SDR
, dis
ea
ses
of
resp
ira
tory
sys
tem
, 0–6
4, p
er
100
000,
..
0
20
40
60
80
SDR, diseases of the respiratory system, 0-64 per 100000, male
1986 1988 1990 1992 1994 1996 1998 2000 2002 2004 2006 2008 2010 2012
SDR
, dis
ea
ses
of
resp
ira
tory
sys
tem
, 0–6
4, p
er
100
000,
f..
0
20
40
60
80
SDR, diseases of the respiratory system, 0-64 per 100000, female
Country Serbia European Region EU 13

Diseases of the diges ve system and chronic liver disease premature mortality trends, by sex
1986 1988 1990 1992 1994 1996 1998 2000 2002 2004 2006 2008 2010 2012
SDR
, dis
ea
ses
of
dig
es
ve s
yste
m, 0
–64,
pe
r 10
0 00
0, m
ale
s
0
10
20
30
40
50
60
70
80
SDR, diseases of the diges ve system, 0-64years, per 100000, male
1986 1988 1990 1992 1994 1996 1998 2000 2002 2004 2006 2008 2010 2012
SDR
, dis
ea
ses
of
dig
es
ve s
yste
m, 0
–64,
pe
r 10
0 00
0, f
em
a..
0
10
20
30
40
50
60
70
80
SDR, diseases of the diges ve system, 0-64 years, per 100000, female
1986 1988 1990 1992 1994 1996 1998 2000 2002 2004 2006 2008 2010 2012
SDR
, ch
ron
ic l
ive
r d
ise
ase
an
d c
irrh
osi
s, 0
–64,
pe
r 10
0 00
0,..
0
10
20
30
40
50
60
SDR, chronic liver disease and cirrohsis, 0-64 years, per 100000, male
1986 1988 1990 1992 1994 1996 1998 2000 2002 2004 2006 2008 2010 2012
SDR
, ch
ron
ic l
ive
r d
ise
ase
an
d c
irrh
osi
s, 0
–64,
pe
r 10
0 00
0,..
0
10
20
30
40
50
60
SDR, chronic liver disease and cirrhosis, 0-64 years, per 100000, female
Country Serbia European Region EU 13

Infec ous diseases mortality and incidence trends
Inci de nce of tube rcul os i s pe r 100 000
1986 1988 1990 1992 1994 1996 1998 2000 2002 2004 2006 2008 2010 2012
0
10
20
30
40
50
Tuberculosis incidence, per 100000
1986 1988 1990 1992 1994 1996 1998 2000 2002 2004 2006 2008 2010 2012
SDR
, in
fec
ou
s a
nd
pa
rasi
c d
ise
ase
s, a
ll a
ges,
pe
r 10
0..
0
10
20
30
40
SDR, infec ous and parasi c disease, all ages per 100000
Inci de nce of AIDS pe r 100 000 Inci de nce of HIV pe r 100 000
1986 1988 1990 1992 1994 1996 1998 2000 2002 2004 2006 2008 2010 2012 1986 1988 1990 1992 1994 1996 1998 2000 2002 2004 2006 2008 2010 2012
0
5
10
15
AIDS and HIV incidence, per 100000
Country Serbia European Region EU 13
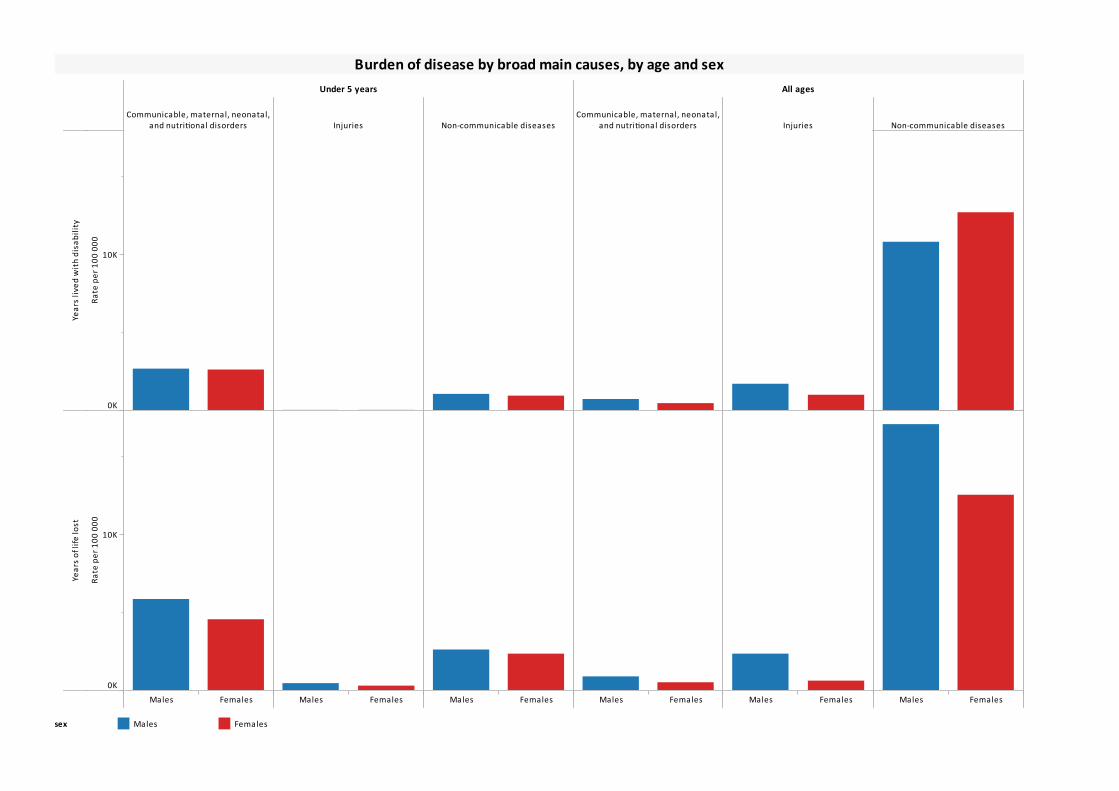
Burden of disease by broad main causes, by age and sex
Under 5 years
Communicable, maternal, neonatal,and nutri onal disorders Injuries Non-communicable diseases
All ages
Communicable, maternal, neonatal,and nutri onal disorders Injuries Non-communicable diseases
Males Females Males Females Males Females Males Females Males Females Males Females
Year
s liv
ed w
ith
disa
bilit
y Ye
ars
of li
fe lo
st
0K
10K
Rate
per
100
000
0K
10K
Rate
per
100
000
sex Males Females

Leading causes of burden of disease, by sex
cause_name
DALYs
1990 2010
Years lived with disability
1990 2010
Years of life lost
1990 2010
Deaths
1990 2010
Cerebrovascular diseaseIschemic heart diseaseMajor depressive disorderDiabetes mellitusTransport injuriesChronic obstruc ve pulmonary diseaseFallsTrachea, bronchus, and lung cancersColon and rectum cancersSelf-harmCongenital anomaliesIron-deficiency anemiaLower respiratory infec onsStomach cancerCardiomyopathy and myocardi sHIV/AIDSCirrhosis of the liverInterpersonal violenceDrowningTuberculosisTotal (All Causes) 20,738
2430707691
102111125129218224270337435449477674
1,0521,5141,674
25,6253766
1098754
118198423133635338277306465502617699
1,5651,8702,377
11,97410
515
3451
20126
38783
406310281430
1,052130
38
12,90211
615
3362
22127
41683
426322241397
1,565136
38
8,765142555748798
110105
3180218262334
29139196245
01,3841,637
12,7232660948451
112196400
7594332269304
39181376302
01,7342,339
44711132554036
1213
294
140
100119
55211231589089
1212
212
715
0118155
Age-adjusted rates , per 100 000, Females
cause_name
DALYs
1990 2010
Years lived with disability
1990 2010
Years of life lost
1990 2010
Deaths
1990 2010
Ischemic heart diseaseCerebrovascular diseaseTransport injuries
Trachea, bronchus, and lung cancersSelf-harmDiabetes mellitusChronic obstruc ve pulmonary diseaseFallsMajor depressive disorderColon and rectum cancers
Iron-deficiency anemiaCirrhosis of the liverHIV/AIDSInterpersonal violenceStomach cancerCongenital anomaliesCardiomyopathy and myocardi s
Lower respiratory infec onsDrowningTuberculosisTotal (All Causes) 27,389
83148209
213231231243274313343
457634696734775808
1,2251,3472,1783,011
33,668132270606
209756410347193365346
398947610843749
1,013
1,5431,5773,1383,823
11,710271024
838
36115
7341
15634596363441
13
11549
55174
11,98729
922
939
55315
7340
11947503372417
12
13466
47173
15,68056
138185
205193228181259306
3
4420
100371334795
1,215798
2,1232,836
21,681103261583
200717405294178358
6
3860
107471332
1,001
1,5301,1113,0903,650
720237
93
1045
110
2204
251721
5117
144167
87545
14
89
1864
120
1804
301525
6122
194202
Age-adjusted rates , per 100 000, Males

Alcohol consump on and tobacco use trends and pa erns
1986 1988 1990 1992 1994 1996 1998 2000 2002 2004 2006 2008 2010
Alc
oh
ol
con
sum
po
n, l
itre
s, 1
5 ye
ars
an
d o
ver
0
5
10
15
20
25
Pure alcohol consump on, litres per capita, age 15 years and over
0 5 10 15 20 25 30 35 40 45
Average price of 750ml of locally produced spirits, in US$, 2008
0
10
20
30
40
Perc
enta
ge o
f he
avy
wee
kly
drin
kers
Netherlands
Croa a
Czech Republic
Estonia Finland
France
Hungary
Iceland
Ireland
Israel
Italy
Latvia
NorwaySwitzerland
Percentage of heavy weekly drinkers and average price of locally produced spirits
Country Serbia European Region EU 13
1992 1993 1994 1995 1996 1997 1998 1999 2000 2001 2002 2003 2004 2005 2006 2007 2008 2009 2010 2011 2012
Perc
en
tage
of
regu
lar
smo
kers
15
yea
rs a
nd
ove
r
0
10
20
30
40
50
Percentage of regular daily smokers in the popula on, age 15 and over
1 2 3 4 5 6 7 8 9 10 11 12
Price of a 20 cigarrete pack in US$ in 2008
0
10
20
30
Perc
enta
ge o
f reg
ular
dai
ly s
mok
ers
15 y
ears
and
ove
r
PortugalKazakhstan
Israel
Denmark
Cyprus
Czech Republic
Estonia France
Germany
GreeceHungary
Ireland
Italy
Kyrgyzstan
Latvia
Luxembourg
MaltaNorway
Poland
Slovakia
Spain
Sweden
Turkey
Turkmenistan
Percentage of regular daily smokers aged 15 years and over and price of a 20 cigare e pack
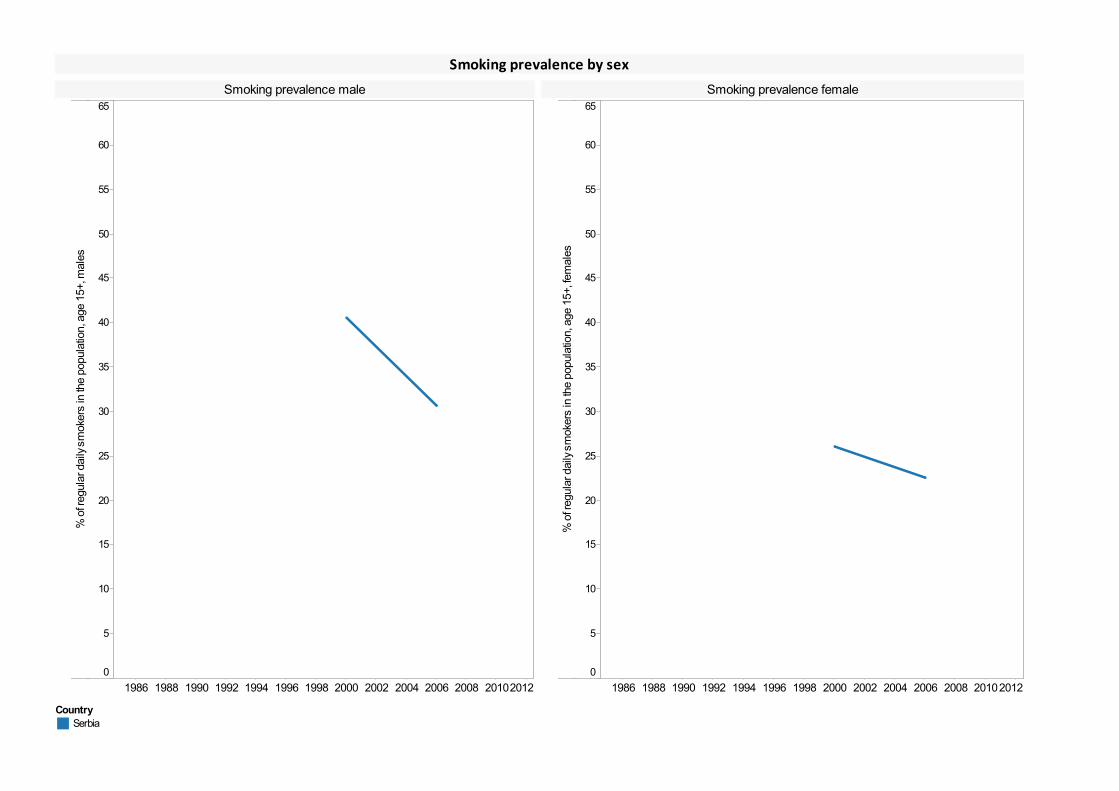
Smoking prevalence by sex
1986 1988 1990 1992 1994 1996 1998 2000 2002 2004 2006 2008 20102012
% o
f reg
ular
dai
ly sm
oker
s in
the
popu
latio
n, a
ge 1
5+, m
ales
0
5
10
15
20
25
30
35
40
45
50
55
60
65Smoking prevalence male
1986 1988 1990 1992 1994 1996 1998 2000 2002 2004 2006 2008 20102012
% o
f reg
ular
dai
ly sm
oker
s in
the
popu
latio
n, a
ge 1
5+, f
emal
es
0
5
10
15
20
25
30
35
40
45
50
55
60
65Smoking prevalence female
CountrySerbia

Socioeconomic trends
1990 1991 1992 1993 1994 1995 1996 1997 1998 1999 2000 2001 2002 2003 2004 2005 2006 2007 2008 2009 2010 2011 2012
Un
em
plo
yme
nt
rate
(%
)
0
5
10
15
20
25
Valu
e
Unemployment trends
1990 1991 1992 1993 1994 1995 1996 1997 1998 1999 2000 2001 2002 2003 2004 2005 2006 2007 2008 2009 2010 2011 2012
Gro
ss d
om
es
c p
rod
uct
(G
DP)
, US$
pe
r ca
pit
a
0K
5K
10K
15K
20K
25K
Valu
eGross domes c product per capita trends
Country
Serbia European Region EU 13
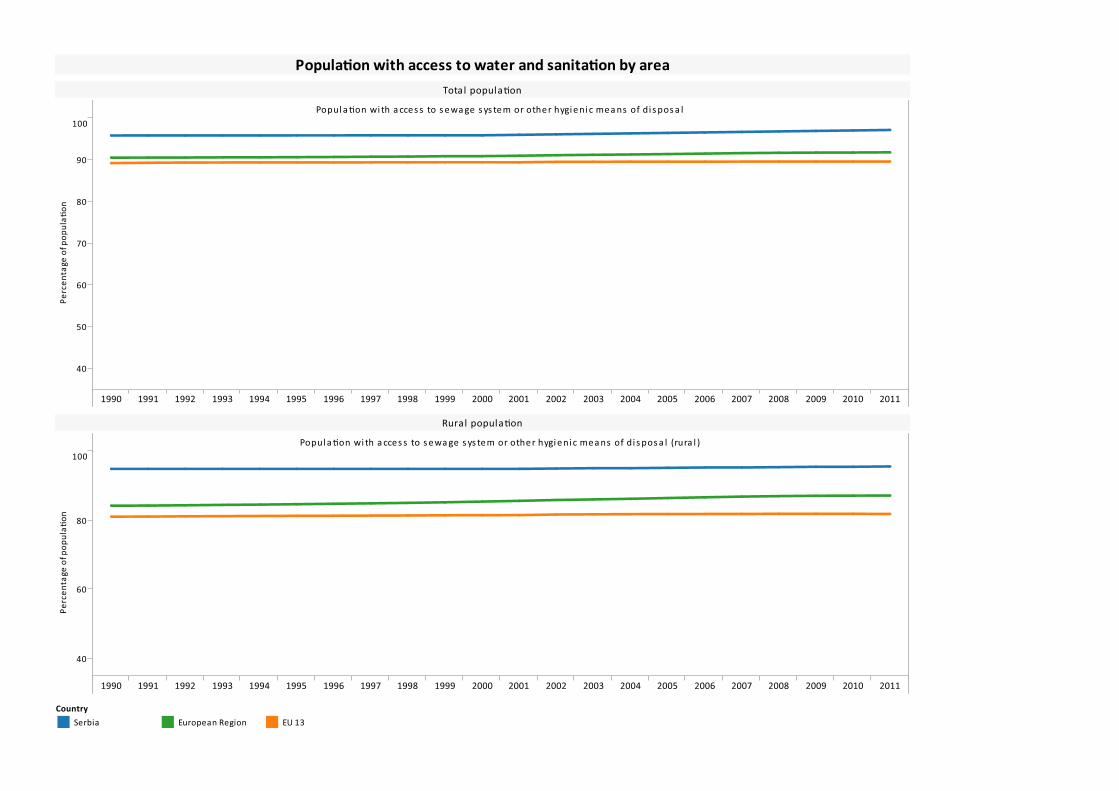
Popula on with access to water and sanita on by area
Popul a on wi th a cce s s to s e wa ge s ys te m or othe r hygi e ni c me a ns of di s pos a l
1990 1991 1992 1993 1994 1995 1996 1997 1998 1999 2000 2001 2002 2003 2004 2005 2006 2007 2008 2009 2010 2011
40
50
60
70
80
90
100
Perc
enta
ge o
f pop
ula
on
Total popula on
Popul a on wi th a cce s s to s e wa ge s ys te m or othe r hygi e ni c me a ns of di s pos a l (rura l )
1990 1991 1992 1993 1994 1995 1996 1997 1998 1999 2000 2001 2002 2003 2004 2005 2006 2007 2008 2009 2010 2011
40
60
80
100
Perc
enta
ge o
f pop
ula
on
Rural popula on
Country
Serbia European Region EU 13

Human resources for health trends by type
1986 1988 1990 1992 1994 1996 1998 2000 2002 2004 2006 2008 2010 2012
Nu
rse
s (P
P) p
er
100
000
0
100
200
300
400
500
600
700
800
Number of nurses per 100000
1986 1988 1990 1992 1994 1996 1998 2000 2002 2004 2006 2008 2010 2012
Phys
icia
ns
pe
r 10
0 00
0
0
100
200
300
400
500
600
700
800
900
1000
1100
1200
1300
Number of physicans per 100000
Country Serbia European Region EU 13

Health care ac vi es
1985 1986 1987 1988 1989 1990 1991 1992 1993 1994 1995 1996 1997 1998 1999 2000 2001 2002 2003 2004 2005 2006 2007 2008 2009 2010 2011 2012
Ou
tpa
en
t co
nta
cts
pe
r p
ers
on
pe
r ye
ar
0
2
4
6
8
Outpa ent contacts per person per year
1985 1986 1987 1988 1989 1990 1991 1992 1993 1994 1995 1996 1997 1998 1999 2000 2001 2002 2003 2004 2005 2006 2007 2008 2009 2010 2011 2012
Acu
te c
are
ho
spit
al
dis
cha
rge
s p
er
100
0
5
10
15
20
Acute care hospital discharges
Country Serbia European Region EU 13

Ave ra ge l e ngth of s ta y, a l l hos pi ta l s Ave ra ge l e ngth of s ta y, a cute ca re hos pi ta l s onl y
1986 1988 1990 1992 1994 1996 1998 2000 2002 2004 2006 2008 2010 2012 1986 1988 1990 1992 1994 1996 1998 2000 2002 2004 2006 2008 2010 2012
0
1
2
3
4
5
6
7
8
9
10
11
12
13
14
15
16
Aver
age
leng
th o
f sta
y (in
day
s)Average length of stay in hospitaliza ons
Country Serbia European Region EU 13

Surgical health care
1997 1998 1999 2000 2001 2002 2003 2004 2005 2006 2007 2008 2009 2010
Inp
ae
nt
surg
ica
l p
roce
du
res
pe
r ye
ar
pe
r 10
0 00
0
0K
2K
4K
6K
8K
Inpa ent surgical procedures
1995 1996 1997 1998 1999 2000 2001 2002 2003 2004 2005 2006 2007 2008 2009 2010 2011
Cae
sare
an
se
co
ns
pe
r 10
00 l
ive
bir
ths
0
50
100
150
200
250
Caesarean sec ons
Country European Region EU 13

Pe rce nta ge of chi l dre n va cci na te d a ga i ns t me a s l e s Pe rce nta ge of i nfa nts va cci na te d a ga i ns t pol i omye l i s
1986 1988 1990 1992 1994 1996 1998 2000 2002 2004 2006 2008 2010 1986 1988 1990 1992 1994 1996 1998 2000 2002 2004 2006 2008 2010
50
55
60
65
70
75
80
85
90
95
100
Perc
enta
ge o
f chi
ldre
n va
ccin
ated
Immuniza on rates trends among children
Country
Serbia European Region EU 13

Health and related expenditures trends
1995 1996 1997 1998 1999 2000 2001 2002 2003 2004 2005 2006 2007 2008 2009 2010 2011 2012
Go
vern
me
nt
exp
en
dit
ure
as
pe
rce
nta
ge o
f G
DP
0
10
20
30
40
50
Total government expenditure as percentage of the gross domes c product
1995 1996 1997 1998 1999 2000 2001 2002 2003 2004 2005 2006 2007 2008 2009 2010 2011 2012
Tota
l h
ea
lth
exp
en
dit
ure
as
% o
f G
DP,
WH
O e
sm
ate
s
0
2
4
6
8
10
Total health expenditure as percentage of the gross domes c product
1995 1996 1997 1998 1999 2000 2001 2002 2003 2004 2005 2006 2007 2008 2009 2010 2011 2012
Priv
ate
ho
use
ho
lds'
ou
t-o
f-p
ock
et
pa
yme
nts
on
he
alt
..
0
10
20
30
Private households out-of-pocket payment on health as percentage of total health expenditure
1995 1996 1997 1998 1999 2000 2001 2002 2003 2004 2005 2006 2007 2008 2009 2010 2011 2012
Pub
lic-
sect
or
exp
en
dit
ure
on
he
alt
h a
s %
of
tota
l go
v..
0
5
10
Public sector expenditure on health as percentage of total government expenditure
Country Serbia European Region EU 13