I GLOBALISATION AND FISH UTILISATION AND MARKETING STUDYaquaticcommons.org/20307/1/glob 6...
21
·.....' I . WORKSHOP REPORT / GLOBALISATION AND FISH UTILISATION AND MARKETING STUDY WINDSOR LAKE VICTORIA HOTEL, ENTEBBE: 21 sT FEBRUARY 2003 FISHERIES RESOURCES RESEARCH INSTITUTE Jinja, Uganda
Transcript of I GLOBALISATION AND FISH UTILISATION AND MARKETING STUDYaquaticcommons.org/20307/1/glob 6...

·.....'
I.
WORKSHOP REPORT
/
GLOBALISATION AND FISH UTILISATION ANDMARKETING STUDY
WINDSOR LAKE VICTORIA HOTEL, ENTEBBE: 21 sT FEBRUARY 2003
FISHERIES RESOURCES RESEARCH INSTITUTE
Jinja, Uganda

Workshop Managers
Convenor - Konstantine Odongkara
Presenters:
Alan Marriott
Konstantine Odongkara
Richard Oginga Abila
Boaz Blackie Kezire
Officials
Jonah Wegoye
Mercy Kyangwa
Anne Nyapendi
Richard Jawoko
Rapportuer
Rapportuer
Secretarial
Transport
T:1:r:-~~
- I ,.::...
CONTACT ADDRESS
Fisheries Resources Research Institute
National Agricultural Research Organisation
P.O. Box 343, JINJA Uganda
Fax: 256-43-120192
Tel. 256-43-120484
e-mail: [email protected]
1

ANNEX 5: Perspectives of Impacts of International Fish Trade in Kenya
I Dr. Richard O. Abila
Kenya Marine & Fisheries Research Institute
I Background to global fish trade
I There has been tremendous growth in international trade on fish and fisheries products in the last four decades. In 1970 the value of internationally traded fish
I was estimated at 3 billion; this increased to US$ 15 billion in 1980, US$ 36 billion in 1990 and US$ 55 billion in 2000 (Ahmed, 2003). Recent statistics show that fish trade has surpassed other agricultural commodities that have
I traditionally been traded internationally such as coffee, tea, cocoa, sugar, cereals, meat, oils and milk. In 2000, fish contributed 22% of the value of all agricultural exports , making it the highest internationally traded food product (Ahmed, 2003). In another perspective, nearly 40% of the world's fish is now sold in the international market.
I I The flow of fish in the international market is highly lopsided. About 50% of fish
exports come from the developing world , of which 20% are from low-income food deficient countries. Most of this fish, however, is consumed by the developed countries, which account for nearly 80% of all imported fish. The EU, USA and Japan are the major importers, accounting for over 77% of global fish imports.
I Thus, while developing countries playa big role in fish production , they consume very little of it, instead preferring to sell for the hard currency.
I In some fish exporting countries , especially those in Asia, there is some link between fish exports and imports of substitute and complementary foods. Much of the increased earning from fish exports in those countries is explained by a
I corresponding rise in expenditure on imported foods. This is not the case in many of the fish exporter nations in Africa. In their case , fish exports generate foreign exchange that they use to meet other socio-political objectives; hardly is it
I aimed at solving the wider food needs . Therefore, one of the most immediate concerns of international fish trade is its impact on food security in the poor exporter nations .
I For most countries , the contribution of fish to overall food security is not large. However, in parts of Africa where vast numbers of people are food insecure, fish
I is a significant part of the culturally accepted diet. Fish can therefore make a significant contribution to alleviate malnutrition and enhance food security directly. The activity of fishing and the related activities of processing and
I distribution also generate considerable employment and income in developing countries. If fish trade results in raising the employment and income it can further contribute indirectly to food security of the people involved.
35

The dual objectives of fish as food and as a trade commodity seem a contradiction, chiefly because many countries exporting it are among the most deficient in protein. It is, therefore, quite understandable that international fish trade has generated quite some debate regarding its impacts. Specifically, to what extent do fishery product exports or imports contribute to enhancing or reducing food security , either directly (as food) or indirectly (as source of employment and income) or both? The focus should then be on how to minimise the negative effects and enhance the benefits of international trade.
Policy in,centives for globalisation of fish trade in Kenya
Kenya officially adopted the structural adjustment programs (SAPs) in the mid1980s, which put great emphasis on trade liberalisation. The strategies for trade liberalization policy were presented in Sessional Paper No. 1 of 1986, on economic management for renewed growth (Kenya Government, 1986). The strategies encouraged moving towards a more outward looking trade regime , strengthening and increasing overseas market access for Kenyan products and supporting further integration into the world economy.
SAPs also dwelt on a number of other areas, including; Liberalization of prices and marketing systems, financial sector policy reform, international trade regulation reforms, government budget rationalization, divestiture of government from commercial activity, parastatal reform and reform of the civil service. In Kenya, among the specific items instituted as part of SAPs in early and mid 1990s were price decontrols, foreign exchange liberalisation, decontrol of domestic marketing of agricultural commodities, removal or reduction of international trade barriers, decontrol of interest rates and decontrol of foreign exchange rates (Kenya government, 1993). These indicate that, even though SAPs were aimed at much wider economic reforms, they were most successful in supporting trade liberalization goals.
In the Lake Victoria fisheries, the liberalized trade conditions provided the right incentives for investments in the industrial fish processing and the internationalization of fish trade. For example, the lack of price controls and other limitations ensured that the fish business remained lucrative, attracting new investors to establish fish factories all around the lake with strong links to the global market. Like other businesses geared towards exports, the fish processing industry readily acquired low-interest loans provided by local or international banks for constructing and equipping fish factories. Under the export promotion scheme (intended to support enterprises that had potential to earn substantial foreign exchange), some factories also benefited from low taxes or tax exemptions for a period of time, duty exemption on essential factory equipment (Bokea and Ikiara, 2000). Similar advantages were not extended to the other sub-sectors of the fisheries sector that were not directly exporting fish, such as the artisanal fish processors and traders.
36

---
I Kenya is still signatory or subject to a number of pacts regulating or supporting
I international fish trade. The EU Directive 911 493/EEC, which lays down the requirements for handling and placement into the market of fish and fish products, has the most far reaching implications on the fisheries sector. Other
I pacts relevant to the fisheries trade include some provisions of the World Trade Organization (WTO), the Lome Convention, the Cotonou Partnership Arrangement (CPA), and the EU Common Agricultural Policy (CAP). The
I General Agreements on Trade and Tariffs (GATT), formulated during the Uruguay Round of negotiations from1986 to 1993, formed the basis for the
I majority of trade agreements currently under the WTO. The Uruguay Round and the WTO agreements aimed to increase liberalization of trade so as to expand traded volumes, improve market access for goods originating from developing
I countries , and to bring in more of traded goods previously governed by separate protocols, under the discipline of multilateral trading system. The Lome
I Convention, and its successor, the Cotonou Agreement, also had important implications to Kenya 's fi sheries sector. This Convention provided for market
I access to former colonies of the EEC member states, which were spread across Africa, the Caribbean and Pacific states (ACP). The pact also included financial assistance to address supply-side constraints.
I I
Market access has also been enhanced through regional and bilateral trade negotiations within the African region as well as through multilateral trading arrangements such as in East African Community (EAC) and Common Market for Eastern and Southern Africa (COMESA). The EAC pact has reduced trade tariffs and other barriers between Kenya, Tanzania and Uganda, making it easier
I for Kenya to import fish from Tanzania and Uganda. It is under such international and regional agreements that Kenya was able to launch and sustain fish exports to EU from the late eighties to the nineties. None of the internationally set pacts addresses the needs of local consumers in the countries where fish originates.
I
I For much of the last decade it was taken for granted that international trade was automatically beneficial to the development of the Lake Victoria fishery. The common argument was that global trade had increased the overall value of the fishery and raised incomes of all players involved. However, such reasoning rarely considered the other angles to fish export trade, particularly the environmental, employment and food security impacts. In the last five years, more attention has focussed on these issues, revealing that the negative impacts of expanded trade could far outweigh the benefits (O'Riordan 1997; Jansen, 1997; Abila and Jansen, 1997; Abila, 2000; Bokea and Ikiara, 2000). This report makes further contribution to the debate on the impact of international trade of Lake Victoria fisheries on local livelihoods.
I Kenya's fisheries policy and food security
One of the declared policy goals of the Kenya Government is to improve the quality
I of life of its citizenry. It is well stated in government policy that nutrition objectives should be considered in development projects, and that priority be given to
I 37
I
I
-
l
collection and analysis of information on nutritional status of the population so that programs are designed to eliminate nutritional deficiencies. The Sessional Paper No.4 of 1981 on 'National Food Policy' stressed the role of government in attaining food security, by reducing problems relating to production, distribution and consumption (Kenya Government, 1994).
On paper, the Kenya Government has clearly spelt out the policy objectives for the fishery , giving sufficient attention to food security concerns. They include goals to achieve increased per capita fish consumption through the production of low cost protein food (fish). Second is to generate employment opportunities and incomes in fishing, fish processing and trading. The third is to enhance the living conditions of the fishermen and their families by mclximizing economic benefits to them (Kenya Government, 1995). A fourth, and somehow conflicting goal, is to maximize foreign exchange earnings from fish exports. If these stated objectives of the government were achieved in equal measure, the fishery would greatly contribute towards food security for local communities. However, in practice , much of the present effort of the Fisheries Department is geared towards the promotion of export trade. This is because the amount of foreign exchange earned is a more attractive indicator of performance, which the Fisheries Department would prefer to be judged upon. Additionally, the fish processing industry has become a very powerful player, contributing immensely to any new decisions and policies that support increased exports.
The fish supply situation in Kenya
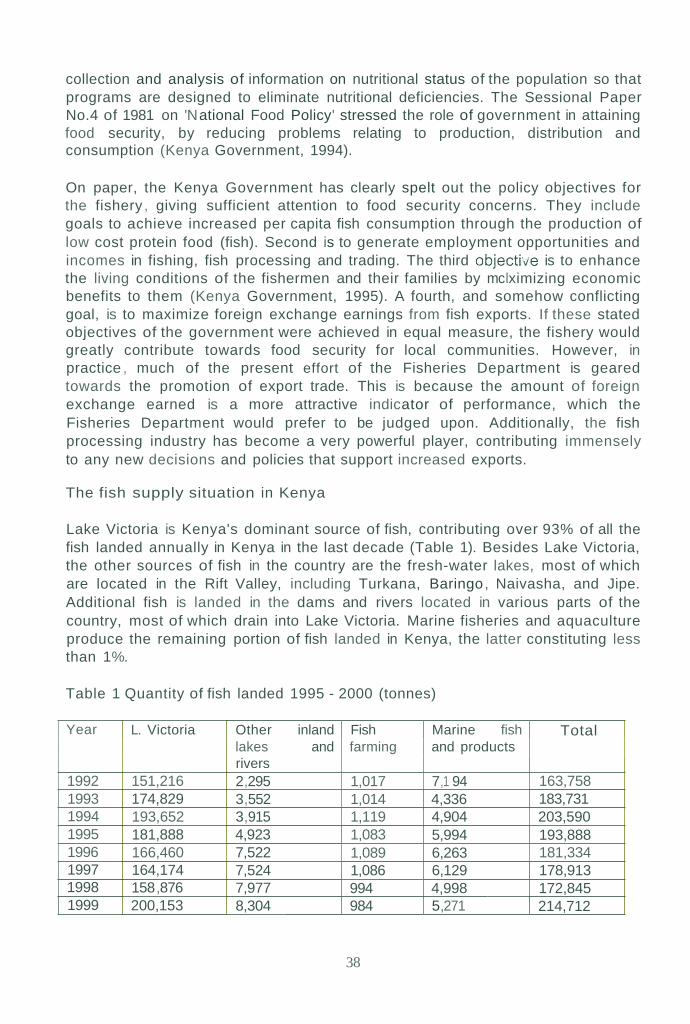
Lake Victoria is Kenya's dominant source of fish, contributing over 93% of all the fish landed annually in Kenya in the last decade (Table 1). Besides Lake Victoria, the other sources of fish in the country are the fresh-water lakes, most of which are located in the Rift Valley, including Turkana, Baringo, Naivasha, and Jipe. Additional fish is landed in the dams and rivers located in various parts of the country, most of which drain into Lake Victoria. Marine fisheries and aquaculture produce the remaining portion of fish landed in Kenya, the latter constituting less than 1%.
Table 1 Quantity of fish landed 1995 - 2000 (tonnes)
Year L. Victoria Other inland lakes and rivers
Fish farming
Marine fish and products
Total
1992 151,216 2,295 1,017 7,1 94 163,758 1993 174,829 3,552 1,014 4,336 183,731 1994 193,652 3,915 1,119 4,904 203,590 1995 181,888 4,923 1,083 5,994 193,888 1996 166,460 7,522 1,089 6,263 181,334 1997 164,174 7,524 1,086 6,129 178,913 1998 158,876 7,977 994 4,998 172,845 1999 200,153 8,304 984 5,271 214,712
38

Fig 1 Catch trends on Lake Victoria (1976 - 2001)
,'---+- Nile perch -s- Dagaa' --er-- Tilapia~ Others i
O-NM7V")\C!0. 0. c-. 0. 0. C\ 0'\0\ C;\ 0\ c-. C\ c-. 0.- - - -
~ ~ 00 ~ 0 - ~ M ~ ~ ~ ~~ ~ ~ ~ 00 00 00 ~ 00 00 00 00C\ ~ ~ 0. 0. C\ ~ 0. C\ 0. ~ ~- - - - - - - - ~ - - -
20000 1-....-_---':;.",
Sources: Fisheries Department statistics; Othina, 1999
;;-, c::
, 5 40000 1~~~~~4~ yL~-!T.~~~~~+~~~~::=:-:-~'i;;--';;;:l:!~~~~,.-ICI
The catch decline is one indicator of over-exploitation, and has been a cause ofconcern especially for Nile perch, whose catch has gradually decreased since1991 (only rising sharply in 1999 following the lifting of the ban on fish exports tothe EU, then falling off). The declining catches is largely attributed to the use ofsmall mesh nets, indiscriminate gears and mass-target fishing methods, whichhave been prevalent in Lake Victoria. In particular, there has been a gradualreduction in mean mesh sizes of gillnets used in the lake in the last decade(Othina and Osewe-Odera, 1996). The other tWo commonly applied stockassessment indicators - mean catch sizes and catch per unit effort - have alsogenerally declined in the past decade (Othina, 1999). The overexploitation ofLake Victoria fisheries has consequences for long-term food security to thosedependent on the fisheries. It is, therefore, imperative that efforts geared towardsdeveloping the fish exporting industry must address the causes andconsequences of over-exploitation in Lake Victoria.
I 2000 I 192,738 14,171 1_9_67__1_4--,-,7_6_3__---L-I2_0~2,~63_9__Source: Kenya Fisheries Department
I~
r:[:'
r-=,r-=
r:r.
III
Artisanal fish trading in Kenya
There are two parallel kinds of fish distribution channels in Kenya; the artisanaland export trade channels. The logistical arrangement in the artisanal sector isquite simple, with fishermen supplying fish to women or male traders at thelakeside, who then sell the fish in the nearby market or to second levelmiddlemen who transfer it to other rural market or to distant urban markets. The
39

mode of transport is also simple depending on the distant to the preferred market, with traders making use of either public passenger vehicles, bicycles or just walk.
Th is channel is supported by the traditional fish processing sub-sector, where some fish is either smoked or deep-fried before it goes to the market. Previously women who processed Nile perch and tilapia dominated this sub-sector, but these species are no longer available in sufficient quantities for processing . Most of the women have left the trade or just idle around and process the little fish they can get. Some of them have to processing Nile perch frames from fish factories , but this trade is also threatened by the fish meal industry. However, it is evident that the demand for fish has grown over the years , judging from the high prices in most urban and local markets .
Kenya's fish export industry
Nile perch is the dominant fish species in the export trade, accounting for about 90% in volume and value of Kenya 's total fish exports . The exported products of Nile perch include the fillet , whole body (gutted, headless), fish maws and Nile perch bladder. Other fish products exported from Kenya are mainly marine products , such as crustaceans (lobsters, prawns, crabs and fresh-water cray fish ), molluscs (octopus and squid), other marine fish and small quantities of live fi sh . In the early 1990s, a few firms attempted to export tilapia , but this fa iled to pick up due to the limited supplies of the fish in Kenya and high competition from low-cost tilapia producing countries. There are presently 18 fish processing and exporting firms in Kenya. Of these, ten special ise on processing and exporting Nile perch products while seven are marine-based. The latter include four shrimp processors, two firms exporting various crustaceans, such as octopus, squ ids and lobsters , and the remaining one processing tuna. The Nile perch factories all produce fillet , skin on , headless and gutted products.
Stud ies conducted by Abila and Jansen (1997) and SEDAWOG (1999) revealed that there is high degree of vertical and horizontal integration in this industry. Vertical integration arises because a factory owns or controls other enterprises relat ing to fish supply acquisition , transporting fish , product distribution and export marketing. Horizontal integration arises because factories own or control other factories operating at the same level i.e. different 'branches' of the same factories. Horizontal integration now extends beyond Kenya's borders as some factories in Kenya own similar factories in Uganda and Tanzan ia.
It is noteworthy that th is is a very dynamic industry with frequent closures , takeovers and ownership changes. But certainly the industry has been operating way below the established capacities of most factories, more so in the face of dimin ishing Nile perch catches. The expansion in capacity of the factories has
40

---------_1
been so rapid that from 1997 the Nile perch processing industry was able to operate at only about half of the available processing capacity (Abila and Jansen, 1997; SEDAWOG, 1999). The main reason for under-capacity utilization has been fish supply problems, but for some factories, insufficient operating capital has also been a limiting factor. One of the strategies taken by the factories to overcome fish supply problems has been to seek their fish supplies from beyond Kenya's boundaries, an event that has introduced a new line of conflict in this industry (Gibbon , 1997).
The export markets.. Nile perch has in the past been exported to the EU both in the fresh/ chilled and frozen skinless fillet forms, the former fetching much higher prices but with very stringent requirements in quality control and logistical arrangement. The fresh form should reach the market within 48 hours after landing, and it was mainly supported by the efficient airfreight and logistical export system already in place
I for Kenya 's horticultural products going to the same countries . However, following the three export bans discussed below, fish exporters left the lucrative fresh fish market for the less demanding and less paying frozen fish export trade.
I I The 1997, 1998 and 1999 successive export bans of fish and fishery products
from Lake Victoria to the EU, which was already importing about 87% of all fish exports from Kenya before the bans, caused a steady decline in Kenya 's fish
I export both in value and volume terms. The lowest intake by the EU was in 1999 when it imported only 6% of Kenya 's fish. New markets emerged during the ban to replace the void created, including Far East countries (Japan, Australia, China ,
I Hong Kong, etc.), Americas (USA and Canada) and others (Middle East and African Countries (see Tables 2 and Figures 4 and 5). Israel became the most prominent single importer of Kenya 's fish, taking 42% in 2001.
However, it should be noted that the EU has consistently offered the highest prices for Kenya 's fish (about US $5 f.o.b), hence, despite the emergence of new
I markets, the overall value of exports went down during the bans. EU is slowly regaining its position in the market, taking 21 % in 2001, even though Kenya is still restricted to bilateral fish trade arrangement. Once the restrictions are totally
I lifted, there is no doubt that the EU will again become the number one importer of Kenya 's fish.
I Table 2 Nile perch exports by market region
I Market region Export volumes (tonnes) 1996 1997 1998 1999 2000 2001
European Union 10,388 6,882 2,320 742 1,680 3 ,818 (21 %) Far East 1,801 2,664 2,201 2,722 4,146 4,650 (26%) Israel 3,431 4,244 5,252 5,529 7 ,1 85 7 ,530 (42%) Others 1,120 929 1,394 2,894 2,468 1,947 (11 %) Total 16,740 14,719 11,167 11,914 15,479 17,945
I I ISource: Kenya Fish Processors and Exporters Association
I 41
I I I

Fig 2 Nile perch exports by market regions
80007000
---~ 6000=g 5000~_ 4000~ 3000~ 2000w 1000
o1996 1997 1998
Year
1999 2000 2001
r--~----~~-------~-~--~--~-~-~--____,; j
~
I: 5
~ 4
.c<f)
~ 3-.-;; c
0
I.0
Ql 2=-
1 ..... I1l
>1-
Fig 3 Kenya: Fish exports by Value_.._-----
!
1994 1995 1996 1997
Year
1998 1999 2000 2001
Source: Kenya Fisheries Department
42

.
I
Positive Impacts of Trade
I
I The schematic diagram below (figure 4) developed by Kurien (2003), shows the potential pathways through which positive and negative impacts of international trade in fisheries products could occur. In this framework, both the importing country and exporting country find negative and positive impacts in trade. The importing country gains because its consumers have more food and the workers (in reprocessing sectors) have income and employment. The food security
I situation of the importing nation, thus, improves. On the negative side, the fish importing country looses foreign exchange used to purchase fish. The fish producers in the importing country also face reduced prices as a result of higher supply. In the long run this may cause them to over fish the local stocks to compensate for revenue loss, hence, a negative impact on the environment.
II I The fish exporting nation find benefits in increased incomes to its fish producers
and workers in the exporting industry. Because of the higher value of fish, the fish producers have greater incentive to manage fish stocks. Additionally the nation gains through increased foreign exchange earnings, local taxes etc. On the negative side there is lower supply and higher fish prices in local markets,
I worsening the food security status of local people. may also be technology change toward greater fishing efficiency, which could impact adversely on fish stocks.
I Following Kurien 's (2003) model, the commercialization of the fishery of Lake Victoria has certain significant positive impacts. First, it is undoubted that more
I people have been attracted to fishing in recent years, and many more people depend on incomes from the fishery. Citing various Department of Fisheries reports, Bokea and Ikiara (1999) estimated that about 798,000 people became
I dependent on the fishery directly or indirectly for their source of livelihood in 1998. Those directly employed in fish production have also increased four times from 10,000 in 1973 to 38,000 in 2000. Much of this increase, especially after
I 1980, could be directly attributed to the expansion of the Nile perch markets, the increase in demand for Nile perch and the resulting good prices. Thus, the fishery transformation has been important in creating new employment
I opportunities especially in fish harvesting sub-sector. However, since the catches
I of Nile perch are declining, the average productivity of each fisherman (catch per person) has declined over the years, meaning that most fishermen are, in fact, under-employed. Fishermen too have to travel longer distance to fishing ground for lower unit catches, implying that the average net income is getting smaller.
I Another important benefit of the transformation of the fishery has been in foreign
I exchange earnings from fish exports, whose retail value in the export market was estimated at about Ksh 3.9 billion ($52 million) in 2001 (Wakwabi et aI, 2002). However, Bokea and Ikiara (1999) indicated that the full retail value of fish was not repatriated to Kenya, and therefore, the actual foreign exchange earnings could be much lower than these figures.
I 43
I J J

Figure 4. Pathways of international fish trade impacts
~'
"~.~, ~.
,..,.o
,..,.o::!1
,Ill)::::T
::E
!\~....,IIIll,)
,:::ljQ.
!::!1!Ill'::::T
::Jno3(1)
: _.
- "'T1III 0C .,
·····3: ct>ct>! cO'ur :::l
!ct>
i~.......j ~
:~:ct>
oIII
,Ill!(1): III!n:0
i~:etl':l;(1)
~~:etl:0.
C"'<; _.
':::l!n:....,:(1)ill,): III:(1);0.
.........................:::::::::::::::::IMPORT:::::::::::::::::::::::::60NS0MP.i:ib:N:::\::;::(~~~~~:r:f:~~#~~~~:::;
2. Raises income offish workers
1. Raises fish supplytofish consumers
3 Lowers price of fish &income of local fishproducers
I 4. Reduces country's I~L_:~_~_~_~·~_·~_~e_X_C_h_a_n_g_e -'I..·..·..·
::::::::!NT:f;:~At:I:O~At:::::::::::::::::::::::::::::tRADiS::::::::::::::::::::........... ' .
2. Raises income of/ish producers
5. Production (pattern &technology)IrYll'"1::Jrt ::In'''::>r<:,,,h, nn fish stocks
6. Adverse impact onfish workersinvolved in traditional processingand marketing
4. Lowers supply & raises price offish for local fish consumers..
1. Raises country's foreign exchange
3. Raises income ofjlsh workers
. .. , , .. - ,- ".
..... , ....
:::EXp:O~T<:::::::<:<::::::::::p.R.(}.Ducrib:N:::<::::::::(i8S(:~!?C~#i~~~:::::::::
["I
Source: Kurien, J (2003)
44

Related to this benefit is the tax income to the government accruing from fish exports. This is collected by the Fisheries Department as export levy, calculated at 0.5% of the f.o.b. price of fish exports. This levy rose to a peak of Ksh. 13 million ($0.17 million) in 1996, but subsequently declined following the fish export bans to the EU. The levy collection could be much higher, but some fish exporters under-state the value of fish exported, thus denying the government higher tax income.
In addition, the government earns revenue through licensing fish processing and fish meal firms, registration of boats, court fines, issuance of fish traders' licenses and export certificates. The local councils and co-operative societies serving fish landing beaches also receive some amount levied on each Kg of fish sold to fish factories. Bokea and Ikiara (1999) estimated that in one year the Government earns about Ksh. 132 million ($1.8 million) from the fishery, which could be directly attributed to commercialization of the fishery. The Lake Victoria fishery also makes a small but important contribution to Kenya 's GOP, although this has stagnated at about 0.3% in much of the last decade.
The transformed fishery has also caused an increase in fish prices, which directly interprets as an improvement in unit value of the fishery. Fish price data obtained from the Kenya Fisheries Department and the Central Bureau of Statistics, and adjusted for inflation, show that there has been a gradual increase in the prices of the three commercial species in the last decade. Table 3 displays the adjusted prices for the three commercial species of Lake Victoria. However, the increased unit fish prices might not result in significant increase in overall income to fishermen since they are matched against declining fish catches. To fishmeal processors, there is a benefit in ready availability offish frames and 'dagaa', which come at a lower price than they would get from the alternative sources.
Table 3 Fish landing prices* in Lake Victoria (Kenya) (1991 - 2000) Year Fish prices (Ksh**/ kg)
Nile perch Nile tilapia 'dagaa' 1991 12.00 8.46 5.90 1992 24.73 22.38 12.12 1993 26.21 25.00 9.85 1994 26.40 25.75 10.50 1995 31.02 31.67 25.64 1996 49.56 36.49 28.74 1997 37.19 35.93 26.34 1998 47.72 51 .66 37 .88 1999 47.72 54.52 35.18 2000 51 .62 48.84 36.23 2001 62.35 56.90 36.70 2002 75.32 - -* Prices adjusted for inflation ** 1 $ = 75 Ksh Source: Adapted from SMEC (2002)
45

Negative effects of Lake Victoria fish trade
Taken at their face value , the benefits of commercial transformation of the fishery of Lake Victoria would appear quite impressive. The negative impacts of development of the fishery, on the other hand, are even more compelling. Bokea and Ikiara (1999) argued that the costs of massive fish exports and the use of fish in the manufacture of animal feeds far outweighed their benefits. The costs associated with international trade on fishery products are substantial , and some of them cannot even be quantified. The greatest cost, no doubt, is the possibility of total collapse of the fishery if the current exploitation levels are maintained to satisfy the market demand. Uncontrolled fish exports and' use of fish for fishmeal could cause the fishery to collapse , with ecological and environmental consequences that cannot easily be quantitatively predicted . The overall market and non-market value of the fishery is difficult to establish , but suffice it to say, its loss would be too massive to be offset by the current short-term benefits.
Another consequence of development of the fishery is that local people have progressively been edged out of production , pricing, marketing and processing. Fish factories and their agents now tightly control these activities. As earlier discussed , employment chances in traditional fish trading and processing sectors for Nile perch and its products , previously the preserve of poor women , are now largely integrated in the marketing chain for fish processing and fishmeal industries. Now dominantly male actors perform the roles that women played in the past (Lwenya, 2002). The decreased opportunities for local people, especially women, to participate in the fish industry means they have less access to fish.
Arising from this, there has also been inequitable distribution of income from the fish trade, with local communities at a disadvantaged position compared to fish agents, factory owners and fillet distributors. As previously observed , the declin ing catches and increasing number of fishermen means that per capita incomes in the fish ing communities are on the decl ine.
According to Ikiara (1999), the failure to place a ceiling on the amount of fish exported per period is erroneous in that it denies Kenyans a cheap source of protein and increases pressure on the resource base. Similarly, the failure of government to rationalize the use of fish and fish products in the animal feeds industry also manifests a food policy that is focussed in the wrong direction .
With regard to the effects and benefits of global fish trade on the local population , three groups of people may be identified. First is the immediate community around the lake, who are either engaged in fishing , artisanal fish processing and trade or are dependents of fishermen and traders. Because of their location , they are able to get some tilapia , and 'dagaa' or Nile perch rejected by factory agents. The fishermen and their dependents may be happier with higher Nile perch prices , and will benefit due to increased trade. However, artisanal processors and trader are adversely affected when there is booming international trade. The second group
46
- -- J

~-.
II
consists of those living some distance from the lake in rural villages. They do not fish or engage in fish processing and trade, and have no direct dependents in the fishery; Their only benefit from the lake is the fish which the buy in their rural market. Sometimes they find tilapia in their market, but more frequently only dried and poor quality 'dagaa' is there. Whenever the international trade is booming, these people cannot get Nile perch. They only see the fish trucks passing by their village to and from the lake. This group has nothing to gain, but a lot to lose from international trade. Finally, the urban based consumers, for example, in Nairobi and Kisumu. They sometimes find 'dagaa' and tilapia in their markets, but prices are prohibitive. Commonly fish fram_es from factories are sold in their markets, but their quality is too poor. If they to buy Nile perch fillets at a factory, they will not get it. This group has nothing to gain from Nile perch exports. Thus, most of the segments of the Kenyan population may find no compelling justification for increased export of Nile perch from areas that have protein deficiency problems.
The changing pattern of fish consumption
I
Fish has many advantages over other foods, being one of the richest sources of protein. Dried fish, such as 'dagaa', is also very rich in vitamin A. Mwaniki (1997) estimated that just 10g of dried 'dagaa' could provide sufficient levels of vitamin A needed by a growing child. Besides, in many developing countries, fish is cheaper relative to meat, poultry and dairy products. Fish adds flavour to diet; is rich in essential fatty acids and minerals and is easier to process and store, for example
I I
by sun-drying, compared to the alternative sources of animal protein. In spite of the benefits that may be obtained from fish, there is little, and very often inconsistent, information on fish consumption in Kenya. Some nutritional studies have been conducted in the lake region, but they tend to be confined to specific districts, localities or to particular communities, and rarely do they focus on fish. In spite of
I this, the contribution of fish to the economy and diets of lakeside communities is a subject that has attracted a lot of interest in recent years . For example, all major research projects implemented on Lake Victoria fisheries in the recent past had, as one of their objectives, to study some aspects of fish marketing and consumption.
I One the most comprehensive studies on fish marketing and consumption around
I Lake Victoria was carried out by SEDAWOG [An acronym for Socio-economics Data Working Group], which was a unit of the Lake Victoria Fisheries Research Project. The report of SEDAWOG (1999) showed that the largest proportion of fish
I consumers on the Kenyan side of the lake, constituting 46%, ate fish only 1-2 times a week. Another fish consumption study, conducted for the Lake Victoria Environment Management Program (LVEMP) on 48 fishing and non-fishing
I households living next to Lake Victoria, revealed that, in fact, most households ate 'dagaa' and tilapia more frequently than Nile perch (Abila et aI, 1998). Nile perch would only be available if juvenile or factory rejects.
I The IUCN Socio-economics of the Lake Victoria Fishery Project also funded a smaller study on the consumption of fish in the lake region in 1997. This was a
I 47
I
J

comparative survey implemented in three sites: Karungu, a small fishing village; Migori, a medium-size urban center; and Kisumu, the largest town in the lake region. A total of 258 households, fairly distributed in the three sites, were interviewed. This study also found that most households, 61 %, consumed fish just two times in a week. It also established that Nile perch was eaten much less than tilapia and 'dagaa'. Nearly 47% of the households gave tilapia as the fi sh they consumed most, 32% mentioned 'dagaa' while only 22% gave Nile perch Uuvenile and rejects) .
According to various annual reports of the Fisheries Department, Kenya's per capita fish at independence stood at 2.2 Kg. This is estimated to have risen to 3 Kg in 1980. Other estimations were by Abila and Jansen (1997), who calculated the per capita fish consumption in Kenya at about 3.76 and 3.13 for 1995 and 1996 respectively. None of the results cited above was close to the desirable per capita fish consumption of 9.3 suggested by Okemwa and Getabu (1996).
In the study conducted by SEDAWOG (1999) most consumers gave low income as the reason why they could not eat fish more frequently. Ikiara (1999) explained that due to inequitable income distribution in the lake region , the level of malnutrition of both proteins and energy is much more severe among the lower income groups. The most vulnerable groups are the very poor, the near landless, children, pregnant and lactating mothers.
Even though there may be several differences in the results of fish consumption studies cited above, the following generalizations could be made. First, fish consumption is lower than would be expected in the lake region, with a majority of households eating it just about two times in a week. Secondly, tilapia and 'dagaa' are the most consumed species. Third, consumption patterns tend to change within the month and during the year; and this seems to be affected by the level of fish supply, price of fish, availability and price of substitutes. Fish consumption was largely limited by low availability of fish . Fourth, it is apparent that the per capita fish consumption in the country is relatively low and is on the decline. Fifth, in the absence of fish, the local communities have little alternative protein substitutes, being a leading cause of protein malnutrition , consequently, food insecurity.
II The present studies, though, have not succeeded in establishing indisputable link between fish exports and malnutrition in Kenya. There is, however, indicative evidence that the removal of large protein biomass from a region already highly deficient of protein can only worsen the nutritional situation. The activities contributing to this, namely; uncontrolled Nile perch fillet export and processing 'dagaa' and Nile perch frames for fishmeal instead of human consumption, therefore, raise genuine food security concern. For purposes of planning and
I policy making, there is still need for more incisive studies to establish the clear links and the levels of mitigation. The study discussed below has been proposed in that direction.
I I 48
I

:tdirectly
The FAO/ MFA study on impacts of international fish trade on food security
The Food and Agriculture Organization (FAO) jointly with the Ministry of Foreign Affa irs (MFA) of the Norwegian government have proposed to implement a study in 15 countries around the world , including Kenya, to investigate the impacts that international fish trade has on food security on a global scale. The study's main objective is to determine whether fishery product exports and!or imports contribute to enhancing or reducing food security, either directly (as food) or
(as source of employment and income) or both (Kurien , 2003).
Specifically this study will examine both the positive and negative impact that international trade has on:
• Fish availab ility and accessibility • Employment and income generation • Distribution of benefits • Potential for foreign currency earning • The environment (resources and the aquatic environment)
I To achieve the objectives, the strategy proposed is to examine the issue simu ltaneously from a global-macro perspective and from a local-micro
I perspective. The study will involve an analysis of secondary data at the country level and by undertaking location specific case studies, both of which will be used to assess the direct and indirect impact of fish trade - export and import - on food security of five "categories", namely; (1) The nation - the country as a whole
I (2) The fish producers - men and women who harvest the fish (3) The fish workers - women and men who are involved in the activit ies of
processing and distribution of fish
I (4) The fish consumers - the rich and the poor in the population who eat fish (5) The fish stocks - the fishery resource including the environment in which they
are found.
I Several opinions have been raised concerning the impact of international trade on food security. The study will examine many of them , including the following;
I I
• Promoting fishery exports from developing countries will endanger the nutritional status of poor fish consumers because domestic supplies will decline
I • Increasing fish exports creates more jobs in the fish producing and
processing activities, particularly of women , raises incomes and thus increases the spending on food
I • Developing countries earn considerable amounts of foreign exchange
from fish exports which can be used to buy less expensive, nutritious food
I 49
I LI

to supply to vulnerable populations to maintain or raise levels of food security
• Fishing for exportable species of fish results in competition between different sub-sectors of fish producers causing disruptions that have a negative effect on employment, income and hence on food security
• Large imports of fish can lower the price of fish of the fish producers in the importing countries which will have an adverse impact on their earnings and consequently their food security status
• Large fish imports can provide numerous jobs in the fish processing and distribution activities in the importing countries raising the employment and incomes of many fish workers, particularly women, and thus enhance food security.
• In a context of poor fishery resource management, increased fish exports from one region and their imports, can result in the fish producers in both the exporting and importing countries to exploit fishery resources indiscriminately - the former for gaining more income and the latter for compensating for its loss. This will have adverse impacts on the aquatic environment and resources of both the exporting and importing countries causing a threat to long-term food security.
• Any trade that impinges on the issue of food security raises the related question of the right to food as a basic human right, which must be addressed as a integral part of any such analysis.
• WTO and other international agreements that have a bearing on international trade in fishery products can create conditions that are inimical to the interests of developing countries.
Recommendations
I The following interventions are recommended to reduce the negative impacts of international trade and enhance the benefits ;
I 1. Policy interventions
I • The fisheries policy should be re-focused to put greater emphasis on
food secu rity.
I • There is need to set priority in terms of use of fishery products in fish meal
production , when it is evident that there is high demand for them for direct human consumption.
I • There is clearly a need for controlling the expansion of the fish
processing and exporting industry. Such may involve stopping the licensing of new factories. A quota system should be given serious consideration
• Revitalize the Kenya meat industry to produce raw material for fishmeal
I I 50
I

2. Fishery management interventions
• design a common fisheries management policy for the whole lake so as to avoid the differences in regulating fisheries between the three countries.
• Address the property rights to the fishery by avoid ing open access. • improve enforcement capabilities through greater surveillance. • Increased research to accurately determine the MSY for all commercial fish
species • Reviewing the Fisheries Acts to incorporate new regulations in line with the
present realities • Changing the medium of fisheries regulation to put greater scope for
community participation in a co-management framework.
3. Explore opportunities to raise fish supplies
• There should be deliberate interest to intensify the development of aquaculture in the country.
• Enhance the supply capacities of inland lakes and rivers through better management, greater accessibility and restocking.
• Increase exploitation of Kenya's offshore coastal fisheries and review the policy licensing foreign-owned vessels
• Reduce post-harvest losses in 'dagaa' • Diversify to non-traditional fisheries
4. Refocus fish marketing strategies and practice
• Institute limits on export volumes (both for food security and sustainability) • Aim for low volume, high value added fisheries export products (Add value
through smoking , marinating, packaging the products) • Increased direct negotiation between fishermen and factory owners (thereby
minimising role of factory agents) • Increased access to fish price information by fishermen
I • Closing down the margins between the landing price and export retail price • Diversification of exportable product range (towards marine resources)
I I I I I 51
IJ

---------_J
References
Abila R.O. (2000). 'Development of Lake Victoria: a Boon or Bane for Food Security?' Socio-economics of the Lake Victoria Fisheries Project Report No.8, IUCN - E. A. Program, IUCN. Nairobi.
Abila , R.O. and E.G. Jansen (1997). 'From Local to Global Markets: The Fish Exporting and Fishmeal Industries of Lake Victoria - Structure, Strategies and Socio-economic Impacts in Kenya'. Socioeconomics of the Lake Victoria Fisheries Project Report No.2, IUCN - E. A. Program, IUCN. Nairobi.
Ahmed M. (2003) . 'Fish for the Poor in a Globalized Economy - Macro Benefits versus Micro Impacts'. Paper presented at the INFOSAMAKI FAO Expert Consultation on International Fish Trade and Food Security. Casablanca, 27-30 January, 2003. INFOSAMAKI FAO.
Bokea , C. and M. Ikiara (2000). 'The Macroeconomy of the Export Fishing Industry in Lake Victoria (Kenya)'. Socio-economics of the Lake Victoria Fisheries Project Report NO.7 . IUCN - E. A. Program, IUCN. Nairobi.(Forthcoming)
Gibbon , P. (1997) 'Of Saviours and Punks: The Political Economy of Nile Perch Marketing Chain in Tanzania '. COR Working Paper no. 97.3. Centre for Development Research , Copenhagen
Greenwood , P. H. (1981) The Haplochromine Fishes of the East African Lakes: Collected Papers on their Taxonomy, Biology and Evolution. Kraus International Publications, Munchen.
Ikiara, M.M. (1999). 'Sustainability, Livelihoods, Production and Effort Supply in a Declining Fishery: The Case of Kenya's Lake Victoria Fisheries '. PhD Thesis. University of Amsterdam.
I Jansen, E.G. (1997). " Rich Fisheries - Poor Fisherfolk: The Effects of Trade
and Aid in the Lake Victoria Fisheries", Socio-economics of the Lake Victoria Fisheries Project Report NO.1 . IUCN- E. A. Project,
I IUCN-EARO. Nairobi.
Kenya Government, (1986) 'Economic Management for Renewed Growth'. Sessional Paper no. 1 of 1986. Government Printer, Nairobi.
I Kenya Government (1993). 'Resource Mobilisation for Sustainable
Development'. National Development Plan 1993-1997.
I Government Prinetr, Nairobi.
Kenya Government, (1994). Sessional Paper NO.4 on National Food Policy. Government Printers. Nairobi.
I Kenya Government, (1995). Statistical Abstracts, Central Bureau of Statistics,
Nairobi. Kurien J. (2003). 'International Trade and Food Security: The Case of Fishery
I Products'. Paper presented at the INFOSAMAKI FAO Expert Consultation on International Fish Trade and Food Security. Casablanca, 27-30 January, 2003. INFOSAMAKI FAO.
I 52
I

Lwenya, C. (2002) 'Gender in the Management of Lake Victoria Fisheries
Resources (Kenya)' Msc. Thesis. Moi University, Eldoret, Kenya.
Mwaniki, O. (1999). Interview in 'Big Fish, Small Fry'. IUCN Video Odongkara, O.K. (1999). 'Commercialisation of the Fisheries of Lake Victoria:
Opportunities for Greater Food Security'. In: Proceedings of the IUCN Workshop on, 'The Lake Victoria Fisheries and Food Security; Consequences for Security and Sustainability'. IUCNEARO. Nairobi.
Okemwa, E. and A. Getabu (1996). 'Fish Farming in Kenya with Particular Reference to Lake Victoria' Fisheries" Paper Presented at the Seminar on the Management of Integrated Freshwater Ecosystems in Tropical Areas" May 16-19. Brussels.
O'Riordan, B. (1997). 'Fisheries, Farming and Food Security in Nyanza: Caught Between the Devil and the Deep Blue Sea?' ITOG. Nairobi, Kenya.
Othina, A.N and S. Osewe-Odera (1996). "Catch and Effort Assessment Survey for Artisanal Fisheries of Lake Victoria (Kenya Waters)", Kenya Marine and Fisheries Research Institute, Kisumu.
SEOAWOG, (1999). Marketing Study. LVFRP Technical Document NO.2. LVFRPITECH/99/05. The Lake Victoria Fisheries Research Project. Jinja.
Wakwabi E, R.O . Abila, L.M. Mbithi (2003) 'The Kenya Fisheries Sector: Supply Capacity, Firm Level Performance, Policy Environment, Institutions and Constraints'. Consultancy Report Submitted to Export Promotion Councill UNOP for the Joint Integrated Technical Assistance Programme (JITAP), Fish Sector (Cluster 12). EPC/UNDP/ITC/UNCTADIWTO.
I I I I I 53
II _ ____J