I --cc ~c ~::,:, ~~ -P 0 UNITED STATES GX>~~ ~==a ... · Six-foot rectangular weir installation •...
39
- I ! --cc ~c ~::,:, --m =e: . i tO;.;.iiiiiiiiiii:,::i ~ -P 0 GX>~~ ~==a -..J __ ;; - .... J-~ o=< -s:l I UNITED STATES DEPARTMENT OF THE INTERIOR BUREAU OF RECLAMATION -~'------------------------------------ = :,:,I"" -- ; - TA 416 .887 HYD-533 1964 C.2 FLOW RESISTANCE COEFFICIENTS OF THREE SIZES OF CAST-IN-PLACE CONCRETE PIPE Report No. Hyd-533 Hydraulics Branch DIVISION OF RESEARCH OFFICE OF CHIEF ENGINEER DENVER, COLORA DO Augu st 27, 1 964
Transcript of I --cc ~c ~::,:, ~~ -P 0 UNITED STATES GX>~~ ~==a ... · Six-foot rectangular weir installation •...
-
I !
--cc ~c ~::,:, --m =e:
. i ~~
tO;.;.iiiiiiiiiii:,::i
~-P 0 ~ GX>~~ ~==a -..J __ ;;
-....J-~ o=< -s:l
I
UNITED STATES DEPARTMENT OF THE INTERIOR
BUREAU OF RECLAMATION
-~'------------------------------------= :,:,I"" --;
-
TA 416 .887 HYD-533 1964 C.2
FLOW RESISTANCE COEFFICIENTS OF THREE
SIZES OF CAST-IN-PLACE CONCRETE PIPE
Report No. Hyd-533
Hydraulics Branch DIVISION OF RESEARCH
OFFIC E OF CHIEF ENGINEER DENVER, COLORADO
Augu st 27, 1964

LIBQ.l\RY
FEB -1 2012
Bureau of Qeclame.Uon Denver.CO
DATE DUE
ri 1n this report may not be used in g, or other promotion in such a endorsement by the United States of Reclamation, either explicit or product, device, or process that
l
~ eport.
•

CONTENTS
Abstract . • • • Summary Acknowledgment Introduction • . • . General Information . • • Description of Test System. . .
Test Reaches _Pipe Inspection
.• 0 • • • • ••••• .............. Measurement and Calculation Procedures •
Discharge Measurements . . Head Loss Measurements • Method of Calculation.
Discussion of Results • Conclusions . • • • • . . . . .
Page
iii 1 2 2 2 3
3 3
4
4 5 6
8 10
Table
Measured Pipe Diameters • . • • • • • • • . • • • • 1 Computed Weir Discharges • • • . • • • . • • • • • 2 Tape Readings in 48-inch Pipe Vents • • • • - . 3 Tape Readings in 42-inch Pipe Vents . • • • • • • • • 4 Tape Readings in 36-inch Pipe Vents • • • . • • • • • 5 Resistance Coefficient Calculations • • . . • • • • • • 6
Figure
Location map . . . . . . . . . . . . . . . . . . . . 1 Gated check structure • • . • • • • • • • • • • • • • 2 Typical gated check structure and pipe vent • • • • • • 3 Pipe vent openings and pipe surfaces, 48-inch and
42-inch pipe. . . . . . . . . . . . . . . . . o • •
Pipe surfaces and joints, 36-inch and 48-inch pipe • • • Six-foot rectangular weir installation • • • • • • • • • Weir bulkhead and head gage • • • • • • • . • • • . • Weir installation and electrical tape system • • • • • • Variation of resistance coefficients with Reynold's
number . . . . . . . . . . . . . . . . . . . . . .
i
4 5 6 7 .8
9
Sam Peng
Sticky Note
None set by Sam Peng
Sam Peng
Sticky Note
MigrationNone set by Sam Peng
Sam Peng
Sticky Note
Unmarked set by Sam Peng
Sam Peng
Sticky Note
None set by Sam Peng
Sam Peng
Sticky Note
MigrationNone set by Sam Peng
Sam Peng
Sticky Note
Unmarked set by Sam Peng
ABSTRACT
Hydraulic resistance coefficients were determined from head loss measurements made in 48-, 42-, and 36-inch-diameter cast-inplace concrete pipe installations. Data were obtained with the pipes flowing full at discharges less than the design values; from about 10 cubic feet per second to 25 cubic feet per second. Pipe test reaches varied from 1, 240 to 3,895 feet. The hydraulic grade line was measured in 10-inch-diameter air vents used as piezometers; discharges were measured using a rectangular weir. Sufficient data were obtained to calculate flow resistance coefficients using the Darcy-Weisbach, Manning, and Scobey equations. The flow resistance coefficients for the 48- and 42-inch pipe and one reach of 36-inch pipe may contain residual losses produced by pipe entrance flow patterns, but the resistance coefficients for one reach of 36-inch pipe are believed to be representative of the values to be expected in long straight reaches. DESCRJPTORS--Head losses/ Manning formula/ Darcy-Weisbach formula/ pipelines/ roughness coefficients/ pressure conduits/ concrete pipes
IDENTIFIERS--Cast-in-place pipe/ Madera Distribution System
iii
Sam Peng
Sticky Note
None set by Sam Peng
Sam Peng
Sticky Note
MigrationNone set by Sam Peng
Sam Peng
Sticky Note
Unmarked set by Sam Peng
Sam Peng
Sticky Note
None set by Sam Peng
Sam Peng
Sticky Note
MigrationNone set by Sam Peng
Sam Peng
Sticky Note
Unmarked set by Sam Peng

UNITED STATES DEPARTMENT OF THE INTERIOR
BUREAU OF RECLAMATION
Office of Chief Engineer Division of Research Hydraulics Branch Special Investigations Section Denver, Colorado August 27, 1964
Laboratory Report No. Hyd-533 Compiled by: C. E. Brockway Checked by: J. C. Schuster Reviewed by: A. J. Peterka Submitted by: H. M. Martin
FLOW RESISTANCE COEFFICIENTS OF THREE SIZES OF CAST-IN -PLACE CONCRETE PIPE
SUMMARY
The purpose of the study discussed in this report was to determine the hydraulic flow resistance coefficients and physical characteristics of the interior surfaces of three sizes of cast-in-place concrete pipe. This study is part of a long-range program for evaluating the hydraulic characteristics of pipes installed in distribution systems and for determining the effect of aging on resistance coefficients. Three sizes of cast-in-place pipe, forming one continous pipeline, were tested and included a 3, 895-foot section of 36-inch pipe, a 1, 240-foot section of 4.2 -inch pipe, and a 1, 300-foot section of 48-inch pipe. Discharges were measured with a 6-foot rectangular weir installed at the inlet to the 48-inch pipe section. Head losses were measured with an electrical tape gage in 10-inch-diameter air vents used as piezometers.
The upstream air vents in each test section were located from 53 to 67 feet downstream from a gated check structure. There were three air vents and an access manhole in the 36-inch reach and two air vents in the 48- and 42-inch reaches. The upstream air vents, used as piezometers in the three test reaches, may be located in a region downstream from the pipe entrance where constant pressure gradients have not been established. Head losses in the 48- and 42-inch pipes and in the upstream reach of the 36-inch pipe may contain residual losses caused by entrance conditions and, the computed resistance coefficients may be applicable only to pipe sections and structures of similar configuration and length. However, the resistance coefficients computed for the 36-inch pipe using the two downstream air vents as piezometers should be indicative of the resistance coefficients for straight reaches of pipe with constant pressure gradients. Because of the short test reaches and the proximity of the upstream pipe vents to the inlets, the results of this test series are not conclusive. However, the value of these data will be considerably increased by repeating the test series at intervals to determine the effect of aging and by continuing the program on other distribution systems constructed of precast and cast-inplace pipe.
Sam Peng
Sticky Note
None set by Sam Peng
Sam Peng
Sticky Note
MigrationNone set by Sam Peng
Sam Peng
Sticky Note
Unmarked set by Sam Peng
Sam Peng
Sticky Note
None set by Sam Peng
Sam Peng
Sticky Note
MigrationNone set by Sam Peng
Sam Peng
Sticky Note
Unmarked set by Sam Peng
ACKNOWLEDGMENT
The test series described in this report was satisfactorily completed with the excellent cooperation of personnel from the Los Banos Project and Madera Irrigation District Offices.
INTRODUCTION
There is a dearth of information on the hydraulic roughness of castin-place concrete pipe. Flow resistance coefficients may be materially affected by possible variations in pipe size or shape, surface irregularities, or other factors, plus the unknown effects of aging. Because of these uncertainties, measurements on installed pipe of various ages are being carried out and should provide a greater fund of data for future planning.
The Madera Distribution System of the Central Valley Project, the first installation of cast-in-place concrete pipe made under Bureau specifications, afforded an opportunity to determine flow resistance coefficients and physical characteristics of three sizes of pipe which had been in use for a part of two irrigation seasons. The measurements completed in October 1963 are the beginning of a test series designed to provide some of the needed information on flow resistance coefficients of cast-in-place pipe.
GENERAL INFORMATION
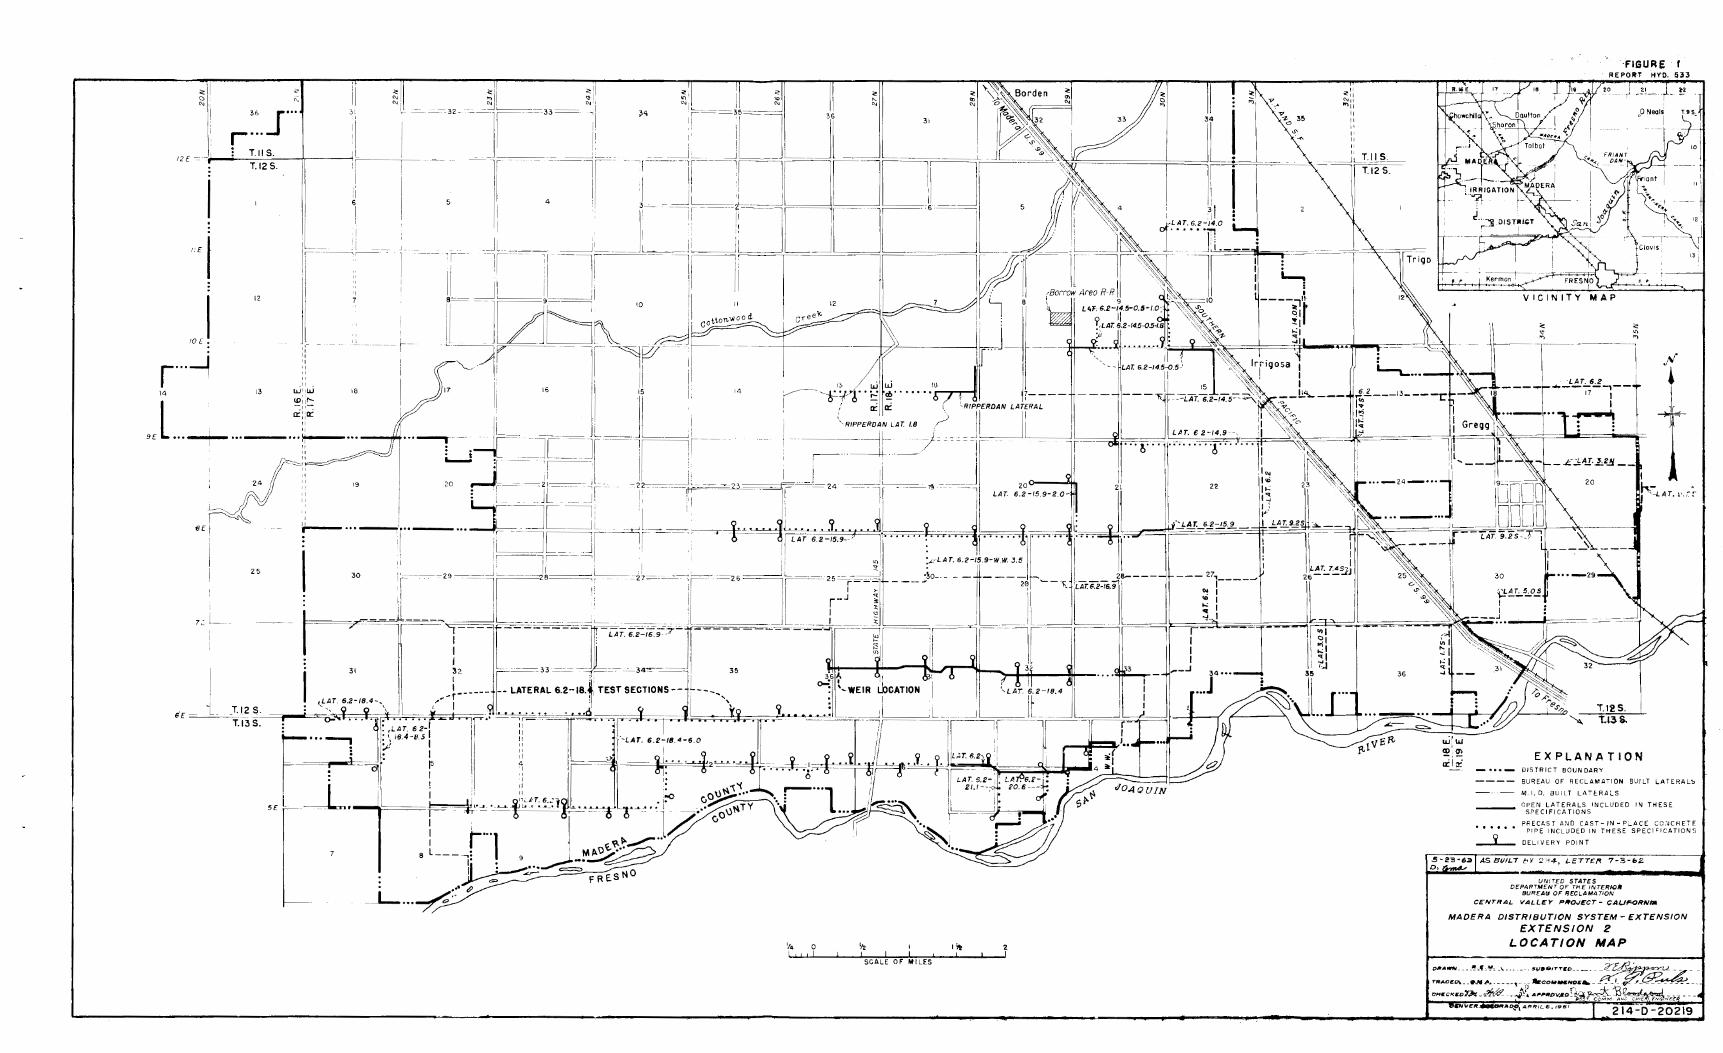
Flow resistance coefficient tests were performed on cast-in-place concrete pipe now in service as part of Lateral 6. 2-18. 4 of the Madera .Distribution System Extension, Part 2, Central Valley Project, Figure 1. The lateral consists of approximately 3 miles of earth-lined, open canal and 6 miles of low-head cast-in-place concrete pipe of 54-, 48-, 42-, 36-, and 30-inch inside diameters. All sections of pipe were constructed by a continuous forming process. The bottom of the trench was used as the Ot:J,tside form for approximately the bottom one-half of the pipe. The inside form consisted of a collapsible thin steel cylinder approximately 4. 0 feet long with a circular reinforcing stud at each end. Consolidation of the concrete was accomplished by oscillating fingers operating within the concrete mass.
This lateral was completed under Bureau of Reclamation Specifications No. DC-5606 in March 1962, and was put in service in June 1962. The pipe system is designed to run full for all discharges and has either a gated check, an access shaft, or an air vent at approximately 1/ 4-mile intervals. The pipe can be entered for inspection
2
Sam Peng
Sticky Note
None set by Sam Peng
Sam Peng
Sticky Note
MigrationNone set by Sam Peng
Sam Peng
Sticky Note
Unmarked set by Sam Peng
Sam Peng
Sticky Note
None set by Sam Peng
Sam Peng
Sticky Note
MigrationNone set by Sam Peng
Sam Peng
Sticky Note
Unmarked set by Sam Peng

through either the access shafts or the gated check structures. A typical gated check structure is shown in Figure 2, and a pipe vent and gated check are shown in Figure 3. All air vents are 10-inchdiameter metal pipe offset from the main conduit and extending from 5 to 8 feet above the ground surface, Figure 3.
DESCRIPTION OF TEST SYSTEM
Test Reaches
Three reaches of pipe were available for head loss measurements: 1,300 feet of 48-inch pipe from Station 254+00 to Station 267+00; 1,240 feet of 42-inch pipe from Station 280+60 to Station 293+00; and 3,895 feet of 36-inch pipe from Station 334+05 to Station 373+00. The reach of 30-inch pipe could not be tested as planned because the water to be used in the tests could not be disposed of elsewhere in the distribution system. Each test reach consisted of straight. uninterrupted pipe of the same diameter with no turnouts. Pipe vents were located at both ends of each test reach and were used as piezometers in determining head loss. The longer 36-inch reach had an additional air vent and an access shaft in the test section.
Pipe Inspection
A visual inspection was made of the flow surfaces of the entire test reach of the 48- and 42-inch pipes. The lower end of the 36-inch test reach was full of water and could not be drained; consequently, only 300 feet of this section was inspected, During the inspection. pipe diameters were measured with calipers at three locations in each test reach, Table 1. In the 48 - and 42-inch pipe, diameters were measured near the upstream and downstream vents and near the midpoint of the test reach. At each location, four diameters were measured; horizontal, vertical, and two at 45°. In the 36-inch pipe, diameters were measured ~t three locations chosen at random in the upstream portion of the reach. These diameters were considered to be representative of the test section. The vent openings were examined in all the pipe reaches except the downstream reach of the 36-inch pipe. These irregular openings were, in general, about 12 inches in diameter with small amounts of mortar projecting into the flow. Figure 4.
General appearance of the inside surfaces of the pipe was good. The pipe was cast in sections about 4 feet long. leaving a transverse joint at the end of each form. Offsets at these joints are less than onefourth inch and always away from the flow, Figures 4 and 5. The offsets are not uniform around the circumference and are generally larger in the upper half of the pipe. Some transverse joints have no appreciable offset, and the larger offsets and irregularities had been smoothed with mortar, Figure 5. Small longitudinal joints occur at
3
Sam Peng
Sticky Note
None set by Sam Peng
Sam Peng
Sticky Note
MigrationNone set by Sam Peng
Sam Peng
Sticky Note
Unmarked set by Sam Peng
Sam Peng
Sticky Note
None set by Sam Peng
Sam Peng
Sticky Note
MigrationNone set by Sam Peng
Sam Peng
Sticky Note
Unmarked set by Sam Peng

the junction of the lower and upper halves of the forms. A thin layer of brown slime covered the upper 150° segment of the pipe, but was not thick enough to mask or cover the actual surface texture of the concrete. The pipe sagged in some sections with water standing as much as 6 inches deep. The invert contained a few small gravel deposits in these low spots.
At the downstream end of the 42-inch test section, a small amount of concrete had apparently fallen into the pipe during construction of the air vent, forming a mound on the invert directly beneath the vent which could not be removed by hand. The mound had a well defined geometry which could be measured. An area reduction, amounting to about 1. 8 percent, was computed and used to adjust the velocity in the friction factor calculation.
MEASUREMENT AND CALCULATION PROCEDURES
Discharge Measurements
A 6-foot, fully contracted, rectangular weir.was used as the watermeasuring device for these tests, Figure 6. The wier was installed at the upstream end of the transition structure for the road crossing at Station 173+8 0. A 1-inch plywood bulkhead on a 2 - by 4-inch wood frame was braced against the concrete inlet structure. Figures 6 and 7. Before backfilling, a plastic sheet seal was attached to the bulkhead with an asphalt joint sealer and was laid in a 1-foot-deep trench in front of the weir. No leakage past the bulkhead was apparent during the tests.
A 1 /8-inch-thick brass plate 3 inches high with a machined sharp edge was used for the weir blade. The horizontal crest length of the installed weir blade was 6. 004 feet; the vertical blades were 2. 0 feet in length. The crest of the weir was 1. 5 feet above the bottom of the weir pool. Ventilation of the nappe was complete throughout the full range of flows, Figures 7 and 8. Head on the weir was measured with a hook gage operating in a transparent plastic stilling well mounted on a 2 - by 8-inch redwood post securely embedded in the weir pool 7. 5 feet upstream of the weir blade, Figure 6. The inlet to the stilling well was connected with a 3 /8-inch flexible plastic tube to a perforated metal can placed on the bottom of the canal in a region of low velocity. Using this equipment and procedure, any velocity effects on the head measurement were minimized. The dimensions of the weir pool for this installation were not standard as outlined in the Water Measurement Manual.,!_/ However, the depth and water surface widths were measured for various discharges and the average
1 /Water Measurement Manual, U. S. Department of the Interior. Bureau of Reclamation, First Edition, May 19.53.
4
Sam Peng
Sticky Note
None set by Sam Peng
Sam Peng
Sticky Note
MigrationNone set by Sam Peng
Sam Peng
Sticky Note
Unmarked set by Sam Peng
Sam Peng
Sticky Note
None set by Sam Peng
Sam Peng
Sticky Note
MigrationNone set by Sam Peng
Sam Peng
Sticky Note
Unmarked set by Sam Peng

velocity of approach was computed. For the maximum discharge of 24. 9 cubic feet per second, the velocity of approach was O. 68 feet per second as compared to a velocity of O. 59 feet per second in a standard weir box for the same discharge. This difference in velocity of O. 09 foot per second results in an increase in velocity head of O. 002 foot or an increase in discharge of O. 08 cubic foot per second. The increase in discharge amounts to only O. 3 percent and the discharge was, therefore, not modified to account for the increased velocity of approach. An enameled staff gage mounted on the post served as a quick reference to the head on the weir and as a check on the hook gage measurements. Computed discharges for the heads measured during the tests are shown in Table 2.
Head Loss Measurements
Discharges were regulated upstream from the weir, at the turnout from Lateral 6. 2, by district personnel. For each discharge measured at the weir, the gate in the gated check structure, Figure 2, at the end of each test reach was adjusted so that all pipes were flowing full and water surfaces were visible in the offset pipe vents. Flows were discharged through the check structure either through the gate at the bottom of the structure or over the top of the gate head wall, see Longitudinal Section, For Sloping Connection, h2, Figure 2. After a change in discharge at the turnout to the test lateral, the system was allowed to stabilize before any head loss measurements were taken. Periodic head measurements at the weir were taken during each test to determine whether or not there were changes or fluctuations in the discharge. The maximum change during any test series was O. 3 cubic foot per second.
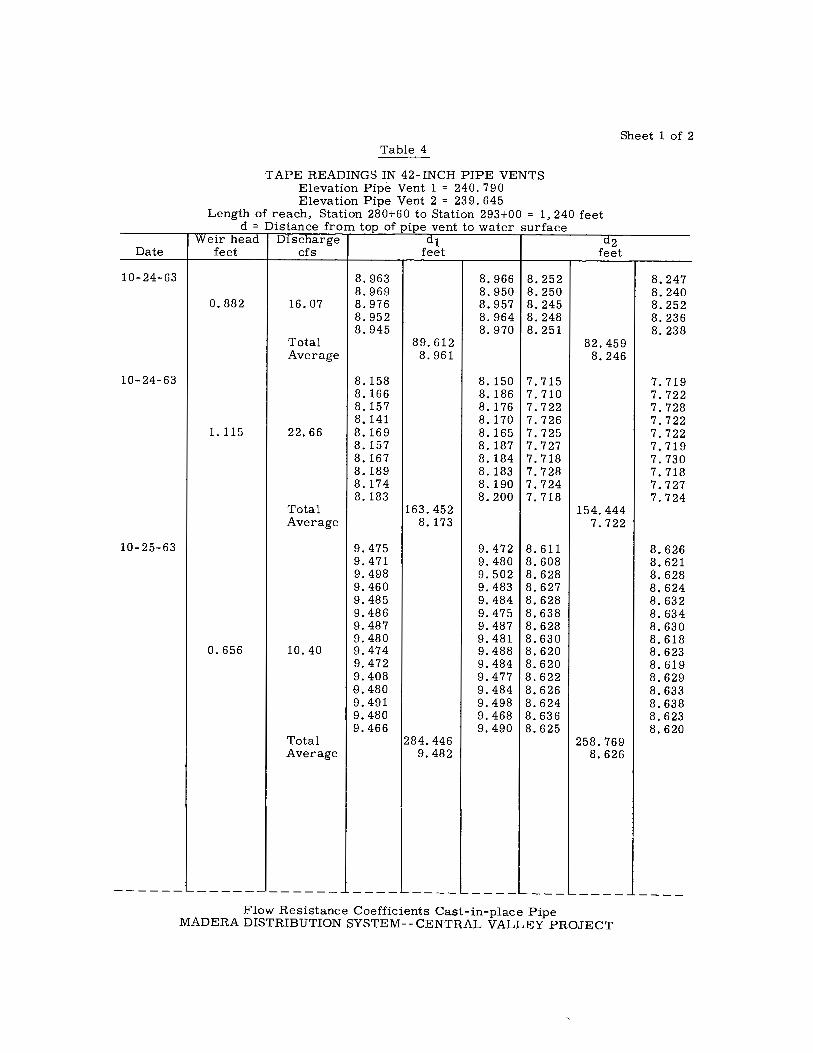
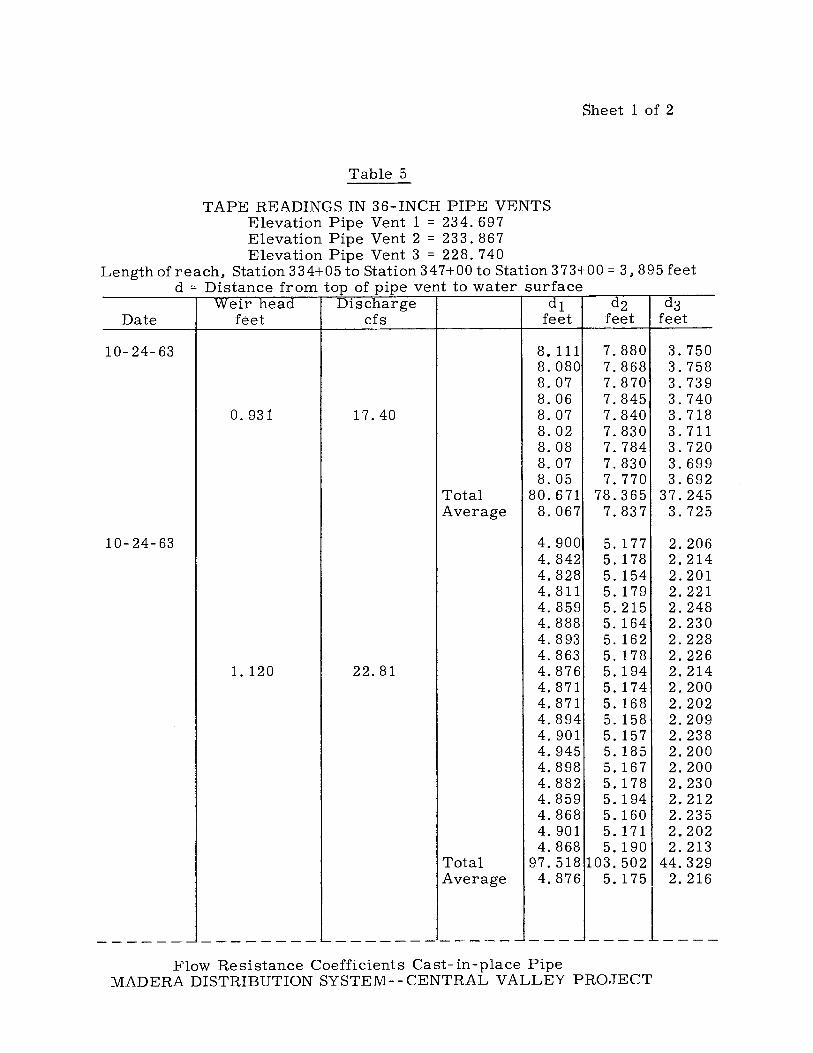
Distances from the top of the pipe vents to the water surface were measured with an electrical tape gage, Figure 8B. A steel tape with a !-inch-diameter brass plumb bob was used as the water surface contact of the electrical circuit. A lead-weighted ground (electrical) line was lowered into the water in the pipe vent to complete the circuit through a milliammeter used to indicate the contact of the tape point and water surface. A small wooden spirit level was used to transfer the surveyed elevation on the rim of the vent to the point inside the pipe at which the tape measurement was taken. Due to the fluctuations of the water surface in the pipe vents, it was necessary to take a number of random measurements to obtain an average. The number of measurements taken at each vent varied from 10 to 30 depending on the amount of fluctuation of the water surface, Tables 3, 4, and 5.
Lateral 6. 2 wasteway, crossing Lateral 6. 2-18. 4: at the lower end of the 36-inch reach, was used to convey the test discharge to the San Joaquin River. Flows of approximately 10, 17, and 23 cubic feet per second were used for tests in the 36-inch pipe designed for
5
Sam Peng
Sticky Note
None set by Sam Peng
Sam Peng
Sticky Note
MigrationNone set by Sam Peng
Sam Peng
Sticky Note
Unmarked set by Sam Peng
Sam Peng
Sticky Note
None set by Sam Peng
Sam Peng
Sticky Note
MigrationNone set by Sam Peng
Sam Peng
Sticky Note
Unmarked set by Sam Peng
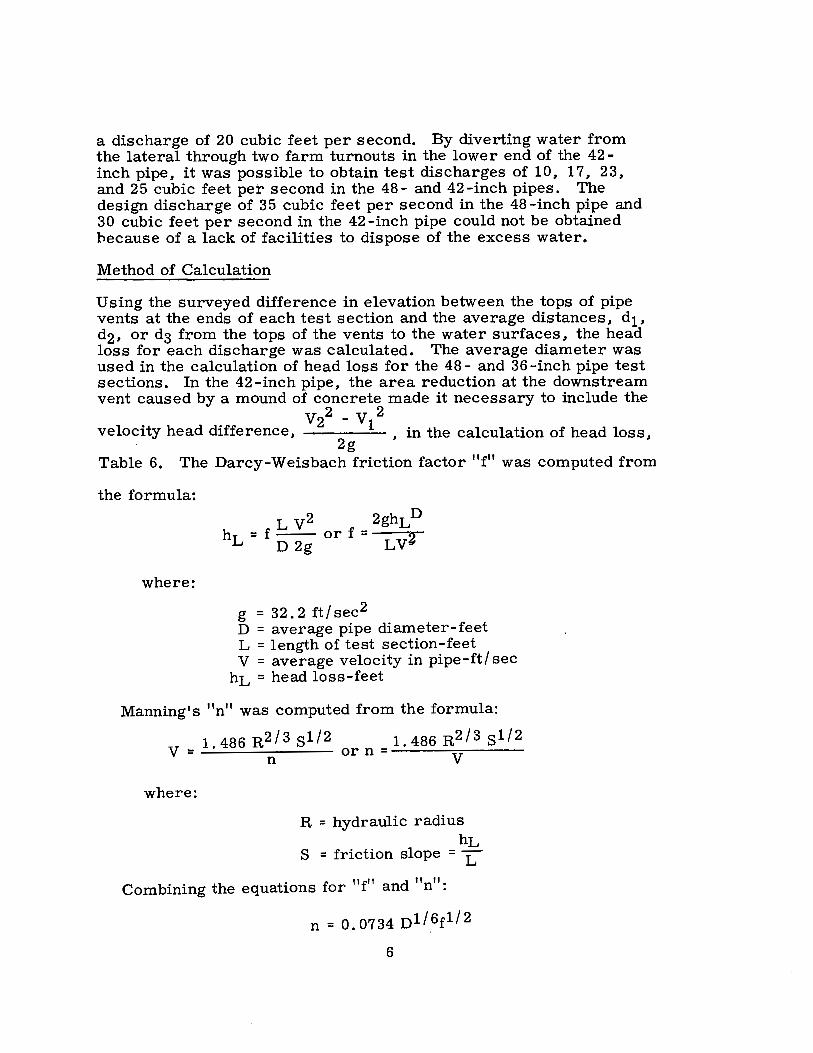
a discharge of 20 cubic feet per second. By diverting water from the lateral through two farm turnouts in the lower end of the 42-inch pipe. it was possible to obtain test discharges of 10, 17. 23, and 25 cubic feet per second in the 48- and 42-inch pipes. The design discharge of 35 cubic feet per second in the 48-inch pipe and 30 cubic feet per second in the 42-inch pipe could not be obtained 'because of a lack of facilities to dispose of the excess water.
Method of Calculation
Using the surveyed difference in elevation between the tops of pipe vents at the ends of each test section and the average distances, d1, d2, or d3 from the tops of the vents to the water surfaces, the head loss for each discharge was calculated. The average diameter was used in the calculation of head loss for the 48- and 36-inch pipe test sections. In the 42-inch pipe, the area reduction at the downstream vent caused by a mound of concrete made it necessary to include the
V22 -V12 velocity head difference. -----, in the calculation of head loss,
2g Table 6. The Darcy-Weisbach friction factor "f" was computed from
the formula:
where:
L y2 2ghLD hL = f -- or f = 2 D 2g LV
g = 32.2 ft/sec 2 D = average pipe diameter-feet L = length of test section-feet V = average velocity in pipe-ft/ sec
hL = head loss-feet
Manning's "n" was computed from the formula:
V = 1. 486 R2/3 51/2 n
1. 486 R2 / 3 s1 / 2 or n = ---....,,.,,,-----
V
where:
R = hydraulic radius hL
S = friction slope = L • f 11 f 11 d II II' Combining the equations or an n .
n = o. 0734 n1 /_6f112
6
Sam Peng
Sticky Note
None set by Sam Peng
Sam Peng
Sticky Note
MigrationNone set by Sam Peng
Sam Peng
Sticky Note
Unmarked set by Sam Peng
Sam Peng
Sticky Note
None set by Sam Peng
Sam Peng
Sticky Note
MigrationNone set by Sam Peng
Sam Peng
Sticky Note
Unmarked set by Sam Peng

LIBRARY
FEB -1 2012
The Scobey pire coefficient for concrete pipes was compute~tion the formula:2 Denver.CO
where:
Hf = friction loss per 1, 000 feet
di = pipe diameter in inches
DISCUSSION OF RESULTS
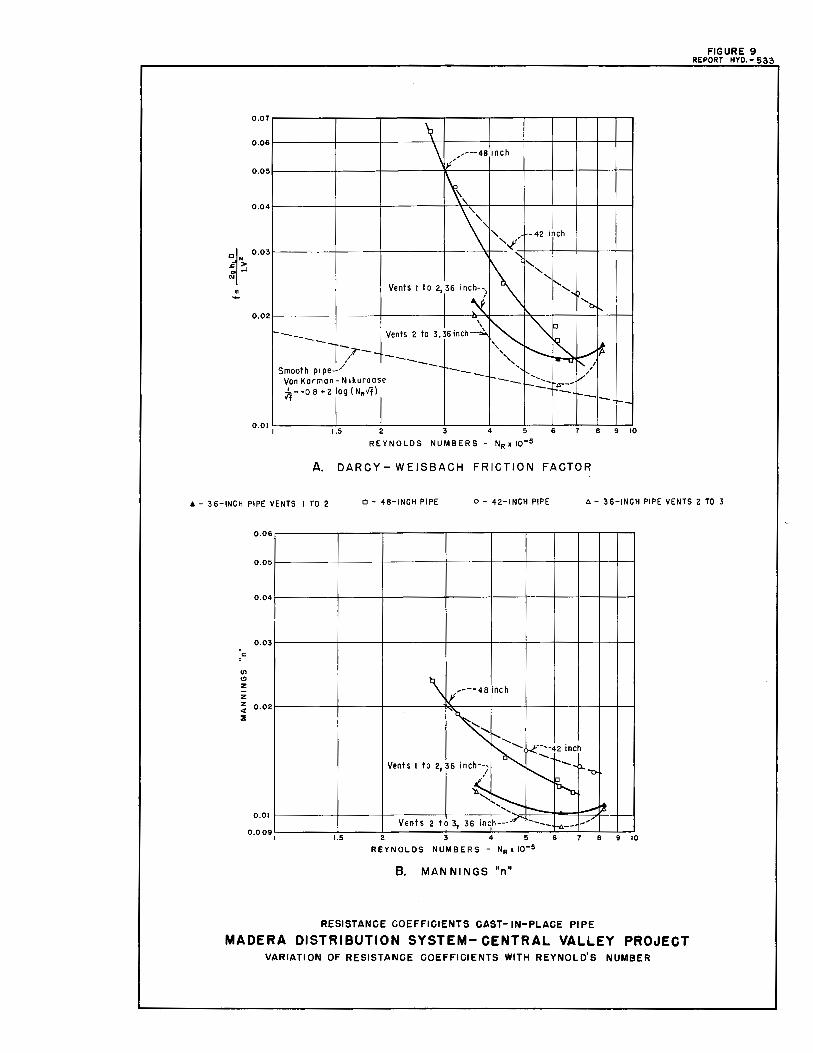
A summary of computed values of the Darcy-Weisbach rrf", Manning's "n", and Scobey resistance coefficient "Cs" for the three sizes of pipe is shown in Table A, below. Values for the 36-inch pipe were computed from the water surface elevations in the pipe sections between the three available air vents. Computations for friction factors and roughness coefficients are included in Table 6. Figure 9 shows the plot of "f" and "n" versus Reynold's number for the range of discharges.
Head losses in a pipe reach are caused essentially by two phenomena in the pipe; namely, by the development of the boundary layer in the region of flow establishment near the inlet and by the normal friction occurring in the region of constant pressure gradient. Losses per unit length in the upstream or developing segment are larger than for an equivalent length in fully established flow. The losses in the inlet segment over and above those losses in an equivalent length of pipe in fully established flow are sometimes referred to as "residual" losses and are attributable to entrance losses and boundary layer development. In this pipe distribution system the entrance losses may be additionally increased by the water flowing through the gate and over the gate head wall of the check structures, Figure 2. Head differentials measured in the region of boundary layer development will indicate higher head losses and will result in higher computed resistance coefficients.
Extensive data on friction factors in concrete pipe indicate that for 36-inch cast concrete pipe, a constant pressure gradient is established at a point about 95 to 100 feet from a bellmouth entrance.~/
2/King, H. W., "Handbook of Hydraulics." Third Edition, McGraw Rill. 1939. 3/Straub, L. G .• Bowers. C. E .• and Pilch, Meir, "Resistance to Flow in Two Types of Concrete Pipe." Technical Paper No. 22, Series B, St. Anthony Falls Hydraulic Laboratory. University of Minnesota, Minneapolis, Minnesota, December 1960, page 21.
7
Sam Peng
Sticky Note
None set by Sam Peng
Sam Peng
Sticky Note
MigrationNone set by Sam Peng
Sam Peng
Sticky Note
Unmarked set by Sam Peng
Sam Peng
Sticky Note
None set by Sam Peng
Sam Peng
Sticky Note
MigrationNone set by Sam Peng
Sam Peng
Sticky Note
Unmarked set by Sam Peng
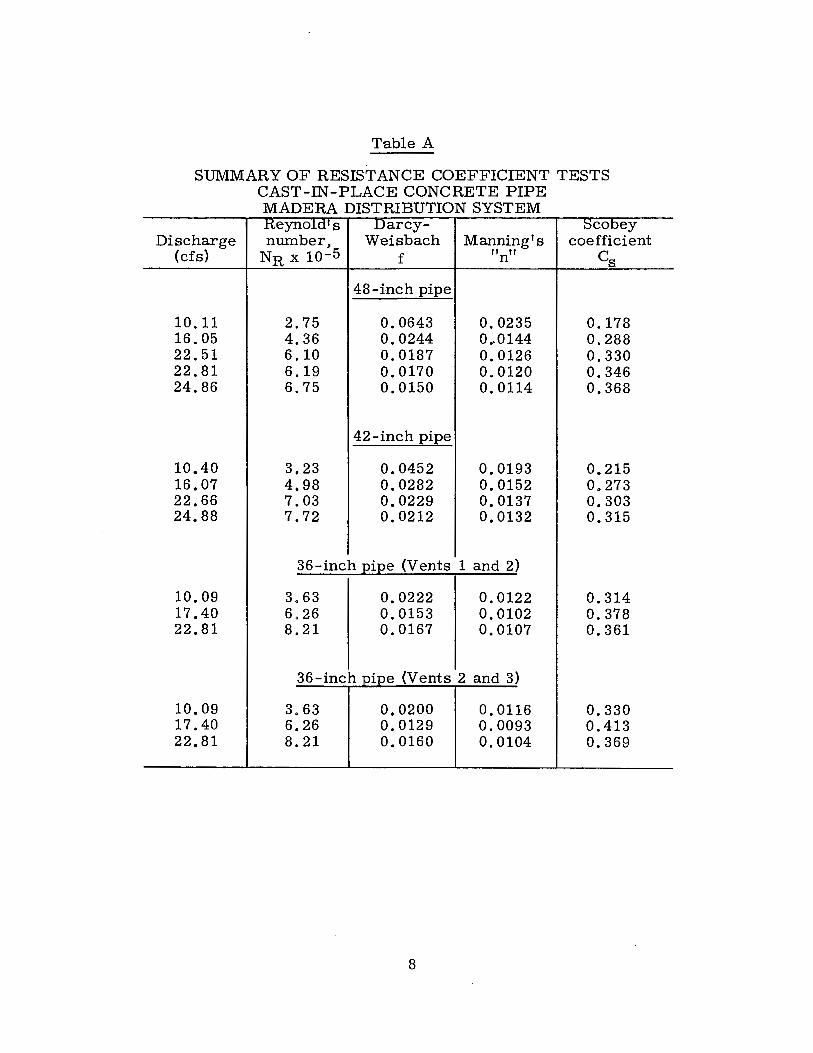
Table A
SUMMARY OF RESISTANCE COEFFICIENT TESTS CAST-IN-PLACE CONCRETE PIPE MADERA DISTRIBUTION SYSTEM .H.eynold1s Darcy- ;:;cooey
Discharge mnnber, Weisbach Manning's coefficient (cfs) NR x 10-5 f "n" cs
48-inch pipe
10.11 2.75 0.0643 0.0235 0.178 16.05 4.36 0.0244 0 •. 0144 0.288 22.51 6.10 0.0187 0.0126 0.330 22.81 6.19 0.0170 0.0120 0.346 24.86 6.75 0.0150 0.0114 0.368
42-inch pipe
10.40 3.23 0.0452 0.0193 0.215 16.07 4.98 0.0282 0.0152 0.273 22.66 7.03 0.0229 0.0137 0.303 24.88 7.72 0.0212 0.0132 0.315
36-inch pipe (Vents 1 and 2)
10.09 3.63 0.0222 0.0122 0.314 17.40 6.26 0.0153 0.0102 0.378 22.81 8.21 0.0167 0.0107 0.361
36-inch pipe (Vents 2 and 3)
10.09 3.63 0.0200 0.0116 0.330 17.40 6.26 0.0129 0.0093 0.413 22.81 8.21 0.0160 0.0104 0.369
8
Sam Peng
Sticky Note
None set by Sam Peng
Sam Peng
Sticky Note
MigrationNone set by Sam Peng
Sam Peng
Sticky Note
Unmarked set by Sam Peng
Sam Peng
Sticky Note
None set by Sam Peng
Sam Peng
Sticky Note
MigrationNone set by Sam Peng
Sam Peng
Sticky Note
Unmarked set by Sam Peng

A somewhat longer distance would be required for larger diameter pipes. 4/
Resistance coefficients for the 36-inch pipe were computed for the upstream reach between Vents 1 and 2 and for the downstream reach between Vents 2 and 3, Table A. A comparison of the results shows that the "f" values for the upstream reach are about 11 percent hi~her than those for the downstream reach and because Manning's "n' varies as the square root of "f". the corresponding "n" values are about 5 percent higher. Since the upstream air vent (Number 1) is only 53 feet downstream from the inlet and is, therefore, in the region of fl.ow development, head loss measurements in the 36-inch pipe using Vents 1 and 2 probably contain residual losses.
The upstream air vents used as piezometers in the 42- and 48-inch pipes were located 66 and 67 feet, respectively, downstream from the gate in the check structure. Therefore, the measured head losses using these air vents as piezometers may include some residual losses and may not be indicative of the friction loss in an equivalent length of pipe with a constant pressure gradient.
The air vents used as piezometers were of large diameter compared to the usual piezometer installations and some of the openings were not smoothly formed, Figure 4. It is, therefore, possible that the static heads indicated by the water surface elevations in the air vents were not the true pressure heads. However, the relative difference in water surface elevations using piezometers with openings of the same size and shape should be a reliable indication of the head loss between vents.
The results shown in Table A are based onpipe vent elevations determined from a precise survey made on each test reach. Head loss measurements on the 48- and 42-inch test reaches may contain some residual losses from the entrance, and the test reaches were quite short. The friction factors and Manning's nn" shown on Figure 9 and in Table A, for the 36-inch pipe between Vents 2 and 3 were computed from head losses which were not affected by residual losses and with a test reach approximately twice as long as for the other pipe sizes. Friction factors computed for this section of 36-inch pipe should correspond to those for fl.ow with a constant pressure gradient. The 48- 1 42-inch, and the section of 36-inch pipe between Vents 1 and 2 show larger resistance coefficients than the section of 36-inch between Vents 2 and 3 possibly because of residual losses included in the head loss measurements. The general slope of the
4/Keulegan1 Garbis H .• Research Report 6-B1 Highway Research Board1 December 1948.
9
Sam Peng
Sticky Note
None set by Sam Peng
Sam Peng
Sticky Note
MigrationNone set by Sam Peng
Sam Peng
Sticky Note
Unmarked set by Sam Peng
Sam Peng
Sticky Note
None set by Sam Peng
Sam Peng
Sticky Note
MigrationNone set by Sam Peng
Sam Peng
Sticky Note
Unmarked set by Sam Peng

curves is steeper than the classical Von Karman-Nikuradse resistance coefficient curve for smooth pipes, Figure 9, and is predominantly influenced by the high resistance coefficients found in each pipe for the lowest Reynold's numbers. Since high resistance coefficients for all pipes were found for the test discharge of about 10 cubic feet per second, it is possible that an error in discharge measurement occurred. However, no discrepancies could be found in the data or discharge calculations.
CONCLUSIONS
1. The upstream air vents used as piezometers in the three test reaches may be located in the region of boundary layer development; this may have resulted in higher head losses and in higher resistance coefficients than would occur in long reaches of similar pipe located well downstream from an entrance structure.
2. The resistance coefficients for the lower Reynold I s numbers, Table A and Figure 9, are larger than expected. However, a study of the data and the conditions accompanying the measurements made at the IO-cubic-foot-per-second discharge failed to disclose any discrepancy.
3. It is believed that head losses measured in the 48- and 42-inch pipe and in the upstream reach of the 36-inch pipe may contain residual losses resulting from entrance structure flow patterns but should be representative of pipe installations of similar configuration. Resistance coefficients computed for the 36-,-inch pipe, using the two downstream air vents as piezometers, should be representative of flow resistance coefficients for this pipe flowing with a constant pressure gradient.
4. The results of this study will be considerably more valuable if tests are repeated as the pipe ages and the program is continued on other distribution systems constructed of precast and cast-in-place pipe.
5. Piezometers should be included in future pipe installations to provide better facilities for the measurement of pressure head.
10
Sam Peng
Sticky Note
None set by Sam Peng
Sam Peng
Sticky Note
MigrationNone set by Sam Peng
Sam Peng
Sticky Note
Unmarked set by Sam Peng
Sam Peng
Sticky Note
None set by Sam Peng
Sam Peng
Sticky Note
MigrationNone set by Sam Peng
Sam Peng
Sticky Note
Unmarked set by Sam Peng

Table 1
MEASURED PIPE DIAMETERS Horizontal Vertical 45° 45° Averae-e
48-inch pipe Section 1 3,960 3.932 4.014 4.024 3.983 Section 2 4,040 4.063 4.074 4.024 4.050 Section 3 3.967 4.008 4.008 4.000 3.996
Average 4.010
42-inch pipe Section 1 3.496 3.517 3.520 3.493 3.507 Section 2 3.486 3.511 3.518 3,507 3.506 Section 3 3.521 3.531 3.500 3.485 3.509
Average 3.507
3 6-inch pipe Section 1 2.990 3,022 3.016 3.017 3.011 Section 2 2.990 3.093 3.103 3.033 3.055 Section 3 2.982 3,009 3,008 3.004 3.001
Average 3.022
Flow Resistance Coefficients Cast-in-place Pipe MADERA DISTRIBUTION SYSTEM--CENTRAL VALLEY PROJECT
Sam Peng
Sticky Note
None set by Sam Peng
Sam Peng
Sticky Note
MigrationNone set by Sam Peng
Sam Peng
Sticky Note
Unmarked set by Sam Peng
Sam Peng
Sticky Note
None set by Sam Peng
Sam Peng
Sticky Note
MigrationNone set by Sam Peng
Sam Peng
Sticky Note
Unmarked set by Sam Peng

neact H
0.643 0.644 0.656 0.881 0.882 0.931 1. 110 1. 115 1. 120 1. 188 1. 189
Table 2
COMPUTED WEIR DISCHARGES
Q = 3. 33 (L - 0. 2H) H3 /2 L = 6. 004 feet
(L - 0.2H) H3/2
5.875 0.516 5.875 0.517 5.873 0.532 5.828 0.827
~ 5.828 0.828 5.818 0.898 5.782 1. 169 5.781 1. 177 5.780 1.185 5.766 1. 295 5.766 1. 296
Flow Resistance Coefficients Cast-in-place Pipe
Q
10.09 10.11 10.40 16.05 16.07 17.40 22.51 22.66 22.81 24.86 24.88
MADERA DISTRIBUTION SYSTEM--CENTRAL VALLEY PROJECT
Sam Peng
Sticky Note
None set by Sam Peng
Sam Peng
Sticky Note
MigrationNone set by Sam Peng
Sam Peng
Sticky Note
Unmarked set by Sam Peng
Sam Peng
Sticky Note
None set by Sam Peng
Sam Peng
Sticky Note
MigrationNone set by Sam Peng
Sam Peng
Sticky Note
Unmarked set by Sam Peng

Date
10-24-63
10-24-63
10-24-63
10-25-63
-----
Sheet 1 of 2
Table 3
TAPE READINGS IN 48-INCH PIPE VENTS Elevation Pipe Vent 1 = 244. 240 Elevation Pipe Vent 2 = 242.570
Length of reach, Station 254+00 to Station 267+00 = 1,300 feet d D' t f f . = 1s ance rom top o pipe vent to water surface
Weir head Discharge d1 d2 feet cfs feet feet
6.926 6.932 5.462 6. 921 6.920 5.463
0.881 16.05 6.912 6.924 5.453 6.919 6.937 5.450 6.928 6.916 5.440
Total 69.235 54.533 Average 6.924 5.453
8.048 8.058 6.687 8.062 8.059 6.695 8.065 8.062 6.688 8.056 8.052 6.694
1. 110 22.51 8.053 8.058 6.697 8.065 8.063 6.694 8.060 8.062 6.667 8.067 8.068 6.701 8.065 8.066 6.695 8.070 8.070 6. 697
Total 161. 229 133.820 Average 8.062 6.691
8.100 8.090 6.698 8.076 8.089 6.702 8.100 8.089 6.698 8.088 8.091 6.697
1. 120 22.81 8.096 8.096 6.698 8.088 8.083 6.698 8.087 8.100 6.695 8.089 8.081 6.703 8.093 8.096 6.713 8.087 8.089 6.699
Total 161.808 133.976 Average 8.090 6.699
8.634 8.643 7.174 8.639 8.643 7.175 8.642 8.642 7. 177 8.642 8.647 7. 184 8.650 8.657 7. 196
0.644 10.11 8.654 8.653 7.198 8.655 8.656 7.198 8.659 8.655 7.188 8.652 8.650 7. 192 8.650 8.656 7. 194
Total 172.979 143.746 Average 8.649 7.187
------ ------- ----- --------- ----------
Flow Resistance Coefficients Cast-in-place Pipe MADERA DISTRIBUTION SYSTEM--CENTRAL VALLEY PROJECT
5.466 5.460 5.464 5.450 5.445
6.687 6.686 6.695 6.686 6.694 6. 66-8 6.699 6.698 6.692 6.700
6.697 6.694 6.690 6.701 6.692 6.694 6.695 6.698 6.704 6.710
7.177 7.177 7. 176 7. 185 7.193 7.198 7.191 7.190 7.185 7. 198
----
Sam Peng
Sticky Note
None set by Sam Peng
Sam Peng
Sticky Note
MigrationNone set by Sam Peng
Sam Peng
Sticky Note
Unmarked set by Sam Peng
Sam Peng
Sticky Note
None set by Sam Peng
Sam Peng
Sticky Note
MigrationNone set by Sam Peng
Sam Peng
Sticky Note
Unmarked set by Sam Peng

Sheet 2 of 2
Table 3--Continued
Weir head Discharge d1 d2 Date feet cfs ft ft
10-25-63 8,060 8,062 6,686 6,679 8,044 8.059 6,671 6.674 8.064 8.058 6.671 6.668 8,063 8.069 6,663 6.664 8,061 8.061 6.668 6,672 8.063 8.078 6.674 6.672
1. 188 24.86 8,073 8.075 6,680 6,685 8.070 8.076 6.682 7.001 8.085 8.060 6.694 6,689 8.075 8.057 6.688 6.685 8,062 8,073 6,680 6.682 8,073 8.073 6,680 6,688 8.069 8,062 6.689 6.696 8. 077 8,075 6.686 6,697 8,076 8. 071 6.690 6.689
Total 242,024 200,743 Average 8,067 6.691
Sam Peng
Sticky Note
None set by Sam Peng
Sam Peng
Sticky Note
MigrationNone set by Sam Peng
Sam Peng
Sticky Note
Unmarked set by Sam Peng
Sam Peng
Sticky Note
None set by Sam Peng
Sam Peng
Sticky Note
MigrationNone set by Sam Peng
Sam Peng
Sticky Note
Unmarked set by Sam Peng
Sheet 1 of 2
Date
10-24-63
10-24-63
10-25-63
Table 4
TAPE READINGS IN 42- INCH PIPE VENTS Elevation Pipe Vent 1 = 240. 790 Elevation Pipe Vent 2 = 239. 645
Length of reach, Station 280+60 to Station 293+00 = 1,240 feet d = Distance from top of pipe vent to water surface
Weir head Discharge d1 02 feet cfs feet feet
8.963 8.966 8.252 8.969 8.950 8.250
0.882 16.07 8.976 8.957 8.245 8.952 8.964 8.248 8.945 8.970 8.251
Total 89.612 82.459 Average 8.961 8.246
8.158 8.150 7. 715 8.166 8.186 7.710 8.157 8.176 7.722 8.141 8.170 7.726
1. 115 22.66 8.169 8.165 7.725 8.157 8.187 7.727 8.167 8.184 7. 718 8.189 8. 183 7.728 8.174 8. 190 7.724 8.183 8.200 7.718
Total 163.452 154.444 Average 8. 173 7.722
9.475 9.472 8. 611 9. 471 9.480 8.608 9.498 9.502 8.628 9.460 9.483 8.627 9.485 9.484 8.628 9.486 9.475 8.638 9.487 9.487 8.628 9.480 9.481 8.630
0.656 10. 40 9.474 9.488 8.620 9.472 9.484 8.620 9.408 9.477 8.622 9.480 9.484 8.626 9.491 9.498 8.624 9.480 9.468 8.636 9.466 9.490 8.625
Total 284.446 258.769 Average 9.482 8.626
-------------- ------- ---- __________ ,_,, ___ ------Flow Resistance Coefficients Cast-in-place Pipe
MADERA DISTRIBUTION SYSTEM--CENTRAL VALLEY PROJECT
8.247 8.240 8.252 8.236 8.238
7.719 7.722 7.728 7.722 7.722 7.719 7.730 7. 718 7.727 7.724
8.626 8.621 8.628 8.624 8.632 8.634 8.630 8.618 8. 623 8.619 8.629 8.633 8.638 8.623 8.620
----
Sam Peng
Sticky Note
None set by Sam Peng
Sam Peng
Sticky Note
MigrationNone set by Sam Peng
Sam Peng
Sticky Note
Unmarked set by Sam Peng
Sam Peng
Sticky Note
None set by Sam Peng
Sam Peng
Sticky Note
MigrationNone set by Sam Peng
Sam Peng
Sticky Note
Unmarked set by Sam Peng

Sheet 2 of 2 Table 4- - Continued
weir head U1scharge d1 d2 Date feet cfs feet feet
10-25-63 7.335 7.321 6.968 6.970 7.349 7.361 6.984 6.990 7.350 7.348 6.967 6.982 7.333 7.342 6.982 6.985
1.189 24.88 7.349 7. 339' 6.995 6.997 7.339 7.355 6.991 6.960 7.357 7.358 6.985 6.984 7.344 7.353 6. 971 6.984 7.358 7.342 6.983 6.982 7.357 7.355 6.970 6.956 7.339 7.364 7.001 7.000 7.367 7.376 6.985 6.990 7.358 7.350 6.979 6 .. 999 7.366 7.352 7.000 6.978 7.352 7.335 6.983 6.942
Total 220.504 209.463 Average 7.350 6.982
Sam Peng
Sticky Note
None set by Sam Peng
Sam Peng
Sticky Note
MigrationNone set by Sam Peng
Sam Peng
Sticky Note
Unmarked set by Sam Peng
Sam Peng
Sticky Note
None set by Sam Peng
Sam Peng
Sticky Note
MigrationNone set by Sam Peng
Sam Peng
Sticky Note
Unmarked set by Sam Peng
Sheet 1 of 2
Table 5
TAPE READINGS IN 36-INCH PIPE VENTS Elevation Pipe Vent 1 = 234. 697 Elevation Pipe Vent 2 = 233. 867 Elevation Pipe Vent 3 = 228. 740
Length of reach, Station 334+05 to Station 347+00 to Station 373+00 = 3,895 feet d = Distance from top of pipe vent to water surface
Weir head Discharge d1 d2 d3 Date feet cfs feet feet feet
10-24-63 8. 111 7.880 3.750 8.080 7.868 3.758 8.07 7.870 3.739 8.06 7.845 3.740
0. 931 17.40 8.07 7.840 3.718 8.02 7.830 3. 711 8.08 7.784 3.720 8.07 7.830 3.699 8.05 7.770 3.692
Total 80.671 78.365 37.245 Average 8.067 7.837 3.725
10-24-63 4,900 5.177 2.206 4.842 5. 178 2.214 4.828 5.154 2.201 4. 811 5.179 2.221 4.859 5.215 2.248 4.888 5.164 2.230 4.893 5.162 2.228 4.863 5. 178 2.226
1. 120 22.81 4.876 5.194 2.214 4.871 5.174 2.200 4.871 5. 168 2.202 4.894 5.158 2.209 4.901 5.157 2.238 4.945 5.185 2.200 4.898 5.167 2.200 4.882 5.178 2.230 4.859 5.194 2.212 4.868 5.160 2.235 4.901 5.171 2.202 4.868 5.190 2.213
Total 97.518 103.502 44.329 Average 4.876 5.175 2.216
-------------- --------------------- -----
Flow Resistance Coefficients Cast-in-place Pipe MADERA DISTRIBUTION SYSTEM--CENTRAL VALLEY PROJECT
Sam Peng
Sticky Note
None set by Sam Peng
Sam Peng
Sticky Note
MigrationNone set by Sam Peng
Sam Peng
Sticky Note
Unmarked set by Sam Peng
Sam Peng
Sticky Note
None set by Sam Peng
Sam Peng
Sticky Note
MigrationNone set by Sam Peng
Sam Peng
Sticky Note
Unmarked set by Sam Peng

Sheet 2 of 2
Table 5- - Continued
Weir head 1.J1Scharge a1 a2 a3 Date feet cfs feet feet feet
10-25-63 8.985 8.515 3.910 8.973 8.488 3.918 9.034 8.490 3.912 9.077 8.488 3.910 9.071 8.499 3.917 9.072 8.-494 3.922 9.063 8.505 3.906 9.042 8.515 3.905 9.078 8.525 3.938 9.048 8.530 3.900 9.047 8.532 3.942 9.056 8.520 3.919 9.044 8.524 3.927 9.047 8.548 3.927
0.643 10.09 9.062 8.544 3.914 9.091 8.526 3.919 9.084 8.520 3.945 9.069 8.502 3.938 9.100 8.533 3.923 9.098 8.554 3.910 9.037 8.515 9.057 8.506 9.088 8.522 9.056 8.492 9.062 8.520 9.060 8.527 9.017 8.535 9.031 8.514
8.540 8.531
Total 253.549 255.554 78.402 Average 9.055 8.518 3.920
Sam Peng
Sticky Note
None set by Sam Peng
Sam Peng
Sticky Note
MigrationNone set by Sam Peng
Sam Peng
Sticky Note
Unmarked set by Sam Peng
Sam Peng
Sticky Note
None set by Sam Peng
Sam Peng
Sticky Note
MigrationNone set by Sam Peng
Sam Peng
Sticky Note
Unmarked set by Sam Peng

Sheet 1 of 3 Table 6
RESISTANCE COEFFICIENT CALCULATIONS
48-inch Pipe
hL = Elevation 1 -Elevation 2 -d 1 +d2 Length = 1, 300 feet
= 244. 240 -242. 570 -(d1 -d2)
= 1. 670- (d1 -d2)
Area = 12. 63 ft 2 Average diameter (D) = 4. 010
Q V d 1 d2 hL f n
10. 11 0.801 8. 649 7.187 0.208 0.0643 0.0235 16.05 1. 271 6.924 5.453 0. 199 0.0244 0.0144 22.51 1. 782 8.062 6.691 0.299 0.0187 0.0126 22.81 1.806 8,090 6.699 0.279 0.0170 0.0120 24.86 1. 969 8.067 6.691 0.294 0.0150 0. 0114
n = o. 0734 n 116r1 / 2
Dl/6 = 1.261
Cs = Scobey coefficient for concrete pipes
di = diameter in inches
cs
0.178 0.288 0.330 0.346 0.368
C - V s - Hr°· 5di0. 625 Hf = friction loss per 1, 000 feet
VLO. 5
0. 2114 VL = hL0.5n0,625
L = length in 1, 000-foot increments
n0.625 = 2.384
LO. 5 = 1. 14
Flow Resistance Coefficients Cast-in-place Pipe MADERA DISTRIBUTION SYSTEM--CENTRAL VALLEY PROJECT
Sam Peng
Sticky Note
None set by Sam Peng
Sam Peng
Sticky Note
MigrationNone set by Sam Peng
Sam Peng
Sticky Note
Unmarked set by Sam Peng
Sam Peng
Sticky Note
None set by Sam Peng
Sam Peng
Sticky Note
MigrationNone set by Sam Peng
Sam Peng
Sticky Note
Unmarked set by Sam Peng
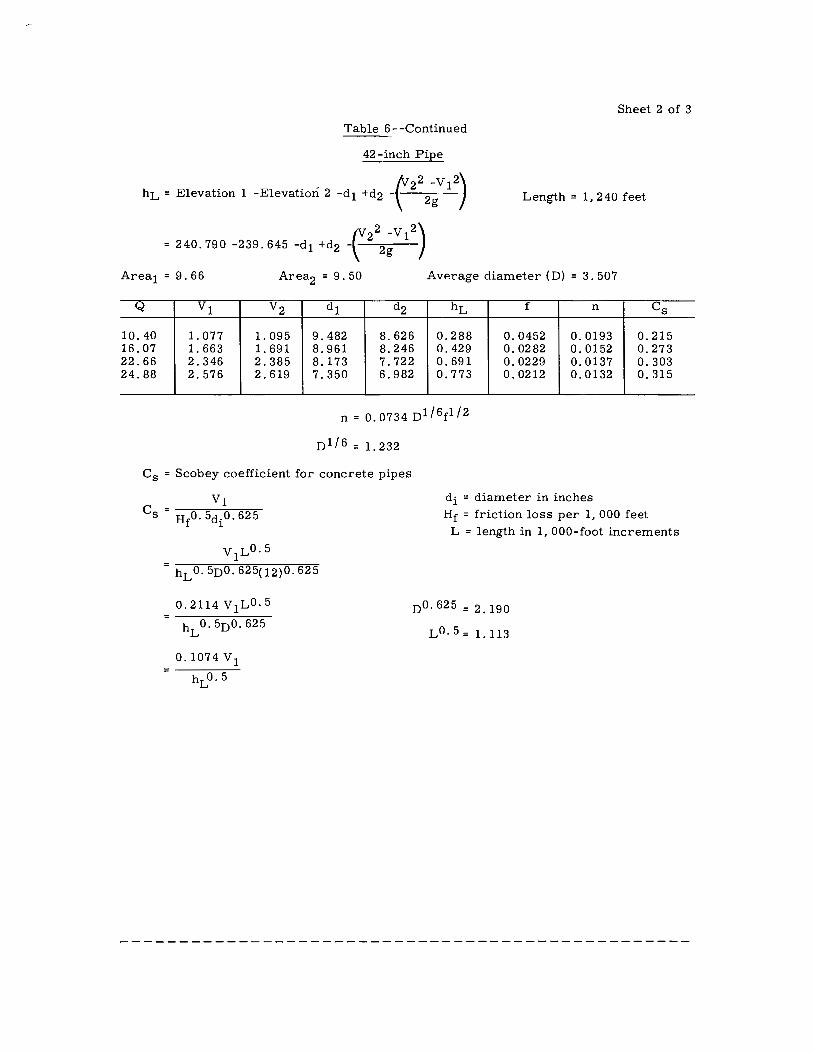
Table 6--Continued
42 -inch Pipe
Sheet 2 of 3
/!_22 -V12) hL = Elevation 1 -Elevation 2 -d1 +d2 -,- 2g Length = 1,240 feet
Area1 = 9. 66 Area2 = 9. 50 Average diameter (D) = 3. 507
Q Vl V2
10.40 1.077 1.095 16.07 1. 663 1.691 22.66 2. 346 2.385 24.88 2.576 2. 619
d1 d2 hL
9.482 8.626 0.288 8.961 8.246 0.429 8.173 7.722 o. 691 7.350 6.982 0.773
n = o.0734D116r112
0 1 / 6 =1.232
f n Cs
0.0452 0.0193 0.215 0.0282 0. 0152 0.273 0.0229 0.0137 0.303 0.0212 0.0132 0.315
C5 = Scobey coefficient for concrete pipes
0.2114 v1L0.5 =------
hL 0. 50 0. 625
0.1074V1 =----
hLO. 5
di = diameter in inches Hr = friction loss per 1, 000 feet
L = length in 1, 000-foot increments
oO. 625 = 2. 190
L0.5= 1.113
Sam Peng
Sticky Note
None set by Sam Peng
Sam Peng
Sticky Note
MigrationNone set by Sam Peng
Sam Peng
Sticky Note
Unmarked set by Sam Peng
Sam Peng
Sticky Note
None set by Sam Peng
Sam Peng
Sticky Note
MigrationNone set by Sam Peng
Sam Peng
Sticky Note
Unmarked set by Sam Peng
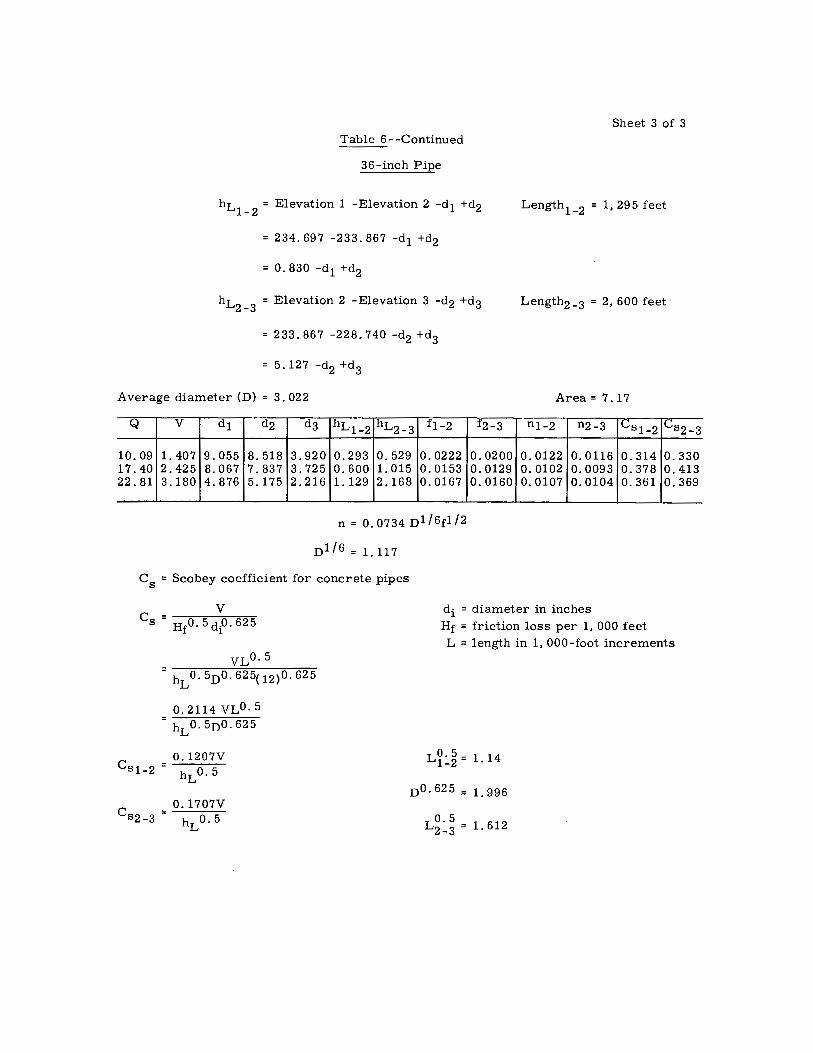
Table 6 - -Continued
36-inch Pipe
hL1 = Elevation 1 -Elevation 2 -d1 +d2 -2
= 234. 697 -233. 867 -di +d2
hL2 _3 = Elevation 2 -Elevation 3 -d2 +d3
= 233. 867 -228. 740 -d2 +d3
= 5.127 -d2 +d3
Average diameter (D) = 3. 022
Q V d1 d2
10. 09 1.407 9.055 8.518 17.40 2. 425 8.067 7.837 22.81 3.180 4.876 5.175
d3 hLl-2 hL2-3 f1-2
3. 920 0.293 0.529 0.0222 3.725 0.600 1.015 0.0153 2.216 1.129 2.168 0.0167
n = o. 0734 nl/6fl/2
n 116 = 1.111
Cs = Scobey coefficient for concrete pipes
f2-3
0.0200 0.0129 0.0160
Sheet 3 of 3
Length1 _2 = 1,295 feet
Length2 _3 = 2, 600 feet
Area= 7 .17
n1-2 n2-3 Csl-2 1Cs2 _3
0.0122 0. 0116 0.314 0.330 0.0102 0.0093 0.378 0.413 0.0107 0.0104 0.361 0.369
C - V di = diameter in inches s - Hfo. 5 dP· 625
= hL 0. 5n0. 625( 12)0. 625
0. 2114 VL0. 5 = hL 0. 5n0. 625
C _ 0.1207V s1-2- hL0.5
C = 0.1707V S2-3 h O 5
L"
Hf = friction loss per 1, 000 feet L = length in 1, 000-foot increments
L~:_~ = 1. 14
no. 625 = 1. 996
Lt~= 1. 612
c:I ~II
I
... " 361···
r··· 12 E ~- -,1 : T.11 s. I
T.12S. I
I , , I
10 £.
12
11'- -
31
" "' "'1
:1 'L I 1,-- ·-i-
1 '
!I 6
!
'I .l J_
I
! I
~Ii I -C-C32 · <>ij, c::, -~r "~"~ ~i! " ":r~~L • I '
_---11 - ~--==-4'1 · . --- . i . r[-j J36l 31 ~~ l~r,o-sorcten ~ I .r--· - ,c--- ,L _ "~ " J "'
I I
II
' - ' 0 • -' ! ' - - - - ' ' ' " ·- ,:: '
I -z-~ j' ' • " ' -- "
, _ i ' 1, -7 -- . 'I -~ • " -
~1--l·i j 7:rl __ J j1 I!~ __ [_ 1[ ]Cl~~! jJ,,;) Ir,, " [I - -7'.1Llii:~~ ll b '" I 1 ·~1>1"''-~! }~ 1"'.Hf. ' \ I
" "' .,
13
r ... ~
, - Jr J - J\_ r ,,,,,.~:,, ,, .. , ,, I - , J ~!I I[ 7[~ -1 j ____ ;~---
'\..__, ....,..11 [I ~rr---- ' ~'1 I 1 (a~,~M,l ""~ I : L....,
I
,
16
11
1
1
T , J= I L41',/"2-w5-0.5-,oi~"'~ .,, 10
1
:
I Ii'
11
I' /.~ I__ _ ::LA,5.2-14
5
-o.5-IB "~
0
c.-,... ---;int ,: . J i"L , ,, . , .. -r-- ' .. )!.... : ",·-. •:
rl!
, /'·•,:: "7 . ~ - ,-~ :~ .I /---if1 .. ~1 •· ..... '" 'u,:~· ;I r·1~ ,: ! • ,, " .......:
1
1 L -r -~ . . . . ,,.~.,. ,.. 1
, -.J' •• ,, " J _-;~ 11 ~r--- : ·. "~":'.;""' ~ ,.,,,1p1"''""f ~ -- -- ---.lk~-" -\~T"" : ; fJE1· ' : ,---21_ - I 11 --if- -) 11 LAl'.6.2-145:c-~\ 1',
,, ,, ,, .II,
.;V'
14 13 w11w 18
9fl ... --4-, .. _
- L._ I ~-I Jl - -'1 -~2----° : ,-~ ~ --==Jjl 11 ' ~>~--"----
: ... ___,1.. 1 7 -=__;: 1 · -- "_-c _ _,--...- 23 1 j , - . J" ,, w""' · r _ - ... I~ s __ J: ~J _ : ~---r -~,, ~·-;I -· _ _1 , I r~1
1
·' :~'.~-:r; --ii "~~--~
u,;;r---1,-a::;O::
" I
7~ L
. -1 6E -- L_
25 I 30 ,,_ -- 1,--JL=-- JI l~ --==--~_,_ -~H-!2 ... ~.} ~I ,.1 LAI'.
6
}
Ir· -- i' -1 ' 0 ~~ j _ :I 29--=-7~1~=--' i ,r•, .~;-15=·_;_·,1~---•1 ,.~+..~ I , !I! ll i1' I,,. il L_ , ,,~~---- , I : ..... r!rll Jl-Jk; :,
• - -~-~-~ - ! ' ~I--,j ILA[6 2--16.1' --- 27
_ms •"'" [' F~"~~ -, ' --- -~- 'r-===-- 11 I "'i----~
r.13s: ~'-... i~-,sy4;\ L. /-r------ --LATERAL62- 1'1:-_ - _34~- __ "'JI ~,1 - ___ ]111 _~ ~ I u- . . ' I . 18 TEST I 35 "' 7 - ,. .. ' .... -~J/..c¼ .,, SECTIONS 1-7 -,! I
•• ·- •• I ,r--·: '-'-'--'ct~·· =---· ..... ~ ~==1f__ -- ~-- ,I ""-"-....II e ! r-· :: -1- "'f -LI~ I . Yi '· • , , I 'I 1 -m., _ •••• ... IL , . __ .J
, , ·' " • -, , - - · L
llL, i , : JL-~ 1
~-~ .3. :: ~ ~·12~· ·~~
r-= =M0 'c'_ ·-~ ~;_:~r;~·:;f ': ' i - --- ~ ••'' : t--"·l I - ~ .. .-1:· ~~~;:~~:;·y L ___ ! ! /, o•"
7: . 9 I MAO~~.t~··// ii ~---~--~--~
L .L .• ~~ = =-=-- --·7_..,e-" fREs••
,,. 0 ''2 I --1
SCALE OF MI LES
11-.t 2
_ .£~A_J.1'_2Jl _
20
~ T.12S. T . .l.3S.
I
k:i,AT, ''-~!'
EXPLANATION - •••- DISTRICT BOUNDARY
-- BUREAU OF RECLAMATION BUILT LATERAL!:,
M. I. D. BUILT LATE:.RAL.S
_ o;i~c~tili~~~~5
1NcLUDED 1N THESE
• • • • • • p:1EpC:~~C~~gEiAi5Nr;~NE;:~s\\Ecl ~f c~\~6~ ~ _L, DELIVERY POINT
AS BIi/LT bY 2''4·, LETT!'.{' 7-3-f,2
UNITED STATES DEPARTMENT OF THE lfl/TERIOII
BUREAlJ OF RECLAMATION
CENTRAL. VAL.LEY PlfO.JECT - CAUF--ORNl'/I.
MADERA DISTRIBUTION SYSTcM - cXTcNSION
EXTENSION 2 LOCATION MAP
Sam Peng
Sticky Note
None set by Sam Peng
Sam Peng
Sticky Note
MigrationNone set by Sam Peng
Sam Peng
Sticky Note
Unmarked set by Sam Peng
Sam Peng
Sticky Note
None set by Sam Peng
Sam Peng
Sticky Note
MigrationNone set by Sam Peng
Sam Peng
Sticky Note
Unmarked set by Sam Peng

£ Turnout-----Ct>-r ' I I
'"' 11 ' "1t ' :8 :· i-4-,0 1
; 1--- ' ' - I I I
"' A T. s'-:
r------ , £ La/ere!--.. 1 Stat,on---r·-~---1· 'L-r~- + -u.11-------e·~·-\.j,....
FLOW , -->-
-----
Typical earner reinforcement--···
~r
See Detail A /~B":-< --3'-o'~- a"~-
-----+-t
·3 Walk planks. 3"x12"w1th 2· # x ,o" anchor bolts each end, each plank Project 2 f "_
· Provide cast iron slide go/es, lifts and anchor bolts, as required.
Cons true/ wa// here if turnout ,snot required---··"
r<:-_
L ----£ Turnout
C >-
For emoedment of precast pipe iil ll-, mono Ii/hie concrete see 214 -o- 2009 ~) 11°
'
PLAN
~- 2", 2 Recess
1il ,-#4@8"
'< '\· Min. Increase as
required for gate frame
'·---E/.C LONGITUDINAL SECTION FOR SLOPING CONNECTION
·-fl.D
Symm. about £
#4@12'.·-::·•
#4··
SECTION A-A
SECTION B-B
#4@12~-,~
2"x2''Recess,,
' '·.:-~_>-4 __ \~4@1z"
'. Equal to diameter of outlet pipe.
SECTION C-C
LATERAL STATION
INLET Pl PE iouTLET PIPE! TURNOUT
DIA. I I DIA- I ~,a=~, ~n DIA. (IN./
0/R.
ELEVATION
A 8 C
- +--- --+---+----+---
GATE DIMENSION AHEAD
HEAD FRAME
GL OR b h, h, I ATi'. HEIGHT (f T. I (FT.}
. --.. .1--- . .j__ - -· -+~--------l---_J___
·18! +-11.00 I 1-a I .oo .. ! +8 loooosrl z.1 I Rt, lz3s:Jz3a5J I 2'-w" I 4,c· ls'-o''l11'-3" I 8'-9"16.~ --l---/0
ESTIMATED QUANTITIES
CONCRETE RE/NF STEEL
(CU. YDS.) (LBS.)
--------10,6 1130
T
FIGURE 2 REPORT HYD 533
REMARKS
cl_c,_ 2z6+4t.63 48 -.0002s +8 .oo_J_~i.. Rt 1_z'·w" 4'-0#' s:..o" tt'-.}J' 8'-- 9" zo do 2S3 + 00 48· ·_00044 48 -.00/11 1 ~- Rt __ 2'w" 4-'-o" S'-_Q" ,, ·4" B'::!O' 7 0
d;· -- 2 T9 + 88.00 48 c00/7/ 4ZCD ·_00063 ?.4 Rt. ·- 2'-,;," 4-0 -C" S'-0" 13'-._," /l'-0" 9. 'r E do --=-=13()§_+£9._{)_~ __ 4Z _003_60 4Z:D _oooJ-24- F?t. . -~ z-:r· ~-9" 4-~6-;; 15'~5 13'-0" 114
do 3ZO+Z6.58 42. .oo 4Z~'c0008~ 3G Lt. f./-'·3" Z'-3" 'fCb" /3'-8' !f'-S" 9.9
_!O JD
__ /3_ 15
/3
i0,6
,0_5
12.4
14.2
I 2.. 7
1130 See ?14-0-20234
I/SD
,320
1520
1360
~
~JT-F45.00 ~ti6 1;;1::t:1:l nO.I BIS +13.00 36 - .00 36 .00 - ?.4--" 3'-6" 4-c.o;; 15~" /2'.JO" 11.5 +ZS+95.53 -. -- - -30 - f0.6
.,,._..,, W io ;,o- 30 _ ·"' 24 Lt W " m, J r-3" 2' 7, ,,_-;;., 12"-2" ;;,·-ii· 9 / i,__do
13
15 /4-! 2
See 2l4-D-20246 - ------
I3.I 1400 Se@ Z/4-0-20234 See 2/4·0-20247
1_0.2 II Oo
---------1-- --
--+---+-~ -+------L---
- ----+- ---+-~-----------+-------+-
TI 42"x 42" Casi-iron slide 9°,;e} :,;/ ether qc'es to be c:rcu:ar ~ 60''.x 60"
,J( I "
- ><-J
··ix /'Anchor bolls@ 18"max. 3 Bolts m,n each angle ProJect 1'.'
DETAIL A
rn ti,!
,.- ·o.• C • 0· C
~-~~
flT J m
T I I I
~--.-,.-, .... tJ ~--~ ... ~..:.LI
LONGITUDINAL SECTION FOR STRAIGHT CONNECTION
NOTES Un/es, otherwise shown, place reinforcement so that the clear
dis lance between face of concrete and nearest remforcement ,s 1-j mches,except that where concrete ,s placed aga,ns/ earth or rock, the m,n,mum clear distance shall be 2 inches.
Lap all bars 24 diameters at splices. Mono/1//,,c concrete des,gn based on a compressive strength of Jaco pounds per square mch at 28 days.
For deta//s of turnout see 214-0-20220 lhru20224
A max,mum of 20 feet of precasf concrete pressure pipe/825)'
shall be ,nstal!ed on each side of any structure
occurinq in o reaci/ of cast-in-place pipe, and a rubber qaskeled JOJn/ shall be prov,ded at or within 18 inches of the structure.
Anchor bolls la have square heads, hex nuts and cul washers.
'-'" REY <:,':, 23<
~~ ;u
"-1·'-iJI /,,,. A7 .- r.;-E::,,< f/iCJ"'1 5 ·-4.2?.i, -56,C / T ,"J
?£.~ :1&_;:; ( ,'"li'vM ~ ~ 18/r.'3 TCJ ::::.t±LL _____ _
~;;;- _:-;4 ------_ --·- --=~
~~ ~ $/. £D -dEck ·/WM 57:.:; i'J-,i-h~-0.:,. TO_,;' ---n.2
:c ~L.C:/, Af' J,5' -,'"'A. Jf: -l3c :/\,T. ,,;9-.;.c,, .JC:
~-~=---"--'-------,,.u""v"'", "r,=o--;s-:r,-:A-:r"",""sc-----------1
~ (] DE :i;;~ 5 NOTF o: ETC~E:;:. ~~~~~~OR '::5~ i@ ~~
CENTRAL VALLEY PROJECT-CALIFORNIA
MADERA DISTRIBUTION S'fSTEM·EXTENSION 2
~~, GATED CHECKS @~_ ~ii,~ ----------------------------1
h ~(::;
I~~ C".{\,
DRAWN ____ R_.1!.·!:" ____ 51JBMITTED- ____ ~ Z.P~~- ___ _ TRAC€0 _ _ -~ ~-!!· _ __ RECOMl"tleNDED _ ~
C>-IECKEO_~~ 8E..t>L.J'lil _APPROV£D _ __ - __ -___ 1_ ;&~:~~ c ... ,.,, g.,,."' •• "'.,,., •• ,.
D£NVeR. COLORADO, APRIL 5,196/ SHEET 2 0"'" 3 214-D-20243
Sam Peng
Sticky Note
None set by Sam Peng
Sam Peng
Sticky Note
MigrationNone set by Sam Peng
Sam Peng
Sticky Note
Unmarked set by Sam Peng
Sam Peng
Sticky Note
None set by Sam Peng
Sam Peng
Sticky Note
MigrationNone set by Sam Peng
Sam Peng
Sticky Note
Unmarked set by Sam Peng

\ I
FIGURE 3. RE PORT HYD- 533
A. GATED CHECK STRUCTURE AND 10-INCH DIAMETER AIR VENT
Concrete encasement--
~--t Lateral
I N.G.S.:-,, '
---10" Dia:- a Ga. steel pipe (see Dwg. 214-0-20074}
,-1411 Dia.cone. irrig. pipe I
,'
____ Concrete
~~~,,~~i':t:~itr~~i, ~= ===-=~~j 'I \ " - :· encasement -~-- , . I i Slope up 3 inches.l \~-24 --,.., ·: -+- :· \\,Flexible connections) . \
. ' ' ',,_ 10" Cement asbestos pipe class A 25
·-,·---Cast in place concrete pipe
8. OFFSET AIR VENT IN CAST-IN-PLACE CONCRETE PIPE
RESISTANCE COEFFICIENTS OAS T- IN- PLACE PIPE MADERA DISTRIBUTION SYSTEM-CENTRAL VALLEY PROJECT
TYPICAL GATED CHECK STRUCTURE AND PIPE VENT
Sam Peng
Sticky Note
None set by Sam Peng
Sam Peng
Sticky Note
MigrationNone set by Sam Peng
Sam Peng
Sticky Note
Unmarked set by Sam Peng
Sam Peng
Sticky Note
None set by Sam Peng
Sam Peng
Sticky Note
MigrationNone set by Sam Peng
Sam Peng
Sticky Note
Unmarked set by Sam Peng

Figure 4 Report Hyd-5 3 3
A. Vent in crown (light area) of 42-inch cast-inplace pipe, showing slight mortar protrusions, Station 293+00.
B. Vent in crown of 48-inch cast-in-place pipe, smooth mortar, Station 254+00.
Flow resistance coefficients cast-in-place pipe MADERA DISTRIBUTION SYSTEM- -CENTRAL VALLEY PROJ;ECT
Pipe vents and pipe interior surfaces
Sam Peng
Sticky Note
None set by Sam Peng
Sam Peng
Sticky Note
MigrationNone set by Sam Peng
Sam Peng
Sticky Note
Unmarked set by Sam Peng
Sam Peng
Sticky Note
None set by Sam Peng
Sam Peng
Sticky Note
MigrationNone set by Sam Peng
Sam Peng
Sticky Note
Unmarked set by Sam Peng

A. Surface of 36-inch cast-in-place pipe near Station 334+05, direction of flow away from the viewer.
B. Surface of 48-inch cast-in-place pipe showing mortared offsets near Station 260+50, direction of flow is toward the viewer.
Flow resistance coefficients cast-in-place pipe
Figure 5 Report Hyd-533
MADERA DISTRIBUTION SYSTEM- -CENTRAL VALLEY PROJECT Inside pipe surfaces and offsets
Sam Peng
Sticky Note
None set by Sam Peng
Sam Peng
Sticky Note
MigrationNone set by Sam Peng
Sam Peng
Sticky Note
Unmarked set by Sam Peng
Sam Peng
Sticky Note
None set by Sam Peng
Sam Peng
Sticky Note
MigrationNone set by Sam Peng
Sam Peng
Sticky Note
Unmarked set by Sam Peng

Figure 6 Report Hyd-5 3 3
A. Six-foot-long fully contracted rectangular weir and head gage- installed at road crossing transition structure, Station 173+80.
B. Weir performance with discharge of 24. 9 cf s.
Flow resistance coefficients cast-in-place pipe MADERA DISTRIBUTION SYSTEM--CENTRAL VALLEY PROJECT
Weir installation
Sam Peng
Sticky Note
None set by Sam Peng
Sam Peng
Sticky Note
MigrationNone set by Sam Peng
Sam Peng
Sticky Note
Unmarked set by Sam Peng
Sam Peng
Sticky Note
None set by Sam Peng
Sam Peng
Sticky Note
MigrationNone set by Sam Peng
Sam Peng
Sticky Note
Unmarked set by Sam Peng
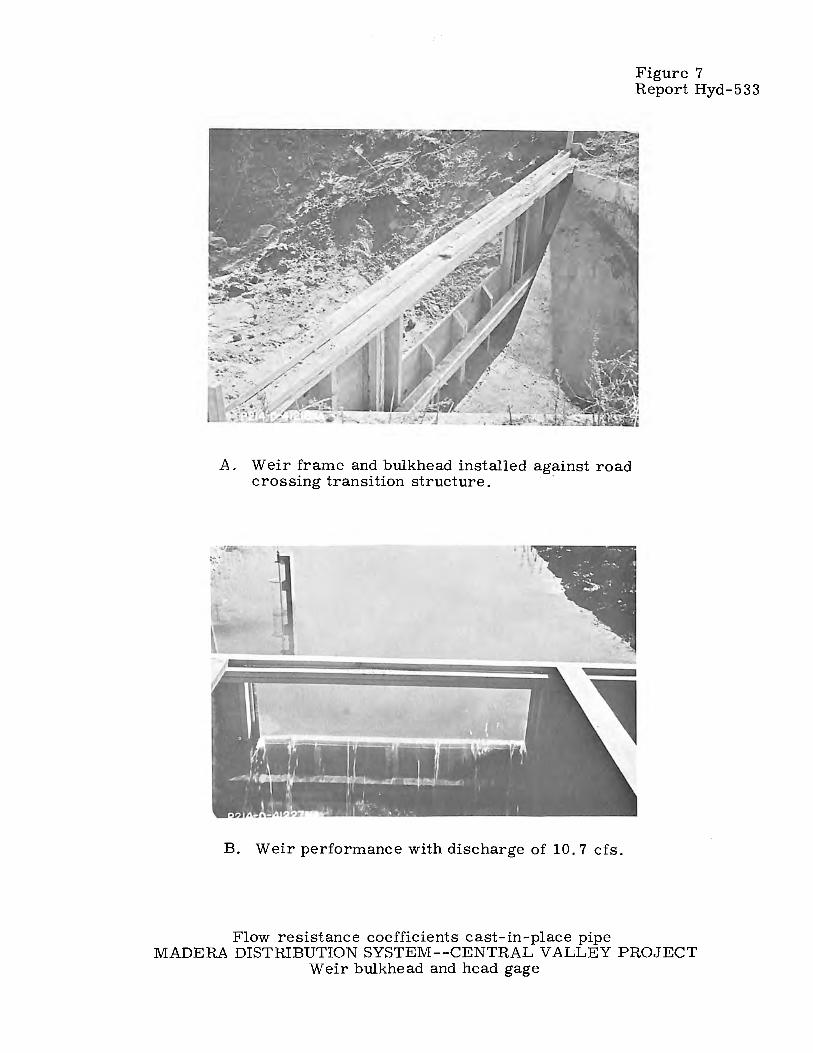
A. Weir frame and bulkhead installed against road crossing transition structure. ·
B. Weir performance with discharge of 10. 7 cfs.
Flow resistance coefficients cast-in-place pipe
Figure 7 Report Hyd-533
MADERA DISTRIBUTION SYSTEM--CENTRAL VALLEY PROJECT Weir bulkhead and head gage
Sam Peng
Sticky Note
None set by Sam Peng
Sam Peng
Sticky Note
MigrationNone set by Sam Peng
Sam Peng
Sticky Note
Unmarked set by Sam Peng
Sam Peng
Sticky Note
None set by Sam Peng
Sam Peng
Sticky Note
MigrationNone set by Sam Peng
Sam Peng
Sticky Note
Unmarked set by Sam Peng
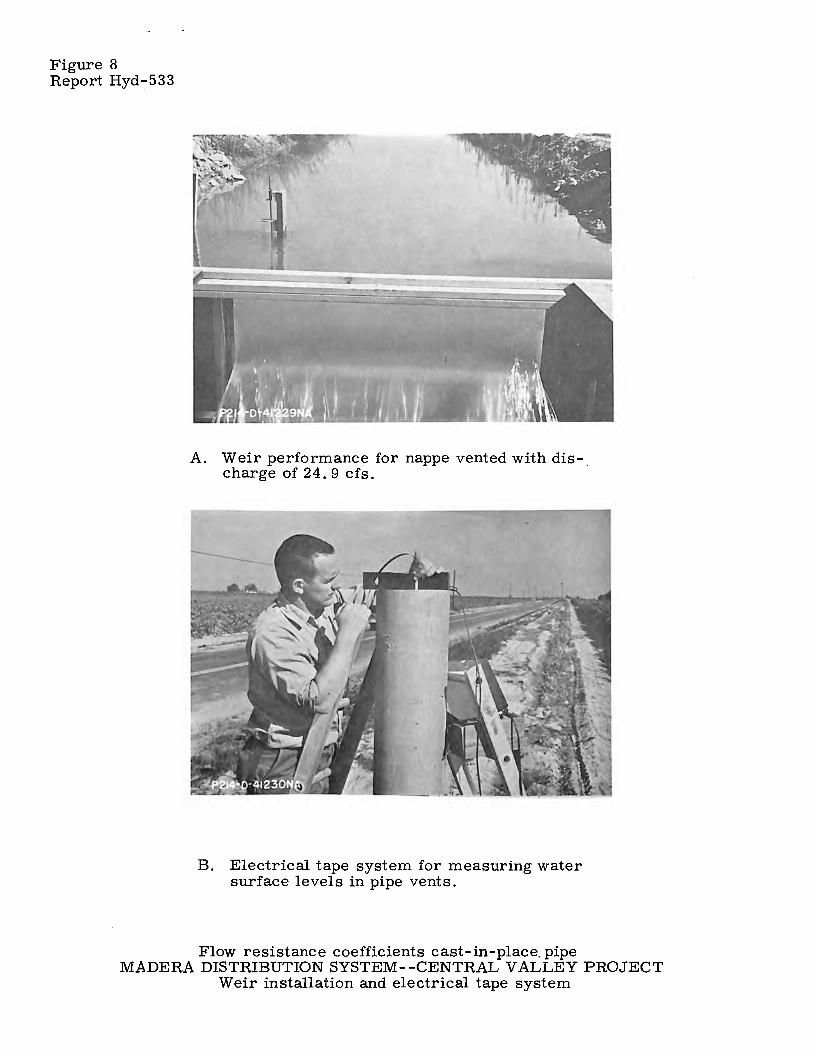
Figure 8 Report Hyd- 5 3 3
A. Weir performance for nappe vented with dis-. charge of 24. 9 cfs.
B. Electrical tape system for measuring water surface levels in pipe vents.
Flow resistance coefficients cast-in-place. pipe MADERA DISTRIBUTION SYSTEM--CENTRAL VALLEY PROJECT Weir installation and electrical tape system
Sam Peng
Sticky Note
None set by Sam Peng
Sam Peng
Sticky Note
MigrationNone set by Sam Peng
Sam Peng
Sticky Note
Unmarked set by Sam Peng
Sam Peng
Sticky Note
None set by Sam Peng
Sam Peng
Sticky Note
MigrationNone set by Sam Peng
Sam Peng
Sticky Note
Unmarked set by Sam Peng
0.07 .------,-------r-------r---,----,--,---,-,----,,--,
Q~N 0.03 J::; > "'..J
"' ' " -
----,/;,-- -----Smooth pipe--/ ---
Von Kormon-N ikurodse --7,Q-0.8 +2 log (NRJf}
O.O I L-----1 L.5---2'--------3'-----4'---------c5--6'------:7,-----,8~....J9,----,10
REYNOLDS NUMBERS - NR x 10-5
A. DARCY- WEISBACH FRICTION FACTOR
FIGURE 9 REPORT HYO. - 533
• - 36-INCH PIPE VENTS I TO 2 o - 48-INCH PIPE o - 42-INCH PIPE t> - 36-INCH PIPE VENTS 2 TO 3
<J)
<!)
z z
0.06
0.05
0.04
0.03
~ 0.02 :::E
0.01
0.0091
\ t ,---4e inch
-~
~ ,<"-·-42 inch
Vents I to 2, 36 inch--) -.... ~----~ ~ ~ "~ "t>-
----.__ ...... t
Vents 2 to 37 36 inc,h----" ---- -o--_, ,
1.5 2 3 4 5 6 7 8 9 10
REYNOLDS NUMBERS - NRx 10-5
8. MANNINGS "n"
RESISTANCE COEFFICIENTS CAST- IN-PLACE PIPE
MADERA DISTRIBUTION SYSTEM- CENTRAL VALLEY PROJECT VARIATION OF RESISTANCE COEFFICIENTS WITH REYNOLD'S NUMBER
Sam Peng
Sticky Note
None set by Sam Peng
Sam Peng
Sticky Note
MigrationNone set by Sam Peng
Sam Peng
Sticky Note
Unmarked set by Sam Peng
Sam Peng
Sticky Note
None set by Sam Peng
Sam Peng
Sticky Note
MigrationNone set by Sam Peng
Sam Peng
Sticky Note
Unmarked set by Sam Peng

7-1750 (10-64)
CONVERSION FACTORS-BRITISH TO METRIC UNITS OF MEASUREMENT
The following conversion factors adopted by the Bureau of Reclamation are those published by the American Society for Testing and Materials (ASTM Metric Practice Guide, Januscy 1964) except that additional factors (*) canmcmly used in the Bureau have been added. Further discussion of definitions of quantities and units is given on pages 10-ll of the ASTMMetric Practice Guide.
The metric units and conversion factors adopted by the AS'.IM are based on the "International System of Units" (designated SI for Systems International d 1Unites), fixed by the International Committee for Weights and Measures; this system is also known as the Giorgi or MKSA (meter-kilogram (mass)-second-ampere) system. This system has been adopted by the International Organization for standardization in ISO Recanmendation R-Jl.
The metric technical unit of force is the kilogram-force; this is the force which, when applied to a boey- having a mass of 1 kg, gives it an acceleration of 9.80665 m/sec/sec, the standard acceleration of free fall toward the earth's center for sea level at 45 deg latitude. The metric unit of force in SI units is the newton (N), which is defined as that force which, when applied to a boey- having a mass of 1 kg, gives it an acceleration of 1 m/sec/sec. These units must be distinguished from the {inconstant) local weight of a boey- having a mass of 1 kg; that is, the weight of a boey- is that force with which a boey- is attracted to the ~h and is equal to the mass of a boey- multiplied by the acceleration due to gravity. However, because it is general practice to use "pound" rather than the technically correct term "pound-force," the term "kilogram" (or derived mass unit) has been used in this guide instead of "kilogram-force" in expressing the conversion factors for forces. The newton unit of force will find increasing use, and is essential in SI units.
Mil. Inches
Feet.
Multiply
Yards ••••• Miles (statute)
Square inches. Square fget.
Square yards Acres .•••
Square miles
Cubic inches Cubic feet. Cubic yards.
Fluid ounces ( U .s. )
Liquid pints (U.S.)
Quarts (u.s.).
Gallons (U.S.)
Gallons (U.K.)
Cubic feet • Cubic yards Acre-feet.
Table 1
Q!JANTITIFS AND UNITS OF SPACE
By
LENGTH
25.4 (e~tly). 25.4 (exactly) •• 2.54 (exactly}*
JQ.48 (exactly) • 0.3048 (exactly)* • 0 .0003048 (exactly)* 0.9144 (exactly) •
1,609.344 (exactly)*. 1.609344 (exactly)
AREA
6.4516 (exactly) 929.03 (exactly)* ••
0. 092903 (exactly) 0.836127 • 0.40469't •
4,046.9* •• 0 .0040469* 2.58999 ••
VOLUME
16.3871 •• 0.0283168 0.764555.
CAPACITY
29.5737 •• 29.5729 •• 0.473179. 0.473166.
9,463.58 •• 0.946358.
3, 785.43* •• 3.78543 • 3.78533 • 0.00378543* 4.54609 4.54596
28.3160. 764.55*
•, 1,233.5* • 1,233,500*
To obtain
• Micron • Millimeters • Centimeters • Centimeters • Meters • Kilometers • Meters • Meters • Kilometers
• Square centimeters • Square centimeters • Square meters • Square meters • Hectares • Square meters • Square kilometers • Square kilometers
• Cubic centimeters Cubic meters
• Cubic meters
• Cubic centimeters • Ml.llili ters • Cubic decimeters • Liters • Cubic centimeters • Liters • Cubic centimeters • Cubic decimeters • Liters • Cubic meters • Cubic decimeters • Liters • Liters • Liters • Cubic meters . Liters
Sam Peng
Sticky Note
None set by Sam Peng
Sam Peng
Sticky Note
MigrationNone set by Sam Peng
Sam Peng
Sticky Note
Unmarked set by Sam Peng
Sam Peng
Sticky Note
None set by Sam Peng
Sam Peng
Sticky Note
MigrationNone set by Sam Peng
Sam Peng
Sticky Note
Unmarked set by Sam Peng

~
QUANTITIES .AIID UNITS OF MECHANIC&
Multiply
Grains (l/7,000 lb) ••• Troy ounces (480 grains). OUnces (avdp) • • •• Pounds (avdp) •••• Short tons (2,000 lb)
Long tons (2 1240 lb)
Pounds per square inch
Pounds per square foot
OUnces per cubic inch • • • Pounds per cubic foot • • •
Tona (long) per cubic jYard •
OUnces per gallan (U.S.). OUnces per gallan (U.K.). Pounds per gallan ( U .s. ) . Pounds per gallan (U.K.).
Inch-pounds
Foot-pounds
Foot-pounds per inch OUnce-inches
Feet per second
Feet per year • MLles per hour
J1'eet....P9!: secg,,d.2
~
MASS
64. '19891 (exactly) • 31.1035 •••••• 28.3495 ••••••• 0.45359237 (axactJ.y)
907.185 •• • 0.907185 • .l,016.05 •••••
FORCELAREA
O.CY10307. 0.689476 • 4.88243 •
47.8803 ••
MASS/VOLUME (DENSITY)
1.72999 • 16.0185 • ·• 0.0160185 1.32894. '
MASS/CAPACITY
7.4893 •••• • 6.2362 •••••
119.829 • 99.779 •••••
BENDING MlMENT OR TORQDE
~:~fx·w6· 0.138255 ••• 1.35582 X 10⁷ 5.4431 •
72~Q08 ••• , VELOCITY
30.48 (exactcy) •• 0.3048 (axact~* 0.96587) X 10 • 1.609344 (exactcy) 0.44704 (axactg)
AC~TIQ_N* 0.3048* .••
nm
To obtain
• Milligrams • Grams • Grams • Kil.ogre.ma • Kilograms • Motric tcms • Kilograms
• Kilograms per square centimeter • Newtana per square centimeter • Kilograms per square m,ter • Newtons per sguu•,u111rter
• Grams per cubic centimeter • Kilograms per cubic meter • Grams per cubic centim>ter ~-~----E!!!'. cubic centime_ter
• Grams per liter • Grams per 11 ter • Grams per liter • Grams per liter
• Meter-kilograms • Centimeter-dynes • Meter-kilograms • Cent:lmeter-dynes • Centim>ter-kilograma per centimeter _._ llram-cent:lme]8ra
• Centimeters per seoand • Meters per secand • Centim>tera per secand • Kilameters per hour • Meters per second
_._J,le~!'.!!....P9r secand'2'
cubic feet per seoand ( second-feet) • • • • • • • • • • • • 0.028317*. • CUl>ic meters per secand
CUbic feet per minute • • • • • 0.4719 • • • Liters per secand Gallons (U.S.) per minute • • • 0.06309 • • Liters per second _____ _
Mul.tipl.y
Pounds
British thermal units (Btu).
Btu per pound. l1'QOt-l!!!.!!!!!!!,.
Horsepower • • Btu per hour • Foot-~r second
Btu in./hr ft2 deg F (k, thermal conductivi-cy-)
Btu tt/hr ft2 deg F • • : : Btu/llr tt2 deg F ( C, themal
conductance) • • • • • • •
Deg F hr ft2/Bt,;_ (R; ~~ resistance) • • • • • • • • •
Btu/lb deg F (c, heat capaci-cy-). Btu/lb deg F • • • • • • • • • • rt2/hr ( thermal diff'usi vi-cy-)
Grains/hr tt2 ( water vapor transmissian) • • • • • •
Perms ( permeance) • • • • • Perm-inches (permeability)
Mul.tiR!l, cubic feet per square foot per
de;y ( seepege) • • • • • • • • Pound-seoands per square foot
I!)'
FORCE*
0.453592* ••• 4.4482* •••• 4.4482 X 10⁻⁵* •
WORK ANP ENEBGY*
• 0.252* ••••• • 1,055.06 •••••• • 2.326 (exactcy).
1,15~_.__.___._
POWER 745.700 •••
0.293071 • 1.35582 •
~ TJWIS1'ER_
1.442 • 0.1240 • 1.4880*
0.568 4.882
1.761 4.1868 • 1.000* • 0.2581 •• 0.09290* •
WATER VAPOR TRANSMISSION
16.7 • 0.659 l,fil_._
~ OTHER QUANTITIES .AIID UNITS
~
304.8* •••
(viscosi-cy-) ••••••••••• Square feet per second (viscosi-cy-) Fahrenhe:l:t degrees (change)* •
4.8824* ••••• 0.02903* (exactcy) 5/9 exactcy. 0.03937. Vol ts per mil. • • • • • • • •
Lumens per square foot (foot-candles)
Ohm-circular mils per foot MLllicuries per cubic foot MLlliamps per square foot Gallons per square yard Pounds "Jl!.r inch.
10.764 • 0.001662
35.3147* • 10.7639* •
4.527219* 0.17858* •
Kilograms Newtons Bm!,s
To obtain
• Kilogram calories • Joules • Jatles per gram • Joules
• Watts • Watts , watts
• Milliwatts/cm deg C • Kg cal/hr m deg C • Kg cal m/hr ui1- deg C
• M:l.lliwatts/cm2 deg C • Kg cal/hr ui1- deg C
• Deg C olfi1./milliwatt • J/g deg C • Cai/pam deg C • cui1-/sec ~
• Grams/24 hr ui1-• Metric perms ~Metric..l!!!.rm-csntim>t_ers
To obtain
• Liters per square m,ter per de;y
• Kilogram secand per square meter • Square m>ters per second • Celsius or Kelvin degrees (change)* • Kilovolts per millim>ter
• Lumena per square m>ter • Ohm-square millim>ters per m>ter • M:l.llicuries per cubic m>ter • M:l.lliamps per square m>ter • Liters per square m,ter • Kilograms per centimeter
GP0845-237
Sam Peng
Sticky Note
None set by Sam Peng
Sam Peng
Sticky Note
MigrationNone set by Sam Peng
Sam Peng
Sticky Note
Unmarked set by Sam Peng
Sam Peng
Sticky Note
None set by Sam Peng
Sam Peng
Sticky Note
MigrationNone set by Sam Peng
Sam Peng
Sticky Note
Unmarked set by Sam Peng

ABSTRACT
Hydraulic resistance coefficients ~ere determined from head loss measurements made in 48-, 42-, and 36-inch-diameter cast-inplace concrete pipe installations. Data were obtained with the pipes flowing full at discharges less than the design values; from about 10 cubic feet per second to 25 cubic feet per second. Pipe test reaches varied from 1, 240 to 3, 895 feet; The hydraulic grade line was measured in 10-inch-diameter air vents used as piezometers; discharges were measured using a rectangular weir. Sufficient data were obtained to calculate flow resistance coefficients using the Darcy-Weisbach, Manning, and Scobey equations. The flow / resistance coefficients for the 48- and 42-inch pipe and one reach of 36-inch pipe may contain residual losses produced by pipe entrance flow patterns, but the resistance coefficients for one reach of 36-inch pipe are believed to be representative of the values to be expected in long straight reaches.
ABSTRACT
Hydraulic resistance coefficients were determined from head loss measurements made in 48-, 42-, and 36-inch-diameter cast-inplace concrete pipe installations. Data were obtained with the pipes flowing full at discharges less than the design values; from about 10 cubic feet per second to 25 cubic feet per second. Pipe test reaches varied from 1, 240 to 3, 895 feet. The hydraulic grade line was measured in 10-inch-diameter air vents used as piezometers; discharges were measured using a rectangular weir. Sufficient data were obtained to calculate flow resistance coefficients using the Darcy-Weisbach, Manning, and Scobey equations. The flow resistance coefficients for the 48- and 42-inch pipe and one reach of 36-inch pipe may contain residual losses produced by pipe entrance flow patterns, but the resistance coefficients for one reach of 36-inch pipe are believed to be representative of the values to be expected in long straight reaches.
j
I I I I I
· I
I
ABSTRACT
Hydraulic resistance coefficients were determined from head loss measurements made in 48-, 42-, and 36-inch-diameter cast-inplace concrete pipe installations, Data were obtained with the pipes flowing full at discharges less than the design values; from about 10 cubic feet per second to 25 cubic feet per second. Pipe test reaches varied from 1, 240 to 3, 895 feet. The hydraulic grade line was measured in 10-inch-diameter air vents used as piezometers; discharges were measured using a rectangular weir. Sufficient data were obtained to calculate flow resistance coefficients using the Darcy-Weisbach, Manning, and Scobey equations. The flow resistance coefficients for the 48- and 42-inch pipe and one reach of 36-inch pipe may contain residual losses produced by pipe entrance flow patterns, but the resistance coefficients for one reach of 36-inch pipe are believed to be representative of the values to be expected in long straight reaches.
ABSTRACT
Hydraulic resistance coefficients were determined from head loss measurements made in 48-, 42-, and 36-inch-diameter cast-inplace concrete pipe installations. Data were obtained with the pipes flowing full at discharges less than the design values; from about 10 cubic feet per second to 25 cubic feet per second. Pipe test reaches varied from 1, 240 to 3, 895 feet. The hydraulic grade line was measured in 10-inch-diameter air vents used as piezometers; discharges were measured using a rectangular weir. Sufficient data were obtained to calculate flow resistance coefficients using the Darcy-Weisbach, Manning, and Scobey equations. The flow resistance coefficients for the 48- and 42-inch pipe and one reach of 36-inch pipe may contain residual losses produced by pipe entrance flow patterns, but the resistance coefficients for one reach of 36-inch pipe are believed to be representative of the values to be expected in long straight reaches.
Sam Peng
Sticky Note
None set by Sam Peng
Sam Peng
Sticky Note
MigrationNone set by Sam Peng
Sam Peng
Sticky Note
Unmarked set by Sam Peng
Sam Peng
Sticky Note
None set by Sam Peng
Sam Peng
Sticky Note
MigrationNone set by Sam Peng
Sam Peng
Sticky Note
Unmarked set by Sam Peng

HYD-533 Brockway, C. E. FLOW RESISTANCE COEFFICIENTS OF THREE SIZES OF CASTIN-PLACE CONCRETE PIPE Laboratory Report, Bureau of Reclamation, Denver, 33 p, 7 tables, 6 photos, 3 figures, 1964
DESCRJPTORS--Head losses/ Manning formula/ Darcy-Weisbach formula/ pipelines/ roughness coefficients/ pressure conduits/ concrete pipes
IDENTIFIERS--Cast-in-place pipe/ Madera Distribution System
HYD-533 Brockway. C. E. FLOW RESISTANCE COEFFICIENTS OF THREE SIZES OF CASTIN-PLACE CONCRETE PIPE Laboratory Report, Bureau of Reclamation, Denver, 33 p, 7 tables, 6 photos, 3 figures, 1964
DESCRJPTORS--Head losses/ Manning formula/ Darcy-Weisbach formula/ pipelines/ roughness coefficients/ pressure conduits/ concrete pipes
IDENTIFIERS--Cast-in-place pipe/ Madera Distribution System
HYD-533 Brockway, C. E. FLOW RESISTANCE COEFFICIENTS OF THREE SIZES OF CASTIN-PLACE CONCRETE PIPE Laboratory Report, Bureau of Reclamation, Denver, 33 p, 7 tables, 6 photos, 3 figures, 1964
DESCRJPTORS--Head losses/ Manning formula/ Darcy-Weisbach formula/ pipelines/ roughness coefficients/ pressure conduits/ concrete pipes
IDENTIFIERS--Cast-in-place pipe/ Madera Distribution System
Sam Peng
Sticky Note
None set by Sam Peng
Sam Peng
Sticky Note
MigrationNone set by Sam Peng
Sam Peng
Sticky Note
Unmarked set by Sam Peng
Sam Peng
Sticky Note
None set by Sam Peng
Sam Peng
Sticky Note
MigrationNone set by Sam Peng
Sam Peng
Sticky Note
Unmarked set by Sam Peng