21).-9 117 -* A R - ERIC · 21).-9 117-* A R. SE 035 926. I.,. ... include difficulty during...
259
DOCUSENT RES1ME 21).-9 117 -* A R SE 035 926 I . , . 14714 . Rater Quality 6 Pollutant Source Monitoring: Field' .and Laboratory Procedures. Trainihg Manual.. INSTITUTION. Office of- Water Program' Operations (EPA144vGincinnati,.- ;Ohio. National Training and Operational Technology . . Center. . IEPORT O. EPA-430/1..81-008r * RUB DATE, Mar 81 NOTE 262p. ° AVAILABLE FROM EPA Instructional Resources Center, 1200 Chambers . H RA., 3rd Floor, Columbus, 68.43212 ($1.00 pius;$0.63 per page). , . .. "EDRS PRICE MF01/PC11 Plu's Postage. - , DtsgBIRToRs Biologica*Sdienbesvaelistry; *Field Studies; *laboratory Procedures; *Measuremenf; Postsecondary Education; Scieice,4ducation; *Water Pollution;,Water Resources 41K - . IDENTIFIERS lnalytical,Methods; Bacteriology; *Monitoring; *Water Quality Water Sampling Standards . .- - ABSTEACT- * : * . . s This training manual presents material on techniques and ipstrumentation used to develop data in field monitoring programs and related labspatory operations concerned with water quality and oillution oatore4+- Topics include: collection and handling of samples ;, bacteriological, biolbgical, ind.40Semical field and laboratory methods: field.instrumentationvand flog measurements. The manual is designed for personnel engaged in programs concerned with monitoring the quality of surfape waters. Chapters include reading _materials,. labothtory activities, and' reference materials. (CO) . . O y. Oa. 4 .***************************************i.****************f************** * Reproductions supplied by EDRS are the best that can be made * * from -the original document. . * *********************************"************************************** . ,.., 3
Transcript of 21).-9 117 -* A R - ERIC · 21).-9 117-* A R. SE 035 926. I.,. ... include difficulty during...

DOCUSENT RES1ME
21).-9 117 -* A R SE 035 926I
. ,.
14714 . Rater Quality 6 Pollutant Source Monitoring: Field'.and Laboratory Procedures. Trainihg Manual..
INSTITUTION. Office of- Water Program' Operations (EPA144vGincinnati,.-;Ohio. National Training and Operational Technology
. .
Center. .
IEPORT O. EPA-430/1..81-008r*RUB DATE, Mar 81
NOTE 262p. °
AVAILABLE FROM EPA Instructional Resources Center, 1200 Chambers. H RA., 3rd Floor, Columbus, 68.43212 ($1.00 pius;$0.63
per page)., .
..
"EDRS PRICE MF01/PC11 Plu's Postage. - ,
DtsgBIRToRs Biologica*Sdienbesvaelistry; *Field Studies;*laboratory Procedures; *Measuremenf; PostsecondaryEducation; Scieice,4ducation; *Water Pollution;,WaterResources 41K - .
IDENTIFIERS lnalytical,Methods; Bacteriology; *Monitoring; *WaterQuality Water Sampling Standards . .- -
ABSTEACT-*
: *.
.
s This training manual presents material on techniquesand ipstrumentation used to develop data in field monitoring programsand related labspatory operations concerned with water quality andoillution oatore4+- Topics include: collection and handling ofsamples ;, bacteriological, biolbgical, ind.40Semical field andlaboratory methods: field.instrumentationvand flog measurements. Themanual is designed for personnel engaged in programs concerned withmonitoring the quality of surfape waters. Chapters include reading
_materials,. labothtory activities, and' reference materials. (CO)
. .
O
y.
Oa.
4
.***************************************i.****************f*************** Reproductions supplied by EDRS are the best that can be made ** from -the original document. . **********************************"**************************************
. ,..,
3

tl
a
United Stite's , National TrainingEnvironmental Protection and OperationalAgency Technology Center
Cincinnati OH 45268
EPA-430/1-81-008March 1981 '
'Water
Water QualityPoilutant SourceMonitoring: Field andLaboratory Procedures
Training Manual
f
rl
9
U S DEPARTMENT OF EDUCATIONNATIONAL INSTITUTE OF EDUCATION
EDUCATIONAL RESOURCES INFORMATION
...
CENTER (ERIC)
)(This document has been reproduced ascoved from the person or organization
originating itMinor changes have been made to improvereproduction quality
Points of view or dpiritons stated in this documerit ao not necessarily represent official ME
poster or'policy
4
._
_.....1111111

EPA-430/1-81-008March 1981
Water Quality & Pollutant Source Monitoring:. Field and Laboratory Procedures
This course is designed for personnel engaged in.programsconcerned with monitoring the quality of stfrface waters.Int li-disciplinary needs and responsibilities in the accum-ulation and interpretation of data from field and laboratoryactivities are emphasized.
3
.
Upon completion of the course the student will be able toapply suitable methods, techniques, and\instrtimentation-
, used.in field sampling and measurements, and will befamiliar with basic laboratory techniques and proceduresin the chemical, biological, 'and bacteriological areas.Advantages and limitations of equipment, methods 'andtechniques will be considered.
U. S. ENVIRONMENTALPROTECTION AGENCYOffice of Water Program - Operations
National Training and Operational Technology Center

DISCLAIMER
I
I
Reference to commercial products, trade names, or
manufacturers is for purposes of example and illUstration.
Such references do not constitute endoisement by the
Office of Water Program Operations,' U. S. Environzhental
II
1
o
e
Protection Agency.
0
4
1

0
. t.
1
Title or Description
I SaMpling and Flow Measurements
Flow Measurement I
Sampling in Water Quality Studies 2
Sampling tiandliiig - F'ield through Laboratory
I
.,
CONTENTS ,4
14\ Outline Number
4
Collection and Handling of Samples for Bacteriological Examination
e .
Biological Field Methods .
II 'Aluatic Biology I'
.
The Aquatic Environment
, Effect of Wastewater Treatment Plant Effluent on Small Streams. .
HI Chemistry, \
Methodology for Chemical Analysis of Water and Wastewater
4
5.
6
Specific Conductance , 9
Calibration aid Use of a Conductivity Meter 110
I
Dissolved Oxygen Determinatioi by Electronic Measurement 1 11
Laboratory Procedure for Dissolved Oxygen Winkler Method -:Azide Modification 0 12
...
Dissolved Oxygen - Factors Affecting DO Concentration in Water 13
BiochemiCal Oxygen Demand Test Procedures 14
, 'BiocliemCial Oxygen Demand Test Dilution Technique 15
f Operating Characteristics and Use of the pH Meter 16
.,. Turbidity 17
0
1
.., G
.
41
°5
/
..
,, .
CONTENTS
Title or Description
Calibration and Use of a Turbidmeter (Nephelometer)
Chemical Oxygen Demand and COD/BOD RelationshiPS
Laboratory Procedures for Routine' Level Chemical Oxygen Demand
Outline Number
18
19
20
Phosphorus in the Aqueous Environment 21
Use of a Spectrophotometer
Chemical Tests, Observations, and' Measurements in the Field
IV Bacteriology
Bacteriological Indicators of Water Pollution "4-
Examination of Water for Conform and Fecal Streptoccus Groups
Detailed Membrane Filter Methods
o
O
O
1
I
O
22
23
24
25
26

1
1
- FLOW MEASUREMENT
INTRODUCTION I
A' Flow measurements are among the ,
more important data collected derirlga water quality ,survey. Such measure-nients arellsed to interpret data varia-tions; calculate loadings, and expediteSurvey-planning. If the analysis ofsurvey data involves estimation of loads,the accurate measurement of discharge B'assumes a level of importance equal tothat of laboratory and analytical results.
In the folloiving discussion, proceduresfor measurement of stream flow andwaste discharge are described. Someof these procedures are used in long-term, very detailed water quality andSupply studies; others are more suitedto short-term pollution surveys.
B In accordance with,EPA policy, units inthis outline are expressed in the metricsystem. The equivalent English systemunits appear in parentheses followingthe metrie:designation.__Tables extract-/ed 'from the literature have been left inthe form in which they were originallygiven. Applicable conversion factors'appear in Section IV of this outline.
II PLANNING
A Station Location
Four factbis influence location of gaugingor flow measurement- stations:
1 Surve 'objectives.
2 Piny cal accessibility
.3 characteristics of the stream bed
4 Hydrologic effects
Survey objectives represent the majorinfluencetin station location; dependinguporbobjectives, gauging stations may belbcate above and/ or below confluencesarid buttalls:
Physical accessibility determines the.:ease and cost of installation and main-tenance of the station. The characteristics'of the stream bed may greatly influencethe obtainable accuracy of measurement.For instance, roctcy bbttoms greatlyreduce the accuracy of current meters.Sedimentation in pools behind control
structures may influence stage-dischargerelationships. Hydrologic variations instream flow may cause washout or bypassof the gauging station. In the Southwest,flash floods have been known to wash outor bypass gauging stations by assumingdifferent ch nels of flow.
Methodology
Choice of a specific measurement pro7cedure is dependent upon at least threeconsiderations:
1 The relation-between obtainable anddesired accuracy
2 Overall cost of measurement
3 The quantity of flow- to be measured
Ideally; discharge measurements sholitldbe reported to a specific degree of accuracythe gauging procedure greatly influences-this accuracy, The, influence of overallcoat on the gauging program is readily
_apparent Extensive, detailed studies areusually characterized by highcoststorautomatic instrumentation and low personnelcost; the opposite is usually true for lessdetailed Studies. The range, of .flows to bemeasured (within acceptable accuracy) is,of course, not known priorlo the survey.However, experienced personnel usuallycan make reasonable estimates of expectedflows from visual observations and otherdata,. and may recommend appropriategauging procedures. In this regard,experienced persordiel.always should beconsulted. _
MEASUREMENT
A. .Streams, Rivers, and'Open Channels1 Current Meter
The current meter is a deirice formeasuring the velocity of a flowing bodyof water. The stream cross section isdivided into a number of smaller, sections;and the average velocity ineach sectionis determined. The discharge, is thenfound by summing the products. of areaand velocity of each section.
2 Stage-discharge telEitionships
Large flows usually are measured bydevelopment of-and reference to a stage-,discharge curve; this procedure haolongbeen used by the U.. S. Geolog'ical SurveySuch gauging stations are composed of a
I-1
'FLOW iASUREMENT
control structure located downstream ofthe 'location of measurement and sometype of water level indicator which iden-tifies the height of the water surfaceabove a previously determined datum.
3 Weirs
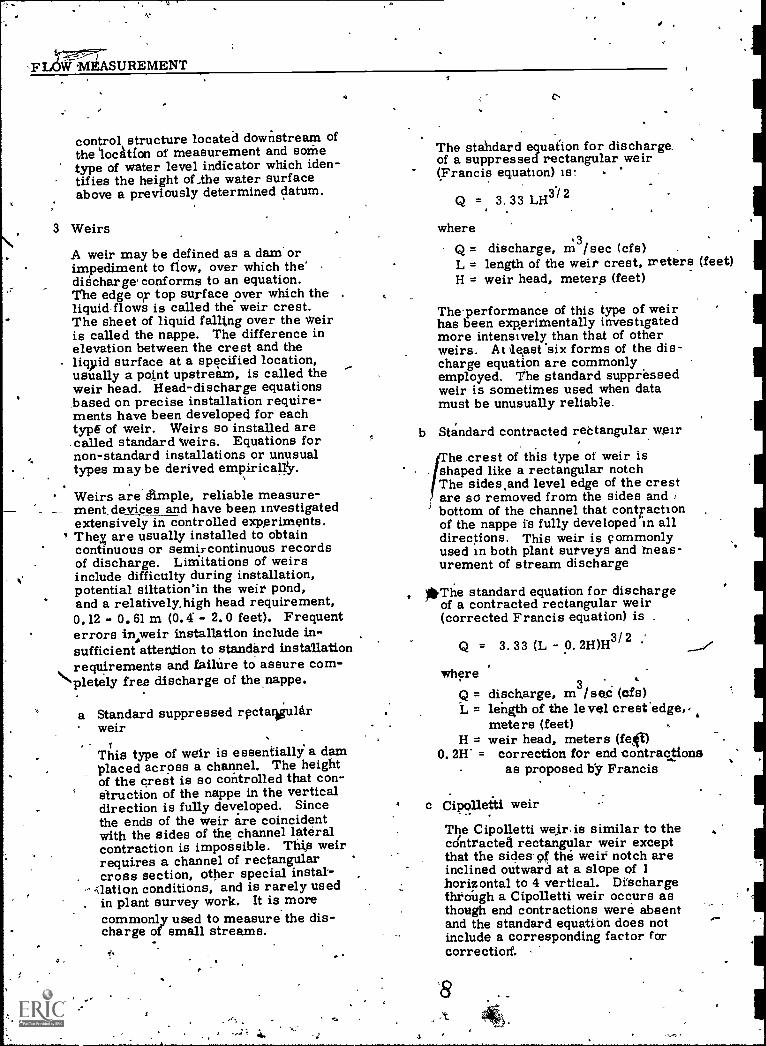
A weir may be defined as a dam' orimpediment to flow, over which the'diScharge conforms to an equation.The edge or top surface over which-theliquid-flows is called the weir crest.The sheet of liquid falling over the Weiris called the nappe. The difference inelevation between the crest and thelivid surface at a specified location,usually a point upstream, is called theweir head. Head-discharge equationsbased on precise installation require-ments have been developed for eachtype of weir. Weirs so installed are.called standard weirs. Equations fornon-standard installations or unusualtypes maybe derived empirically.
Weirs are simple, reliable measure-- merit devices and have been investigated
extensively in controlled experiments.° Thex are usually installed to obtain
continuous or semircontinuous recordsof discharge. Limitations of weirsinclude difficulty during installation,potential siltation'in the weir pond,and a relatively, high head requirement,0.12 - 0. 61 m (0. - 2. 0 feet). Frequenterrors inweir installation include in-sufficient atten.tion to standard installationrequirements and failure to assure com-
'pletely free discharge of the nappe.
a Standard suppressed rectaigultirweir
$ y
This type of weir is essentially a damplaced across a channel. The heightof the crest is so controlled that con-struct -ion of the nappe in the verticaldirection is fully developed. Sincethe ends of the weir are coincidentwith the sides of the channel lateral.contraction is impossible. This weirrequires a channel of rectangular
. cross section, other special instal-----dation conditions, and is rarely used. in plant survey work. It is more
commonly used to measure the dis-charge of small streams.
The standard equation for discharge.of a suppressed rectangular weir(Francis equation) is: '
Q = 3.33 LH3/ 2
whereQ = discharge, m3 /sec (cfs)L = length of the weir crest, meters (feet)H = weir head, meters (feet)
Theperformance of this type of weirhas been experimentally investigatedmore intensively than that of otherweirs. At least 'six forms of the dis-charge equation are commonlyemployed. The standard suppressedweir is sometimes used when datamust be unusually reliable.
b StE;ndard contracted rectangular weir
fhe .crest of this type of weir is. Shaped like a rectangular notch
The sidestand level edge of the crestare so removed from the sides andbottom of the channel that contractionof the nappe is fully developed in alldirections. This weir is commonlyused in both plant surveys and meas-urement of stream discharge
*The standard equation for dischargeof a contracted rectangular weir(corrected Francis equation) is .
Q = 3.33 (L - O. 2H)H3/ 2 -
whereQ = discharge, m3 /sec (cfs)L = length of the level crest edgep
meters (feet)H = weir head, meters (fee)
0. 2W = correction for end contractionsas proposed by Francis
c Cipolletti weirThe Cipolletti weiris similar to thecontracted rectangular weir exceptthat the sides of the weir. notch areinclined outward at a slope of 1horizontal to 4 vertical. Dischargethrongh a Cipolletti weir occurs asthough end contractions were absentand the standard equation does notinclude a corresponding factor forcorrectiorf.

a
FLOW MEASUREMENTS
4
` 'The standard equation ,foi, dischargethrough a Cipolletti weiroi
.Q =1-3.367 LH
3/2.
where 'Q = discharge, m3 /sec (cfs)
L = length of the level crest edge,meters(feet)
H = weir head, meters.(feet)
The discharge of a Cipollettiweir exceeds that of a suppressedrectangular weir of equal crestlength by approximately 1 percent.
d Triangular weirs
The crest of a triangular weir isshaped like a V-notch with sides!equally inclined from the vertical.The central angle of the notch isnormally 60 or 90 degrees. Sincethe triangular weir develops morehead at a given discharge than doesa rectangulat4 shape, it is especiallyUseful for measurement of small orvarying flow. It is preferred fordisCharges less than 28 .L/sec(1 cfs), is'as, accurate as otherghapes up to 280 L/sec (10 ofs), andis commonly used in plant surveys.
The standard equation for dischargeof a 90° triangular weir (Coneformula) is
Q =12: 49H2* 48
where3Q = discharge, m /sec (cfs)
H = weir head, meters (feet)
Crest height and head are measuredto and from the point of the notch,respectively.
e Accuracy and ,installationrequirements
1
Quotations of weir accuracy expressthe difference in performance betweentwo purportedly identical weirs anddo not include the effects of randomerror In rhjaasurement of head. Weirsinstalled Ccording to the followingspecifications should :measure dis-charge within + 5% of the valuesobserved when the previously citedstandard equations were developed.
1) The upstream face of the bulkheadand/or weir plate shall be smooth,and in a vertical plane perpendicularto the axis of the channel.
2)' The crest edge shall be level, shallhave a square upstream corner,and shall not exceed 2 mxn,(0.08 in)in thickness. If the weir plate is
, thicker than the prescribed crestthickness the downstream cornerof the 'Crest shall be relieved by a45,0 chamfer.
3) The pressure under the peshall be atmospheric. Th maxi-mum water surface in the 'down-stream/channel shall be at least60 1nm (0.2 ft.) below the weir _
crest. Vents shall be providAd atthe ends of standard suppressedweirs to admit air to the spacebeneath the nappe.
a
1-3

Flow Measurement
1-4
.3
4) The'approach channel shall bestraight and of uniform crosssection for a distance above theweir of 15 to 20 times the maximumhead, or shall be so baffled that a.normal distribution of velocitiesexists in the flowapproaching thecrest and the water surface at theoint of head measurement is free
of sturbances. The cross-sect_onal area of the approachchannel shall be at least 6 timesthe maximum area of tht nappe atthe crest.
1
5) The height of the crest above thebottom of *he approach channelshall be at least twice, ',landpreferably 3 times, the maximumhead and not less than, 0.3 m (1 foot,For the standard suppressed weirthe crest height shall be 5 timesthe maximum head. The height oftriangular weirs shall be measuredfrom the channel bottom to the /point of the notch.
s)p There shall be a clearance of atleast 3. times the maximum headbetween the sides of the channel .
ofd the intersection of the maximumwater Surface with the ,sides of theweir notch.
7) For standard rectangular suppressed,rectangular contracted, andCipolletti weirs the maximum headshall not exceed 1/3 the.length ofthe level crest edge.
8) The head on the weir shall be takenas thi difference in elevationbetween the crest and the watersurface at a point upstream adieitance of 4 tot 10 times themaximum head or a minimum of1.8 m (6 feet).
r*,
9) The head used to compute dis-charge shall be the mean of Stleast 10 separate measurementstaken at equal intervals. Thehead range of the measuringdevice shall be 6 - 46 cm (0.2 - 1.5 feet).
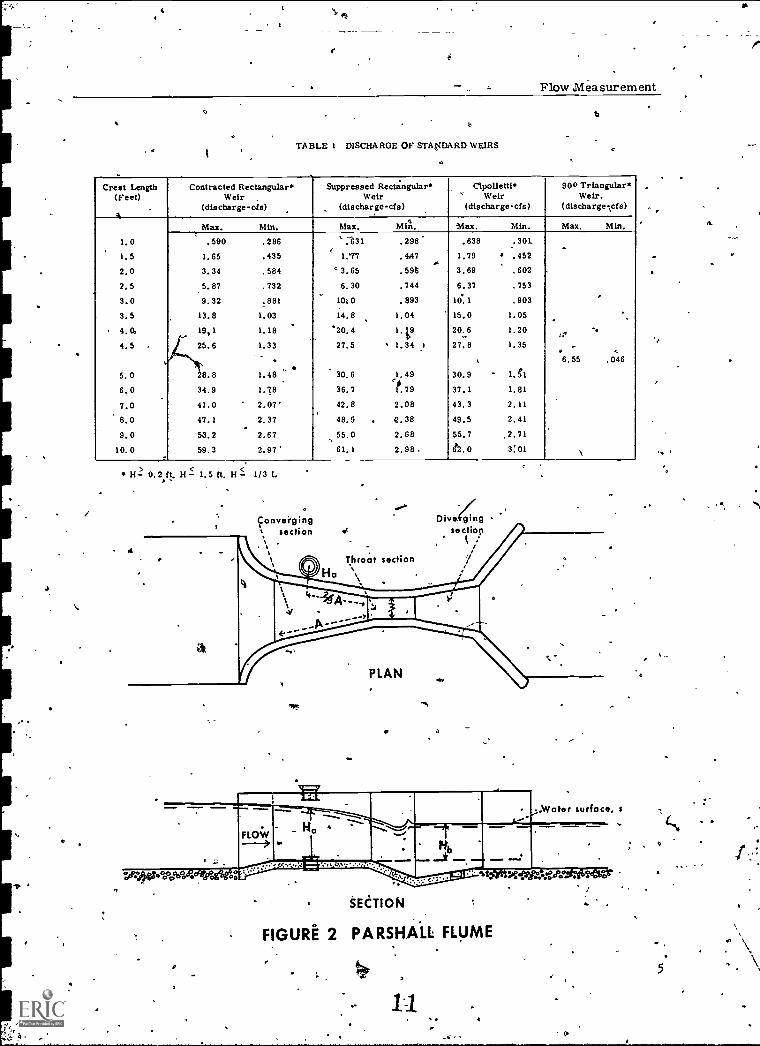
The capacities of weirs which conformto these specifications are indicatedin Table 1.
4 Parshall flume
The Parshall flume is an open constricted'channel in which the rate of flow is ;
related to the upstream head or to thedifference between upstream and d?wn-stream heads. It consists Of asentrance section with convergingvertical walls and level floor, a throatsection with parallel walls and floordeclining. downstream, 'and an exitsection with diverging walls and floorinclining downstream. Plan andsectional views are shown in Figure 2.Advantages of the Parshall flume includea low head requirement, dependableaccuracy, large capacity range, andself cleaning capability. Its primarydisadvantage is the high cost offabrication; this cost may by avoided
/by use of a prefabricated flume. Useof prefabricated flumes during plantsurveys ishecoming increasinglypopular.
a Standard equations
The dimensions of Parshall flumesare specified to insure agreemen,t-with standard equations. Table ofdimensions are available fromseveral-sources 34. For flumesof15 cm (6 inch) to 2.4.m (8 foot) throatwidth the following standard equationshave been developed.
1) 15 cm (6 inch) throat width
Q = 2'.06 Ha 1.58
2) 23 cm (9 inch) throat widthQ' = 3:07. Ha 1.53
1
1
Flow .Measurement
TABLE 1 DISCHARGE OF STANDARD WEIRS
Crest Length(Feet)
.
4.
Contracted Rectangular*Weir
(discharge-cis)
Suppressed Rectangular*Weir
(discharge -cis).
Cipolletti*` Weir(discharge-cis)
900 Triangular*Weir.
( dis cha rgecf 6)
1,0
1. 5
2,02.5
3.03.5
4. 0,
4,5 .
5. 0
6.0
7,08.0
9,010.0
Max. Min, Max. Mai. Max. Min. Max. Min.
.590
1.65
3,34
5,87
9.32
. 13. 8
19,1
25.6
8. 8
34.9
41.0
47.1
53.2
59.3
.286
.435
.584
.732
.881
1. 03
1.18
1.33
1.48
1.38
2.07'2.37
2.67
2.97'
`,631' 1.77
' 3,65
6.30
10;0
14. 8
.20.4
27.5
30.6
36.7
42.8
48.9
--,
55.0
61.1
. 298
. 4A7
,596
.744
,893
1. 04
1.339
1,34
e1. 49ar. 79
2.08
8.38
2.68
2. 98 .
,
A
.638
1.79
3.69
6.37
10.1
15. 0
20.6
27.8
.
30.9
37.1
43.3
49.5
55.7
612.0
.301.
.452
.602
.753
.903
1. 05
1.20
1.35
1. SI
1.81
2.11
2.41
,2.71
3 :01
.
as
6.55
'
-.
.046
H2 0.2 t. H 1.5 ft. H 1/3 L4
conveiging Dive:c(ing -. .....`
\ section 4 sectiop. . , t /
\Throat section /
a \
.Water surface, s
SECTION
FIGURE 2 PA RSHAIL FLUME
te
5
'0*
eo
Flow Measurement
.
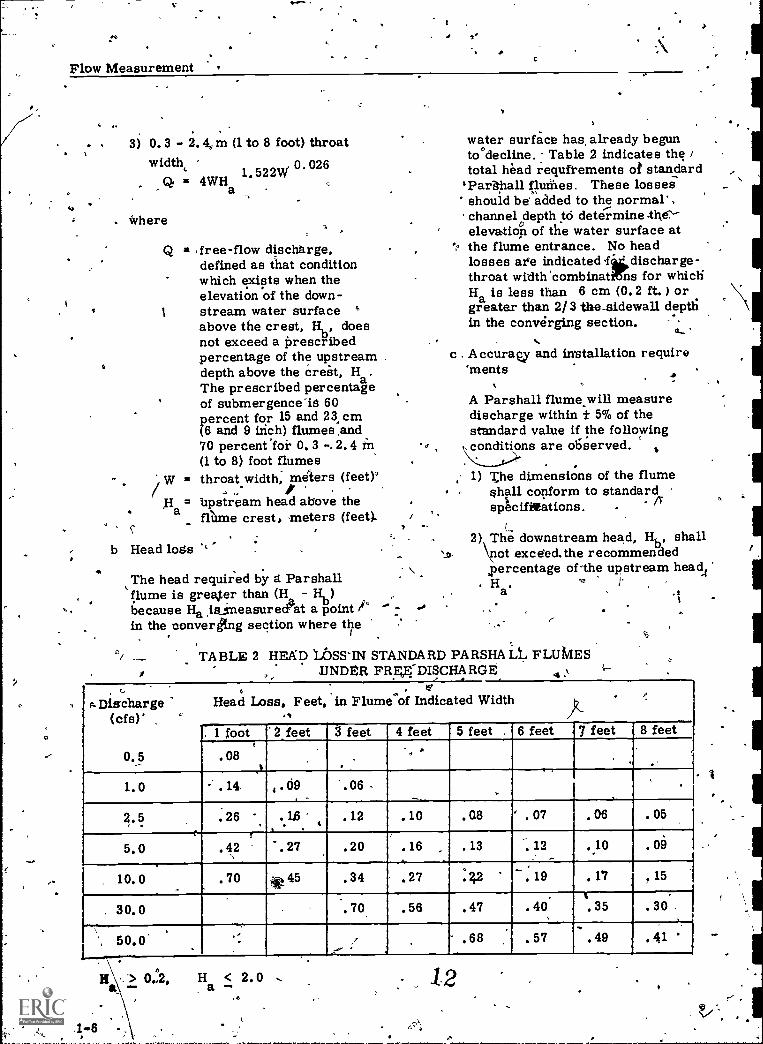
3) 0.3 - 2.4r m (1 to 8 foot) throatwidth,
1.522W°026
. Where
4WHa
Q a free-flow discharge,defined as that conditionwhich exists when theelevation of the down-stream water surfaceabove the crest, Hb, doesnot exceed a prescribedpercentage of the upstreamdepth above the crest, Ha.The prescribed percentageof submergence "is 60percent for 15 and 233 cm(6 and 9 inch) flumes and70 percentloi- 0.3 -.2.4 in(1 to 8) foot flumes
Wthroat width. meters (feet)'
H bpstream head above theflume crest, meters (feet).
fb Head loss
The head required by g Parshallflume is greater than (I-1because Ha ,is_ineasurecrat a point ri°in the converang section where the
water surface has, already begunto°decline. Table 2 indicates thetotal had requirements of standard
sParahall punies. These lossesshould be added to the normal',channel depth to determine theelevation of the water surface atthe flume entrance. No headlosses are indicated ig.discharge-throat width'combinatfirns for whichHa is less than 6 cm (0.2 ft. ) orgreater than 2/3 the-sidewall deptin the converging section.
c Accuracy and installation require'ments
A Parshall flume will measuredischarge within ± 5% of thestandard value if the followingcov2c.).1editions are diserved. ,
1) 'the dimensions of the flumeshall conform to standardsp6ifigitations.
2), The downstream head, Hb, shallexceed.the recommended
,percentage of'the upstream headH.
4
TABLE 2 HEAD tbSSIN STANDARD PARSHA Lt, FLUMESUNDER FREE-DI CHARGE 4 .`
.11
g. Discharge(cfs)"
0.5
. eft
Head Loss, Feet, in Flume'of Indicated Width )1. 1 foot 2 feet feet 4 feet 5 feet 6 feet 7 feet 8 feet
.08i
J .
1.0 .14, ,.09. -
.06,
1' .26 .. 16a
.12 .10 .08 ' . 07 . 06 . 05
5.0t
.42r
-.27 .20,
.16 .13 . 10 .09
10.0 .70 1045 .34 .27.._
. 19 .17 .15
. 30.0..70 .56 .47
.
.40Iv
.35 .30
',.
50.0 .68 .57-
.49 .4.1
1-6
/I \ > H < 2.0 .- a 1 2
1
s
Ma.
I
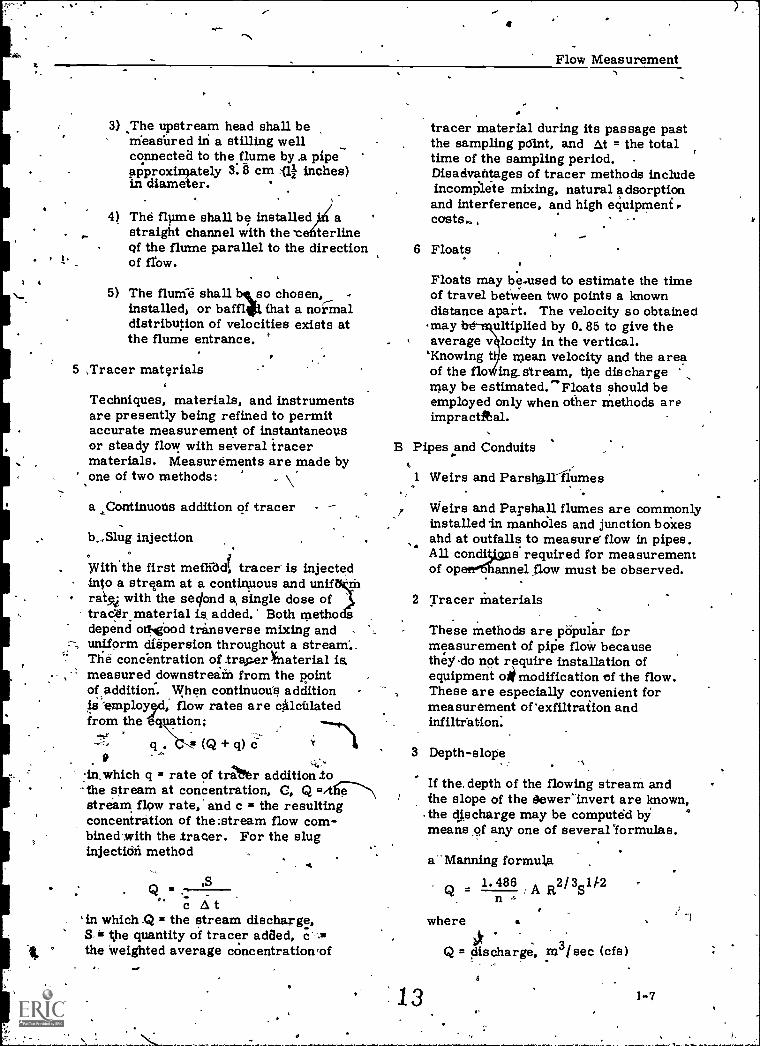
3) The upstream head shall bemeasured in a stilling well -connected to the flume by .a pipeap'proximately 3:8 cm la inches)in diameter.
4) The flume shall be installed astraight channel with the c terlineof the flume parallel to the directionof flow.
5) The flume shall b so chosen,installed or baffl That a normaldistribution of velocities exists atthe flume entrance.
5 ,Tracer materials
Techniques, materials, and instrumentsare presently being refined to permitaccurate measurement of instantaneousor steady flow with several tracermaterials. Measurements are made byone of two methods: \a ,Continuous addition of tracer
b_, Slug injection
With.the first mefh-dd, tracer is injectedinto a stream at a contintuous and tmifkrnrate with the seciond a, single dose oftracer material is, added. Both methodsdepend otilgOod transverse mixing anduniform dispersion throughout a stream:.The concentration of trap.ex)inaterial is,measured ,downstreait from the pointof addition. When continuous, addition -
is 'employ9d; flow rates are eilleidatedfrom the tion;
q . (Q + q) c tTinwhich q = rate of tralPer addition .tothe stream at concentration, C, Qstream flow rate,' and c = the resultingconcentration of the:stream flow com-binedwith the tracer. For the sluginjection method
Q,S
e. c A t'in which .Q = the stream discharge,S i the quantity of tracer added, c :=1the weighted average concentration'of
Flow Measurement
tracer material during its passage pastthe sampling point, and At = the totaltime of the sampling period.Disadvantages of tracer methods includeincomplete mixing, natural adsorptionand interference, and high equipmentcaste.,
6 Floats
Floats may be.used to estimate the timeof travel between two points a knowndistance apart. The velocity so obtained
may ultiplied by 0.85 to give theaverage v locity in the vertical.'Knowing t e mean velocity and the areaof the flo ing stream, the dischargemay be estimated."Floats should beemployed only when other methods areimpractital.
B Pipes and Conduits
1
,
1
Weirs and Parshall 'ilumes
Weirs and Parshall flumes are commonlyinstalled in manhdles and junction boxesand at outfalls to measure flow in pipes.All cordas required for measurementof op annel flow must be observed.
2 Tracer Materials
These methods are.pdpular formeasurement of pipe floW becausethey -do not require installation ofequipment oti modification of the flow.These are especially convenient formeasurement of 'exfiltration andinfiltration:
3 Depth-slope
If the. depth of the flowing stream andfhe slope of the hewer- invert are known,the discharge may be computed bymeans of any one of several formulas.
13
a"Manning formula ,
1.486= A R2/3S1t2n
whereA
Q = discharge, M3/see (cfs)
1-7

FLOW MEASUREMENT
.11
n = roughness coefficient1.
A = area of flow, m2 (sq: ft.)
R = hydraulic radius
S =
area divided by wetted_ perimeter,m (ft).slope
b Chezy, formula
Q =CAVITS
where
Q = discharge, m3 /sec (cfs)
C = friction coefficient
A = area of flow, mi(sq. ft.)
R = hydraulic radius, in (ft.)
= area' divided by wetted perimeter
S = slope
C Head Measuring Devices
Several of the above gauging method.s re-quire the measurement of water level idorder that discharge may° be determined.Any device used for this purpose must bereferenced to some zero eleiration. -Forexample, the zero elevation for weirmeasurements is the elevation of the weircrest. The choice of method is dependentupon the degree of accuracy and the typeof record desired.
1 Hook gauge
The-hook gauge measures water eleva-L, tion from a fixed point. The hook is
dropped below the water surface andthen raised until the point of the hookjust breake the surface. This method.
431' probably will give-the most preciseresults when properly applied.
2 Staff gauge
The staff gauge is merely a,graaliatedscale placed in the water so that eleva-'tion mity b' read directly.;
3 Plumb line /This method involves measurer nt.the distance from a fixed refere epoint to the water surface, by dl pinga plumb line until it just touches thewater surface.
4 Water level recorder
This instrument is used when a continu-ous record of water level-is desired.' A-float and counterweight are connectedby a steel tape which passes over apulley. The float should be placed ina stilling well. A change in water levelcauses the pulley to rotate which, through.a gearing system, movee'a pen. The pentraces water level on a chart which itattached to a drum that is rotated by aclock mechanism. When properly in-stalled'and maintained, the water levelrecorder will provide an accurate,centinuouS e co r d .
IV Units of Expression
A Volume fPreferred metric units are thecubic meter (110) or the liter (L).Commonly -used British' units arethe gallon (gal. ) andthe cubic foot(cu. ft., sec-ft.). Conversionfactors appear below:
Multiply To Obtain
m3 1000
gal 3.79cu. ft. 28. 32
L
gal 0. 134 cu. ft.
To Obt4n..-22L--. Divide
1
1
1
1
1
I

o .
a
Go
FLOW MEASUREMENT
7
B Length
9
Preferred metric units are themeter (m), centimeter (cm), and
, millimeter (mm). Commonly-usedBritish units are the foot (ft.) andthe inch (in.). Conversion factors
. kappear below
, .
1 meter = 10CP,cm = 1004 mm
1 foot = 0.3048 meters
1 meter= 4.28 ft.
C Flow, Flow Rate. Discharge
All of these terms are commonlyused to refer to the volume of liquidpassing a point in a selecteU timeinterval. Flow is often expressedin these units.
Metric British
m3/sec Gallons per minute (GPM)
L/ sec Million gallons per day(MGD)
Cubic feet per second(cfs, sec-ft)
Conversion factors are:
Meltiply T.. To Obtain1000
0.063
m3/ sec
GPM
MGD
cfs
L/secL/sec
82--- I/ sec'28:32 .,,,t/sec
To Obtain 41--- Divide
D Weights of conatituents belt* carriedin a liquid flow can be'calculatedusing the following equations.
A CKNOVLEDGMENT:
Certain portions of this outline containstraining material from prior Outlines byP. E. Laligdon, A. E. Becher, and P. F. -
Atkins, Jr.
REFERENCES
1 Planning and Making Industrial WasteSurveys - Ohio River Valley WaterSanitation Commission.
2. Stream Gauging Procedure. U.S. GeologicalSurvey. Water Supply Paper 888..(1943)
, 3 King, H. W. Handbook of Hydraulics.4th Edition, McGraw-Hill. (1954) ,
Kg/day = MGD x mg/L x:3.79L/sec xmg/L1X 8.64 x 10
4, Water Measurement Manual. 'riftedStates Department of the InteriorBureau of Reclamation.' (1967)
'This. outline was prepared by F. P. 4ixonFormer Acting Regional Training Officer,Northeast Regional Training Center andrevised by Charles.E. Sponagle, OWPO, .
USEPA, National Training and Operational. Technology Center, Cincinnati, Ohio 45268
Descriptors: Chezy Equation, DischargeMeasurement, Flow; Flow Measurement, ,
Flow Rates, Flumes, Mannings Equation,Open Chaninel Flbw, Pipe Flow, Streamflow,Venturi Flumes, Water Flow, Water LevelRecorders, Weirs
I1-9
SAMPLING IN WATER QUALITY STUDIES
I INTRODUCTION
A Objective of Sampling
1 Water quality characteristics are notuniform from one body of water toanother, from place fo place in agiven body of water, or even from timeto time at a fixed location in a given,body of water. A sampling programshould recognize such variations and,provide a basis for interpretation oftheir effects.
2 The purpose of collection of samples isthe accumulation of data which can be .
used to interpret the quality or conditionof the water under investigation. Ideally,the sampling program should be so de-signed that a statistical confidencelimit may be associated with eachelement of data.
Water 'quality surveys are undertakenfor a 4.reat variety of reasons. Theoverall objectives of each survey greatlyinfluence the location of sampling .stations, sample type, scheduling ofsample collections,' and other factors.This influence should always be\kept inmind during planning of the survey.
4 The sampling and testing program shouldbe established in accordance with princi-ples which will permit valid interpre-.tation.
a The collection, handling, and testingof each sample should be'scheduleiland conducted in such a manner asto assure that the results will betruly representative of the sat rcesof the individual samples at the timeand place of colleciion;
b The locations of sampling stations-and the schedule- ofEiS.mple, collectioris,for the total sampling Program should
4
WP. SUR. egad. 2.81
_
be established in such a manner thatthe stated investigational objectlieswill be met; and
c Sampling should be sufficientlyrepetitive over a period of time toprovide valid data about the conditionor quality of the water.
B Sample Variations
Interpretation of survey data is based onrecognition that variations will occur inresults from individual samples. Whileit is, beyond the scope of this discussionto consider the implications of each indetail, the following can be identified asit -Airs producing variations in data and
should' be considered in planning thesampling program.
1 Apparent Variations
a Variations of a statistical nature,due to collection of samples fromthe whole body of water, as con-trasted with examination of all the.water in the system.
b Variations due to inherent precisionof the analytical prbcedures.
c Apparent variations are usuallyamenable to statistical analysis.
2 'True Differences
a Variations of a cyclic nature
Diurnal variations, related to alter-nating periods of sunlight anddarkness.
16
Diurnal variations related to wastedischarges from communities.
i" 7
2-1
4.0,
5 G
Sampling in Water Quality Studies
A
Seasonal variations; related totemperature and its suliseqUent'effectk on chemical and bi4logicalprocesses and interrelatiofishipS.
Variations due to tidal influenpes,in coastal and estuarine waters.,
1
b Intermittent variations
Dilution by'rainfall and runoff..
Effects of irregular of intertnittentdischarges of wastewater, such as"slugs" of industrial wastes.
Irregular release of water frOm'impoundments, as from powerplants.
c Continuing changes in water quality
Effects downstream from points.ofcontinuous release of wastewater.
Effects of confluence with otherbodies of water.
Effects of passage of the waterthrough or over geological forma-tions of such chemical or physicalnature as to alter the characteristics_of the Water.
Continuing interactions of biological,physical, and chemical factors inthe water, such as in the process ofnatural self-purification followingintroduction of organic contaminantsin a body of water.
II LOCATION OF SAMPLING STATIONS.
A Vie Influence of Survey Objectives
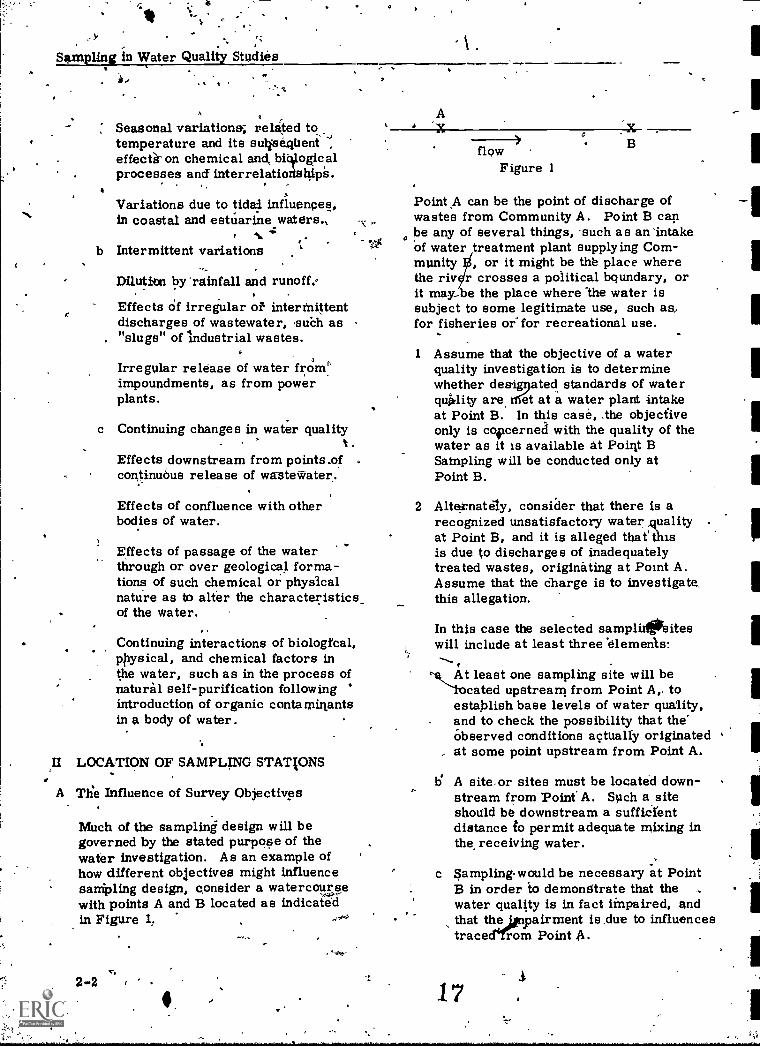
Much of the sampling design will begoverned by the stated purpose of thewater investigation. As an example ofhow different objectives might influencesampling design, consider a watercoursewith points A and B located as indicatedin Figure 1,
2-2
C
flowFigure 1
Point A can be the point of discharge ofwastes from Community A. Point B can
e,be any of several things, -such as an intakeof water treatment plant supplying Com-munity , or it might be the place wherethe riv r crosses a political boundary, orit may-be the place where the water issubject to some legitimate use, such as,for fisheries or for recreational use.
1 Assume that the objective of a waterquality investigation is to determinewhether desig9ated standards of waterqnMity are ricet at a water plant intakeat Point B. In this case, .the objectiveonly is coverneri with the quality of thewater as it is available at Poiqt BSaMpling will be conducted only atPoint B.
2 Altetnately, consider that there is arecognized unsatisfactory water qualityat Point B, and it is alleged thatusis due to discharges of inadequatelytreated wastes, originating at Point A.Assume that the charge is to investigate,this allegation.
In this case the selected samplidtirsiteswill include at least three 'elements:
At least one sampling site will becated upstream from Point A,. to
establish base levels of water quality,and to check the possibility that the'Observed conditions actually originatedat some point upstream from Point A.
b' A siteor sites must be located down-stream from Point' A. Such a siteshould be downstream a sufficientdistance to permit adequate mixing inthe receiving water.
c Samplingwould be necessary at PointB in order to demonstrate that thewater quality is in fact impaired, andthat the jonpairment is ,due to influencestraceen'om Point A.
A
17
B Hydraulic Factors -
1 Flow rate and direction
a In a survey of an extended body ofwater it is necessary to determinethe rate and direction of water move-ment influences selection of sam-pling sites. Many workers plansampling stations representing notless than the-'- distance water flowsin a 24-hour period. Thus, inFigure 1, intervening samplingstations would be selected at tidintsrepresenting the distance waterwould flow in about 24 hours.
43, In a lakg or impoundment directionof flow is the major problem influenc-ing selection of sampling stations.Frequently it is necessary to estab-lish some sort of grid network ofstations in the vicinity of the sus-pected sources of pollution.
c 'In a tidal estuary, the 43.scillatingnature of water movement will re-quire establishment of samplingstations in both directions fromsuspected sources of pollution.
. r a ./7 2 Introduction of other Oster
a In situations in which a. str m-beingstudied is joined by *tiler s eamof significant size and character,sampling stations will Ile-locatedimmediately above the extraneousstream, in the extraneous streamabove its point of juncturemiththemain stream, and in the_mainstream below the point of junctur
Similar stations will be neederespect to other water disc = s,such as from industrial o a s,other communities, or o e instal-lationS in which water. troducedinto the main stream
Sampling in$Water Quality Studies
used in stream surveys. Thisusually as near the surface of thewater, in the main channel of flc4.
b In some streamsrnixing does -not'occur quickly, and introduced watermoves downstream for considerabledistances below the point of .con.-fluence with the main streams:Example- Susquehanna-River atHarrisburg, where 3 such streamsare recognizable in the main river:Preliminary survey operationsshould identify such situations.
..
When necessary, collect separatesamples at two or more, pointsacross the body of water
c imilarly, vertical mixing may notbe rapid. This is noted particularlyin tidal estuaries, where it may benecessary to make collections bothfrom near the bottom and near thesurface of-the water.
d Collection of multiple samples froma statiil requires close coordinationwith 4 e laboratory, in terms of thenu her of samples that can be
amined. Some types of samplesbe composited. The decision
st be reached separately for eachype df sample:
3 Mixing
a WheFever possible, one samplingpoint at a saMplecolleetion site is
1
es of Analytical Procedure
1 Samples collected for physical, cherrii-cal, anikbacteriological tests andmeasurements may be collected .fromthe'sarne series of 'sampling stations.
2 .Sampling stations selected for biological(ecological) investigation requireselection of-a seriesof.similar aquatichabitats' (a series of.riffle areas, or aseries of pool areas, or both), The itsites Used by the aquatic. biologist mayor may not be cornpatiblewith those
' used for the rest oIthe survey., Accord-ingly, in a given stream survey,, thestations used by,the aquatic biologistesually are somewhat different from thestations used for other examinatinns.
2-a

Sampling lb Water Quality Studies
D Access to Sampling Stations
For practical'reasons, the sampling siteshould be easily reached by automobile ifa stream survey, or by boat if the surveyis on a large body of water. Highwaybridges are particularly useful, if thesample collector can operate in safety.
HI FACTORS IN SCHEDULING OF SAMPLINGPROG1AMS
A Survey Objectives
B Time of Year
1 In short -term water quality 'investiga-hops, particularly in polltitioninvestigations, there often is need todemonstrate the extremes .of pollution-effects on the aquatic environment.For this reason, many short-termsurveys are conducted during thewarmer season of the year, at suchtimes as the water flow rate andvolume is at a minimum and there isminimum likelihood of extenslveraixdo,11.
, 44,
2 In a long-term investigation, sampling-1typically is conducted at all seasonsof the year.
C Daily Schedules
As shower in an introductdry paragraph,-water quality, is subject to numerouscyclic or intermittent variations. Sched-uling of sample collections shoidd be de-signed to reveal such variations.
'1 In short-term surveys it is commonpractice to collect samples from eachsampling site at stated intertalsproughthe 24-hour day, continuing the programfor 1 - 3'weeks. Sampling at 3-hourintervals Is preferred by manly workers,though practical considerations may re+quire extension to 4- or even 6-hourIntervals. I ,
24
.
2 In an extended s rvey there Ls a ten-dency to-collect amples from eachsite at not more than'daily intervals,or even longer. In such cases thehour of the day should be varied throughthe entire program, in order that thefinal §urvey show cyclic or intermittentvariations if they exist.
3 In addition, sampling in tidal watersrequires consideration of tidal flows.If samples are collected but once daily,many workers prefer to make the col-lections at low slack tide.
4 In long-term or any other survey inwhich only once-daily -samples arecollected, it is desirable to have anoccasional period of, around- the -clocksampling..
IV SAMPLE COLLECTION
A Types of Saples
1 "Grab" sample a grab sample is usuallya manually collected single portion of thewastewater or stream water. An analysisof a grab sample shows the concentration-of the constituents in the water at the timethe sample was taken.
2 "Continuoubs" sample when several pointsare to be sampled at frequent intervals orwhen a continuous record of quality at agiven sampling station is required, anautomatic or continuous sampler may beemployed.
a Some automatic samplers collect agiven volume of-sample at definite timeintervals, this is satisfactory when the.volume of flow is constant.
b Other automatic samplers take samplesat variable rates in proportion to chang-ing rates of flow. This type ofssamplerrequires some type of flow measuringdevice. -
, 1 9

iar"
Sampling in Water Quality Studies
,3 :"Composite" sample"- a composite
sample is the' collection and mixingtogether of varIous individual samplesbased upon the ratio of the volume offlow at-the time the individual sampleswere taken to the total cumulativevoludie of flow. The desired compositeperiod will dictate the magnitude of thecumulative volutne of flow. The morefrequently the samples are collected,the more representatiire will be thecomposite sample to the actual situa-tion. Composite samples may beobtained by:
a Manual sampling and volume of flowdeterminatibn made when each sam-ple is taken.
b Constant automatic sampling (equalvolumes of sample taken each time)with flow determinations made aseach sample is taken.
c Automafic sampling which takessamples at pre- determined timeintervals and the volume of sampletaken is proportional to the volumeof flow at any given time.
B Type of Sampling Equipment
1 Manual sampling /-a Equipmentis specially designed
for collection of samples from thebottom' muds, at various depths.,or at water surfaces. Specialdesigns are ,related to protection ofsample integrity in terms of thewater characteristic or 'componentbeing measured.
2 -*Automatic saropliici.e4uipment
Automatic sampling equipment hasseveral important advantages over,manual me ods. Probably the mostim conside is the reductionin personnel require is resultingfrom the use of this pment. Italso allows more frequent samplingthan is practical manually, and elim1-nates many of the human errors in-herent in manual sampling.
Automatic sampling equipment hassome disadvantages. Probably themost important of these is the tendencyof many automatic devices to become.Clogged W'.en high in solids arebeing sampled. in using automatsamplers, sampling points are `'axewhich results in a certain loss"ofmobility as compared to manualmethods.
Automatic sampling equipment shouldnot be used indiscrithinately; some typesof samples r notably bacteriologieal,biblogical, and Do samples - shouldnoebe composited. In cases of-doubt,the appropriate analyst should beconsulted.
V SOME CONSIDERATIONS IN SAMPLINGOPERATIONS
All procedures lb care-and handling of samplesbetween collection andlhe performance ofobservations and testse directed towardmaintaining the 'reliability of the sample as an
4indication of tt)e characteristics of the samplesource.
,b For details of typical sampling equip-.
ment used in water quality surveys.see outlines dealing with biological,bacteriological, and chemical testsin this manual.
Manual sampling equipment hasvery-broad application in field work,as great mobility of operation ispossible, at lower cost than may beRosstible with automatic samplings 'equipment.
"c
O20
A Sample Quantity
1 Samples for a series of'ciiemicalanalyses require determination of thetotal sample' volume required for allthe tests, and should include enoughsample in addition to provide a safetyfactor for laboratory errors or acci-dents. Many workerScollect abouttwice the amount of sample actuallyrequired for the chemical tests. ABa rule of thunib, -this is on the ordekb,r:2 liters.'
2-5
Ye.
,Sarhpling in Water Quality Studies
2 Bacteriological samples, in-general;are- collected in 250 300ml sterilebottles; approximately '150 - 200 m1 ofSamples is adequate in practically, all'cases. .)
B Sample Identification
i Sample identification must be main-tained throughout any survey. It isvital,,therefore, that adequate recordsbe made of all information relative .tothe source of the sample and conditionsunder which the, collection was made'.All information must be clearly under-standable and legible.
2 Every sample should be identified bymeans of a tag or bottle marking,firmly, affixed to the sample bottle'.Any written material should be with .indelible nlarkinsWmaterial.',
. .3 Minimum information on the:sample °.
label should include identification ofthe sample site, date and time of col -'lection, and, dentification of theindividual collecting the sample.
4 Supplemental identification of samplesis strongly recommended, throughmaintenance of a sample colltionlogbook. If not indluded on the sa letag (some prefer to duplicate such' infor-mation). the logbook can show not on13,./the sample site and date and hour ofcollection, but also the results of anytests niade on site (Kph as temperature,
1- pH, dissolved oxygen)t.-1.1naddition, the' logbook should providelpr notation of
any unusual observations made at thesampling site, such as rainfall, qrec-,tion and strength of unusual winds orevidence of disturbance of the collectionsite `by human or other animalactivity...
C Care and Handling of Samples
As a gene al policy, all observatiOns(riand tests s oulbeimade as so as .possible after sample collection,
a Some measurements require perfor-mance at the sampling site, such astemperature, pH, dissolved oxygen,chlorine, flatv rate, etc.
b Some tests are best made at thesampling site because the proceduresare simple, rapid, and of acceptableaccuracy. These may include such
%determinations as_conductivity.
c Some additional determinations, suchas alkalinity, hardness, and turbiditymay be made in the field, proyidedthat ease, convenience, and .reliability4of results are acceptable for the pur-poses of the study
2 Samples to be analyzed in the laboratoryrequire special protection to assure thatthe quality rnitasured in the sample repre-sents the condition of the source Manysamples, especially those, subjected tobiological analyilis,' require special pre-servation, protection, and handag pro,cedures,,in case of doubt, the appropriateanalyst sho-uld be-consulted. ..Most corn-mon procedures for ,sample protectioninclude:
a Examination within brief time aftercollection.,
b Temperathre cont?ol.
c Protection from light.
d Addition of preserative chemicals.
Applications of-these sample protectiveprocedures are along the following
s:
Early exaMination'of sample
Applicable to all types of samples.
4 Tem'erature control
a All biological materialli.for examina-tion in a living state should be icedbetween collection and examination,
/

Sampling in Water Quality Studies
b Bacteriological sa les should0beiced during a max urn transporttime of 6 hours. Such samples Should .be refrigerated upon receipt in thelaboratory and 'processed within 2 hours.
c Chemical samples often requireicing 0 .
Preservation by refrigeration at 4°Cis recommended for acidity, alkalinity,BOD, color, sulfate, threshold odor,and other samples. Holding times varyQuick freezing will permit retention'of many samples for up to severalmonths prior to laboratory examina-tion.
5. 'Protection frOm light
o a Any constituent of water which maybe influenced by physiochemicalreactions involving light should beprotected. DO samples brought tothe iodine stage, .for example, shouldbe protected froin light prior totitration.
)3 In addition, any water constituent(such as dissolved oxygen) whichmay be influenced b5 algal activity -
should be protected from light.
16 Addition of chemical preservatives
Bacteriological samples nevershould be "protected'-by additionof preservative agents. The onlypermissible *chemical additive issodium thiosulfatekiwhich is usedto neutralize free residual chlorine,if present, and which is added to therumpling botire before sterilization.
a
13' Samples forliiological examinationshould be protected by chemicaladditives only unddr specificdirection of the principal biologistin a water quality study.
c For chemical teiles, preservativesare usqullor a number of watercompqrierits. Specific instructionsfor the preservation of a number ofchemical constituents are. given inreference (4).
1-

,,,,,......
/
Sampling in Water Quality Studies
.r-
,
1 Standard Methods for the Examinationof Water and Wastewater. - APHA.14th Ea: 1975,
2 Planning and Makirig Industrie1.1 Waste. Surveys. Ohio River Valley Water
Sanitation 'Commission.
3
2-8
.
Industry's Idea Clinic. , Journal of theWater Pollution Control FederationApril, 1965.
,
Methods for Chemical Analysis of Water. -and ,Wastes, -1979. USEPA,
Environmtntal Monitoring and SupportLaboratory, Cincinnati,. Ohio.
r=
N
/
i
tI.
. , t
.
This.outline was prepared by H. L. Jeter.Former Director. National Training Center,USEPA, OWPO, Cincinnati, Ohio 45268 andP. F. Atkins, Jr., former Sanitary Engineer.Training Activities, and revised byCharles E. Sponagle Sanitary Engineer. National'
.Training and Operational Techology Center, OWPO,USEPA, Cincinnati, Ohio 45268.
Descriptors: Instrumentation, On-SiteInvestigations, Preservation, Samplers,Sampling% Water Sampling, Handling;Sample, Surface Waters, Wastewater
2
+..
/,
V
T ..1...,9 3
. ,
1
a
\..
1
1
PO
0
,
I
,.
1
SAMPLE HANDLING - FIELD THROUGH LABORATORY
I PLANNING A SAMPLING PROGRAM
A Factors to Consider:
1, Locating sampling sites
2 Sampliniellkipment
3' Type of sample required
grabb composite
,4 AmOunt of sample required \-1
,5 Frequency of collection
6 Preservation measures, if any
B Decisive Criteria
1 Nattire of the.sampl sou ce
2 Stability of constituent be measured
3 Ultimate'use of data
II EVEPRESENTATIVt SAMPLES
If a sample is to provide meaningful andvalid data about the parent population, itmust be representative of, the conditions'existing in that parent source at thesampling location. fltiss
A The container should be rinsed two orthree-times with the water to be collected.
B Composit,Ing Samples
1 For some sources, a composite ofsamples is-made which will representthe average situation for stableconstituents.
. 2 'Themature of the constituent to bedetermined may. require a series ofseparate samples.'
WP. SUR. sg. 6a. i 1.80
4.
C The equipment used to collect the sampleis an important factor to considerASTM") has a detailed section on varioussampling devices and techniques.
D Great care must be exercised whencollecting samples in sludge or mud areasand near benthic deposits. No definiteprocedure can be given, but carefuleffort should be made to obtain a rep-resentative sample.
III SAMPLE IDENTIFICATION
24
A Each sample must be unmistakablyidentified, preferably with a tag or label.The required information should be plannedin advance.
B An information form preprinted on thetags or labels provides uniformity ofsample records, assists the sampler, andhelps ensure that vital information willnot be omitted.
C Useful Identification Information includes:
1 sample identity code2 signature of sampler3 signature of witness4 description of sampling location de-
tailed enough to accommodate repro-ducible samplitng. (It may be moreconvenient to record the details in thefield record bdok).,
5 sampling\equipment used6 (lite of collection7 time of collection8 type of sample (grab or composite)9 water temperature
10 sampling conditions such as weather,water level, flow rate of source, etc.
11 any preservative additions, or techniques.2 record of any determinations done.;in
the field13 type of analyses to be done in laborafory
oat
3-1

1/4
Sample Handling - Field Through Laboratory'
IV SAMPLE CONTAINERS
A Available Materials1
1 glass2 pla§tic3 hard rubber
B. Considerations
1 Nature of the sample - Organicsattack polyethylene.
2 Nature of caustituent(A) to be determined.- Cations can adsorb readily oh someplifitraiand on certain glassware.Metal or aluminum foil cap liners caninterfere with metal analyses.
, 3 Preservatives to be used - Mineralacids attack some plastics.
4 Mailing Requirements - Milnerashould be large enough,to allow extravolume for effects of temperaturechanges during transit. All caps -
should be securely in place. Glasscontainers must be protected againstbreakage. S)yrofoam linings areuseful for protecting glassware.
S
C Preliminary Check
Any question of possible interferencesrelated to the sample container shouldbe resorved before the study begins. Apreliminary check should be made usingcorresponding sample materials, con -tainers, preservatives and analysis. ,
D Cleaning
If new containers are to be- used, prelim-inary cleaning is usually not necessary.
If the sample' containers have been usedpreviously, they should be carefullycleaned before use.
There are several cleaning methodsAvailable Chooding the best methdd in-volves, careful consideration of tie natureof the sample and of the constituents) to
. be determined.
3i.2
\
1 Phosphate detergents should not beused to clean containers for phosphorussamples.
2 Traces of dichromate cleaning solutionwi4interfee with metal analyses.
E. Storage
Sample containers should be stored andtransported in a manner to assure their.readiness for use.
ti
V SAMPLE PRESERVATION -(.-
Every effort should be made to achieIrethe short possible ht,terval betweensample ollection and analyses. If theremust be a delay and it is long enough toproduce icant changes in the sample,preservation measures are required.
At best, however, preservation effortscan only retard changes that inevitablycontinue after the sample is removedfrom the parent population. .
A Functions
Methods of preservation are relativelylimited. The primary functions of thoseemployed are:
1 to retard biological action2 to retard precipitation or the hydrolysis
of chemical compounds and complexes3 to -reduce Volatility of constituents
B General Methods
1 pH control - This affects precipitatibhof zuttalq, salt formation and caninhibit bacterial action:
2 Chemical Addition - The choice of .
chemical depends on the change to becontrolled.
Mercuric chloride is commonly usedas a bacterial inhibitor. Disposal ofthe mercury-containing samples is aproblem and efforts to find a substitutefor' this toxicant are underway.
25

.1
1
s.
Vg5
To dispose of solutions of inorganicmercury salts, a recommendedprocedure is to capture and retain themercury salts as the sulfide at a highpH. SeVeral3irms have tentativelygreed to accept the mercury sulfide for-processing^Ifter preliminary con-
ditions are met, (4)
3 Refrigeration and Freezing - This Its.the best preservation technique avail-,-able, but not applicable to alltypes of samples. It.ianof always apractical technique for field operations.
C Specific Methods -
The EPA Methods Manual (2) includes atable summarizing the holding times andpreservation techniques for several
analyficilipropedures. This informationalso can be found in the standard refer-
, ences ( 2, 3) as part of the presentationof the individual procedures.
N
D Federal Register Methods
When collecting samples to be analyzedfor National Pollutant Discharge Elimi-nation System or State Certificationreport purposes, one must consult theappropriate Federal Register(5) forinformation about sample handling pro-cedures. When collecting samples to -
be analyzed for compliance with inaidmumcontaminant levels in drinking water,consult the EPA Report(6) which includesthifrinformation.
VI METHODS OF.ANALYSIS
Standard reference boon; of analytical_oeedures to determine the physical
and chemical characteristics of varioustypes of water samples available.
--_:;?
.e EPA MethOds Manual.., 4 --,
' TheEnvironmental Monitoring and,Support Laboratory °Ube Environmental --Protection_ Agency, kli ati published a:
. - maaual'Of analytical'irocedures to ,:.
provide methodology for inonit.oring,the
0
Sample Handling -Through Laboratory
quality_of our Nation's Waters and to deter-mine the impact 9f wastedischarges. Thetitle of this manual is "Methods for Chem!cal Analysis of Water and Wastes. "(2) -
,For some tests, this manual refers theanalyst to Standard Methods and/orloASTM for the stepwise procedure.
B Standard Methods
The American Pubitc Health Association,the American Water Works Asttociation
..and the Water pollution Control Federationprepare and publish a volume describingmethods of water analysis. These includephysical and chemical procedurea., Thetitle of this book is "Standard Methods,for the Examination of Water and Waste-,_water. "(3)
C ASTM Standards
The American' Society for Testing andMaterials publishes an annual "book"
-of specifications and methods for testingmaterials.. The 'Vok" currently con-sists of 47 pirtist-4-11 e part toplifirtileto water is a book ti , "Annual Boollof ASTM Standards"; art 31, Water. (t
D Other References
Current literature and other books ofanalytital procedures with related in-formation are available to the analyst.
E Federal Register Methodology
The analyst must consult the appropriateFederal Register for a listing of approVedmethodology if, he is gathering data for:,NationaMoollutant Discharge Ellmidation,System"" or State Certification(5) report,purposes, or to document compliancewith maximum contaminant levels indrinking water(7). The FetieralRegisterdirects .the user to pages inthe.aboyecited reference books where acceptable "procedures can be found:- The FederalRegister also provides information con=derning the protocbt for obtaining approvalto use analytical .proceditres other thanthose listed. isst
". 3-3,
216

.1a
J
4
Sample Handling - Field ThroughLaboratory
VII ORDER OF ANALYSES
The ideal situation is to perform allanalyses shortly after sample collection.In a practical order, this is rarelypW.'ible: The allowable holding timefor preserved samples is the basis forscheduling analyses.
A The allowable holding time for samplesdepends on the-nature of the sample, thestability of the constituent(s) to be deter-mined and the conditions of storage.
1 For some constituents and physicalvalues, immediate determination isrequired,' e. g. dissolved oxygen, pH.
2 Using preservation techniques, theholdinglimes for other determinationsrange from 24 hours (BOD) to 7 days(COD). Metals may be held up to6 monthst (''
3 , The EPA Methods Manttal(n and Standard'Methods(3) include a table summarizingholding times and' preservation techniquesfor several analytical procedui'es. Addi-tional iniormatfon can be found in thestandard references (1, 2, 3) as part ofthe presentation of the individual pro-cedures.
4 A tab).e with proposed holding times andpreservation techniques applicable tosamples collected for National PollutantDischarge Elimination System or StateCertification purposes was published inthe December 18, 1979 Register(5). A
rill RECORD KEEPING
The importance of maintaining a bound,legible record of pertinent informationon samples cannot be over-emphasized.
A Field Operations
.5
B
A bound notebook should be used. Infor-mation that should be recorded includes
1 Sample identification records (SeePart III)
2 Any information requested by theanalyst as significant
3 Details of sample preservation
4 A complete record of data on, anydeterminations done in the field..(See B, next)
5 Shipping details and records\
Laboratory O ?erations
Samples should be logged in as soon asreceived and the analyses performed assoon as possible.
A-bound notebook should be used. Pre-printed data forms provide uniformity ofrecords and help ensure that requiredinformation will be recorded. Such sheetsshould be permanently bound.,
Items, in the laboratory notebook wouldinclude:
Similar table for drinking water samplescan be found in a May, 1978 Report(w. 1
25 If dissolved concentrations are sought, 3
flltricti shodld be done in the field if 4at all po Bible. Otherwise, ample 5is filter s soon as it is' ree ved in liar'the labois.to . A 0.45 micrometer 6
membrane fil er is recommendedfor reproducibly filtration.
7
8B The time interval between collection and
analysis is important and should be re-corded in the laboratory record book.
9
3.4 ,
sample identifying bodedate and time of collectiondate and time of analysisthe analytical method usedany deviations from the analyticalmethod used and,whythis was done-data obtained during analysisresults of wality control checks onthe analyitisany information useful to those whointerpret and use the datasignature of the analyst
27

IX SUMMABY
Valid data can be obtained only from arepresentative sample, unmistakablyidentified, carefully collected and stored.A skilled analyst, using approved methodsof analyses and performing the determine-lions within the prescribed time limits, canproduce data for the sample. This datawill be of value only it a written record .exists to verify sample history fromthe field through the laboratory.
REFERENCES
1 ASTM Annual Book of Standards,Part 31, Water, 1975.
2 Methods for Chemical Analysis ofWater and Wastes, EPA - -EMSL,Cincinnati, Ohio 45268, 1979.
3 Standard Methods for the Examinationof Water and Wastewater, 14thedition APHA-AWWA-WPCF, 1975.
4 Dean, R. , Williams, B. and Wise, R. ,Disposal of Mercury Wastes fromWater Laboratories, EnvironroentalScience and Technology, October,1971,
5 Federal Register, "Guidelines Esta-blishing Test Procedures for theASelysis of Pollutants, " Vol. 41,No. 232, December 1, 1976,pp 52780-52786. Also, Vol. 44,No. 244, December 18, 1979pp 75028-75052 presents proposedchanges. The latter is scheduled
. for. tinalization-after January,' 1981.
'Sample Handling - Field Through Laboritory
6 "Manual for the Interim Certification bfLaboratories Involved in AnalyzingPublii Drinking Water Supplies -Criteria and Procedures, U. S. EPAReportNo. EPA 600/8-78-008.May, 1978.
7 Federal Register, ',National InterimPrimary Drinking Water Regulations, "Vol. 40, No. 248. December 24, 1975,pp 59568'-59574. Alio, "InterimPrimary Drinking Water Regulations;Amendments ", Vol. 45, No. .168,August 27, 1980, pp 57332-57346.
0.
This outline was prepared by Audrey Kroner,Chemist, National Training and OperationalTechnology Center, OWPO, USEPA,Cincinnati, Ohio 45268.
D,escriptors: On-Site Oita collections'.On-Site Investigations, Planning, Handling,Sample, Water.Sampling, Surface Waters.Preservation, Wastewater
(
Sample Handling - Field Through i;aboratory
IX' SUMMARY
Valid data can be obtained only from a repre-sentative' sample, unmilitakably identified.carefully collected and stored. A skilledanalyst. using approved methods of analysesand performing the determinations withinthe prescribed time liznijts, can produce datafoethe sample. This data will be of valueonly if a. written record exists to verify samplehistory from the field through the laboratory.
-REFERgNCES
1 :ASTM AmmarBook of Standards.Part 31, Water, 1975.
2 Methods for Chemical Analysis of Waterand Wastes, EPA-EMSLCincinnati, Ohio 45268, 1979.
3 Standar4 Methods for the-Examination ofWater and Wasteviater, '14th editionAPHA-AWWA-WPCF, 1975.
4, Dean R.IeWilliams, R. and Wise, R.,isposal of Mercury Wastes fromater Laboratories, Environmental
S nce and Technology, October,197
5 Federal Re ter, "Guidelines...Esta-blishing est Procedures for theAnalysis Pollutants, " Vol. 41,No. 232, cember 41976, pppp 52780-52 6. Also, Vol. 44,No. 244, Dec uber 18, 1979pp 75028-75052 presents proposedchanges. The = tter is scheduledfor finalization ter January, 1981.
8 "Manual for the Interim Certification ofLaboratories Involved in AnalyzingPublic Drinking Water Supplies -Criteria and Procedures, U.S. EPAReport No. 600/8-78,408, May, 1978.
7 Federal Register, "National Interi$Primary Drinking Water Regulations,Vol. 40, No. 248, December 24,.1975.pp 59566-59574. Also, "Interim PrimaryDrinking Water Regulations; Amendments.
. Vol. 45, No. 168, August 27, 1980,pp 57332-57346.
This outline -was prepared by Audrey Kroner,Chemist, National Training and OperationalTechnology Center, OWPO, USEPA,Cincinnati, Ohio 45268
Descriptors: On-Site Data Collections,On-Site Investigations, Planning, Handling,Sample, Sampling, Water Sampling, SurfaceWaters, Preservation, Wastewater
29
3-6
,
; ,
COLLECTION AND BANDLItNIG OF SAMPLES FORBACTERIOLOGICAL EXAMINATION
I INTRODUCTION'
The first step in the examination of a watersupply for bacteriological examination iscareful collection and handling bf samples.Information from bacteriological tests isuseful in evaluating water purification,bacteriological potability, waste disposal,and industrial supply. Topics coveredinclude: representative site selection,frequency, number, size of samples,satisfactory sample bottles, techniques ofsampling, labeling, and transport.
II SELECTION OF SAMPLING LOCATIONS
°The basis for locating sampling points iscollection of representative samples.
4A Take samples for potability testing from,.-:the distribution system through taps.Choose representative points coveringthe entire system. The tap itself shouldbe clean and connected directly into thesystem. Avoid leaky faucets because ofthe danger of washing in extraneousbacteria. lArellswith pumps may be 3-7considered similar to distribution systems.
B Grab samples from streams are frequentlycollected for control data or application ofregulatory requirements. A grab samplecan be taken in the stream-near the surface. f:
C For intensive stream studies on sourceand. extent of pollution, representativesamples are taken by considering site,method and time of-sampling. Thesampling sites may be a compromisebetween physical limitations of thelaboratory, detection of pollution peaks,and frequency of sample collection incertain types-of surveys. First, decidehow many samples are needed to be
\processed in a day. Second, decideWhether to measure cycles of immediateIpllution or more average pollution:Siterifiii: measuring cyclic pollution areimmediatelx below the pollution source.,SS:rnpling is frequent, for example, everythree hours.
e.A site designed to measure more averageconditions is fart enough downstr43am fora complete miiiirg of pollution and water.
a
Keep in mind that averaging does notremove all variation butonly minimizes--sharp fluctuations. Downstream sitessampling may not need to be so frequent
Samples may be collected 1/ 4, 1/ 2 and3/ 4-of the stream width at each site orot distances, depending on surveyobje yes. Often ohly one sample in thechap 1 of the stream is collected.Samples are usually taken near the surface
D Samples from lakes or reservoirs'arefrequently collected at the drawoff andusually about the same depth and may becollected over this entire surface.
E Collect samples of bathing beaoh waterat locations and times where the mostbathers swim.
III NUMBER, FREQUENCY AND SIZEOF,SAMPLES
A 63For determining sampling frequency fordrinking water, consult the USEPAStandards.
:300
1 The total number, frequency, and siteare established by agreement witheither state of USEPA authorities.A+
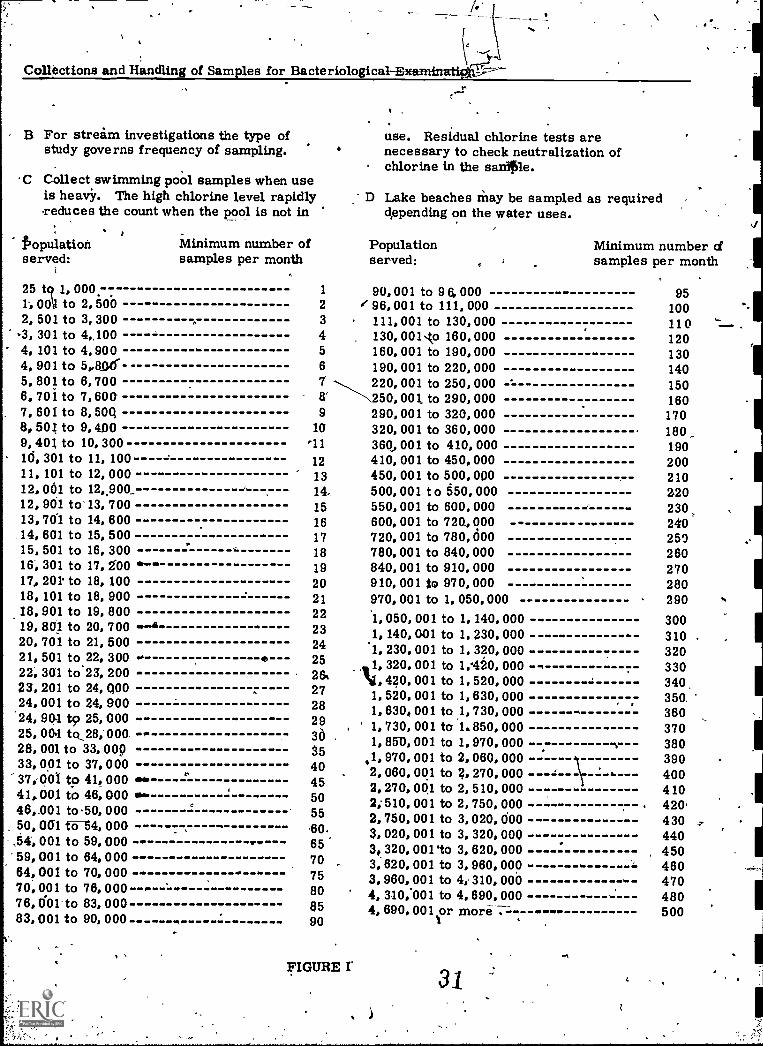
2 The minimum number depends upon thenumber of users. Figure 1 indicatesthat the smaller populations call for t
relatively more samples than largerones. The numbers on the left of thegraph refer to actual users and not thepopulation shown by census.
3 In the event that coliform limits of thestandard are exceeded, daily samplesmust be taken at the same site.Examinations should continue until twoconsecutive sarhples show coliforrhlevel is satisfactory. Such samplesare to be considered as special samples'and shall not be included in the totalnumber of samples examined.
4 Sampling programs described ab ve"represent a minimum nurn whichmay be increased by re awing:authority.
Collections and Handling of Samples for Bacteriologic rr
%.
B For stream investigations the type ofstudy governs frequency of sampling.
C Collect swimming pool samples when useis heavy. The high chlorine level rapidly-reduces the count when the pool is not in
Populationserved:
Minimum number ofsamples per month
use. Residual chlorine tests arenecessary to check neutralization ofchlorine in the sanifile.
D Lake beaches May be sampled as requireddepending on the water uses.
Populationserved:
Minimum number dsamples per month
25 to 1, 000,14 004 to 2, 5002, 501 to 3, 300
-3. 301 to 4,,1004, 101 to 4, 9004, 901 to 5,,80,45. 801 to 6, 7006, 701 to 7, 6007, 601 to 8,50Q8, 501 to 9, 4009, 401 to 10, 30016, 301 to 11, 10011, 101 to 12.00012, 001 to 12.,900..12, 901 to' 13, 70013, 701 to 14, 60014, 601 to 15, 50015, 501 to 16, 300
dr.. ea16, 301 to 17, 20017, 201 to 18, 10018, 101 to 18, 90018, 901 to 19, 800
1114.641 M19, ap to 20, 70020, 701 to 21. 50021, 501 to 22, 30022, 301 to23, 2003, 201 to 24, Q00
24, 001 to 24, 90024, 90.1 to 25. 0 0025, 004 to_28, 000.28, 001 to 33, 00933, 001 to 37, 00037;001 to 41, 000 04.
41, 001 to 46, 000 0046,901 to50, 00050, 001-154, 000
,54', 001 to 59, 00059, 001 to 64, 00064, 001 to 70, 00070; 001 to 76, 00076, 0.01 to 83, 00083, 001 to 90, 000
S.
S.
1
2
3
456
7
9la
*11
121314,1516171819202122232425
27282936354045505560.657075808590
90, 001 to 9 6, 000e 96,001 to 111, 000
111, 001 to 130, 000130, 001 sko 160, 000160, 001 to 190, 000190, 001 to 220, 000220, 001 to 250, 000250, 001. to 290, 000290, 001 to 320, 000320, 001 to 360, 000360,,,, 001 to 410, 000410, 001 to 450, 000450, 001 to 500, 000500, 001 to 550, 000550, 001 to 600, 000600, 001 to 7204 000720, 001 to 780, 000780, 001 to 840, 000840, 001 to 910, 000910, 001 to 970, 000970, 001 to 1, 050, 000'1, 050, 001 to 1, 140, 0001, 140, 001 to 1, 230, 0001, 230, 001 to 1, 320, 0001, 320, 001 to 1,120, 000
141, 420, 001 to 1, 520, 0001, 520, 001 to 1, 630, 0001, 630, 001 to 1, 730, 0001, 730, 001 to 1.850, 0001, 850, 001 to 1, 970.000
.1, 970, 001 to 2, 060, 0002, 060, 001 to 2, 270, 0002, 270, 001 to 2, 510, 0002;510, 001 to 2, 750.0002,750.001 to 3.020, 0003, 020, 001 to 3, 320, 0003, 320, 001.to 3, 620, 0003;620, 001 to 3, 960, 0003, 960, 001 to 4;310, 0004, 310;001 to 4, 690.0004, 690, 001 for more
44.
95100110120130140150160170180190200210220230240250260270280290
300310320330340.350.360370380390400410420,430440450460470480500
402
FIGURE I'31
E
F
I
Collection andling of Samples for Bacteriological Examination
Salt water or.estuarine beaches aresampled as needed with frequencydepending on use.
Size of samples depends upon examinationanticipated. Generally 100 ml is theminimuin size.
BOTTLES FOR WATER SAMPLES
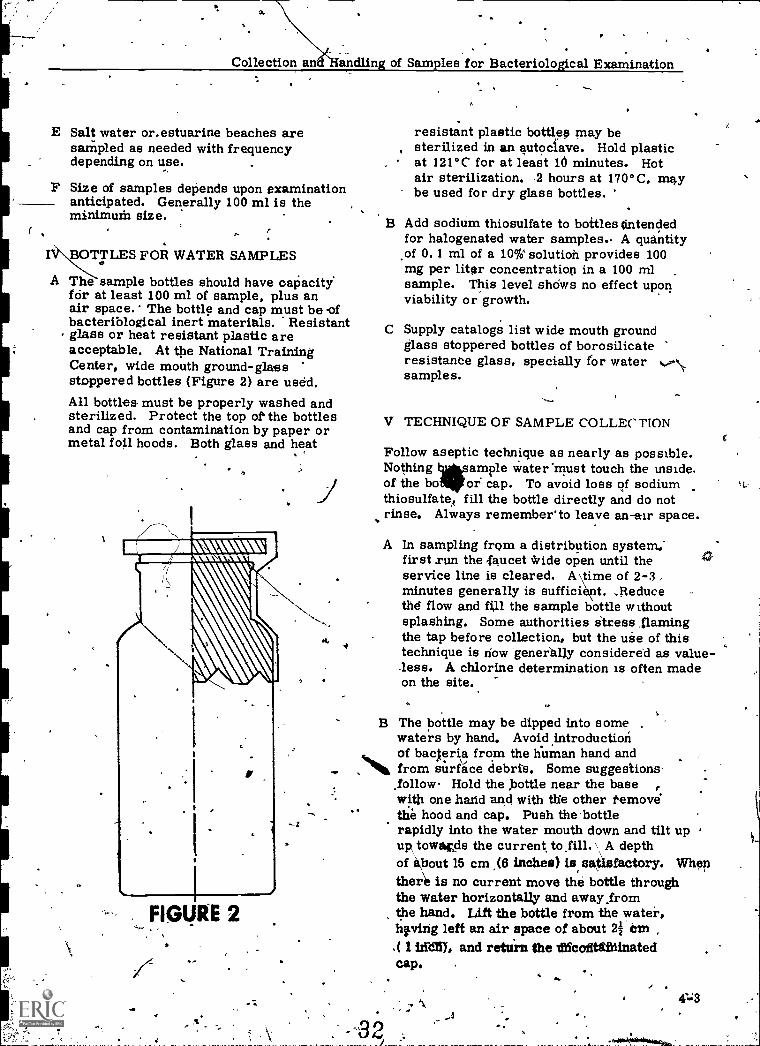
A The sample bottles should have capacityfor at least 100 ml of sample, plus anair space. The bottle and cap must be ofbacteribloEical inert materials. "Resistantglass or heat resistant plastic areacceptable. At the National TrainingCenter, wide mouth ground-glassstoppered bottles (Figure 2) are used.All bottles- must be properly washed andsterilized. Protect the top of the bottlesand cap from contamination by paper ormetal foil hoods. Both glass and heat
FIGURE 2
resistant plastic bottles may be, sterilized in an autoclave. Hold plastic
, at 121°C for at least 16 minutes. Hotair sterilization. -2 hours at 170°C, maybe used for dry glass bottles.
B Add soditim thiosulfate to bottles (intendedfor halogenated water samples. A quantityof 0.1 ml of a 10/0" solution provides 100mg per liter concentration in a 100 mlsample. This level shows no effect uponviability or growth.
C Supply catalogs list wide mouth groundglass stoppered bottles of borosilicateresistance glass, specially for watersamples.
V TECHNIQUE OF SAMPLE COLLECTION
Follow aseptic technique as nearly as possible.Nothing l7isample water 'must touch the insideof the bo or cap. To avoid loss of sodiumthiosulfate, fill the bottle directly and do notrinse. Always remember'to leave an-air space.
A In sampling from a distribution system;first run the -faucet tide open until theservice line is cleared. A time of 2-3minutes generally is suffici it. .Reducethd flow and fill the sample bottle withoutsplashing. Some authorities &tress .flamingthe tap before collection, but the use of thistechnique is now generlilly considered as value-less. A chlorine determination is often madeon the site.
B The bottle may be dipped into some .
waters by hand. Avoid introductionof baqeria from the liuman hand andfrom surface debris. Some suggestions-.follow- Hold the Pottle near the base ,with one hand and with We other removethe hood and cap. Push the 'bottlerapidly into the water mouth down and tilt upuRtowards the current to fill. \ A depthof about 15 cm ,(6 inchea) is satisfactory. Whenthere is no current move the bottle throughthe water horizontally and away fromthe hand. Lift the bottle from the water,h,vizig left an air space of about 21 cm.(I tffdfl), and retire the efeofitSfdinatedcap.
-54'4
Co llectiOn and Handling of Samples for Bacteriological Examination-
1
C Samples may be dipped from swimmingpools. Determine residual chlorine onthe pool water at the site. Test thesample at the labor ry to check chlorineneutralization by th biosulfate.
D Sample bathing,beach Water by wadingout to the 80, crn (2 ft) depth and dinning the'sample up from about 15 cm (3 inches) belowperrface. Use the procedure described" in
E Wells with pumps are similar todistribution systems. With ache.nd pumpedwell, waste water for about five minutesbefore taking the sample. Sample a wellwithout a pump by lowering a sterilebottle attached to a weight. A device will-ehopens the bottle underneath the waterwill avoid contamination by surface debris.
F Various types of sampling devices areavailable where the sample point isinaccessible or depth samples are :;esired.The general problem is to put a samplebottle in place, open it, close it; andreturn it to the surfaCe._ No bactegia butthose in the sample must enter the bottle.
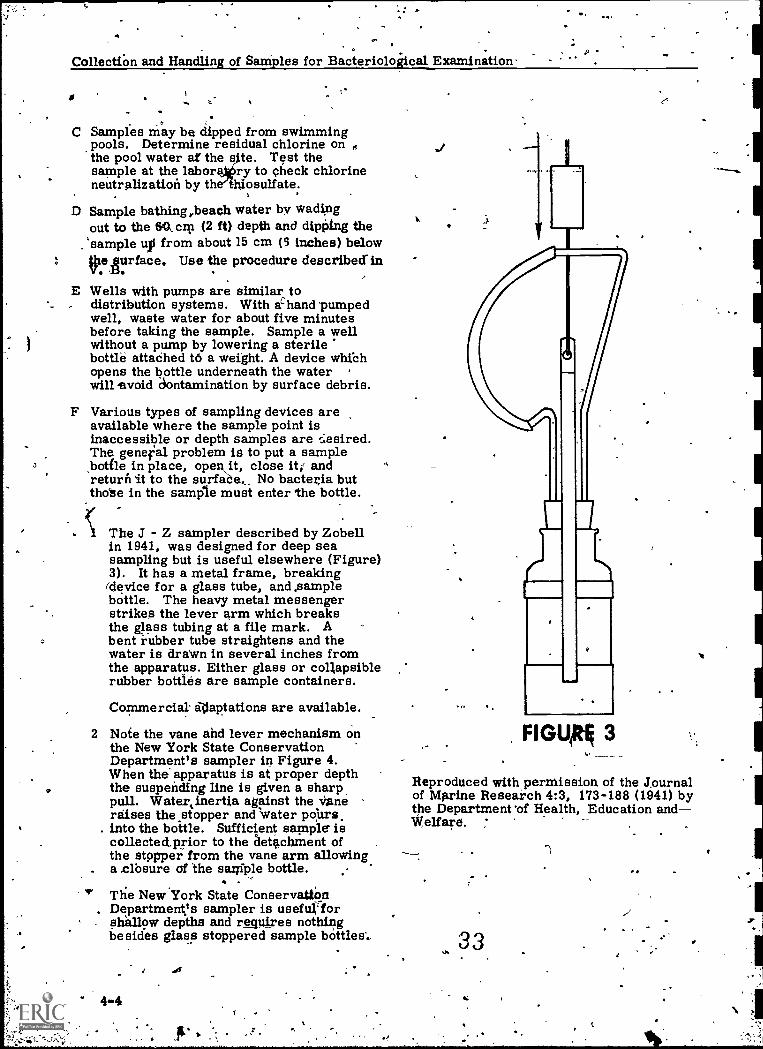
The J - Z sampler described by Zobellin 1941, was designed for deep seasampling but is useful elsewhere (Figure)3). It has a metal frame, breaking(device for a glass tube, and samplebottle. The heavy metal messengerstrikes the lever arm which breaksthe glass tubing at a file mark. Abent rubber tube straightens and thewater is drawn in several inches fromthe apparatus. Either glass or collapsiblerubber bottles are sample containers.
Commercial adaptations are available.
2 Note the vane and lever mechanism onthe New York State ConservationDepartment's sampler in Figure 4.When the apparatus is at proper depththe suspending line is given a sharp,pull. Water4inertia against the Vineraises the stopper and Water poltrs.
. into the bottle. Sufficient sample iscollectedprior to the detachment ofthe stopper from the vane arm allowing
. a .clbsure of the Bantle bottle.
v The New York State Conservation. Department's sampler is usefulfor
. shallow depths and requires nothingbesides glass stoppered sample bottlee.,
1
FIGUM 3
e--
Reproduced with permission of the Journalof Marine Research 4:3, 173-188 (1941) bythe Department 'of Health, Education andWelfare.
33

to
-°: 'Collection and Handlin
- FIGURE 4
3 A commercial sampler is availablewhich is an evacuated sealed tube witha capillary tip, When a lever on thesupport rack breaks the tip, the tube 'fills. Other samplers exist with alever for pulling the stopper, whileanother uses an electromagnet.
1/I DATA RECORDING
A Information generally includes: date,-timeof collection, temperature of water, locatioof sampling point, and name of the samplecollector. Codes are often used. Thelocation description must be exam enoughto guide another person to the site.Reference to bridges, roads *distance tothe nearest town may help. Use of-thesurveyors' description and maps are
. recommended. Mark identification on thehottleor on securely fastened tags:Gummed tags may soak off and areinadvisable."
0
s
of Sani les fdr Bacteltiold cal Examination
4
..B While a sanitary survey is an indispensable
part of the evaluation of a water supply, itsdiscussion is not within the scope of thislecture. The sample collector could supplymudh'information if desired.
VI SHIPPING CONDITIONS
The examination should commence as soon,as possible, preferably within one'hour. Amaximum elapsed time, between collection andexamination is 30 hours for potable watersamples and 6 hours for other water samples'(time from collection to laboratory, delivery).An additionall2 hours is,allowed from deliveryto laboratory to the completion of fii:st-daylaboratory procedures. Standard, Methods(14th Edition) recommends icing of samplesbetween collection and testing.
VII PHOTOGRAPHS
A photograph id a sample in that it is evidencerepresenting water quality. .Saraple collectorsand field engineers may carry cameras torecord what they see. Pictcres' help the generalpublic and legal courtg to better understandlaboratory data.
REFERENCES
1 APHA, AWWA, WPCF, Standard Methodsfor the Examination of Water and Wastewater.(12 Ed. ) 1965.
2 Prescott, S. C. , Winsldw, C. E. A. , and.McCrady, M. H. Water Bacteriology.- 6th Ed.,368 pp. John Wiley,and Sons, Inc., New York.1946.
3 Haney, P. D. i anci Schmidt, J. Representative.
Sampling and'Analytical Methods in StreamStudies. Oxygen Relationships in Streams,T ical Report W58-2 pp. 133-42. UP S.Depa m,ent df Health, Education and Welfare,
Healthealth Service, 'Robert A. Taft SanitaryEngineering Center,' Cincinnati, Ohio. 1058:
4 Velz, C. J. Sampling for Effec tive Evaluationof-stream Pollution. Sewage aid IndUstrialWastes, 22:666-84. 195.0.
344-5.
O
O
Collection and Handling of Samples for Bacteriological,Examination
5 Bathing Waters Quality and Health IIICoastal-Water. 134. pp. U. S -,
Department of Health, Education, ?and °
Welfare, Public Health Service, RobertA. Taft Sanitary Engineering, -Cincinnati, Ohio. 1961.
6 Zakell, C. E. Apparatus forWater Samples from Different Depths
- 4-6
o
CO
4
o
for Bacteriological Analysis. Journalof Marine Research, 4:3:173-48. 1941
This outline was-originally prepared by. A,4 G. 'Jose, former Microbiqlo°gist FWPCA
Training Activities, SEC and updated bythe TrainingStalf, -Natical Training andOperational Technology enter, OWPOUSEPA, Cincinnatii_phio 4268
Descriptors: Equipment MiCrobiology,Sampling, Water Sampling
.e0
O
O
->--
0
.1 i°
0
0i
1
O 0
4
0
I INTRODUCTION
BIOLOGICAL FIELD METHODS
A Mae to the nature of ecological inter-relationships, Methods for the collectionof 'different types of aquatic organismsdiffer. In general we can recognizethose that swim or float and those that -crawl, those that are big.and those thatare little. Each comprises a part of
.any given siii-vey'stationand consequently a 'complete" collectionwould include all types.
.B Field methods in the following outlirie
are grouped under four_general_categbries, the collection of:
o.1 Benthos (or bottom dwelling
organisms). 'these may beattached, crawling, or burrowingforms.
2 Plankton ( plankton). :these areusually microscopic plant and .
animals feebly swimming, drifting,or suspended in the open water.
r.3 Pei-iphyton or "aufwuchs") This is
the community of organismsassociated with submersed .substrates.Some are'attached, some crawl. Thegroup is intermediate between thebenthos and the plankton.
ti 4 Nekton= Nekton are the larger,free swimming active animals suchas shrimp or fishes. -
AC Aquatic mammals, birds, amphibians,
reptiles, and in most cases,; requirestill other approaches and are not included:
D There is little basic difference betweenbiological methods for oceanic, estuarine,or-freshwater situations except thosedictated by the physical nature of theenvironments and the relative 'sizes ofthe organisms.
Fish, benthos, and planktm Collectioniaessentially the mime whether con-ducted in Lake Michigan, Jones'Beach, or the Sargasso Sea.
.1 Marine organisms: range to larger
-sizes-r-and-the.cor-r-osive nature of .---seawite dictates Ipe,cial Ore in
C. 0
the design arid maintenance\ ofmarine`equipinent'.. Site selectionand collection schedules areinfluenced by such factors as tidal
2
ge
currents and periodicity, andsalinity distribution, rather than(river) currents, riffles, and pools.
Freshwater organisms are ingeneral smaller, and the water sseldom chemically corrosiy onequipment Site selection instream's involves riffles, falls,pools, etc.-,' and a unidirectionalflow pattern. _Lake collection mayinvolve less predictable strati-fication or flow patterns.
E Definite-objectives shoult lie establishedin:advance as.to the size range of -organisms to be collected and counted,
e. : microscopic only, microscopicand macroscopic, those - retained by .-,'30 mesh" screens, invertebrates and/or vertebrates, etc.
-
II STANDARD PROCEDURES .
Etl. MEr. fm. 1k. 2.81
Certain standard supplementaryprocedures are a part of all fieldtechniques. In order to be interpretyand used, every collection must beassociated with a record of-environ-mental conditions at the time ofcollection.
-
Data recorded should include thefollowing as far, as practicable.
Location (name of river, lake, etc,,. )
ute quadrangles
1
Marked USGS 7are reconimende
5-1
Biological Field Methods.
f-
Station number.(particular locationof which a full description shouldbe on record)
Date and hour
Weather
Air temperature
Wind direction and velocity
Sky or cloud cover
Water temperature (at variousdepths, .if applicable)
Salinity (at various depths, ifapplicable)
Tidal flow (ebb br -flood)L
Turbidity (or light penetration, etc.)
Water color
Depth
Type of bottom
Type of collecting device andaccessories
Method of collecting
Type of sample (quantitative orqualitative)
Number of samples at each station
Chemical and phydicaf data,' e.(replicates and stratification)dissolved oxygens nutrients pH, etc.
Collector's name
Miscellaneous-obrvati9ns (oftenvery important)
. .
.2 All collecting containers should beidentified at least with.location,station number, sample number,and date. iiirSares are very handy.
Much transcription of data can beeliminated by using sheets or cardswith a uniform arrangement forincluding the above data. TheSame field data sheet 'may includefield or laboratory analysis.
13 Compact kits of field collecting equip-ment and materials greatly increasecollecting efficiency, especially if thecollection ekite is remotelromtransportation.
III PERSONAL OBSERVATION AND.PHOTOGRAPHY
A Director indirect observation of under-water conditions has become relativelyefficient.
1 Submersibles\ are proving veryimportant for deep waterobservations:
.2 Use-tof-aqualungRern4ts directpersonal stay, down to Over 200 feet:.
3 UnderWater television (introduced bythe British Admiralty for militarypurposes) is riow generally availablefor biological and other observations.
4 Underwater photography is improving'in quality and facility.
Underwater swimming or use ofSCUBA is quite valuable for directobservation and collecting.
6 Smaller hand held water lens orwategrA4Aescopes are very useful.in shallow water.
5
IV COLLECTION OF BOTTOM ORBENTHIC ORGANISMS
A Shoreline or Wading Depth Collecting
f Plates I, II
1 Hand picking of small fOrins attachedto or crawlirig off rocks, sticks, etc.when lifted out of the water is a .
r _
'7%

.
Biological Field Methods
fundamental and much used _
method for qUcidy assaying whatis present and what may be expectedon further search.
2 Patches of seaweed and eelgrassand shallow weedy margins any-where are usually studied on aqualitative basis only.
a The apron net is one of the besttools for animals in weed bedsor other heavy vegetation. Itis essentially a pointed wiresieve on a long handle withcoarse screening over the topto keep out leaves and sticks.
b Grapple hooks or a rake maybe used to pull-masses ofvegetation out on the bankwhere the fainie7inay.beexamined and collected as theycrawl out.
t'
c Quantitative Alimates of bothplants and animals can be madewith a "stovepipe" samplerWhich is forced down througha weed mass in shallow waterand embedded in the bottom.
. Entire contents can then be' -bit ired.but into a sieve and .
- sorted, .
A frame of known dimensions .may be placed over an area tobe siMpledand.the materialwithin cropped out. This is
, especially good for larger. plants and large bivalves.
This method yields quantitative'data.'
3 Sand and mind flats in estuaries andshallow lahe may be sampledqu-antitatively by marking off a -desired area and either diggingaway. surrounding mat rial orexcavating thedirlitedto a measu1 deoperated samplers recentlydeveloped by Jackson and
*It
Larriinore, make for more effectivesampling of a 'variety of bottoms downto the depth of the handles. Suchsamples are then washed through gradedscreens to retrieve the organisms.
4 Ekmaa grabs Are most useful on softbottoms. This is a completely closingclamshell type grab with spring operated
Jaws.Size of grab is usually 15. 2 x 15.2 cm
or 22.9 x'22. 9, the 30.5 x 30.5 cm sizeis impractical due to its heavy weight wilenfilled with bottom material.
For use in shallow water, it is conVenientto rig an Ekman witha handle and a hancpperated jaw release mechanism.
The Ekman may also be fitted with a hYdraulic,operated closing mechanism for "hard"substrates.
4
5 the Petersen type grab (described below) ,without weights will take satisfactory' samples-in firm muds, buttends to bury itself, invery soft bottoms. It is seldOm ueed inshallow water except as noted below.
B ,Collecting in Freshwater Riffles or.Rapids
1 The riffle is the most satisfactory habitatfor,corrIparing stram conditions at. differentpoints.rte, e-
2 The hand screen is a simple and sy deviceto use in this 'situation. Resulting collectionsare qualitative only.
a In use the screen is firmly planted in the.stream bed. Upstream bottom is thoroughly'disturbed With tEie' feet, .o worked- overhand by another person. Organisms
. caloc ged are carried down into the screen.. .
b Screen is then lifted and dumped into sort-inging tray or collecting jar.
385-3
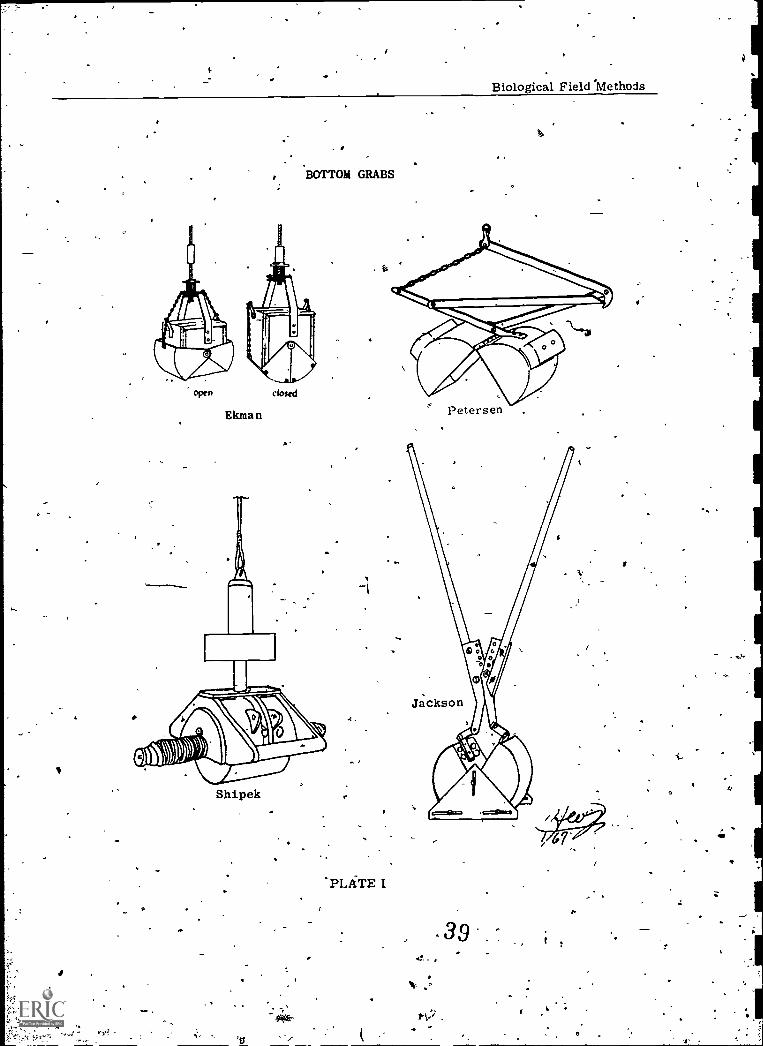
Biological Field Methods
-E
BOTTOM GRABS
open
Ekma n
closed
Shipek
- .39
e

Biological Field Methods-4
'
LIMNOLOGICAL' EQUIPMENT)
Surber Sampler
(.
,
ri
Specimen, or
0reagent bottles
Soiting pan
`PLATE
,4 0
Pail
9

EtioioiOcal Field Methods
F
3 The well-known Surber sampler isone of the best quantitative collectingdevices for riffles.
It consists of a frame 30.5 cmsquare with a conical net attached.It is usable only in moving water.
In use it is firmly planted on thebottom. The bottom stones and ---*`\gravel within the square frameare then carrefu1ly gone over byhand. to ensure that all organismshave been dislOdged and carriedby the curqnt inta.the.net. Astiff vegetle brush' is often usefulin this regard. .0
From three to fi square-footsamples should ae ken at eachstation to insur at a reasonablepercentage of the species presentwill be represented.
d Long sleeved rubber gloves (trap-pers) are, recommended for winteruse.'
4' The Petersen type grab may be usedin deep swift riffles or where theSurber is unsuitable..
a It is plantandWith tt1lfeet.
b It is then closed alul lifted bypulling on the rope in the usualmanner.
5 A strong medium weight D framedipnet is the closeseapproach to auniversal collecting tool.
d by hand on the bottom,d down into the bottom
a sweeping Aeed beds, and StreamMargins
This is used with a sweepingmotion,through weeds, over
. the bottoms or in open water..a triangulargular shape is preferredby some.
-510.b Stop net or Kickinfechnique
541"..?'
9
166
c
d
r
This may be used as a roughly quan-titative device in riffles by holdingthe end flat against the bottom anddisturbing the substrate with one's .
feet. A standard period of time isused.
Thehandle should be from 1 to 2meters long, and about the weightof a garden rake handle.
The Dor sprfasten
g should be made of steelbrass, and securely
to the handle. It shouldrong but not cumbersome; size
of ring stock will depend on widthof ring.
e The bag or net should be the strong-.est available, not over 3 mm mesh.Avoid mesh which is so fine that,the net plugs easily and is slow andheavy to handle. A shallow bag ispreferred.
f A wide canvas apron sewed aroundthe rim will protect the bag. Therim, may be protected with leather.
Drift nets are set for predeterminedperiods.
D Deep Water Benthic Collecting Plate III
1 'When sampling from vessels, a craneand winch, either'hand or power operated,is used. The general ideas describedfor 'shallow waters apply also to deeperwaters1 when practicable.
2 The Petersen type.grab, seems to be.the best all around sampler for thegreatest variety of bottoms at all depths,from shoreline down, to over 10, 000 fimeters. ;Plate I) - , .
a It .consists of two heavily constrtictedhalf cylinders closed together by,astrong lever action.
-9
.
.
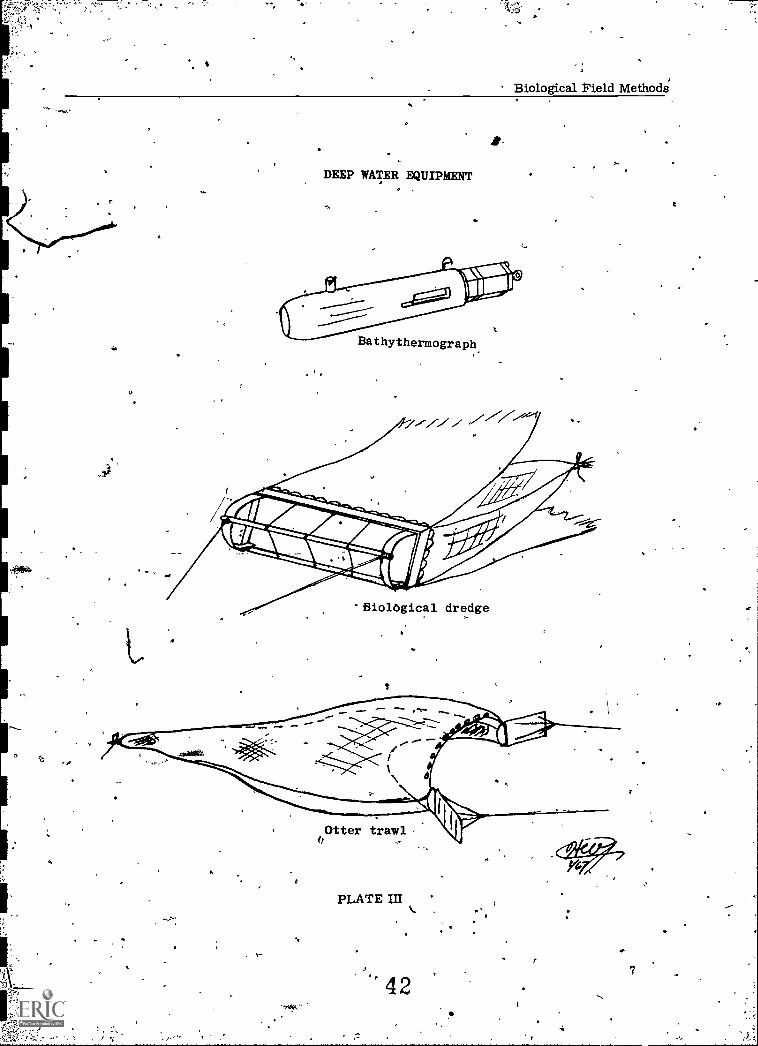
Biological Field Methods
.
r
S.
DEEP WATER EQUIPMENT
Bathythermograph.
Biological dredge
Otter trawl1
PLATE III '
42r
7
Biological Field Methods
b . To enable them to bite intohard bottoms, or to be used instrong currents, weights maybe attached ,to bring the totalweight up to betiveen 22.7 and45.4 kg.
c Areas sainpled-range from1/5th to 1/2.0th square meters.
d A Petersen grab to be hauledby hand should be fitted with(15 mrnor 20 mm) diametertwisted rope in order tciprovideadequate hand grip. It ik besthandled by means of wire ropesand a winch. °
3 Other bottom samplers, include theVanVeat, Lee, Holmes Smith-McIntyre, Knudsen, Ponar, KAJAand others.
4 A spring loaded sampler wasdeveloped by Shipek for use oall types of bottoms. It takes ahalf-cylinder sample, 1/25th squaremeters in area and approximately10 cm deep at the center. The deviceis automatically triggered on.contactwith the bottom, and the sample iscompletely protected enroute to the --surface. (Plate I)
its own advantages and dis-advantages and it is up to the'worker and his operation to decidewhat is best for his particular needs.The Petersen and Ekman grabs andand corers are perhaps the mostcovunonly used.,
7 .Traps of m types are used forvarious benthi rganisms,especially crabs d lobsters.Artificial substrata s (below) are in.essence a type oft ap.
8 Non-irandon distribu on of 'biologicalcommunities is a rea challengefor the biologist.
E Manipulated substrates rel on the.ecological predilection of o anis"msto settle wherever they find suitablehabitat. When a artificial ha' tat is Aprovided, it tends to become copulatedby all available species partial o thattype of situation. The collector anthen at will remove the habitat or trapto his laboratory and study the pops a-tion at leisute. Two weeks for peri hytonand four weeks exposure time -for ma in-;vertebrates are the usual standardizedtime frames.
. 5 Drag dredges or scrapes are oftenused'in marine waters and deeperlakes and streamseand comprise ,
the basic equipment of .several typesof commercial fisheries. Sometypes have been developed forshallow streams. In generalhowever, they have been littlg usedIn fresh water.
/6 The above is only a partial listing
of the raany'sampling deviceavailable.- Others that arc oftenencountered are 'the orange-peelbucket, plow dredge, scallop typedredge,. hydraulic dredges, andvarious coring devices. Each has
This versatile reSe h technique ismuch used fOr both' utine monitoringand exploratory studies of pollution.It is also exploited commercially, -especially for shellfish production.Types, of materials use include:
Cement plates and panels.
Wood (especially fcir bu'r_rowingforms).
. .
2
3 Glass slides (diatometer or ,
periphytometer).
4 Hester -'Dendy multiple plate trap(masonite).
5 Baskets(or other containers)holding natural bottom materialand either imbedded in the bottom,or suspended in the overlyingwater:,
43
.

A
ce. Biological Field Methods
6 Unadorned ropes suspgnded in thewater, or sticks thrust into thebottom. ,
4kik
7 A variety of plastic forms.O
F Sorting and Preservation pf Collections
1 Benthic collections usually consist-of a great.masb of mud and otherdebris among which the organismsare hidden. Various proceduresmay be followed to sepai-ate theorganisms.
a The prganisms may be pickedout on the spot by hand or theentire mess taken into thelaboratory where it can beexamined more efficiently(especially in rough weather).Roughly equivalent time willprobably be required in either_case.
N
N
b Specimens may be observedand recorded or preserved as'a permanent record.
c Organisms may be simplycounted, weighed, or measuredvolumetrically; or they may beseparated and recorded ingroups or species.
If separation is in the field this isusually done by hand picking, screen- ',ing, or some type of flotation process. -The less debris or substrate in thesample reduces picking time.
a Handpicking is best done o.white enameled tray usinglight touch limnological forceps.
b Screening is one of the mostpractical methods to separateorganisms from debris in thefield. Some prefer to use asingle fine screen, othersprefer a series of 2 or 3screengof graded sizes. 'thecollection may be dumpeddirectly on the screen and themud and debris washed through,
//
or it may be dumped Into abucket or small tub.. Wateris then added the mixture iswell stirred, and the super-natant poured through thepartially submerged screen.While doing this the screen isgently agitated or swirled.The residue is then examinedfor heavy forms that will notfloat tip.
.c A variation of this Method insituationswhere there is nomud is to pour a strong sugar2r salt solution over ffieTollection in the bucket, stirit well, and again pour thesupernatant through the screen.This time, however, savingthe flotation solution forre-use. The heavier than -water solution accentuates theseparation of organisms fromthe debris (except for the,heavy shelled molluscs, etc.).
; A solution of 1.13 kg, of sugarper 3. 79L of water is consideredto be optimum.
3 Preservation or stabilization isusually necessary in the field.Rose bengal may be added to thepreservation to aid picking bystaining the organisms.
a 95% ethanol (ethyl alcohol) ishighly satisfactory. A finalstrength of 70% is necessaryfor prolonged storage. If thecollection is drained of waterand flooded with '95% ethanolin the field, a laboratoryflotation separation. can usuallybe made later, thus saving.much time. Considerable
.quantities of ethanol arerequired for this procedure.
Formaldehyde is more widelyavailable and is effective inconcentrations of 3 -10% ofthe commercial formulation.However, it is highly suspect
5-9

Field Methods
d
and is not recommended.
Properly preserved benthossamples may be retainedindefinitely, 'thereby enhancingtheir utility and ultimate value.
,
Refrigeration or-icing is veryhelpful if many collections madein a short time are to be pickedby few individuals.
e There is no single all purposepreservative for unsorted samples.For example some specialistswould like their material killedin boiling water. fixed in fOrmalinor other solution and preserved inalcohol. The field inyestigator°usually comprdmises because ofthis problem. Aga.in it all dependsonthe study objectives,
V MICROFAUNA AND PERIPHYTON(OR AUFWUCHS)SAMPUNG
A This is a relatively new area whichpromises to be of great importance.The microfauna of mud and sandbottoms may be studied to some extentfrom collections made with the variousdevices mentioned above. In mostcases_however, there is considerableloss of the smaller forms.
It
D PeriphYfon-attached to or associatedwith hard surfaces su'c'h as rook orwoodanay be sampled by scraping orotherwise removing all surfacematerial from a measured area. Theperiphytou, however, is, more effectivelyquantitatively sampled by manipulatedstibstratetechniques described above.
VI THg COLLECTION, OR SAMPLINGOF PLANKTON PLATE' IV
A *hytoplankton: A Planngd Program is*-Desirable
B Most special microfauna samplers forsoft bottoms are essentially modifiedcore samplers in which an effort ismade to bring up an undisturbed portionof the bottom along with the immediatelyoverlying water. The beat type currentlyseems to be the Enequist sampler whichweighs some 35 kg. and takes a 100 sq.cm sample 50 cm. .deep.
C Microfaunafrom the surface of hardsand or gravel bottoms may be sampledby the Hunt vacuum sampler. This hasa bell-shaped "sampling" tube sealedby gliss diaphragm. On contact withthe bottom, the, glass is automatically.broken and.the nearly bottom materialis swept up into a trap.
A planned program of plankton.a.np.lysis should involve periodicsampling at weekly or even morefrequent intervals.
A well-planned study or analysisof the growth pattern of planktonin one year will provide abasisfor predicting conditions thefollowing year since seasohalgrowth patterns tend to repeattl-temselves from year to year.
a Since the seasons and the yearsdiffer, records accumulatedover the years become more 'useful.
b As the time for an anticipatedbloom of some troublesomespecies approaches, thefrequency of analyses may beincreased.
8 Detection of.a bloom in its earlystages will facilitate moreeconomical control.
-B Field 'Aspects of the Analysis Program
1 Two general aspects of planktonanalysis are compionly recognized:quantitative and qualitative.
45
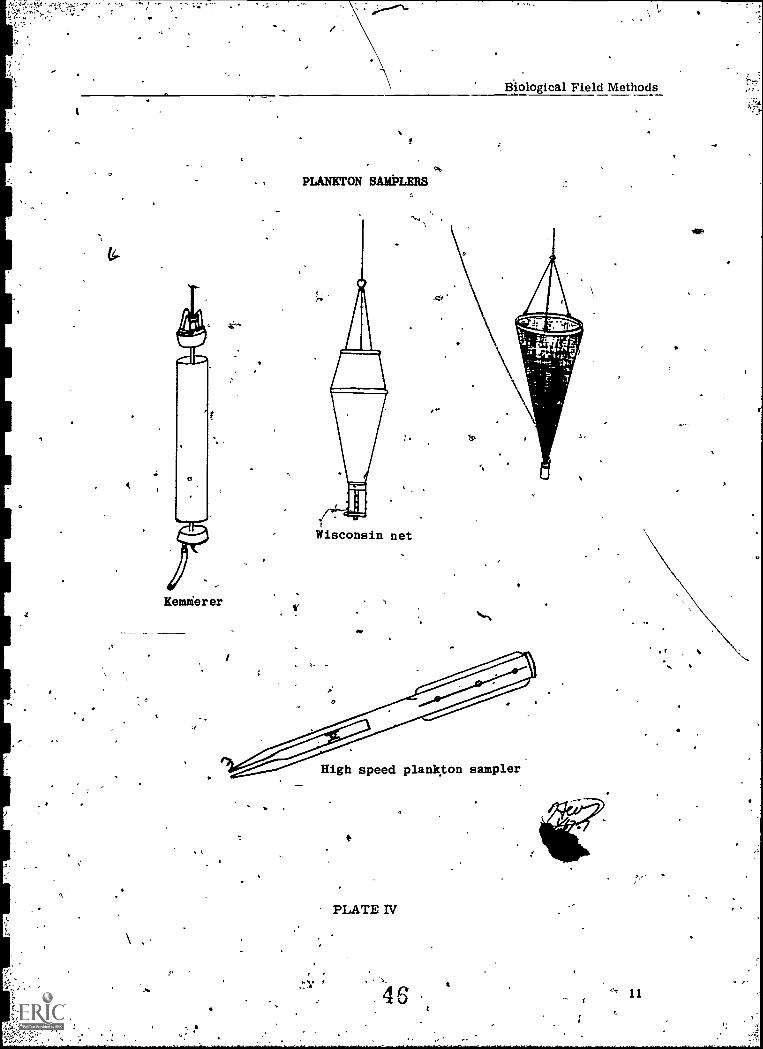
KemMerer
PLANKTON SAMPLERS
Wisconsin net
Air
Biological Field Methods
ON
High speed plankton sampler
PLATE IV
464
11
Biological Field Methods
a Qualitative examination tellswhat is present.
b Quantitative tells how much.,
c Either. approach is useful; acombination is best.
2 Equipment for collecting samplesin the field is varied.
a A half-liter bottle will servefor surface samples of
. phytoplankton, if carefullytaken.
b' A Kemmerer, Nansen, or otherspecial sampler (small batteryoperated purrips are time saving)is suggested for depth samples.
c Plankton nets concentrate thesample in the act of collectingand also capture certain largerforms which escape fromthebottles. Only the more, elaboratetypes are quantitative however.For phytoplankton, #20 or #25size nets are commonly used.Usually a net diameter of 13-29''Fmis sufficient. Smaller forms, willpass any net.
d The dilemma in choosing a net liesin the fact that larger meshes allowwanted forms to escape whilesmaller mesh nets tend to clogand increase evasion possibilitiesof wanted_, forms.
C ooplankton Collecting
1 Since zooplankton have the ability toevade sampling devices, nets towedat moderately fast speed are usedfor their capture. Number 12 nets(aperature size 0.119 mm, 125 meshes1 inch) or smaller numbered net sizesare commonly used. A stet diametergreater than 13 cm is preferred.
Frequently half meter nets or largerare employed. These may be equippedwith flow measuring devices for
e
measuring the amount of water enter-ing the net.
3 the devices used for collecting. planktoncapture both the plant and animal types.
- The mesh size (net no. ) is' a method forselecting which category of plankton isto be collected.
D The Location of Sampling Points
1 Both shallow and deep samples aresuggested.
a "Shallow" samples should be taken ata depth of 15 cm-to 30 cm. Thesurface film is often significant.
b ''Deep"/samples should be takensuch intervals between surface andbottom as circumstances dictate.In general, the entire water columnshould be sampled as completely al;practicable, and the plankton from -each level recorded separately.
2 For estuarine plankton, it is necessaryto sample different periods in the stageof the tide, otherwise samples wouldbe biased to egiven time, or type ofwater carried by the tidal currents.
3 Plankton is subjected to the force of thewinds and currents. As a result, theplankton is of n in patches or "windrows" (Lan uir cells); For this reasonwhen using a et, it is often desirableto..tow. the net. at right angles to the wind orcurrent.
4 Nearly all plankton ih'oriztotallydiscontinuous. Planktonic organismstend -to be numerous near the bottom indaylight, but distributed more evenlythrough the water column at night.Therefore, a series' of tows or samplesat different depths is necessary to obtaina complete sampling, One techniqqeoften employed is to take an obliquetow from the bottom to the top of thewater column.
47
6
6t studies to indicate samplinglocations and-intervals are oftenmandatory. Some studies requirerandoin sampling points.
The number of sampling stationsthat should be established is limitedby the capability of the laboratory toanalyze the samples, but shouldapproach the needs of the objectivesas closely as possible.
..
Biological Field Methods
7 Field conditions greatly affect theplankton, and a record thereofshould be carefully-identified withthe collection as in II above.
8 Provisions should be made for theAfield stabilization of the sampleuntil the laboratory examinationcan be made if more than an houror so is to elapse.
a Refrigeration or icing is veryHelpful, but ice should neverbe placed in the sample.
b Fgols solution is a goodpre
c Ultra-violet sterilization lbsometimes used in the laboratoryto retard the decomposition ofplankton.
d A highly satisfaCtqry merthiolatepreservative has been describedby Weber (196
VII COLLECTING FISH AND OTHERNEKTON PLATES V, VI
}A Fish and' other nekton muse be soughtthe obscure and unlikely areas as wellas'the obvious lbcations in order for thecollection to be complete. - Severaltechniques should be employed where-sever possible (this is appropriate forall biota). It is advisable to check withlocal authorities to infOrm them of thereasons fOr sampling, because many of
the techniques are not legal for thelayman. In this area, perhaps morethan any other, professionally trainedworkers are important. Also, theremust be at least one helper, cas a single
. individual always has difficulty iri pullingboth ends of a 7 meter seine simultaneously:
The more common techniques are listgod-below.
B Seines
1 Straight seines range from 2,metersand upwards in length. ''Commonsense" minnow seines with approxi-mately 6 mm mesh are widely used 4.
g shore for: collecting the smallerfishe
4:3
2 Bag seines have an extra Strap orbag tied in the middle which helpstrap and hold fish when seining indifficult situations.
I
C Gill nets are of use in offshore and/ordeep waters. They range in lengthfrom approximately 27.4 meters upward.A mesh size is designed to catch aspecified size of fish. The trammel netis a variation of the gill net.
D Traps range from small wire boxes orcylinders with inverted cone entrancesto semi-permanent weirs a alf mile ormore in length. All tend to induce fishto swim into an inner chamber pro-tected by an inverted cone or V - shapednotch to preveescape. Current'operated' rotating fish traps are also'very effective (and equally illegal) in
.suitable situations.
E 4 - .Trawls are submarine nets, usually ofconsiderable, size, towed by vessels atspeeds stifficient to overtake and scoopin fish, etc. The mouth of the net mustbe held open by some device such as along beam (beam trawl) or two or more,vanes or "otter boards" (otter trawl).Plate III
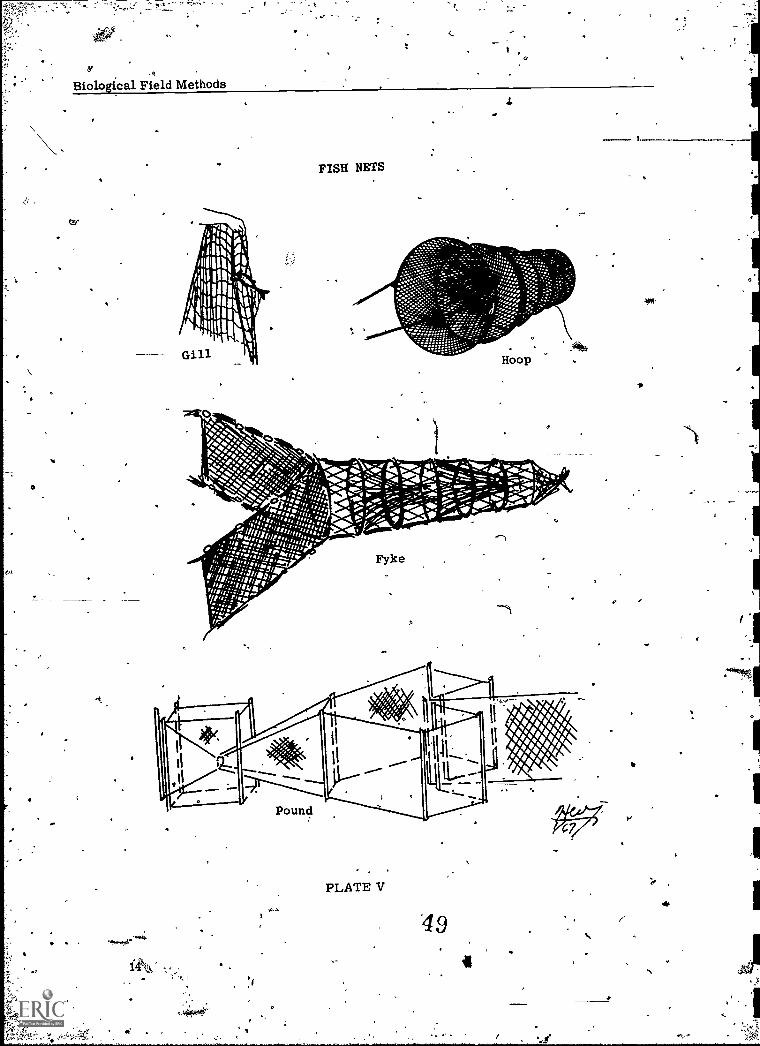
O
OA
Biological Field Methods
"'
0
IAN
Gill
FISH NETS
PLATE V
49a

4
tia
/
.
Cod end
G.
50
a
2
-
o
5
oy PLATE VI
Electrically
controlled doors
MIDWATER TRAWL
11.
O
51
41
Biological Field Methods
1 Beam and otter trawls are usuallyfished on the bottom, but ottertrawls when suitably rigged axenow being used to fish mid- depths.
2' The midWater trawl resembles ahuge plankton net many feet indianieter. It is proving very effec-tive for collecting at mid-depths.
Numerous special designs have been/. developed. Plate VI
F Electric seines and screens are widelyemployed by fishery workers in small-arid difficult streams. They may alsobe used in shallow water like areas withbertain reservations.
G Poisoning is much used in fishery studiesand management. Most widely used andgenerally satisfactory is rotenone in *varying formulations, although manyothers have been employed from time totime, and some appear to be very goad.Under suitable circumstances, fish mayeven be killed selectively according tospecies.
H Personal observation by competentpersonnel, and also informal inquiriesand discussions with local residentswill often yield information of'real use.Many laymen are keen observers,although-they do not always'understandwhat they are seeing. The organizedcreel census technique yields data onwhat and how many fish. are beingcaught.
I Angling remains ih its own right a very-good technique in .the hands of the skilledpractitioner, for determining what fishare preperit. Spear-fishing also is nowbeing used in some-studies..
J Fish and other nekton are often taggedto trace their movements duringmigration and at other times. Minia-ture radio transmitters can now beattached or frd to fish (andMherorganismS)Ikhich enable them to be .tracked over considerable distances.
O
. .
,Physiological information is oftenobtained in this way. This is knowh astelemetry (remote sensing).
VIII SPECIA L REQUIREMENTS ON' BOATS
Handling biological co4ectiorfe (as con-trasted to chemical and physical sampling)on board boats,,differs ittr.,,Qie size of thecraft and the Magnitude of operations.Some,Ossible sterns are listed below.Hoisting and many'other types of gear areused in common with other types ofcollection, and will not be listed.
A
B
Special Laboratory Room(s)
Constant flow of .Clean water for'culturing organisms. (Selection ofmaterials,and design of a system to.insure non-toxic water maybe verytroublesome but very important. )
C Live Box built into ship at water level
D Refrigeration ,System(s)
1 For controlling temperature ofexperimental organisms in,laboratory. 7.-"'
2 For deep freezing and storage ofspecimens to be examined later.
E Storage Space (Unrefrigerated)
F Facilities for the safe storage and useof microscopes and other laboratoryequiprnent..
G Facilities for the safe storage and useof deck equipment.
Administrative access to\he Captainand Technical Leader in order tocoordinate requirements for biologicalcollection (such as a slow plankton tow)with those for other collections.
1-1
ft
Safety of persOnnel working, in and.around boats,. as well ae in other fieldactivities should be seriously con-sidered and promoted at all times.
52c.

Biological Field Me
IX OTHER TYPES OF BIOLOGICALFIELITSTUDIES INCLUDE
A Productivity Studies of Many Types
13 Life Cycle and Management
'Distribution of Sport or (potentially)Commercial Species
Scattering Layerssnd Other SubmarineSound Studies
. E Artificial Culture of Marine Food Crops.4
F Radioactive Uptake. .
G Growth of Surface-Fouling Organisms
H Marine Borers
I. Dangerous Marine Organisms
J Red Tides
K Others
X SOURCES OF COLLECTINGEQUIPMENT.
Many specialized items of.biologicalcollecting equipment are not availablefrom the usual laboratory supply houses.ConseqUently, the .American Society of
.Limnology and Oceanography has compileda list of companies handling such items°and released it as "Special PublicationNo. 1, Sources of Limnoligical aryl
'sOceanographic Apparatus and Shiplies. 11Available from the Secretary of 1,he Society.
Life preservers(jacket type work vests) shoUldbe worn at all times when on or near deep water.Boats should have air-tight or foam-filled com-'partments for flotation and be equipped withfire extinguishers, miming lights, oars, andanchor. Qast Guard regulations should alwaysbe observed. All boat trailers Ahould.have tworear running mid stop lights and turn signals -z,and a Anse plate illuminator. Trailers..2 meters(wheel to wheel) or more wide should be equippedwith amber marker lights on the front and rearof he frame on both sides.
Laboratories should be provided With fireextinguishers, fume hoods, and eye fohntains.Safety glasses should be worn when mixingdangerous chemicals and preservatives.
XII BIOLOGICAL METHODS
Bioldgical methods and samples are inmany ways analagOus to chemical methodstid samples. They are.tmique however inany other ways especially so because of
inherent biological variability.
,A The organisms are nearly alwaysdistributed non-randomly.
There is seasonal variation.
There is much diel periodicity(24 houractivity periods).
Properly handled and preserved, theymay retain their integrity indefinitely.
Most biological samples require abiologist to collect.
Bo
C
D.
-E
XI SAFETY
The hazards associated with work on or nearwater require special consideration. Personnelshould not be awned to duty alone in boats,and should be competent in the use of boatingequipment (Courses are offered by the U. S.Coast Guard). Field training should also includeinstructions on the proper rigging and handlingof biological sampling-gear.
53 5-17
I
%ma
C
. dI
Biological-Field Methods
:MO
References
st'
1 Standard-Methods for the Examination Of
Water and, Wastewater, 15th Edition.APHA, AWWA, WP?C. Pizbl. by Am:Pub. Health Assoc. New York. .
2. Weber, C. I. Biological Field and LabMethods for Measuring the Qualityof Surface Waters and Effluents.U., S. Environmental ProtectionAgency, National TEnvrronmentalResearch Center, Cincinnati, OHSEnvironmental Monitoring Series670/4-73-001. July, 1973
3 Hellawell, J. M. Biological Surveillanceof Rivers. Water Research Center.Stevenage. 1978.
4 Green, Robert H. Sainpling Design andStatistical Methods for Environmental.Biology. Wiley. 1979.
This outline was prepared by H.W. Jackson,Firmer Chief Biologist, National Trainingand Operational Technology Center, OWPO,EPA, Cincinnati, OH 45268, and revised byR. M. Sinclair, Aquatic Biologist, NationalTraining` and Operational Technology* Cent
Descriptors:Aquatic Environment, Analytical Techniques,,Sampling, On-Site Investigations, Preset.=
"vation; Samplers; Water Sampling, Handling,Sample, Surface Waters, Aquatic Life,Biological Methods
9, 9 ,
sf.4. ,,
.
-a
IS
. 2
2.
'a t..Z.
a -
visa
tA
Ao
5
54.
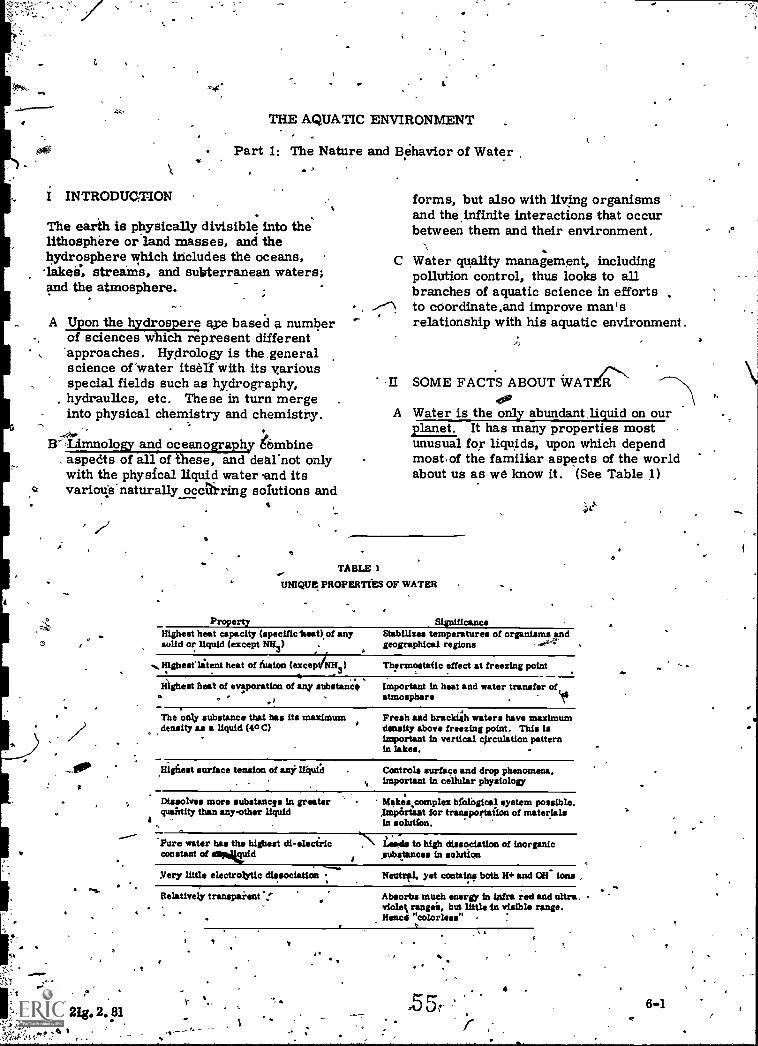
THE AQUATIC ENVIRONMENT
Part 1: The Nature and Behavior of Water
I INTRODUCTION
The earth is physically divisible into thelithosphere or land masses, and thehydrosphere which includes the oceans,
streams, and subterranean waters;and the atmosphere. ;
A Upon the hydrospere are based a. numberof sciences which represent different
, 'approaches. Hydrology is the ,generalscience of'water itself with its variousspecial fields such as hydrography,hydraulics, etc. These in turn mergeinto physical chemistry and chemistry.
B' ,Limnology and oceanography 6mbineaspedts of all of these, and deanot onlywith the physical liquid water and itsvariottsnaturally occairing solutions and
0
. BI. 21g. 2. 81
'
O
forms, but also with living organismsand the infinite interactions that occurbetween them and their environment.
C Water quality manage ment, includingpollution control, thus looks to allbranches of aquatic science in efforts
/-*\ to coordinate,and improve man'srelationship with his aquatic environment .
AI SOME FACTS ABOUT WAT/R..%.\-
A Water is the only abundant.liquid on ourplanet. It has many properties mostunusual for liquids, upon which dependmost of the familiar aspects of the worldabout us as we know it. (See Table 1)
TABLE 1...-
UNIQUE PROPERTIES OF WATER
PropertyHighest heat capacity (specific Lest) of anysolid or liquid (except NH3)
SignificanceStabilizes temperatures of organisms andgeographical regions
litent heat of fusion (excep NH3)
Highest beat of evaporation of any substan4
1
t
Thermostatic effect at freezing point
Important in heat and water transfer ofatmosphere
The only substance that has its maximumdensity as a liquid (40C)
Fresh and brackih waters have maximumdensity above freezing point. This isimportant in vertical Orculation patternin lakes.
Highest surface tension of ant utplid Controls surface and drop phenomena.important in cellular physiology
Dissolves more substances in greater
&quainity than any-other liquid
Makes.complex bfological system possible.Impartiat for transportation of materialsin solution.
'Pure water has the hilliestconstant of alinikuid
lends to high dissociation of inorganicsubstances in solution
Very little electrob'tic dissociation
Relatively
Neutrnl. yet cantatas both H+ and OH ions
Absorbs much energy in infra red and ultra,violetrangeii, but little 4n visible range.Hanel "colorless"
1
5f
4
0
6 -i
r

The Aquatic Environment
8- Physical Factors of Significance
1 Water substance
Water is not simply "H2O" but .inreality is a mixture of some 33different Substances involving threeisotopes each of hydrogen and oxygen(ordinary hydrogen Hi', deuterium .,I-12,and,trititun H3; 'ordinary oxygen 0",oxygen 17, and oiygen-18) plus 15known types of ions. The moleculesof a water mass tend to associatethemselves as polymers rather thanto remain as 'discrete units.(See Figure 1) ar,
SUBSTANCE OFPURE WATER
O
Density 4
a Temperature and density: Ice.Water is the only known substancein which the solid state will floaton'the liquid state. (See Th.ble.2)
40..
.4
Nie
TABLE.2_
EFFECTS OF TEMPERATURE ON DENSITYOF PURE WATER AND ICE*
Temperature ,(°C)
lg. Water
Density
-10- 8- 6- 4- 2
.0
2468
1020406080
100
.99815
.99869
.99912
. 99945
.99970. 99987 - - --.99997
1.0000.99997.99988.99973.99823.99225.98324.97183. 95838
.9397
.9360.90212.9277.9229.9168
* Tabular values for density, etc., representestimates by various workers rather thanabsolute values, due to the variability ofwater.
* * Regular ice is known as "ice I". Four or.more other "forms" of ice are known toexist (ice II, ice III, etc. ), having densiti sat 1 atm. .pressure ranging from 1.1595to 1.67. These are of extremely restrict doccurrence and may be ignored in mostroutine operations.
This ensures that ice usually.forms on top of a body of ,waterand tends to insulate the remain -in -water mass from further lossca heat. 'Did ice sink, thereCould be little op n¢kcarpyover ofagdatic life from season to seasonin the higher bititudes. Frazil orneedle ice forms-colloidally at afew thousandths' of:a degreebelow 0° C. It is- adhesive andmay build, up on submerged,objectsas "anchor ice", but it is Stilltypical- icelice I).
-N.
56
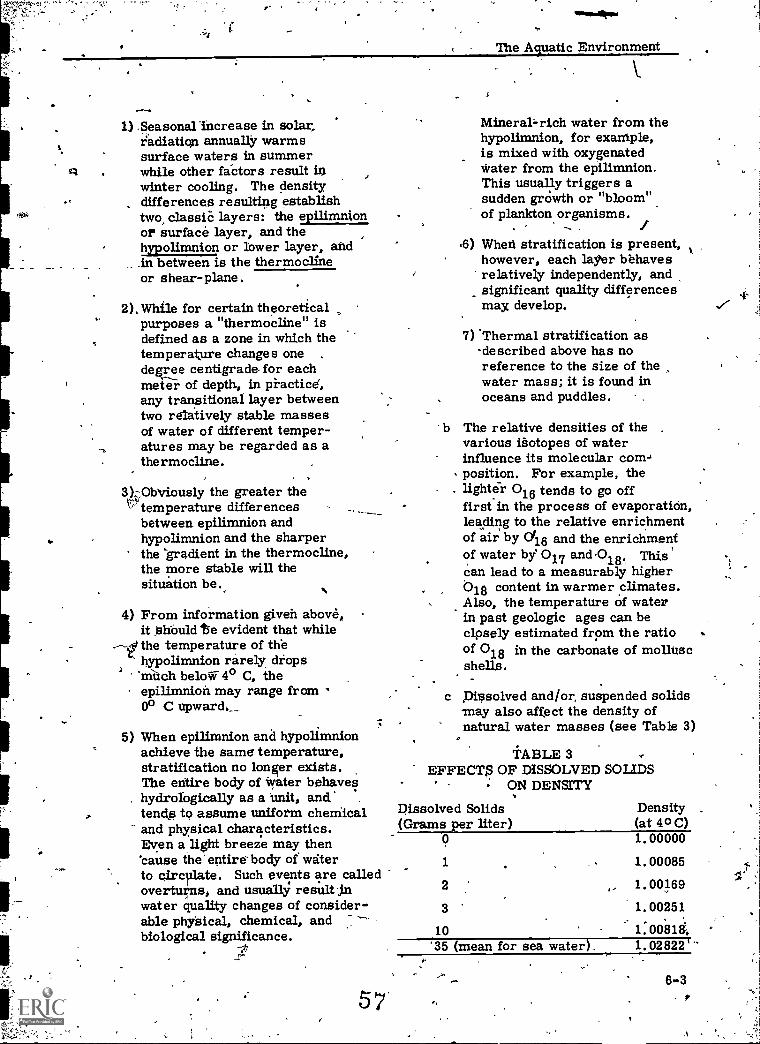
0111111em
The Aquatic Environment
Se
1) .Seasonal increase in solar.radiatiqn annually warmssurface waters in summerwhile other fdctors result inwinter cooling. The densitydifferences resulting establishtwo, classiC layers: the epilimn(onor surface layer, and thehypolimnion or lower layer, andin between is the thermoclineor shear-plane.
2).While for certain theoreticalpurposes a "thermocline" isdefined as a zone in which thetemperature changes one .
degree centigrade for eachmeter of depth, in pi-actice,any transitional layer betweentwo relatively stable massesof water of different temper-atures may be regarded as athermocline.
3tObViously the greater the' temperature differencesbetween epilimnion andhypolimnion and the sharperthe gradient in the thermocline,the more stable will thesituation be.,
4) From information given above,it Should to evident that whilethe temperature of thehypolimnion rarely drops'much below' 4° C, theepilimnion may range from0° C upward,_
5) When epilimnion and hypolimnionachieve the same temperature,stratification no longer exists.The entire body of water behaveshydrologically as a 'unit, and' A.
tends to assume uniform chemicaland physical characteristics.Even a light breeze may then'cause the entirebody of waterto circulate. Such events are calledoverturns, and usually result inwater quality changes of consider-able physical, chemical, andbiological significance.
57
Mineral=rich water from thehypolimnion, for exaMple,is mixed with oxygenatedrater from the epilimnion.This usually triggers asudden grOwth or "bloom"of plankton organisms.
.6) When stratification is present,however, each layer behavesrelatively independently, andsignificant quality differencesmay develop.
7) 'Thermal stratification as-described above has noreference to the size of thewater mass; it is found inoceans and puddles. .
b The relative densities of thevarious isotopes of waterinfluence its molecular com-position. For example, the
. lighter 016 tends to go offfirst in the process of evaporation,leading to the relative enrichmentof air by dm and the enrichmentof water by 017 and .01 R. Thiscan lead to a measurably higher018 content in warmer climates.Also, the temperature of waterin past geologic ages can beclosely estimated from the ratioof 018 in the carbonate of molluscshells
c Pivsolved and/or, suspended solidsmay also affect the density ofnatural water masses (see Table 3)
TABLE 3EFFECTS OF DISSOLVED SOLIDS
ON DENSITY
Dissolved Solids(Grams per liter)
Density(at 40C)
0 1.00000
1 1.00085
2 1.00169
3 1.00251
10 1.0081%'35 (mean for sea water) 1.02822
8-3

The Actiatic Environment
d Types of density stratiffcation .
It) DenSity differences producestratification which may bepermanent, transient, orseasonal.
2) Permanent stratificationexists for example wherethere is a heavy mass of.brine in the deeper areas ofa basin which does not respondto seasonal ol'other changingconditions.
3) Transient stratification mayoccur-with the recurrentinflux of tidal water in anestuary for example, or theoccasional influx of coldmuddy water into a deep lakeor reservoir.
4).Seasonalatratification istypically thermal in nature,and involves the afinualestablishment of the epiliinnion,hypolimnion, and ihermoclineas described above.
5) Density stratification is notlimited to two-layered..systems;three, four, or even morelayers may be encountered inlarger bodies of water.
e A "plunge line" (sometimes called"thermal line") may develop atthe mouth of a stream. Heavierwater flowing.into a lake orreservoir plunges below thelighter water mass of the epiliminiumto flow along at a lower level. Sucha line is usually marked by an
- accumulation of floating debrie.
Siratification may be modifiedor entirely suppressed in somecases when deemed expedient, byMeans of a simple air lift.
3 The viscosity of water is greater at 'lower temperatures (see Table 4).
This is important not only in situationsinvolving the control of flowing wateras in a sand filter, but also sinceovercoming resistance to flow gen-erates heat, it is significant in the,heating of water by internal frictionfrom wave and current action.Living organisms more easily supportthemselves in the more viscous(and also denser) cold water's of the-arctic than in the less viscous warmwaters of the tropics. (See Table 4).
TABLE 4
VISCOSITY'OF WATER (In millipoises at 1 atm)
Temp. 0 C
Dissolved solids in g/L
0 ',5 10, 30
-10 26.0 -- -- -- - - --
- 50 17.94 18.1- 18.24 18:7
5 15.19 15.3 15.5 16.0
10 13.10 13.2 13.4 13.8
- 30 8..00 1-.1 8.2 8.6
100 - .
4 Surface tension has biological as well. as physical significance. Organisms
whose body surfaces- cannot be_wet by,water can either ride on the-littr*.cefilm or in some instances may be"trapped" on the surface film and beunable to re-enter the water.
5 Heat or energy
Incident solar radiation is the primesource-of energy for virtually allorganic and most inorganic processeson earth. For the earth as a whOle,the total'amount (Of energy) receivedannually must exactly balance thatlost by reflection and radiation into,space if climatic and related con-ditions are to remain relatiVelyconstant over geologic time.

The Aquatic Environment
sr
a ror a given body of water,immediate sources of energyinclude in addition to solarirradiation: terrestrial heat,_transformation of kinetic energy(wave and 'Current action) to heat,chemical and biochemicalreactions, convection from theatmosphere, and condensation ofwater vapor.
b The proportion of light reflecteddepends on the angle of incidence,the temperature, color, and other,qualities of the water; and thepresence or absence of filmsof lighter liquids such as oil.In general, as the depth increasesarithmetically, the light tends todecrease geometrically. Blues,greens, and yellows tend topenetrate most deeply while ultraviolet, violets, and orange-redsare most quickly absorbed. Onthe order of 90% of the totalillumination which penetrates thesurface film is absorbed in thefirst 10 meters of even the clearestwater, thus tending to warm theupper layers.
6 Water movements
a Waves or rhythmic movement'
1) The best known are traveling .waves caused by wind. These areeffective only against objects nearthe surface. Theyhave littleeffect on the movement of largemasses of water.
2) Seiches
Standing waves or seiches occurin lakes, estuaries, and.otherenclosed hOdies of water, but are'seldom large enough to beobserved. An "internal wave orsich" is amoscillation in asubmersed mass of water suchas a hypolimnion, accompaniedby compensating oscillation in theoverlying water so that no
59
significant change imsurfacelevel is detected. Shifts insubmerged water masses ofthis type can hay severe effectson the biota and a o on human ,,water uses where withdrawalsare confined to a given depth.Descriptions and analyses-ofmany other types and sub -typesof waves and wave-like movementsmay be found in the literature.
b Tide's
1) Tides are the longest wavesknown, and are responsible forthe once or twice a day rythmicrise and fall of the ocean levelon most shores around the world.
2) While part and parcel of thesame phenomenon, it is oftenconvenient to refer to the riseand fall of the water level as 4"tide, " and to the resultingcurrents as "tidal currents."
.3) Tides are basically caused by theattraction of the sun and moon onwater masses, large and small;'however, it is only in the oceansand possibly certain of the largerlakes that true tidal action hasbeen demonstrated. The patternsof tidal action are enormouslycomplicated by local topography,interaction with seiches, and otherfactors. The literature on tidesis very large.
c Currents (except tidal currents)are steady arythmic water movementswhich have had major study only inoceanography although they aremost often observed in rivers andstreams. They are primarilyconcernedVith the. translocation ofwater masses. They may be generatedinternally by virtue of density changes,or externally by wind or terrestrialtopography. Turbulence phenqfnenaor eddy currents are largely respon-siblefor lateral mixing in a'current.These are of far more importancein the economy of a body of water than
^mere laminar flow.
8-5

The Aquatic Environment
d Coriolis force is a result of inter-action between the rotationot theearth, .and the movement of massesor bodies on the earth. The netresult is a alight' tendency for movingobjects to vber.to the right in thenorthern hemisphere, and to the
.(left in the southern hemispheie.While the result in fresh wate *s is
. usually negligible, it may be pon-siderablein marine :waters. Forexample, other fabtors permitting,there is a tendency in estuaries, forfresh waters to move toward theocean faster along the-right bank,while salt tidal waters tend tointrude farther inland alongleft bank. Effects tire even moredramatic in the open oceans.,
..
e Langmuire spirale(or -41 muirecirculation) area rela elymassive cylindrical ea on impirtedto surface waters uner the influenceof wind. The axes of the cylindersare parallel to the direction of thewind, and,their depth and velocity
it
b . r b
.h.r
depend on the depth of the water,the velocity and duration of thewind, and other factors. The netresult is that adjacent cylinderstend to rotate, in opposite directionslike meshing cog wheels. Thusthe water between two given spiralsmay be meeting and sinking, whilethat, between spirals on either sidewill be meeting apd rising. Water °
over the sinking, while thatbetweenspirals on either side will be meet -ingid rising. Water over thesicking areas tends to accumulateflotsam and jetsam on the surfacein long conspicuous lines.
a This phenomenon is of consider-able importance to those samplingfor plankton. (or even chemicals)near the surface,when the windis blowing. Grab samples fromeither dance might obviouslydiffer considerably, and ifa plankton tow is contemplatedit should be made across the.wind in order that the netmay pass through a successionof both dances.
SURFACE
WATER WATER
RISING SINKING
Figure 2. Lanmuire Spifaltb. Blue dance, water 'rising. r. Reddance, water sinking, floaling orswimming Abjects concentrated.
L.)
The Aquatic Environment
.b Langrauire spirals are notusually established until thewind has either been blowingfor an extended period, orelse is blowing rather hard.Theirspresence can be-detectedby the lines of foam andother floating material-whichcoincide with the directionof the wind:
6 The pH of pure water has been deter-mined between 5.7 and 7.01 by variousworkers. The latter value is mostwidely accepted at the present time.Natural waters of course vary widely
(accord9ig to circumstances.
C The elements of hydrology mentionedabove represent a selectiOfi of some ofthe more conspicuous physical factors.involved in working with water quality.Other items not specifically mentionedinclude: molecular structure of waters,interactionof water and radiation,internal pressure, acoustical charac-teristics, pressure-volume-temperaturerelationships, refractivity, luminescence,color, dielectrical characteristics andphenomena,' solubility, action and inter-actions of gases, liquids and solids,water vapor, phenomena of hydrostaticsand hydrodynamics in general:. .
*
9
REFERENCES
1 Buswell, A. M. and Ttodebush, W. H.Water. Sci. Am. April 1956.
2 Dorsey, N. Ernest. Propertiesof-Orcliriary Water - Substance.Reinhold PUbl. Corp. New -York.pp. 1-673. .1940.
3 Fowle, Frederick E.. SmithsonianPhysical Tables. SmithsonianMiscellaneous Collection, 71(1),'7th revised ed. 1929.
4 Hutcheson, George E. A Treatise onLimnology. John Wiley Company.1957.
0
,
ve
<

7:-
Part 2: The Aquatie,Envirnment as an Ecosystem
I INTRODUCTION
Part 1 introduced the .lithosphere and thehydrosphere. ,Part 2 will deal with certain
_general aspects of the biosphere,. or the__sphere of life on this earth, which photo-
\ graphs from spade have shown is a finite,globe in infinite space.
This is the habitat of .man and the other--,organisms. His relationships with theaquatic biosphere are our common} concern.
THE,BIOLOGICAL NATURE OF THEWORLD WE LIVE IN
A We can only imagine what this world .
must have been like before there was life.
B The world as we know it is largely shapedby the forces of life.
o
,1 Primitive forma-of life created organicmatter and established soil.
2 Plants cover the lands and enormouslyinfluence the foipes of erosion.
The nature and rate of erosion affectthe redistribution of materials.(and mass) on the surface of theearth (topographic changes)..
4 Organisms tie up vast quantities ofc certain. chemicals, such as carbon
and oxygen.'
.5 Respiration of plants and animals-releases carbOn didxide to theatmosphere in influential quantifies.
-6 CO 2-affects the'-heat transmission ofthe atmosphfire. _
C Organisms respond to and.in turn affect"40t,their environment. Man is one of the
most influential.)
N
III ECOLOGY IS THE STUDY OF THEINTERRELATIONSHIPS BETWEEN'ORGANISMS, AND BETWEEN ORGA-NISMS ANb THEIR ENVIRONMENT. '`
A The ecosystem is the basic functionalunit of ecology. Any area of nature thatincludes living organisms and nonlivingsubstances interacting to produce anexchange of materials between the livingand nonliving parts constitutes an
, ecosystem. (Odum, 1959)
1- From a structural standpoint, it isconvenient to recognize four -constituents as composing anecosystem (Figure 1).
a Abiotic NUTRIENT MINERALSwhich are the physical stuff ofwhich living protoplasm will be -
synthesized.
b Autotrophic (self,-nourishing). orPRODUCER organisms. Theseare largely the green plants(holophytes), but other minorgroups must also be included-(See Figure 2). They assimilatethe mitrient minerals, by the useof considerable.energy, and combinethem into living organic substance.
c Heterotrophic (other-nourishing)CONSUMERS (holozoic), are Chieflythe animals. They ingest (or eat)and digest organic matter, releasingconsiderable energy in the process.
d Heterotrophic REDUCERS are chieflybacteria_and fungi that return `-
complex organic oomiounds bck tothe original abiotic mineral condition;thereby releasing the remainingchemical energy.
2 From a functional standpoint anecosystem has 'two parts (Figure 2)'
6 r)"
. 4
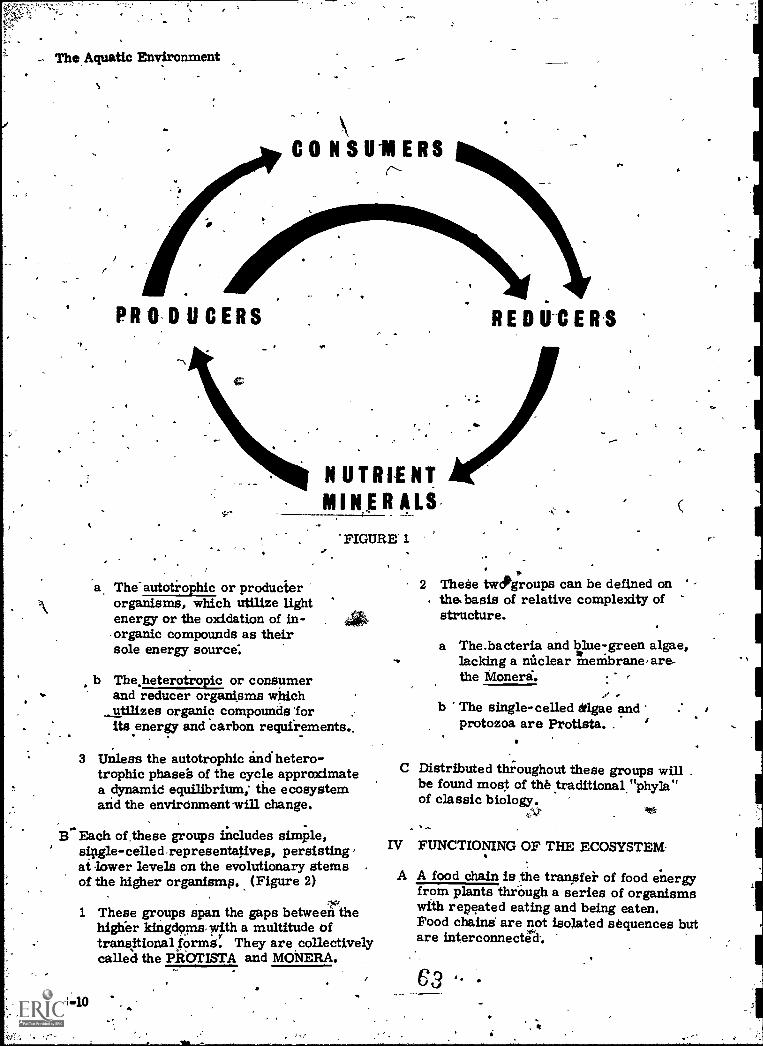
- The Aquatic Environment
-opy Co NSU/IIERS
PRO-DUCERS
The-autotrophic or producterorganisms, which utilize lightenergy or the oxidation of in-organic compounds as theirsole energy source:
REDUCERSI.
NUTRIENT AirMIN,ER ALS
FIGURE' 1
b The.heterotropic or consumerand reducer organisms whichutilizes organic compounds 'forits energy and carbon requirements._
3 Unless the autotrophic and hetero-trophic phases of the cycle approximatea dynamid equilibrium,' the ecosystemand the environment gill change.
B Each of,these groups includes simple,sinle-celled-representatives, persistingat lower levels on the evolutionary stemsof the higher organisrap.. (Figure 2)
1 These groups span the gaps betweeitthehigh-er kingdopasylith a multitude oftransitional forms. They are collectivelycalled the PROTISTA and MONERA.
6.10
2 These twPgroups can be defined onthe, basis of relative complexity ofstructure.
a The.bacteria and Illue-green algae,lacking a nuclear membranebare--the Moneri.
-b The single-celled algae and
protozoa are Protista.
C Distributed throughout these groups will .
be found most of the traditionarphyla"of classic biology.
4N4' Ark
IV FUNCTIONING OF THE ECOSYSTEM-
A A food chain is the tranpfer of food energyfrom plants through a series of organismswith repeated eating and being eaten.Food chains' are not isolated sequences butare interconnected-.
63
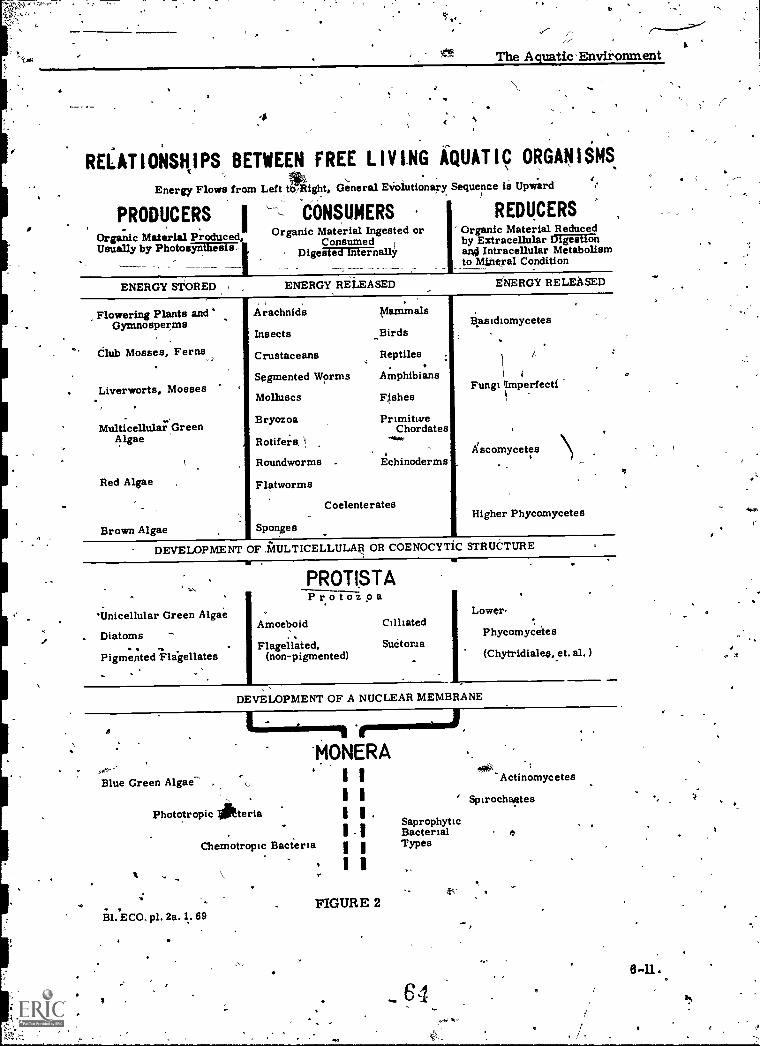
/The Aquatic Environment
RELATIONSHIPS BETWEEN FREE LIVING iQUAT I ORGANISMS
Energy Flows from Left ta,Right, General Eiointionary Sequence is Upward
PRODUCERS I ----- CONSUMERS. 4
Organic Material Produced, Organic Material Ingested orUsually by Photosynthesis- Consumed
Digested Internally
ENERGY STORED ENERGY RELEASED
Organic Material Reducedby Extracellular Ingestionand Intracellular Metabolismto Mjtieral Condition
REDUCERS
ENERGY RELEASED
Flowering Plants andGymnosperms
Club Mosses, Ferns
Liverworts, Mosses
Multicellulai:GreenAlgae
Red Algae
Brown Algae
Arachnids
Insects
Crustaceans
Segmented Worms
Molluscs
Bryozoa
Rotifers,
Roundworms
Flatworms
Sponges
)
Mammals
Birds
Reptiles
Amphibians
Fishes
PrimitiveChordates
Echinoderms
Coelenterates
Basidiomycetes
Fungi perfecti
Xscomycetes
Higher Phycomycetes
DEVELOPMENT OF gIULTICELLULAR OR COENOCYTIC STRUCTURE
PROTISTA
Unicellular Green Algae
Diatoms
Pigmented Flagellates
ProtozoaA2moeboid
Flagellated,(non-pigmented)
liCilated
Suctoma
Lower
Phycomyceies
(Chytridiales, et. al.) PJ
DEVELOPMENT OF A NUCLEAR MEMBRANE
MONERABlue Green Algae- <,1
Phototropic teria
Chemotropic Bacteria
I
I
I
I
'
SaprophyticBacterialTypes
A ctinomyc etes
Spirochmtes
e
FIGURE 2BI. ECO. p1. 2a. 1. 69
64
6 -11.
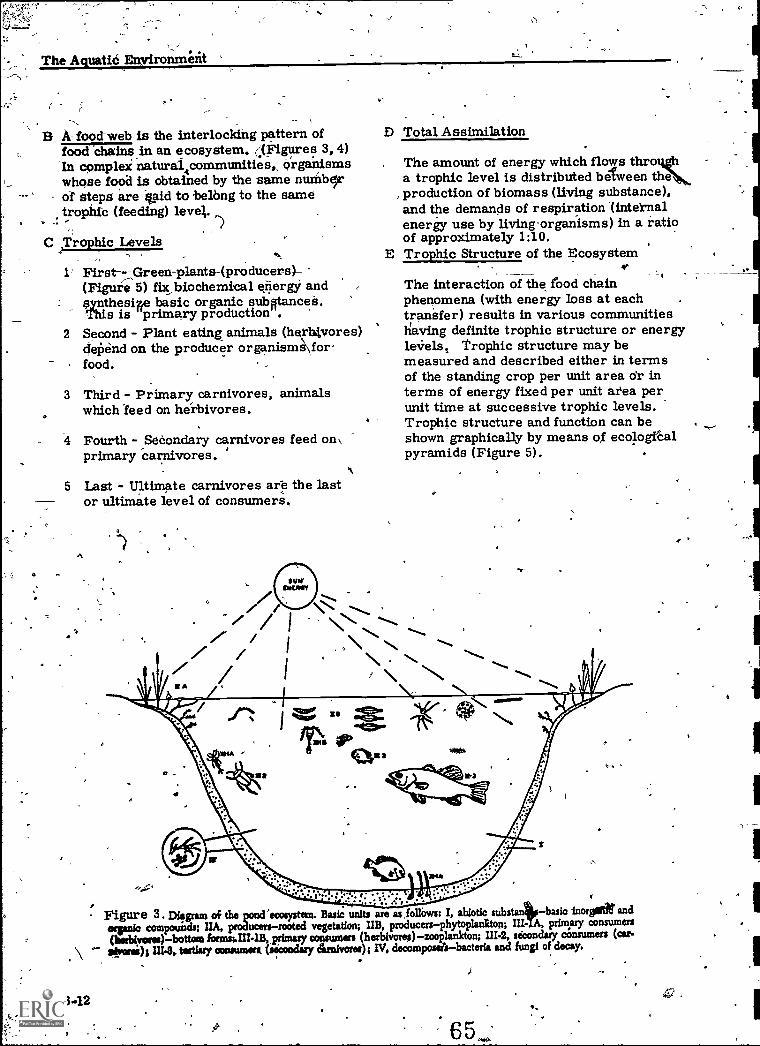
The Aquatics Environment
`,
B A- food-web is the interlocking pattern offoocTchains in an ecosystem. (('Figures 3, 4)In complei naturaitcommunities,, organismswhose food is obtained by the -same nurnbeieof steps are said to belbng to the sametrophic (feeding) level.
C Trophic Levels
First-Green-plants-(producers)-(Figure 5) fix_biochernits.1 energy andq,y_nthesirie basic organic substances.This is primary production .
2 Second - Plant eating animals (h rblvores)depend on the producer organism for.food.
3 Third - Primary carnivores, animalswhich feed on herbivores.
4 Fourth - SeCondary carnivores feed on,primary carnivores.
5 Last - Ultimate carnivores are the lastor ultimate level of consumers.
A
D Total Assimilation
The amount of energy which flows througha trophic level is distributed between thNs.production of biomass (living substance),and the demands of respiration (internalenergy use by livingorganisms) in a ratioof approximately 1:10.
E Trophic Structure of the Ecosystem
The interaction of the rood chainphenomena (with energy loss at eachtransfer) results in various communitieshaving definite trophic structure or energy
Trophic structure may bemeasured and described either in termsof the standing crop per unit area or interms of energy fixed per unit area perunit time at successive trophic levels.Trophic structure and function can beshown graphically by means of ecologfcalpyramids (Figure 5).
Figure 3 . Diegram of the pond'ecosystan. Basic units are as lollows: I, ablotic substanisbasio !floral!' andargsnio compounds; 'IA, producersrooted vegetation; IIB, producersphytoplanktou; III- A, primary consumers(b erbivores)bottorn consumen (herbivores)zooplankton; III.2, secondary consumers Ow-
- itooreih III.3, tertiary oonsamen {secondary cingvores); IV, decomposetsbacteria and fungi of decay.
6.12
65

The Aquatic Environment
771X1:7:"/:7,1tillonikov 14 16%).1
tl
. Figure 4. A MARINE ECOSYSTEM (After Clark, 1954 and Patten, 1966)
6613
V
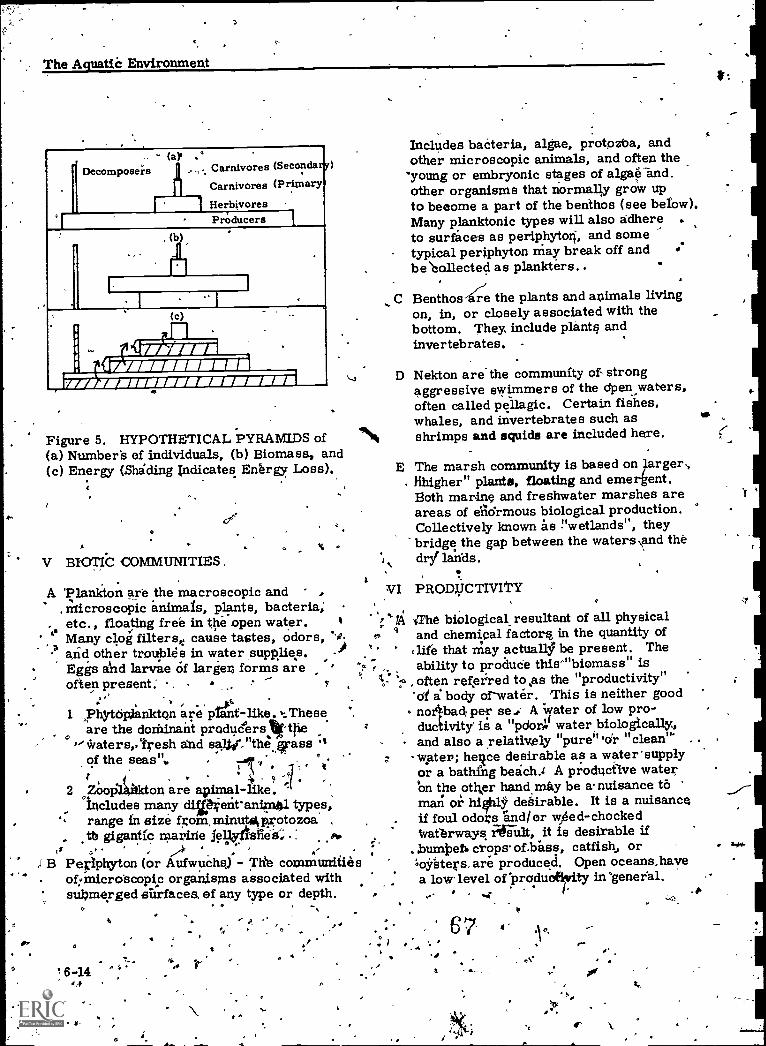
,- The Aquatic Environment
(a)' .Decomposers ..,.. Carnivores (Secondary)
Carnivores (Primary
1 HerbivoresProducers
(b),
(C)
<177S147-7:i
Figure 5. HYPOTHETICAL PYRAMIDS of(a) Number's of individuals, (b) Biomass, and(c) Energy (Shiding Indicates Enbrgy Loss).
V BIOTIC COMMUNITIES ,c
A 'Plankton are the macroscopic andmicroscopic animals, plants, bacteria;
. etc., floating free in the open water. 4
Many clog filterst, cause tastes, odors, "',0.a and other trottples in water ,supplies.
Eggs and larvae Of larger forms areoften present: . ;
1 ..PhY toPanktQn0 are PeltAike '7. Theseare the dominant producers Ittiiewaters,. fresh and saW,Hthe Jgrass 'tof the seas ",
2 Zooilctt-ton are apitnal-like.Includes many difOent'aniga0.1 types,range in size f;om,reinutg,Rrotozoatb gigantic marine jelOsfiesc : #.
Periphyton (or Aufwuchs) - TIM communitiesof; microscopic organisms associated withsubmerged surfaces, of any type or depth.
o
!6-14
s.
0
.* r/
Includes bacteria, algae, protozba, andother microscopic animals, and often theyoung or embryonic stages of algae and.other organisms that normally grow upto become a part of the benthos (see below).Many planktonic types will also adhere .to surfaces as periphytoti, and sometypical periphyton may break off andbeollected as plankters..
,C Benthos-aie the plants and animals livingon, in, or closely associated with thebottom. They, include pLante andinvertebrates. -
D Nekton are. the community of strongaggressive swimmers of the ripen waters,often called pellagic. Certain fishes,whales, and invertebrates such asshrimps and squids are included here.
E The marsh community is based on larger,.Hhigher" plants, floating and emergent.Both marine and freshwater marshes areareas of enormous biological production.Collectively known as "wetlands ", theybridge the gap between the waters \and thedrys' lands.
VI PRODVCTIVITY
The biological resultant of all physicaland chemical factors, in the quantity of
" .life that may actually be present. Theability to produce this'"biomass" is
, often reerred to osts the "productivity"-a a body or-water. -This is neither goodno bad, per se.: A Water of low pro-ductivity is a "priors water biologically,and also a relatively "pure"'o'r "clean'
- water; heRce desirable as a water'supplyor a bathing beich..i A productive waterOn the other handmity be a nuisance to.man or high131- debirable. It is a nuisanceif foul odors and/or weed- chockedWaterways result, it is desirable if
crops- of.hass, catfish, oro ysters, are produced. Open oceans,havea low' level of productivity in general.
t- .#
'64
1
t.
5
1
1

c
1
VII 'PERSISTENT CHEMICALS IN THEENVIRONMENT
"*.
Increasingly complex rolufacturing-probeasea-,---coupled with rising industrialization, create 'health hazards for humans andaquatic life. .
Compounds besides being tox4c (acutely orchronic) may produce mutagenic' effectsincluding cancer, tumors, and teratogenicity(embryo defects), Fortunately there are-teats;such as the Amis test, to screen chemical .compounds for these effects:.
A 1S..letals - current levels of cadmium, lead. ,
and other substances constitute a mount-ing concern. Mercury pollution; as atMinimata, Japan has been fully docume
B Pesticides
1 A pesticide and -its metabolites maymove through an ecosystem in manyways. Hard (pesticides which arepersistent,' having a long half-life inthe environment includes the organo7chlorines, ex., DDT) pysticidesingested'or otherwise borne by the'target.specieS will stayin-theeiivnent, possibl* to be "recycledor WInntrated further through thenatural action of food`chains if thespecies is eaten: Most of the volumeof pesticides ao not reach their 4.rgetat all.. ,*
K.
.2 Biological magnification
d
Initially, low levels of persistent_- pesticides in air, soil, and water May
. be concentrated at every step-up thefood clotin. Minute aquatic organisms
' and scavengers, which screen water andbottomixiud ha,iing pesticide levels of afew parts per, billion, can accumulatelevels measured in parts per millionathousandfold increase. The sediments
' including,fecal deposits are continuouslyrecycled by the bottom anim
r.V
C
a
The Aquatic Environmept4'
Oysters, for instance, will con,-centrate DDT 70, 000tiznerf'higherin their tissues than it's conc_entration
surrounIting.water, They can,also partially cleanse theMselvesIn water free of DDT. _,
b Vish feeding on lower organismsbuild up concentrations in theirvisceral fat which may reach severalthousand' parts per million'andin their edible flesh of hundreds Of
parts per million.:c Largenanimals, such as fish - eating
. gulls and oilier birds, Gan-further- concentrate the chemicals. A surveyon organochlorine.residuea in. aquaticbirdsin the Canadian prairie Provincesshowed that California and ring:billed ".gulls were among the most contaminated.Since guile breed in colonies, bregding.PopUlation changes can be detected acid ,
related to levels of chemical con-tamination. Ecological research on,colonial birds to monitor the effects
chemical pollution on the environ-'Inent is useful. ..t Polychlprinated:biphenyls" (PCB's)., §
PCB's were used'in plasticizers, asphalt.ink, paper, and a host of other products.Action was. taken to curtail their release 100"
to the environment. since their 'effects.are similar to hard pesticides. Howeverthis doesn't solve the 'problems of con-tarainated 'sediments and ecosystems andfinal fate of the PCB's still circulating.
s.
000
There are numerous other compounds a
which are toxic and accumulated in theecosystem.
:'A
63
,
.
6-160: -
4

The Aquatic Environment
a,
V.1
REFERENCES
1 Clarkce, G. L. Elements of.Ecoloa.John Wikey, & Sons, New York. 1954.
2 Cooke, W.B. Trickling Filter Ecology.Ecology 40(2) :273 -291. 1959.
3 -.Hanson, E.rt. Animal Diyersity.Prentice -Hall, Inc., Ney.r Jersey. )1964.
4 Hedgpeth, J. W. Aspects of the E inecosystem, Amer.' Fish. Soc., Spec.ubl. No. 3. 1966. ,
O
a :
a/
,
eR
-N
4
5 Odum, E.P. Fupdamentals of Ecolqky.V. B. Saunder,is Company,Philadelphia and London. 1959.
6' Patten, B.C. Systems Ecolobv.Bio-Science, 16(9). 1966.
7 Whittaker, R. H. New Concepts ofKingdoms. Science 163:150=460. 1969.
6J-
O
c
M
V
1/.
I INTRODUCTION
24,
Part 3. The Freshwater Environment
The freshwater environment as consideredherein refers to those inland waters notdetestably diluted by ocean waters, althoughthe lower portions of rivers are qubject tocertain tidal flow effects.
Certain-atypical inland waters such as salineor alkaline lakes, springs, etc.,. are nottreated,
wand
maimobjective here is typicalinland 'water.
All waters have certain basic biological cyclesand types of interactions most of whrch havealready been presented, hence this outlinewill concentrate on aspects essentiallypeculiar,to fresh inland waters.
II ',PRESENT WATER 'QUALITY AS AFUNCTION OF THE EVOLUTION OFFRESH WATERS
A The history of a 'body of water determinesits present condition. 'Natural waters haveevolved in the course of geologic timeinto what we know today.
B Streams
O
In the course of their evolution, streamsin general pass through four stages ofdevelopment which may be called: birth,youth, maturity, and old age.
,,These terms or conditions may be ,employed or considered in two contexts:tempoial, or spatial. In terms of geologictime, a given point in a stream may pass .through each of the, stages described belowor: at any given time,. these various statesof development can be loosely identifiedin successive reaches Ora stream travelin4from its headwaters to base level in 'oceanor major lake.
1 Egtab slunent or birth. This ,
might e a "dry run" or headivaterstria bed, before it had erodeddown- to e leveiof ground water.
70
Duiing periods of run-off after arain- or,snow-melt, such a galleywould have a flow of water whichmight range from torrential to amere trickle. Eros on may proceedrapidly as there is no permanentaquatic flora or fauna to stabilizestreambed materials. On the otherhand, terrestrial grass or forestgrowth may retard erosion. Whenthe run-off has ,passed, however,the " streambed" is dry. .
2 Youthful. Oreams.' When thestreambed is eroded below theground water level, spring orseepage water enters, and the ,
stream becomes permanent. Anaquatic flora andltuna develop's-and water flows the year round.Youthful streams typically have arelatively steep-gradient, rocky beds,with rapids, falls, and smaa_posis.,
3 Mature streams. Mature streamshave wide valleys, a deVelopedflood plain, are deeper, moreturbid, and usually have warmerwater, sands mud, silt,tor c ybottom materials which tuft \Ar* hincrease in flow. In their, more `e
favorable reaches, streams in thiscondition are at a peak of biologicalRtoductivity. Gradients are moderate,
.'riffles or rapids are often separated:by long pools.
4 In old ag , streams have approachedgeologic ase level, usually theocean. During flood stage they scourtheir beds and deposit materials onthe flood plaain which may be verybroad and flat., During normal.flowthe channel is refilled and manyshifting bars are developed. Meandersand or-bow lakes are often formed.

The Aquatic Environment
' e
(Under the influen of man thispattern may be broken' up, or.temporarily interrupted. Thus anessentially "youthful" stream mightrake on some of the characteristicsof a "Mature" stream following soilerosion, organic enricliinent, andincreased surface runoff. Correctionof these conditions might likewise befollowed by at least a partial Aversion
_"rethe "original" Condition). .
C Lakes and Reservoirs
Geological factors which significantlyaffect the nature of either a stream orlake include the following:,
1 The geographicallpcation of thedrainage basin or watershed.
2 The size arler shape of the drainagebasin.
3 The general topography, 1. e.,mountainous or plains.
4 The character of the bedrocks andsoils.
5 The character, ambunt, annualdistribution, and rate of precipitation,.
6 The natural vegetative cove,r of theland, is, of course, responsive to and'responsible for many of the abovefactors and is alsg_s'everely subjectto the whims of civilization. Thisis one of the major factors determining
'.run-off versus soil absorption, etc.
D Lakes have a developmentaLhistory whichsomewhat parallels that of streaMs. Thisprocess is often r'ferred to as naturaleutrophication.
1' The methods of 'formation vary greatly,but all Influence the character andsubsequent history of the lake.
In glaCiated areas, for example, a°huge block of ice may have been covered
- . with till. The glacier retreated, thatice melted, and the resulting hold,-
8.48.
..:1!
became a lake. Or, the glacier mayactually, scoop out a hole. Landslidesmay dam valleys, extinct volcanoes may'collapse, etc., etc.
2 llValate.ursing or natural eutrophication of
z.
a If not already present shoal areasare developed through erosionand deposition of the shore materialby wave action and undertow.
b 'Currents produce bars across paysand thus cut off irregular areas.
c Silt brought in by tributary streamssettlei out in the quiet lake water
d Algae grow attached to surfaces,and floating free as plankton. Deadorganic matter begins to accumulateon the bottom.
e Rooted aquatic plants grow onshoals and bars, and in, doing socut off bays and contribute to thefilling of the lake.
f __Dissolved carbonates and othermaterials are precipitated in thedeeper portions of the lake in part
, through the action of plants.
(4ig When filling is well advanced,mats of sphagnum moss may-extendoutward from the shore:- Thesemats are followed by sedges andgrasses which finally convert thelake irito a marsh.
3' Extinction of lakes. After lakes reachmaturity, their progress towardfilling up is accelerated. They become'extinct through:
a The downcutting of the outlet..
b Filling with detritus eroded fromthe shores or brought in by'tributary streams.
c Filling by the accumulation pf theremains of vegetable materialsgrowing in the lake itself.(Often two or'three processes mayat concurrently)

1P
III PRODUCTIVITY IN FRESH WATERS
A Fresh waters in general_land undernatural conditions by 'definition have alesser supply of 'dissolved substances
'than marine waters, and thus a lesserbasic potential, for the growth of aquaticorganisms. By the same tokeh, theymay be said to be more_ sensitive to theaddition of extraneous materials(pollutants, nutrients, etc.) Thefollowingliotes are directed towardnatural geological and other environ-mental factors as they affect theproductivity of fresh waters.
B Factors Affecting Stream Productivity(See Table
TABLE 1
EFFECT OF SUBSTRATE ON STREAMPRODUCTIVITY*
(The peaductiirity of sand bottoms. istaken as 1)
Bottom Material(
RelativeProductivity
Sand. 1
Marl 6Fine Gravel 9Gravel and silt , 14Coarse gravel 32Moss on fine gravel 89Ft5sidens (moss) on coarse 111
gravel .
Ranunculus (water buttercup) 194Watercress 301Elodea (waterweed) 452
.
*Selected from/Tarzwell 1937
To be productive ofaquatic life, astream must provide adequate nutrients,
a suitable temperature, and timefor growth to take place. 11
1 Youthful streams, espe,cially}on rockor sahtErubstratee are low in essentialnutrients. Teniperatures in moun -'tainous regions are usuaiiy low, :anddue to the steep gradient, time for .
growth is shOrt. Although amplelightisavailable, growth.,,of trueplankton is thus greatly limited.
The Aquatic Environment .
2 As the stream flows toward a more"mature" condition, nutrients tend toaccumulate; and gradient diminishesand so time of flow increases, tem-perature tends to increase, andplankton flourish.
Should a heavy load of inert siltdevelop on the other hand, theturbidity would reduce the lightpenetration and consequently thegeneral plankton production woulddiminish.
3 As the stream approaches-base level(old age) and the time available forplankton growth increases, thebalance- between turbidity, nutrientlevels, and temperature and otherseasonal conditions, determines theoverall productivity.
C Factors Affecting t the Productivity oflakes (See Table 2)
1 The size, shape,, and depth of thelake basin. Shallow water is moreproductive than deeper water sincemore light will reach the bottom tostimulate rooted plant growth. As
------a-corellaakes.with more &ore-line, having more shallow water,are in general more productive..Broad shallow lakes and reservoirshave the greatest production potential(and hence should be avoided forwater supplies).
TABLE 2. /11
EFFECT OF SUBSTRATEON LAKE PRODUCTIVITY *
(The productivity of sand bottoms is taken as 1)
,Bottom Material.
,,
Relative Productivity
SandPebblesClay /Flat rubbleBlock rub leShelving ock
-"
.
1
489
1179
* Se ehted from Tarzwell 1937//
72
' -- 6-19
cp
2 Hard waters are generally moreproductive than soft waters as thereare more plant nutrient minerals
available, This is often greatly in-fluenced by the character of the, soil
wand rocks in the watershed anc3,,thequality and quantity of ground waterentering the lake. In general, pHrange/s of 6.8 to 8.2 appear to bemost productive.
3 Turbidity reduces.productivity as_ light penetration is reduced,
4 The presence or absence of thermalstratification with its semi-annualturnovers affects productivity bydistributing nutrients throughout thewater mass.
5-----Gliniate,temperature, prevalence ofice and snow, are also of courseimportant.
D Factors Affecting the Productivity ofReservoirs
1 The productivity of reservoirs isgoverned by much the same- principlesas that of lakes, With the differencethat the water level is much moresunder the control of man. Fluctuationsin water level Can be used to de-liberly increase or decreaseproductivity. This can be demonstrated
' by. a comparison ottsii TVA reservoirswhich practice a summer drawdownwith-some of those in the west wherea winter drawdown is the rule_
2 The level at which water is removedfrom a reservoir is important to theproductivity of the stream below.The hypolimnion may be anaerobicwhile the epilimnion is itefobic, forexample, or the epilimnion is poor innutrients while the hypoliMnion isrelatively rich. .
3 Reservoir discharges also profoundlyaffect the bp, temperature, andturbidity in the stream below a dam.Too much fluctuation in flow maypermit sections' of. the stream to dry,or provide-inadequate dilution fOrtoxic waste.
6.20
W CULTURAL EUTROPHICATION
A The general processes of naturaleutrophication, or natural enrichment
6 and productivity have been briefly out-lined above.
B When the activities of man speed up.these enrichment p.rocesses by intro-ducing unnatural qUantities of nutrients(sewage, etc. ) the result is often calledcultural eutrophication. This term isoften extended beyond its original usageto include the enrichment (pollution) ofstreams, estuaries, and even oceans, aswell as lakeg.
V CLASSIFICATION OF LAKES ANDRESERVOIRS
A The prbductivity of lakes and iimpouno-ments is-such a conspicuous feature thatit is often used as-a convenient means c.)classification.
1 Oligotrophic lakes are the younger,less productive lakes, which are deep,have clear-water, and usually supportSalmonoid fishes fit their deeper waters.
2 'Eutrophic lakes are mole mature,more turbid, and richer. They areusually shallower. They are richerin dissolved solids; N, P, and Ca areabundanPlankton is abundant and.there is'Often a rich bottom'fauna.
3 Dystrophic lakes, such as bog lakes,are low in Ph, water yelloW to brown,
but humid materials abund , bottomdissolved solids, N, P. scantya.
fauna and plankton poor, and fishspedies are limited. .
B Reservoirs may also he classified asstorage, and run of the river.
1 Storage reservoirs have a large ,
volume in relation to their inflow.
2' Run of the river reservoirs have alarge floW-;through in' relation to theirstorage value.
73
`.
C According to location, lakes andAccordingmay be classified as polar,
temperate, or tropical. Differences inclimatic and geographic conditionsresult in differences in their biology.
VI SUMMARYf (
A A body of water such as & lake, stream,or estuary represents an intricatelybalanced system in a state of dynamic 'equilibrium. Modification imposed atone point in the system automaticallyresults in compensatory adjustments atassociated points.
B The more thorough our knowledge of theentire system, the better we can judgeWhere to impose control measures toachieve a desired result.
REFERENCES -----___1 Chamberlin, Thomas C. and.Salisburg,
Rollin P Geological Processes andTheir Results. Geology 1: pp i-xix,and 1-654. Henry Holt and Company.New York. 1904.
2 Hutcheson, Gedrge E. A Treatise onLirnnology Vol.. I Geography, Physicsand Chemistry. 1957. Vol. II.Introduction to Lake Biology and theLimnoplankton. 1115 pp. 1967.
John Wiley Co.
3 Hynes, H.B. N. The Ecology of RunningWaters. Univ. Toronto Press.555 pp. 1970.
4) De Santo,' Robert S. Concepts ofApplied Ecology. Springer-Verlag. 1978.
The Aquatic Environment
76-21
4
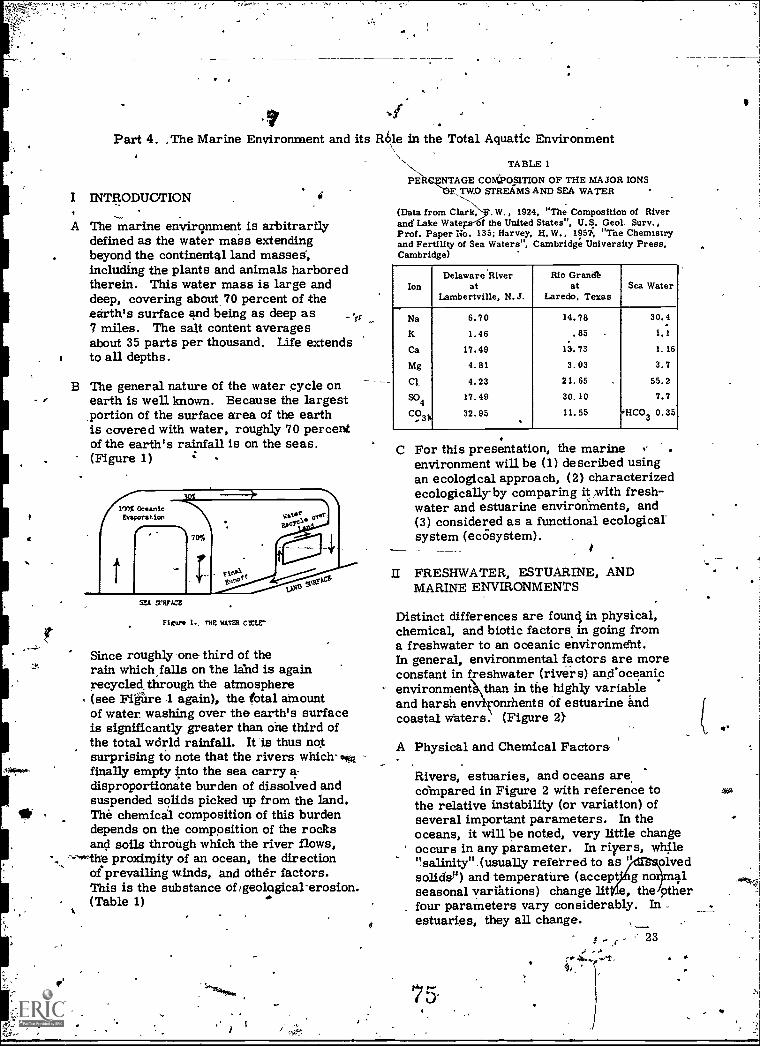
e
Part 4. The Marine Environment and
I INTRODUCTION
A The marine environment is arbitrarilydefined as the water mass extendingbeyond the continental land masses,including the plants and animals harboredtherein. This water mass is large anddeep, covering about '10 percent of theearth's surface and being as deep as7 miles. The salt content averagesabout 35 parts per thousand. Life extendsto all depths.
B The general nature of the water cycle onearth is well known. Because the largest
_portion of the surface area of the earthis covered with water, roughly 70 percentof the earth's rainfall is on the seas.(Figure 1) ; -
its
511FACE
Figaro 1, WE WATER CYCLE"
Since roughly one third of therain which falls on the land is againrecycled_ through the atmosphere(see Flitzre .1 again), the total amountof water. washing over the earth's surfaceis significantly greater than one third ofthe total wdrld rainfall. It is thus notsurprising to note that the rivers which'finally empty into the sea carry a-disproportionate burden of dissolved andsuspended solids picked up from the land.The chemical composition of this burdendepends on the composition of the rocksand soils throUgh which the river flows,
"N--w,llie proximity of an ocean, the directionof prevailing winds, and other factors.This is the substance of/geological-erosion.(Table 1)
Role in the Total Aquatic Environment
TABLE 1
PERCBNTAGE COMPOSITION OF THE MAJOR IONS-0F.,70 STREAMS AND SEA WATER
(Data from Clark; .W., 1924, ''The Composition of Riverand' Lake Wate of the United States", U.S. Geol. Surv.,Prof. Paper No. 135; Harvey, H. W. , 1957; ''The Chemistryand Fertility of Sea Waters'', Cambridge University Press,Cambridge)
IonDelaware River
atLambertville, N.J.
Rio Grant%at
Laredo, TexasSea Water
Na 6.70 14.78 30.4
K 1.46 .85 1.1
Ca 17.49 13.73 1.16
Mg 4.81 3.03 3.7
Cl 4.23 21.65 . 55.2
SO4 17.49 30.10 7.7
CO3ii,...
32.95 11.55 +HCO3 0.35
C For this presentation, the marine '-
environment will be (1) described usingan ecological approach, (2) characterizedecologically by comparing it ,with fresh-water and estuarine environments, and(3) considered as a functional ecologicalsystem (ecOsystem).
II FRESHWATER, ESTUARINE, ANDMARINE ENVIRONMENTS
Distinct differences are founds in physical,chemical, and biotic factors in going froma freshwater to an oceanic environmett.In general, environmental factors are moreconstant in freshwater (rivers) and'oceanicenvironment than in the highly variableand harsh en onriients of estuarine andcoastal waters. (Figure 21
A Physical and Chemical Factors
Rivers, estuaries, and oceans arecompared in Figure 2 with reference tothe relative instability (or variation) ofseveral important paraineters. In theoceans, it will be noted, very little changeoccurs in any parameter. In rivers, while"salinity " .(usually referred to as " olvedsonde) and temperature (accept' g no alseasonal variations) change lit e, the otherfour parameters vary considerably. Inestuaries, they all change.
e 23
75.
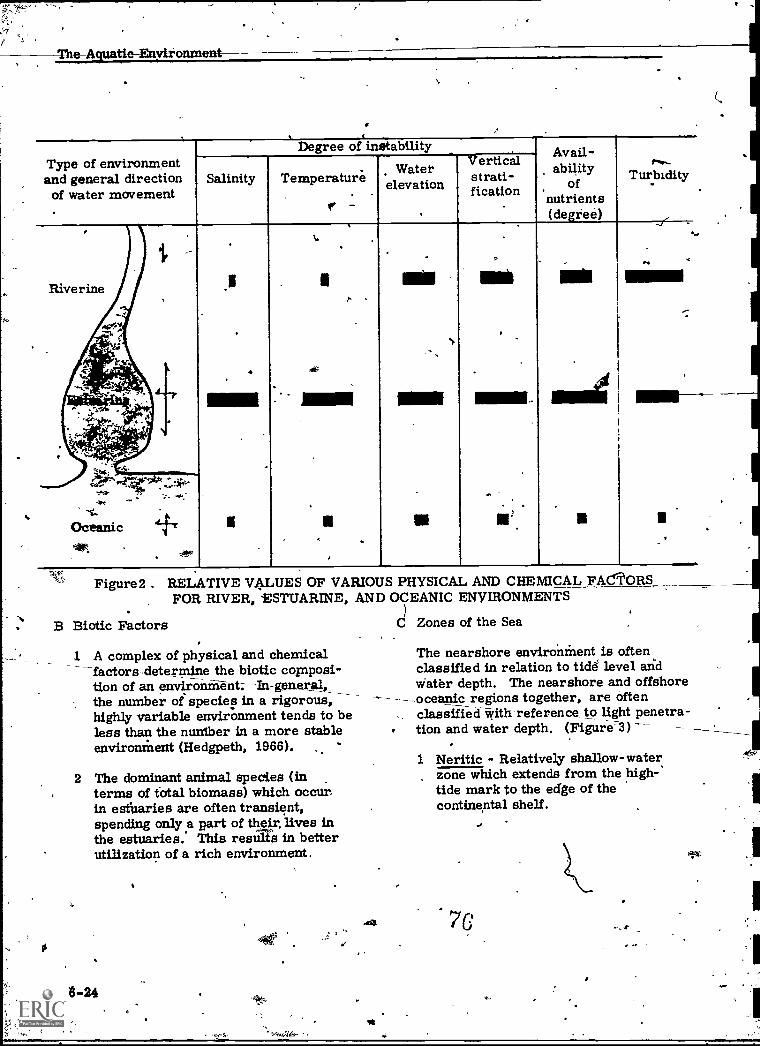
The-Aguatie-Enviion.ment
Type of environmentand general direction
of water movementSalinity
Degree of instability
Temperature'Water
elevation
Verticalstrati-fication
I
MIN
a 1g'
Avail-, ability
ofnutrients(degree)
Turbidity
Figure2 . RELATIVE VALUES OF VARIOUS PHYSICAL AND CHEMICAL FACTORSFOR RIVER, ESTUARINE, AND OCEANIC ENVIRONMENTS
C Zones of the SeaB Biotic Factors
1 A complex of physical and chemicalfactors-determine the biotic cornposi-
tion of an environth-ent.- In-general,the number of species in a rigorous,highly variable environment tends to beless than the nuniber in a more stableenvironment (Hedgpeth, 1966).
2 The dominant animal species (interms of total biomass) which occUrin estuaries are often transient,spending only a part of their . lives inthe estuaries: This results in betterutilization of a rich environment.
6-24
The nearshore environment is oftenclassified in relation to tide level andWater depth. The nearshore and offshore
---- oceanic regions together, are oftenclassifiedWith-reference to light penetra-tion and water depth. (Figure-3)
1 Neritic - Relatively shallow-waterzone which extends from the high-tide mark to the edge of thecontinental shelf.
7c
41,
e
.
MARINE. ECOLOGY
PEG ;36/C
TIC
it total 6.WWWWP SublMoral
I(LAGIC Milo)
Ocmidefoexkl7kAsoperok800,10AlleAblsp910s*
IIENTHIC Mot iem)Supolittoratlotto's! lints/NOSubldlotel
MONOuter
Abyss*Nolol
mot 0.0.4i m aocasisr.oemp MN O40. 00.OW MI CAMOCIM, If Mt00s00.014, IMO oMMI00s...
The Aquatic Environment
OCEANIC-Co*Ilet'ie
4.,n.44 le
it s
O
/7-7/1/1111.7r1-4/-/-1/CP7 fi
B'ENTHIC
M p lop fe
JYYYYLf/fricn°
Bat hypIof le
//IV 02Atoropeloget
rxv
FIGURE 3Classification of marine environments
Stability _of physical-factors ia_intermediate between estuarineand oceanic environments.
k. Phytoplankters are the dominantproduders but in some locationsattached algae are also importantas producers.
10c Theanirnal consumers lore
zooplankton, nekton, and benthicforms:
2 Oceanic - The region of the'citean-beyondJhe Continentinto three parts, au relativelypoorly populated compared to theneritic gone.
.,
a Euphotic zone - Water:it into which,sunlight penetrates (often to thebottom in the. neritic zone). Thezone of primary prOdt}ctivitY oftenextends to-183 meters below thesurface. .
t
. st
000
00
MO
000
a.
%CO
MIN
IMO 0.000
1) Physical factors_fluctuateless than in the neritic zone.
-2) Producers are the phyto- .
plankton and consumers arethe zooplankton and nekton.
b Bathyal zone - From the bottomof the euphotic zone to about2000 meters.
p
Pifyilical factors .relatively_____-constant but light is absent.
ro ucers are absent andconsumers' are scar.de.
c AbyEtsal zone -.A the sea belowthe bathyal zone.
77
1) Physigal factors more con-stant than in bathyal zone.
2) producers absent and consumerseven less-abundant thari'in thebathyal zone.
6r25
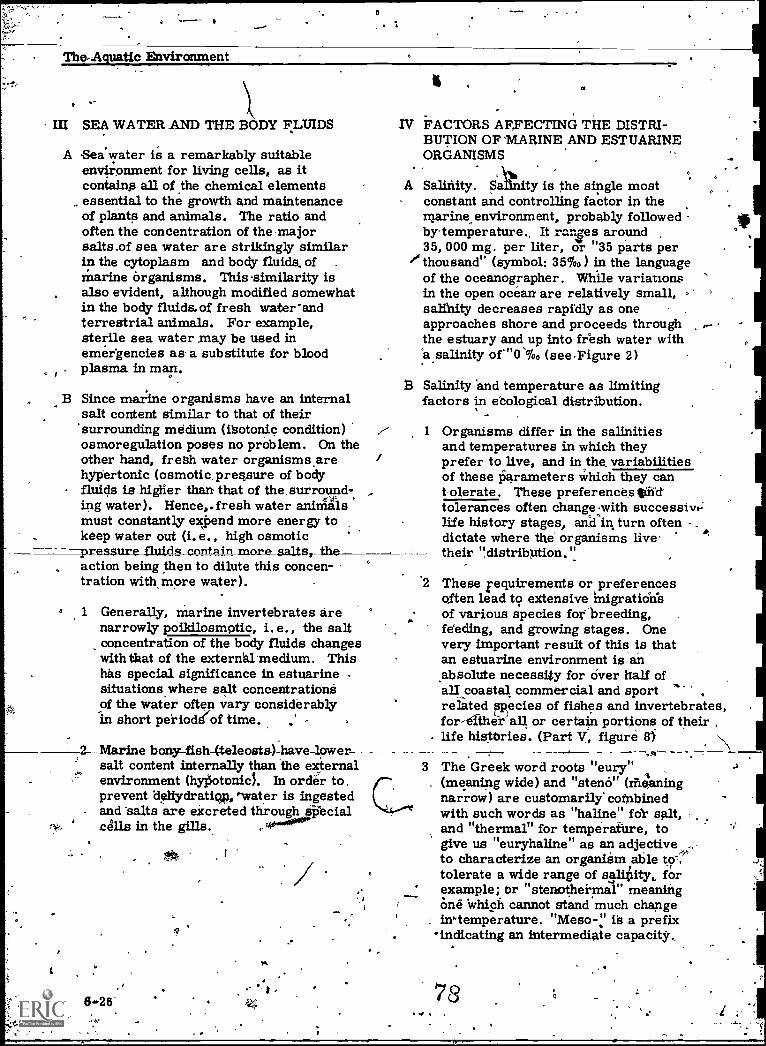
The-Aczuttic Environment
III SEA WATER AND THE BODY FLUIDS
A Sea water is a remarkably suitableenvironment for living cells, as itcontains all a the chemical elementsessential to the growth and maintenanceof plants and animals. The ratio andoften the concentration of the -majorsalts.of sea water are strikingly similarin the cytoplasm and body fluids, ofmarine Organisms. This -similarity isalso evident, although modified somewhatin the body fluids.of fresh water-andterrestrial animals. For example,sterile sea water may be used inemergencies as a substitute for bloodplasma in man.
B Since marine organisms have an internalsalt content similar to that of their'surrounding medium (isotonic condition)osmoregulation poses no problem. On theother hand, fresh water organisms arehypertonic (osmotic pressure of bodyfluids is higher than that of thesurround-.ing water). Hence,.fresh water animalsmust constantly expend more energy tokeep water out (i.e., high osmotic
_ salts, the--a -V - a-sess -
IV FACTORS AFFECTING THE DISTRI-BUTION OF 'MARINE AND ESTUARINEORGANISMS
A Salinity. Salinity is the single mostconstant and controlling factor in thexnarine.,environment, probably followedby temperature., It rimes around35, 000 mg. per liter, or "35 parts per
'thousand" (symbol: 35 %0) in the languageof the oceanographer. While variationsin the open ocean are relatively small, . °
salinity decreases rapidly as oneapproaches shore and proceeds throughthe estuary and up into fresh water with'a salinity of'"OToo (see.Figure 2)
8 Salinity and temperature as limitingfactors in ebological distribution.
1 Organisms differ in the salinitiesand temperatures in which theyprefer to live, and in the, variabilitiesof these parameters which they cantolerate. These preferences Cid'tolerances often changew e'ith successive'life history stages, and in turn often
Adictate where the organisms livetheir "distribution."
'2 These requirements or preferencesoften lead to extensive inigration'sof various species for breeding,feeding, and growing stages, Onevery important result of this is thatan estuarine environment is anabsolute necessity for over half ofall coastal commercial and sportrelated p)ecies of fishes and invertebrates,for-eltherall or certain portions of their ,
life histOries. (Part V, figure 8i
action being then to dilute this concen-tration with more water).
° 1 Generally, marine invertebrates arenarrowly poildlosmotic, i.e., the saltconcentration of the body fluids changeswiththat of the external.mediurn. Thishas special significance in estuarinesituations where salt concentrationsof the water often vary considerablyin short periodIof time.
2 Marine bony-fish--(teleosts)-havelowersalt content internally than the externalenvironment (hyPotonia In order to,prevent hellydratio,p,'-water is ingestedand 'salts are excreted through special.cells in the gills..
3 The Greek word roots "eury"(meaning wide) and "steno" (rheaningnarrow) are customarily conibinedwith such words as "haline" fob salt,and "thermal" for ternperatur" e, togive us "euryhaline" as an adjectiveto characterize an organism able to7.'tolerate a wide range of saliiiity, forexample; or ustenothertnal" meaningOne 'which cannot stand much changein-temperature. "Meso-!' is a prefix
indicating an intermediate capacity.,
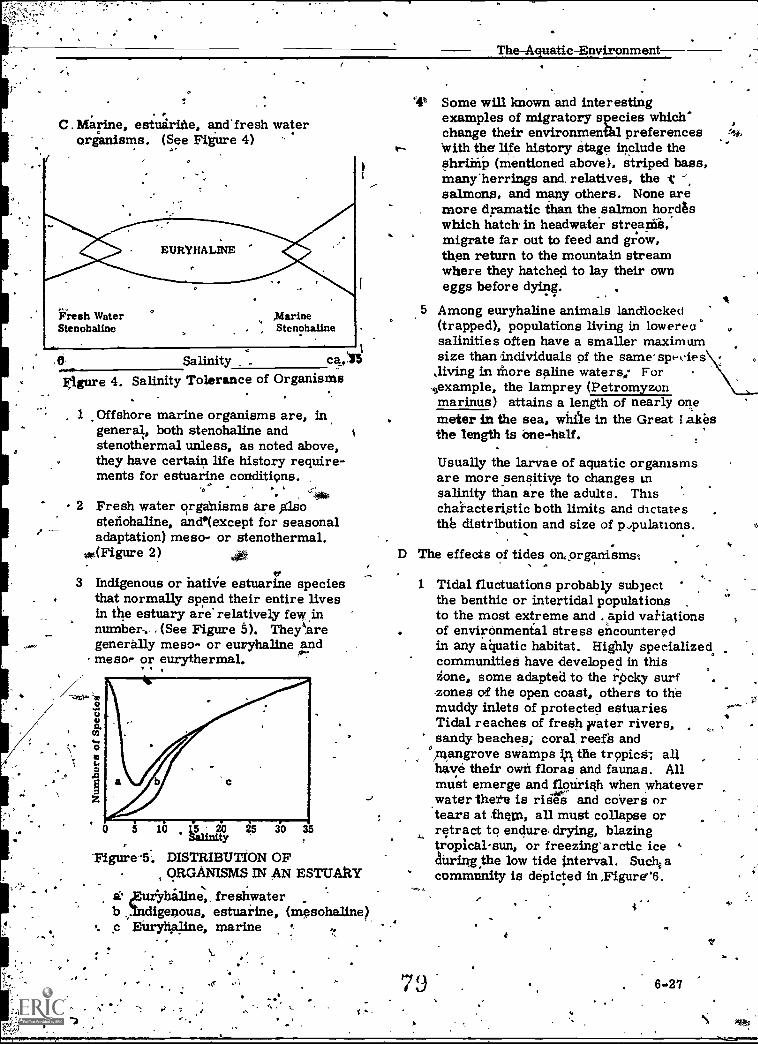
C . Marine, estuaritie, and fresh waterorganisms. (See Figure 4)
--The--Aguatie-Environment
'4 Some will known and interestingexamples of migratory species which'change their environraena..1 preferenceswith the life history stage include theshriiiip (mentioned above), striped bass,many'herrings and. relatives, the -salmons, and many others. None aremore dramatic than the salmon hordgswhich hatch' in headwater streams,migrate far out to feed and grow,then return to the mountain streamwhere they hatched to lay their owneggs before dying. .
Among euryhaline animals landlocked(trapped), populations living in loweredsalinities often have a smaller maximumsize than individuals of the same' spi-AesJiving in more saline waters; For..)example, the lamprey (Petromyzonmarinus) attains a length of nearly onemeter in the sea, while in the Great takesthe length is one-half.
Fresh WaterStenobaline
.
5
EURYHALINE
,Marine, Stenohaline
0 SalinityFigure 4. Salinity Tolerance of Organisms
1 Offshore marine organisms are, ingeneral, both stenohaline andstenothermal unless, as noted above,they have certain life history require-ments for estuarine conditions.
0- .. '4342 Fresh water 9rgshisms are Also
stenohaline, anc(except for seasonaladaptation) meso- or stenothermal.
00.(Figure 2) Atig
rp3 Indigenous or native estuarine species
that normally spend their entire livesin the estuary are relatively few.innumber.- (See Figure 5). They4aregenerally me so- or euryhaline andmesor or eurytherraal.
.
;te
00
0
5 20 15 O 25 io 35
Figure 5. DISTRIBUTION OFORGANISMS IN AN ESTUARY
r'yhaline,, freshwaterdigenous, estuarine, (mesohaline)
Etirylipline, marine
:
r) 7
_94/
Usually the larvae of aquatic organismsare more sensitive to changes insalinity than are the adults. Thischaiacteriptic both limits and dictatesthe distribution and size of populations.
D The effects of tides on,organismst
1 Tidal fluctuations probably subjectthe benthic or intertidal populationsto the most extreme and . apid vahationsof environmental stress encounteredin any aquatic habitat. Highly specialized.communities have developed in thiszone, some adapted to the Ppcky surf-zones of the open coast, others to themuddy inlets of protected estuariesTidal reaches of fresh rater rivers,sandy beaches; coral, reefs and
swamps 4 the tropics; allhave their own floras and faunas. Allmust emerge and flotirigh when whateverwater theta is rises and covers ortears at them, all must collapse orretract to endure- drying, blazingtropical sun, or freezing'arctic iceeluting the low tide interval. Such acommunity is depicted in ,Figure'6.
79
4
647

o
The Aquatic Environment .
or
0
O
6
.4
- 0
SNAILS
Littorina neritoidesL.rudisL. obtusataL. littoreaBA dNACLES
,0
7
:Chihamalui stellatusBalanus balanoidesB. peforatus
t per
O
,,(1;7`
O
. : IV
Pe' 4 '0'1'1n' 6 '
soPV: a.' St;e5 0, 0 0 vairv;;
fb 41,t';(.4)t1JJc j;
,,,, , Nr
.e ,W-4t, ,.6f!: (0, -
110-., e -. !fN 0- -.:` v''',..-, ,r`o I'
'''cr...1t...1n-. '., ,
0 0 0 0 ',-,1 °,
;411.1;`; : '
0 ,,l'f' t',, - #1,'') ',' ii141''.\'i °-\/ - 1.'( .&,) ,:, 0.,i\.,o,10//? '2,, @ 'v '.is\
..,-./7/ 77,111, - ,c-c. )--.2...!_cl_\__U..E_\__c_:t
) o
' I i i'''''' /N).' ' 4/r\ A A I '''4. i vi,,',N
1., ,%if .,,A., /dIp ,4' ,,,-4,,, (- e.....,. e....v,',.;,,,,',,
g), ,/, I) , '1/41, , 7y-, / v.-N.,/
V1)//1.,k/1//\_17 \\e-/ if .44 l/./4/ 1): (?/,./:,?'V (.
Figur4 6Zonation of plants, .snails,4"and barnacles on a rocky shore. Ik(ile
Oils diagram is based bn thituation on the southwest coast oEngland, the general idea of zonation maybe applied.to any ter per-Ai. rocky ocean shore; though the. species will differ. The grayzoneconsists largely of lichens. At the left is the zonation of roificswith expostire too extreme to support algae; at the right, on a lessexposed gititation, theoanimals alie mostly obgcure'd by the algae, -
Figures at the right hand margin refer to the percent of time thatthe zone is exposed to the air, i.e., the time that the tidejs out.Three major zones can be 'recognized: the Littorina -cone (above thegray zone); the Balanoisl zone (bettveen the gray Zone and thelaminarias);, and the Laminaria done. a. Pelvetia canaliculata;b. Fucus spiralis; c, Ascophyllum nodosum; d. Fucus serrates;e. Lamittaria digitata. (Based on Stephenson)
,
. I. wt
28
0
1
p
80
fr
O
1
I
4,o
V FACTORS AFFECTING THE'PRODUCTIVITY OF THE MARINEENVIRONMENT
A.The sea is in continuous circulatiN, With-out circuation, nutrients of the ocean wouldeventually become- apart of the bottom and.biological production would cease. Generally, 2
in all oceans there exists a warm surfaceLayer which overlies the colder water and, e
forms a two-layer system of persistentstability. Nutrient -concentrationls usuallygreatest in the lower zone. Wherever amixing or disturbance of these two layers .
occurs biological productiol,is greatest...,
EC The estuaries are also a mixing,..zone ofenormous importance. Here the fertility
'washed off the land is mingled with thenutrient capaCitir of Seawater, `and manyof the would's most productive watersresult.
'The Aquatic tnvironment,
REFERENCES
1
J
C When man adds his cultural contributionsof sewage, fertilizer, silt or toxic waste,it is no wonder`tkat the dyriamib equilibriumof the ages is rudely upset, and theenvironmentalist criei, "See what Manhath wrought"!
.47-1ACKNOWLEDGEMENT:
This outline cpntains seslectedmaterialfrom other 'ouklines preparedby C. M.Tarzwell, Charles L. Braiin, JrC. G. Gtmnerson, W. Lee Trent, W. B.Cooke, B. H. Ketchum, J. K.- McNuiPy,
L. Taylir, R. M. Sinclair,-*antl others.1
ra
a
a
Ha'rveY, H.W. The Chemistry acid .. Prertility of Sea Water (2nd Ed. ).
Cambridge Univ. Press, New York.34 pp. 1.957. f
Wickstead, John H. Marine Z ooplanktonStudies in Biology no. 62. The Instituteof'Biology. 1976.
81
6
rfl
4'
' -6-29
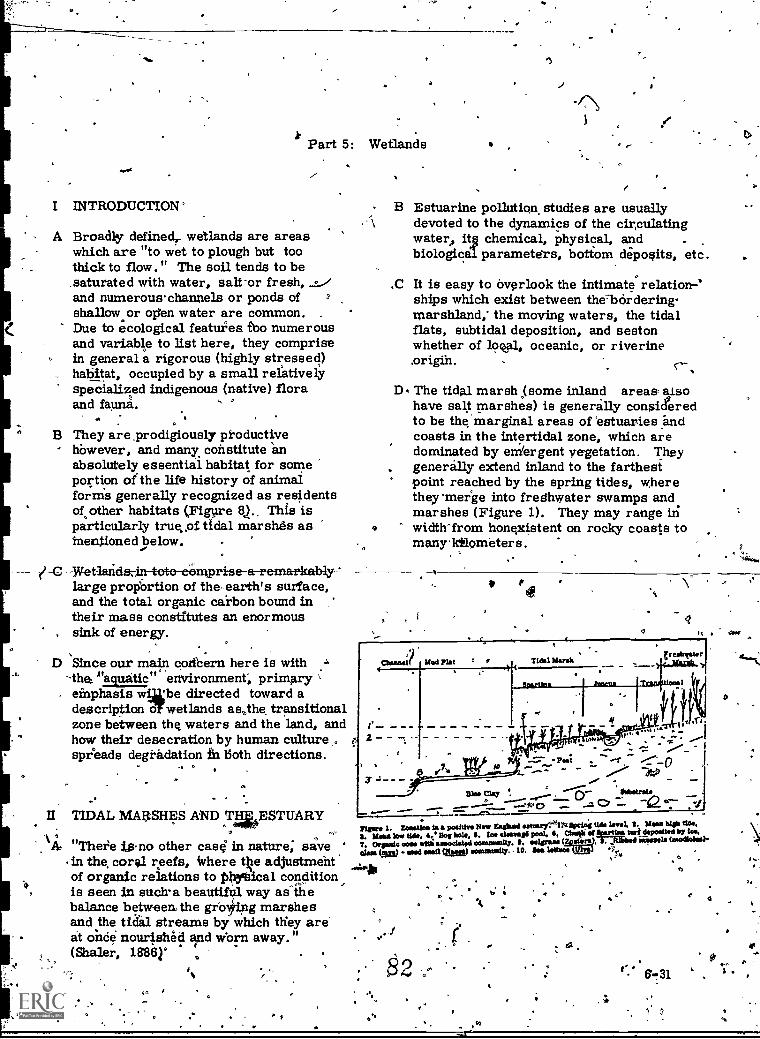
.
.44
Part 5: Wetlands
7
I INTRODUCTION'
A Broadly defined, wetlands are areaswhich are "to wet to plough but toothick to flow." The soil tends to be_saturated with water, salt-or fresh,and numerouschannels or ponds ofshallow or open water are common. .
ecological< Due to features tbo numerousand variable to list here, they comprisein general a rigorous (highly stressed)
_ habitat, occupied by a small relativelyspecialized indigenous (native) floraand fauna.
B They are,prodigiously productivehOwever, and many. constitute anabsolutely essential habitat for someportion of"the life history of animalfornis generally recognized as residentsof other habitats (Figure Q., This isparticularly true of tidal marshes astnentionedbelow.
Wctlaadsk--.in-toto-ciimprise-a -remarkabk,r2large proPOrtion of the earth's surface,and the total organic carbon bound intheir mass constitutes an enormous
. sink of energy.
D Since our main concern here is with-the. "aquatic" environment, primary `.emphasis wUbe directed toward adescription awetlands as,the, transitionalzone between the waters and the land, andhow their desecration by human culture,.spreads degradation fa Both directions.
II TIDAL MARSHES AND TIIE.BSTUARY44.0,A IIA There jpno other case: in nature, save
in the corral reefs, *here tie adjustmentof organic relations to ptlhytical condition.,is seen in sucira beautiful way as thebalance between. the georring marshesand the tidal streams by which they areat oiade nourished and worn away."(Shafer, 18.86)° e
4-, .on
9
B Estuarine pollution studies are usuallydevoted to the dynamics of the circulatingwater, it chemical, physical, andbiological parameters, bottom deposits, etc.
.0 It is easy to Overlook the intimate' relation-'ships which exist between the-bordering-marshland,' the moving waters, the tidalflats, subtidal deposition, and sestonwhether of 19(01, oceanic, or riverine.origin.
D The tidal marsh (some inland areas also,have salt marshes) is generally consideredto be the, marginal areas of 'estuaries andcoasts in the intertidal zone, which aredominated by emergent vegetation. Theygenerally extend inland to the farthestpoint reached by the spring tides, wherethey 'merge into freshwater swamps andmarshes (Figure 1). They may range iriwidth`from nonexistent on rocky coasts tomany.kilometers.
-L. Pee; . -- --; .- -"..0-- -- -
---. .._._._c_------:---__ --.2,2.0 ._. 1. C7 -.1.- -42.- -..,,d
....... ...---- 70..- .,Woe Clay ! ......... , 0 Ibbeirste .....
.---- ....--
Tigers 1. Zesatios la positive New tagad setnari.^417411priag tide km% it Mesa M. Ude,S. Mesa Ise tide. 4. Bog bola, $. toe elessag4 pool. 4, Cteaik d 'partialWei deposited by lea
7. Oriole tem witli sseoelated coastatty. II, eelgrass (?eaters), b. Jibbed euessele boodiolsol-asta (we wed mil film) seestausity. - 10. lea Jetties 1 ;
1
.4.0411,
a .0,4 4
a
4 CI
a
41/
4.44
t0 .
6'-31
)

. The Aquatic Environment .to
.,
III :,MARSH ORIGINS AND STRUCTURES
e
.A. Ingeneral, marsh substrates are highdn-orgprtic content, relatively low in 'mineralsandlrace.elements The upper layersbound together withlivingrobtsturf, underlaid by more cdmpacted'peattype materia
. -
1"itising or erodinga6oastliiies mayI expose peat from anctint marsh
growth -to -waver action -which_ cut s'into the soft peatDilapidly(Figure 2)... -
.s.
#*
I
a
O
-
'41'
.
a.
-,'79°.
642,
biagraeuitatic section °arodies peat cliff
a
4
- Such ba.nks are likely to be cliff-like,and are often undercut qunks ofpeat are often found lying 'aboui, onharder sibetrate beloW high tide lineIf face of cliff is well ahOe high water,
. overlying vegetation is likely to betypically terrestria,1 of the area.Marsh type vegetation is ProbabVabsent. .
2 Low lying deltaic, 'or sinking coast-lines, or those-with low energy waveaction are likely to have active marshformation in progress.: Sand dunesare also Common'in such areas(Figure 3): Generial coastalconfiguiation is a factor.
1'4>:.
'. -ems *50 t AO
. ... FigUre 3-beve1opmezit14 aliassachnietts Marsh shicce1.300 13C P irmciviig s.n;
::
18 foot rise in vrator 'level. Shaded area indicates sand chnibit Note. .,L., nreandering marsh tidal drainage. A 130011C, 11...;-1950 AD. ,
, .."''' .,o:.- .. .
,.... - -,.... 0,1
. ....
4
0
I
4, t
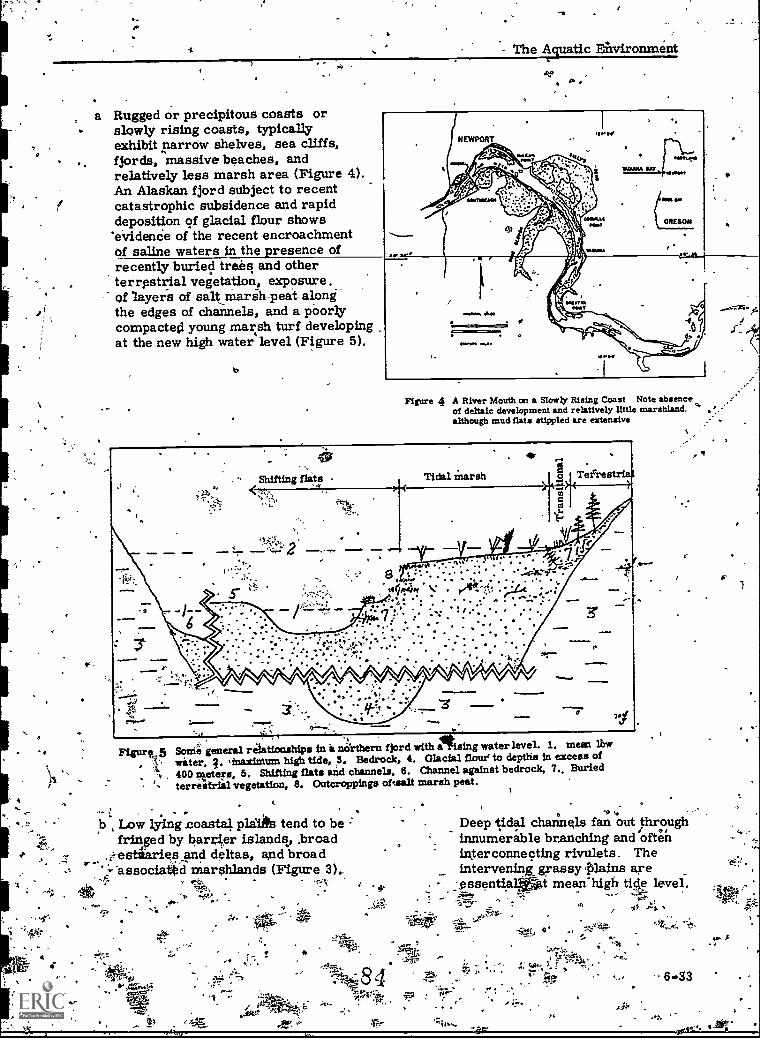
a Rugged or precipitous coasts orslowly rising coasts, typicallyexhibit narrow shelves, sea cliffs,fjords, massive beaches, andrelatively less marsh area (Figure 4).An Alaskan fjord subject to recentcatastrophic subsidence and rapiddeposition of glacial flour shows'evidenCe of the recent encroachmentOf saline waters in the presence ofrecently buried trees and otherterrestrial vegetation, exposure.of layers of salt mar' Sh-peat- alongthe edges of channels, and a poorlycompacted young marsh turf developingat the new high water level (Figure 5).
The Aquatic Environment
a* ,o 4a
Figure 4 A River Mouth on a Slowly Rising Coast Note absenceof deltaic development and relatively little marshland. `4
although mucflats stippled are extensive
Figur. 5 Sonia general rgatiouships ins northern fjord with Ptsing water level. 1. mean lbwwater, ;. ,inaXiMtM high tide, 3. Bedrock, 4. Glacial flour to depths in excess of400 meters, 5. Shifting flats and channels, 8. Channel against bedrock, 7., Buriedterrestrial vegetation, 8. Outcroppings of'aalt marsh peat.
b Low lying coastal plants tend to be 2fringed by barber islands., .broad
,estiaries and deltas, and broadassociated marshlands (Figure 3)..
-
N. ..tt"
11
-o
Deep tidal charinels fan out throughinnumerable branching and 'ofteninterconnecting rivulets. Theintervening grassy 'Plains are
, j,gssentztt mean'high tickIrt
s ii rte;
"It
"P7j-rlo
a 'tea - 6-33
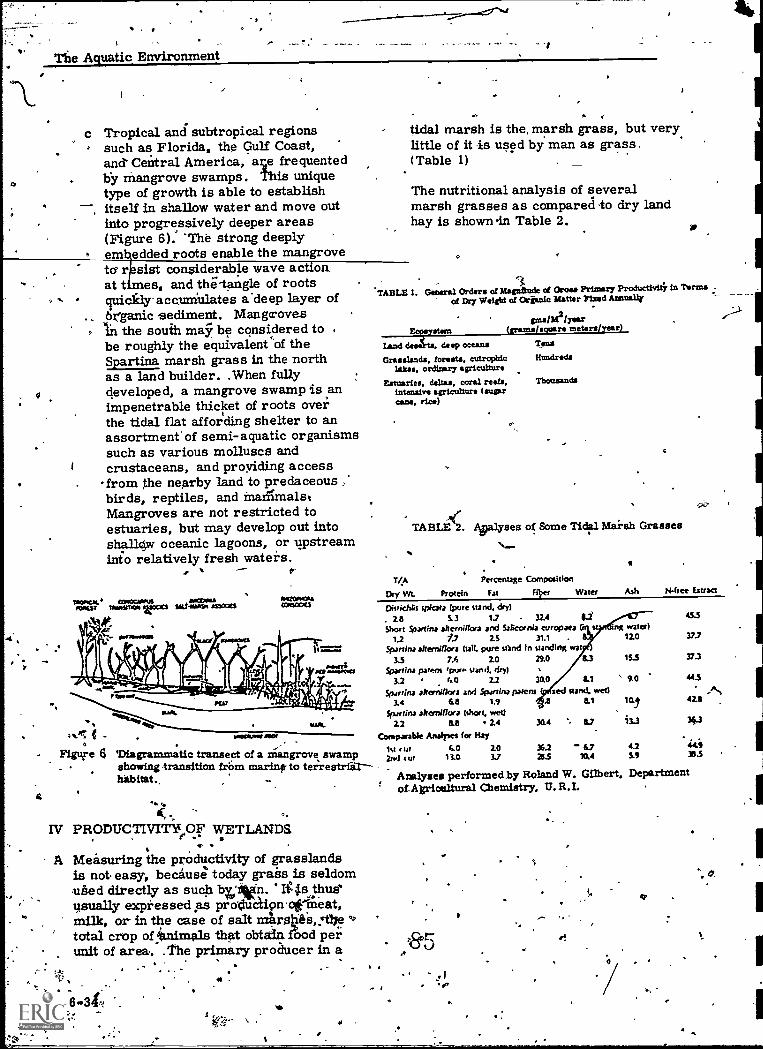
The Aquatic Environment
c Tropical and subtropical regionssuch as Florida, the Gulf Coast,and*Central America, ace frequentedby mangrove swamps. This uniquetype of growth is able to establishitself in shallow water and move outinto progressively deeper areas(Figure 6). 'The strong deeplyem edded roots enable the mangrove
a
tf r sist considerable wave actionat t es, and the-tangle of rootsquickly accumulates a.deep layer oforganic sediment. MangcrovesWin the south may be considered to .
be roughly the equivalent of theSpartina marsh grass in the northas a land builder. . When fullydeveloped, a mangrove swamp is animpenetrable thicket of roots overthe tidal flat affording shelter to anassortment of semi-aquatic organismssuch as various molluscs andcrustaceans, and proyiding access
-from the nearby land to predaceousbirds, reptiles, and inairlmalseMangroves are not restricted toestuaries, but may develop out intoshallow oceanic lagoons, or upstreaminto relatively fresh waters.
roma.' coccarsus maws.room tewsnor rocs saal-satem ascots
eszowou=nom
a %It6
Figure 6_
.tidal marsh is the. marsh grass, but verylittle of it 4s used by man as grass.(Table 1)
The nutritional analysis of severalmarsh grasses as comparealo dry landhay is shown in Table 2.
1.
TABLE 1. General Orders of Magnitude of Grata Primer;Product's* in porous .
of Dry Weight of Organic Matter Pitted Annuallr
gros/312/ysarEcocbsystent (grams/square meters/year)
!And clee ts. deep oceans Tens
Grasslands. forests. cut-rep:de Hundredsplus, ordinary agriculture
Estmaries, deltas, coral reefs. Thousandsintensive agriculture (sugarcane. rig)
T/A
TABLE. Apalyses of Some Tidal Maish Grasses
Percentage Composition
Dry Wt. Protein Fat
Distichlis spicata (pure stand, dry). 26 5.3 1.7 - 32.4 II-2Short Spartina ahernillora and Sakcenia atropaea
1.2 /.7 2.5 31.1 -
Spardna alternillora Cult. pure send in standing wat3.5 7.6 2.0 29.0
Spartina poem 'our. stand. dr.)
Water As H-ftee Extract
rry4 water)12.0
8.3 153
3.2 60 2.2 30.0 II.1
Spartina alternillora and Spotina patens zed tand. wet)14 68 1.9 .3 8.1
*militia akengflora Mort, wet)2.2 to 2.4 30.4 -. 8.7
areranw mot Comparabk Andres rot Hay.
'Diagrammatic transect of a Mangrove swamp- .
6.0 2.0 36.2 "' 6.7r;:,,,,, 13.0 3.7 Z.5 *ashowing transition friim marina to tet=restria---habitat.
_
-. e
Analyses perforrned,by Roland W. Gilbert,of Agricultural Chemistry, U. R. I.
IV PRODUCTIVITY OF WETLANDS.A Measuring the productivity of grasslands
is not easy, because today grass is seldomthed directly as such byAan. *Ii4s thus`usually expressed as producli?n-crineat,milk, or in the case of salt raaropa,.thietotal crop ofjtnirnalq that obtain. rood perunit of area. .The primary producer in a
-
IS
.%16
I
"-
14144,4
9.0
10.
i3.3
4.25.9
4S3
37,
37.3
44.5
42.1
44.933.5
Department
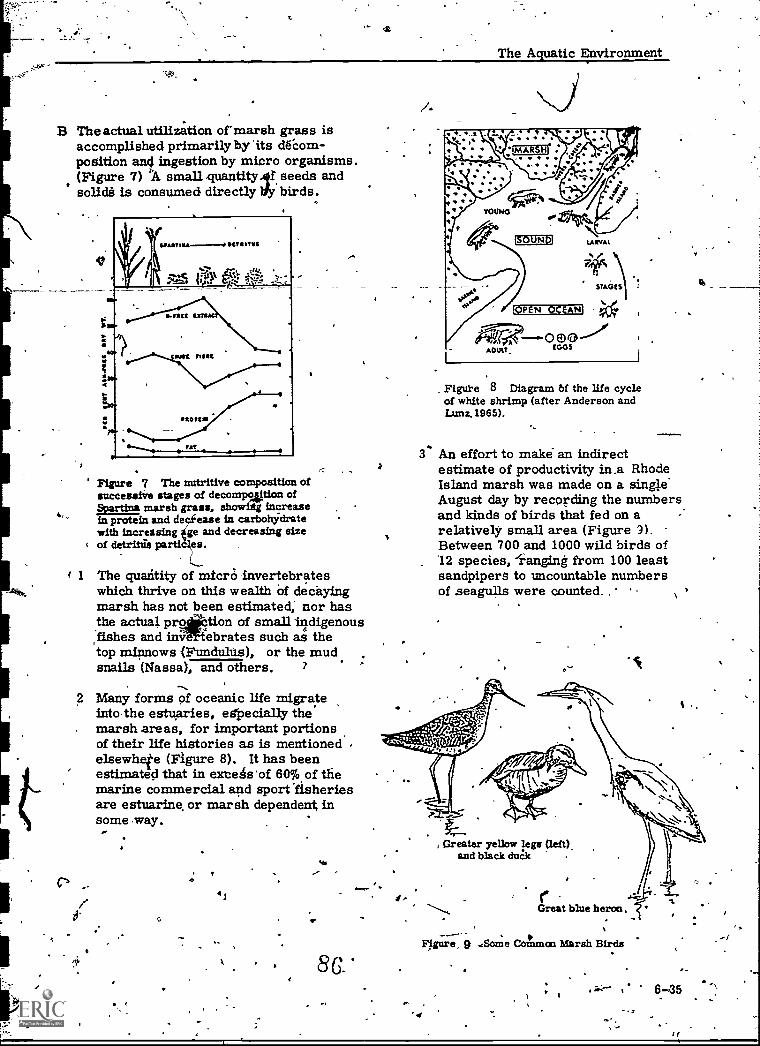
B The actual utilization of-marsh grass isaccomplished primarily by 'its d"com-position and ingestion by micro organisms.(Figure 7) 'A small quantity.tf. seeds andsolidi is consumed directly IIy birds.
Figure 7 The nutritive composition ofsuccessive stages of decompoAttion ofSPartina marsh grass, showili increase
4._ in protein and decease in carbohydratewith increasing ge and decreasing size
c of detritus parti es.
1 The quazitity of mien; invertebrateswhich thrive on this wealth of decayingmarsh has not been estimated; nor hasthe actual proction of small indigenous:fishes and iniifftebrates such as thetop minnows <Fundulus), or the mud.snails (Nesse), and others.
Many forms of oceanic life migrateintthe estuaries, especially themarsh areas, for important portionsof their life histories as is mentionedelsewhete (Figure 8). It has beenestimated that in exteis'of 60% of tfiemarine commercial and sport 'fisheriesare estuarine or marsh dependent insome way.
2
0
4j
.61
8G_
OMR
a
The Aquatic Environment
_ Figure 8 Diagram bf the life cycleof white shrimp (after Anderson andLunz.,1965).
3* An effort to make an indirectestimate of productivity in.a RhodeIsland marsh was made on a single'August day by recording the numbersand kinds of birds that fed on arelatively small area (Figure 3).Between 700 and 1000 wild birds of'12 species, "ranging from 100 leastsandpipers to uncountable numbersof .seagulls were counted..
0
I
Greater yellow legs (left).and black duck
r -Great blue heron
Figure, 9 .Some Dolmas Marsh Birds
I. 6-85-,
al

The Aquatic Environment
Onenmdred black bellied ploversat approximately 283 g each wouldweigh. on the order -of 28 kg. Atthefiame rate of food consumption,this would indicate nearly 1.8 kg.of foiid required for this speciesalone. The much greater activityof the wild birds would obviously
- greatly increase their food require-ments, as would their relativelysmaller size.Considering the range of foods con- .
sumed, the sizes of the birds, and thefact that at cprtain seasons, thousandsof migrating ducks and others pauseto feed here, the enormous productivityof such a marsh call be better under-stood.
V INLAND BOGS AND MARSHES
A Much bf what has been said of tidalmarshes also -applies to inland wetlands.As was mentioned earlier, not' all inlandswamps are salt -free, any more than allmarshes affected by tidal rythms aresaline.
504
B The specifictr*of specialized flora's toparticular type % bf wetlands is perhaps )\-more spectacular in freshwater wetlandsthan in the marine, whets Juncus,Spartina, and Mangroves tend to dominate.
1 Sphagnum* or peat moss,, isprobably one othe most Vddespeadand abundant wetland plants, on earth.D'eevey (1958) quOtes an estimate thatthere is probably upwardi; of 202billions .dry weight) of rgetric tonsiof peat
grecent geologic time from SphagnumbOgs; Particular Irin the northernregions, peat moss tends to, overgrowponds, and shallow depressions, eventuallyfpriVng the vast tundra plains and.moores of the north.
and geographic disttibution, etc.Included would be the familiar cattails,spike rushes, cotton grasses, sedges,trefoils, alders, and many, manyothtrs. - .
C Types of inland wetlands.
1 As noted above (Cf: *Figure 1)-tidal marshes oft ep. merge intofreshwater marshes and bayous.Deltaic tidal sitamps and marshesare often saline in the seawardportion, and fresh in the landwardareas.
in,the world today, derived durin
2 Long liSts of other bog and marsh plants, might be cited, each with tts own
special requirements, toRographical,-
6-36A
2 River bottom wetlands differ fromthose formed fro qi lakes, since wideflood plains subje&tto periodicinundation are the final stages ofthe erosion of river valleys, whereaslakes in general tend to be eliminatedby the geol c processes of naturaleutrophica on often involvirig
ha d peatlorniation.Riverbottom marshes in the southernUnited States, withlravorable climatei.have luurient,growths such as thecaneb ake of the lower Mississippi,or, a raeteristic timber growthsu as cyprest.
though bird ,life is the mostonspicuous animal element in the
fauna (Cf: Figure 9), many mammals,such as muskrats, ,peavers, otters,and others are also marsh-oriented.(Figure 12)
Fiore 12'
4
Otter
.\ IG

4
VI POLLUTION
A No single statement can summarize theeffects of pollution on marshland's asastinct from effects noted elsewhere onother habitats.
4-. , .
B Reduction of Primary Productivity *
The primarAproducers in most wetlandsare the grasses and peat mosses.Proddction may be reduced or eliminated-by:
1 Changes-in the water level broughtabout by flooding or drainage.
a Marshland areas are sometimesdiked and flobded to produce fi-esh-water ponds. This may be foraesthetic reasons, to suppress thegrowth OfspoxiOus marsh inhabitatinginsects such as-mosquitoes Qr brthig_midges, to construct an industrialwaste holding pond, a thermal or asewagelstabilization pond, a"convenient" result of highwaycauseway construction, or otherreason. The result fA theination of an area of marsh. Asmall compensating bdrder ofmarsh may or may not deyelop'.
if -High tidal marshes were oftenditched and drained in former daysto stabilize the sod for salt hay or"thatch" haryesting which was ,highlysought after in colonial days. Thisinevitablyehnuged the characterof the marsh,' but-it remained as
marshlancL Conversionto outright agricultural land hasbeen leEls widespread because-of thenecessity of diking to exclude theperiodic floods or tidal incursions,and carefully timed drainage to'eliminate excess-precipitation.Mechnni cal pumping of tidal marsheshas not been economical' in thiscountry, although the silccess ofthe Dutch and others in this regardis well known.,
The Aquatic Environment..
2 Marsh grasses may also be eliminatedby smothering as, for example, bydeposition of dredge spoils, or thespill or discharge of sewage sludge.
Considerable marsh area has beeneliminated by industrial constructionactivity such as wharf and dock con-struction, oil well construction andoperatiOn, and the discharge of toxicbrines and other chemicals.
Consumer production (animal life) hasbeen drastically reduced by the deliberatedistribution of pesticides. In some cases,this has been aimed,at nearby agriculturallauds for economic crop pest control, inother cases the marshes have been sprayedor dusted directly/to control noxiousinsects.
1 The result; have.been-fmiversdisastrous for the marshes, and thebenefits to the human community 'oftenquestionable.
r
2 Pesticides designed to kill nuisanceN.4
insects, are also toxic to other ,
arthropods so that in addition to thetargetspecies, such forage staples asthe various scuds (ampkipods), fiddlercrabs, and other.macromvertebrateshave either brfiri drastically rekicedor entirely-eliminated in many pN.ces.For example, one familiar with fiddlercrabs can traverse miles of marshmargins, still riddled with their burrows,without seeing-a single live crab..
3. DDT an relate& compounds have been"eaten up the fodd chain" (biologicalmagnification effect) until fi h eatingand other predatory birds such as lierOnsand egrets (Figure 9), have been virtuallyeliminated from vast areas, and theaccumulation of DDT in man himselfisonly too well known.
..88_6-37

The Aquatic Eiwirotiment
13 Most serious of the marsh enemies is,man himself. In his quest for ',lebensraum"
, ,near the water, he has all but killed thewater he strives to approach. Thus up totwenty percent of the marsh-- estuarbie
area in various parts of the country hasalready been utterly destroyed by cut andfill real estate developments (Figures10, 11).
E Swimming birds such as ducks, loons,cormorants, pelicans, and many others
*are severely jeopardizethby floatingpollutants such as oil.
4
4
.*Figure 10. Diagrammatic representation of cut-iand-fill for
real estate detrelopment. mlwe meanlow waterz
, Figure 11. Tracing of portion of map of a'southernicity show,ing extent of cut-rid-fill real .estate development.
89,
I

Aar SUMMARY
A Wetlands comprise the' marshes, swamps,bogs., and tundra area's of the world."They are essential to the well-being ;ofour surface- water -and groun-&-yAters,Theyare ess to aquatic life ofRU types living in the open waters. They
. are essential ashabitat for all forms ofwildlife.
I *
- -TheAdal niarsh-is.the-,area of-emergentyegeta on bordering,the ocean or anest
C Marshes are highly productive areas,essential to the maintenance of a wellrounded community of aquatic life.
D Wetlands may be destroyed by:
1 Degradation of the life forms ofwhich it is composed in the name ofnuisance control. ,
a
2 Physical destruction by cut-and-fillto create' more land area.
4
C
REFERENCES
1 Anderson, W.W. The Shrimp and theShrimp Fishery of the SouthernUnited States. USDI, FWS, BCF.Fishery Leaflet 589. 1986.
2 Deevey, E.S., Jr. Bogs. Sci. Am. Vol.'199():115-122. October 1958.
3 Emery, K. O. and Stevenson. 'Estuariesand Lagoons. Part Fa BiologicalAspects by J, W. Hedgepeth, ,pp 693-728. in: Treatise "on Marine Ecology
PaeOecology. Geol. Soc. Am. ,
. Mein. 67. Washington, DC. 1957.
4 Hesse, R., W. C. Allee, and K, P.-Schmidt. Eeologic.al Animal
. Geography. John Wiley & Sons. 1937..
.
The Aquatic Environment
r .
5 Morgan, .32.13 EPhemeral Estuaries ofthe Deltaic Environmentin' Eituaries,pp. 115 -120. Publ.: NO. 83, Am.Assoc: Adv. Sci. Washington, DC. 1967.
6 Odum, E. P.- and Dela Crug, A.A.Particulate Organicfnetritus in aGeorgia Salt Marsh - Estuarine .Ecosystem. in: Estuaries,pp. 383-380, Publ, No.: 83, Am. Assoc.i Adv.Sci. Washington, . DC, _1967. _
7 Redfield, A. C. The Ontogeny of a Salt.Marsh Estuary. in: Estuatties,108-114." Publ. No. 83, Am. Assoc,Adv. Sci. Washington, DC. 1967.
8 Stuckey, 0. H. Measuring the Productivityof Salt Marshes. Maritimes (GradSchool of Ocean., U. Rt. ) Vol. 14(1):9-11. FebruarY. 1970.
. -'9 Williams, R. B Compartmental
Analysis, of Production. and Decayof Juncus reomerianus, Frog.Report, Radiobiol. Lab., Beaufort, NC,Fiscal Year 1968, ysm, BCF, pp. 10-12.
This 'outline was prepared by H. W. Jackson,-former Chief Biologist, National TrainingCenter, and-revised by R. M. ;Sinclair; AquaticBiologist, National Traiping and Operational -----Technology Centel-, OWPO, USEPA, Cincinnati, ",Ohio 45268
Descriptors: Aquatic Enihronment, BiologicalEstuarine Enirironment, Lentic Environment,Lotic Environment, "Currents; Marshes,Limnolbgy, Magnification, Water,Properties
Cr'
9 0-6-39

;. ,
EFFECT OF WASTEWATER TREATMENT PLANT EFFLUENT -pN SMAtt-tTREAMS
BENtHOS, ARE ORGANISMS GROWINGON OR ASSOCIATED PRINCIPALLYWITH THE BOTTOM OF WATER
Benthos is the noun.
(protozoa and rotifers) and the macro-fauna (insects, etc-. ). They .paiS a _NO. 30sieve (0. 5 mm approximately). In, fre-sh-:wdter they include nematodes, cope-pods.tardigrad'es. naiad worms, and some flatworms. They are usually ignored infresh--Water studies. ,sThCe they pass the,standarcisieve and/or sanipling devices.
Macrofauna (macriAnvertebrates)
Animals that are retain on a No. .30 meshsieve (0.5 mm appro ately). This group--includes the insects, o s, ,molluscs, andoccasionally fish. Fi h are not normallyconsideresl,as bentho, , though there are bottomdwellers suttratrectftiner-settlesdarters, and madtoms.
B The benthos is a self-contained community.though there is interchange with other 4---77communi4es. For example: Plankton .settles to/it, fish prey on it and lay theireggs there, terrestrial detritus and leavesare added to it, acted many aquatic insectsmigrate from it to the terrestrial environ-ment for their mating cycles.
C It is an in-situ water quality monitor. Thelow mobility of the biotic components requires -that-they "live'with" the quality changes of theover-passing waters.. Changes imposed in thelong-lived components remain visible forextended periods, even after the cause hasbeen eliminated. Only time will allow a curefor the community by drift, ,reproductimi, and re-cruitment from the hyporheic zone.
Benthonic,. benthal acid benthic are-
0
'5 Meiotauna
Meiofauna occupy the interstitial -zone(like between sand grains) In benthic
- and hyporheiC habitats. They are inter -diate in-siee-13etween-the-Mi-c-rolanna
adjectives.
II THE BENTHIe COMMUNITY'. .
A Composed of a wide variety of life '.forms that are related because they.occupy "common ground"--substratesof oceans, lakes, streams,. etc.They may be attached, burrowing, or.move on the interface:
, 1 Bacteria,cr.
.A ride Variety of decomposers work. on orgaitic materials, breaking then
down to elemental or simple icomzpOundsi. -
.
2 'Algae
Photosynthetic plants having no trueroots. stems, and leaves. The basicproducers/Of food thtt nurtures -theanimal components of the community.
3 EloViering Aquatic Plants, (Riverweeds,Pondweeds) ;
The largest flora., composed ofcomplex and differentiated tissues.May emersed, floating, or sub-me according to habit.
Microfatma
Includes' many animals that-pass;through a q. S. Standard Series Ng. 30sieve,, but are r4aineii'on a No. 180sieve. Examples are rotifersand micro7crustaceans. Some -fdrms have organsfor attachment to substrates, whileothers burrow into soft material's oroccupy the interstices between rocks,floral. or faunalmaterials.
,BI. MET. fm. 81. 2. 81 .
6
_----,-ID-3-eWe-en, the benthic zone (substrate /Water
,interfacp) and the underground water tableis the hypOtheib zone; There is considerableinterchange froth one zone to another.
61- HISTORY OF BENTHIC. OBSERVATIONS,
-A Ancient literattile records thevermin associ-ated with foule,dyaters. --
7-1c
9

.
_op
49,
' Effect of Wastewater Treatment Plant Effluent on Small'Streams
B 500 -year- old fishing literature refersto animal forms thatarefish food andused as bait.
.0 The scientific literature associatingbiota to water pollution problems isover 100 yeari old (Mackenthun and
. .
3 Consumers -4
a Detritivores and bacterial feeders
b Herbivores
c Predators.
C Economy of Survey
.
. .11 Q 4 -i .- :2. -.
invesfigations were initiated.
1" The entrance of state boards Ofhealth -
into#water pollution control activities.
-3=ereation of state rionseiiration'aRiencs.A
Industrialization anci urbanization...
4 Growth oflirrinological programsat universities.
E Adecided increase in berithicstudiesoccurred inthe 1950's and much oftoday's activities yore strong,ity
-by....dekelripmental_wor_k_andueted duringthis period. Solgg.of the reasons for thisare:
z
1 Manpower
Titnea
3 Equipment
D Extensive Supporting Literature2
E Advantages of'the Macrobent hos.-1.
- '1, Relatively sessileak 7
2 Life history length04,'3 Fish-food organisms
4 freliahility of Sampling. -
Dollars / information
Nacademic biology') to appliedpollutionprograms.
.. .
2e _gliyance of the federal government ......)**
into enforcement aspects of waterpollution control. 41 / ,z
.1. , ,.
3 A rising econ my and the development, of felderal gr t Syirt anis.
.
f 1,..w
Env"` Proteetion Programsare a current stimulqs.
t WHY HE BENTHOS?
A It .isia naturel monitor0 ,
,B Th co contaAs all Of theco ts of an ecosystem.ta
A educersa bacterla
01**"b2 Producers (plants)
172 (53. :fa-
1.
. 6. Predictability.
-
./ 'Universality
S °Egli- hypteresia value.
, f -
.
Sub* cherrtical qhdifges,tmequivo41.' data,. and 'observations .
:suited tb,some evaluation will -be needed. :This reritilreinent favors, thernacrqfauna as aparameter.'ipvertebrates are ,easier to samplereproductively than other organisms;numerical estimateare 6sible andtaxonomy needed Air synoptic.investi.gations is the. reach of a non-'EtpecialistirrWuhrmann) "
G ('It is self-bvident th fora multitude ofnon-identifiable tho ghtiolOgically active'rchariges of chethical con'ditionti in rivers.
.'smair organisms withthigh pkvsiologieal,differentiation are nlost responsive.Thus the small macroinVertebratei(e.4.( insects) are doubtleisly the mostsensitive organisms for ciembristrating
'
O
4
f.
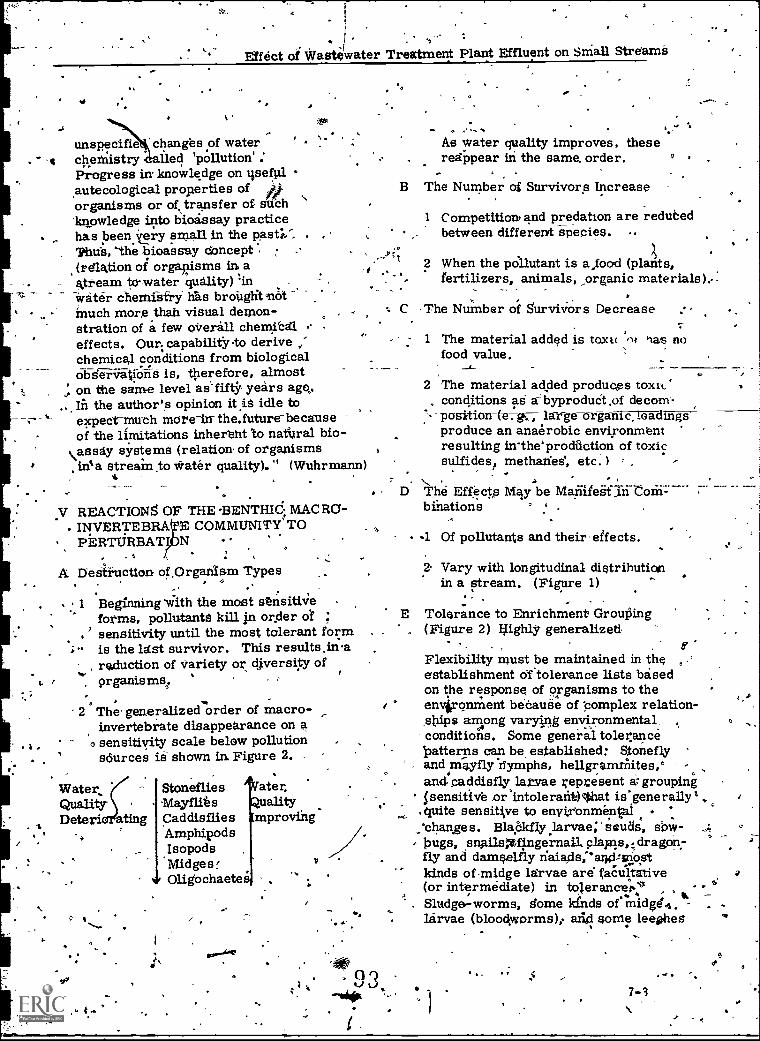
1
- 1
Effect of Wastiwater Treatment Plant Effluent on Sniall Streams
.4 .unspecific changes of watercheMistry ed 'pollution' :Progress in knowledge on tiseful,autecological properties of #organisms or of, transfer of suchknowledge into bioissay practicehas peenVery small in the past'Phils, The bioassay concept(relation of orgapisms in aatream to-water quality) inWater Aemfsfryy gas bronglitn;tMuch more .thati visual demon-stration of a few overall chemicaleffects. Our., capabilitYto derivechemical conditions from biologicalobservations is, therefore, almoston the same level as'fiftk years agoo.Iii the author's opinion it is idle toexpect -much more the future becauseof the limitations inherent to natural bio-
\assay systems (relatio of organismsince. streain.to water quality)." (Wuhrmann)
,r1
V REACTIONS OF THE BENTHId, MACRO-. INVERTEBRA COMMUNITY' TO
PhRTURBAT N .
A Desirti' ction ofOrganism Types.". .. .
1 Beginning ',With the most sensitiveforms, pollutanta kill in order of ;
, ' sensitivity until the most tolerant form; - is the last survivor. This resultsina.
, reduction of variety or diversity of..,
organisms,.
2 The generalizedorder of macro-invertebrate disappearance on asensitivity scale below pollutionsources is shown in Figure 2. -
.
Water,.QualityDeteri ting
Stoneflies ater,ality
Caddisflies mprovingAmphipodsIsopodsMidges!Oligochaetee
of
..,-As water quality improves, thesereappear in the same, order.
B The Number of Survivors Increase
I
4.-
Competition, and predation are redubedbetween different species.
srt2 When the pollutant is a,food (plants,
fertilizers, animals, organic materials):
C The Number of SurviVors Decrease
r ,
D
1 The material added is toxic 04 liais nofood value.
2 The material added produces toxic'. conditions as a-byproduCt.of decom-
' position (-E6?..., large organic, loadingsproduce an anaerobic environmentresulting in-the'prodaction of toxicsulfides methaded, etc. )
The Effects May be Mailifegf_lictorn:---binations
-1 Of pollutants and their ,effects.
a Vary with longitudinal distributionin a stream. (Figure 1)
.
E Tolerance to Enrichment GrouPing. (Figure 2) Iighly generalized
. ,
Flexibility must be maintained in the ,
establishment oftolerance lists basedon the response of organisms to theenvironment beoauSe of complex relation-,snips among varying environmental,conditions. Some general toler,ancepatterns can be established: Stonefly
mayflyayfly .rtymphs, hellgramMites,'andoa.ddisfly larvae repvesent a; grouping,sensitive or Intolerarit)lhatquite sensittve to enytronmentalchanges. Bla,akfly larvae; 'Scuds, Sow -bugs, ,snailsXkingernail. playns,; dragon:fly and damselfly riaia,ds,"and-linio,stkinds ofmidge larvae are gacultati ve(or intermediate) in tolerancef,7 41"2Sludge-worms, tome kinds of midge.%larvae (bloodworms), aiic1 some leekohes

0.
Effect of Wastewater Treatment Plant Effluent on Small Streams
&in I
4
OiltICTION 411W-0.C.
w
TIME OR5DISTANCE
/OF -KINDS, OF ..ORGANISMS
35EPOSITS
.-----...NUMBER. N
,SLUDGE
\
are tolerant to comparatively heavy loadsof organic pollutants. Sewage mosquitoesand rat=tailed maggots are toleranf ofanaerobic environments for they are .
W essentially air-breathers.
F Structural Limitations
1 The morphological structure of a.species limits the type of environmentit may Occupy.
Four basic response of bottom cmimals to p011ution.A. Organic waste, eliminate the sensitive bottom animals,and provide food is the form of sludges for the surviving toler;ant forms. B. Laisie:quantities of decomposing orginic wasteseliminate sensitive'bottom cog' inaLs and the excessive Ocalaties of byproducts of organic decomposition inhibit the tolerant'forms: in time, with natural stream purification. water qualitybniSroves so, that the tolerant forms can flourish, utilizing thesludges as food: C. Toxic materials eliminate the sensitivebottom animals: sludge it abient and food 15 restricted to thatnaturally occurring in -the stream,,whidh Did* the number oftolerant surviving forms. very toxic materials may eliminateall organisms below a waste source. D. Organic sludges withtoxic materials reduce the number of kinds by eliminatingsensitive forms. Tolerant" survivors do not utilize the organicsludges becciute the toxicity restricts their growth.
7-4
,
a
Figure 1
.1
`2-t.
a Species with complex appendages.,and exposed complicated respiratorN,structures, such as stoneflynymphs, .mayfly nymphs, anccaddisfly larvae, that are subjectedto a-constant-tieluge-of-d-.particulate matter soon abandon
the polluted'area because of theconstant preeningirequired to main-tain mobility or respiratory fune-dons; otherwise, they are soonsmothered.fBenthic animals in depositing zones
"may also,be burdened by "sewage, °fungus" 'growths including stalkedprotozoans. Many of these stalkedprotozoans are host specific.
2 ,Species without complipated'externalstructures, such as bloodlrorms.andsludgeworms, are not so limited inadaptability.
a A'sludgeworm, for example, :canburrow in a deluge of particulate '-organic matter.and flourish on theabundance of "manna." .
.b Worphology alsbdetermines the
species that ate found in riffles, on'veggt4tion, on the bOttorn, of poErls,or in bottom deposits.
e
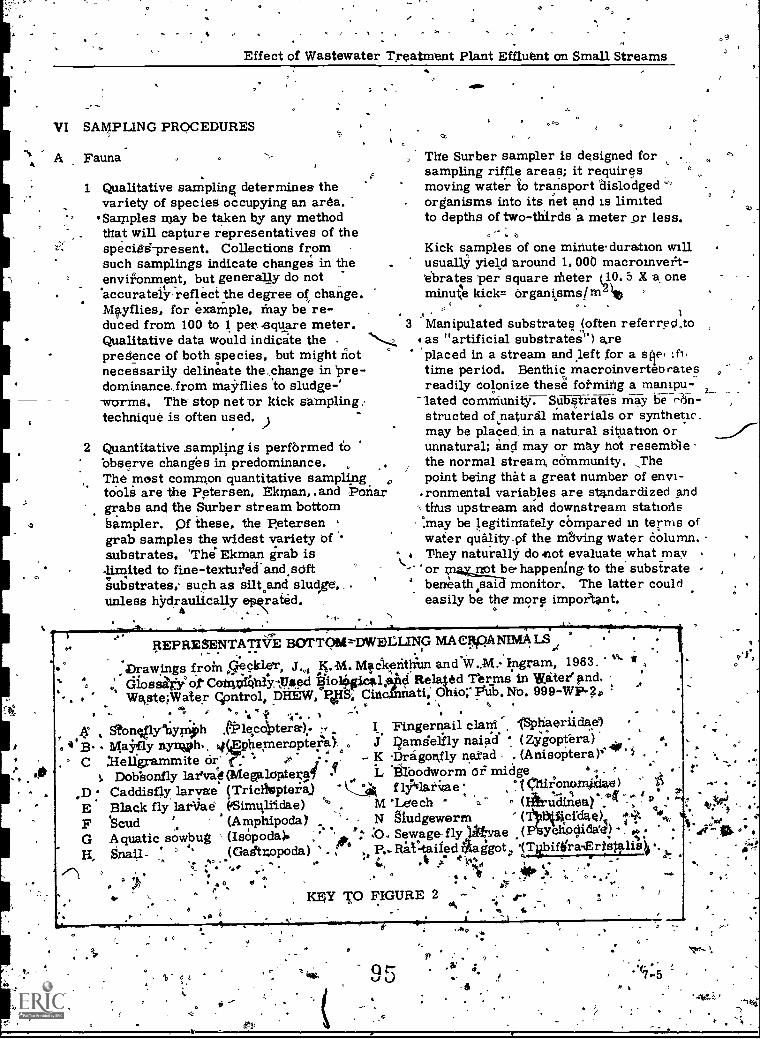
4
Effect of Wastewater Treatment Plant Effluent on Small Streams
VI SAMPLING PROCEDURES
A Fauna
1 Qualitative sampling determines thevariety of species occupying an area.
*Samples may be taken by any methodthat will capture representatives of thespecia-present. Collections fromsuch samplings indicate changes in theenvironment, but generally do not'accurately,reflectthe degree of change.Mayflies, for example, may be re-duced from 100 to 1 per -square meter.Qualitative data would indicate thepresence of both species, but might notnecessarily delineate the,ohange inpre-dominance- from mayflies 'to sludge-'wuL 115. The- stop net Dr kick sampling.,technique is often used.
,o
ct,
The Surber sampler is designed for .
sampling riffle areas; it requiresmoving water to transport 'dislodged "organisms into its net and is limitedto depths of two-thirds a meter or less.
Kick samples of one minuteduration willusually yield around 1,000 macromvertt-ibrats per square dieter U0.5 X a. oneminute kick= organisms/m 116 °
*
3 Manipulated substrates (often referred.to*as "artificial substrates") areplaced in a stream and left for a speIfl,time period. Benthic macroinverteb ratesreadily colonize these forming a manipu-
-lated comniunify Suh rates may be r6n-structed of,hatural materials or synthetic.may be placed. in a natural situatron orunnatural; and may or may hot resemblethe normal stream, community. Thepoint being that a great number of envi-.ronmental variables are standardized andthus upstream and downstream stationsm ay be legitimately compared m terms ofwater quality,pf the hiaving water column.
t They naturally do not evaluate what mayor trot be- happening to the substrate ,
berreathsai monitor. The latter couldeasily be the more impoitant.
O
2 Quantitative sampling is performed tobbserve changes in predominance.The most common quantitative samplingtOoli are the Petersen, Ekman, and Pone/.grabs and the Surber stream bottomSampler. pf these, the P,ete,rsengrab samples the widest variety ofsubstrates. The Ekman grab is-limited to fine-texturtecc and,softsubstrates; such as silt.and sludge, ,unless hydraulically epkrated.
A*-1-
*
.s
o
1'
REPRESENTATIVE BOT TOrd=DWEL 11Np MA ctepA NIMA.
oDrawings from Qeckler J Mtcic,exithim and W.M. Ingram, 1963.diossit6 of Coinn14111yllated Ffio/ligick144 Rela/ed firms in Witee and,WasteiWater qpntrol, ?HEW:Poll% Cincinnati;Ohio'," Fttrb. No. 999 -WP ? ic
.
, gtonkflyIiy4h .fElec4terat. o
C hellgrammite or° K °Dragonfly naiad . (Anisoptera)' 411.1
9
I Fingernail clani", 1Sphaerii.ke)414B- MaSfly nyroh. 4(frobemeroptetl'ai J Damselfly naiad (Zigoptera).
/
t. Dobbonfly lar'va*0 allegakipier.eyi , I. inbodworm of midge 4: , ,?. je
,D: Caddisfly larvae (Triclhopteia) ,._:',44, f li'llati4ae °, t Ckti.r.OnarrWawe ) p
E Blaok fly larVae (aSimilltidae) '" M *Leech " 'c. s (gfrtlairl . "" 4 V rie a i ,
F *Scud 1,.(ArnphipodaY
G Aquatic sowbug ' (Isopoda) ,
Ii, Snail- ° ' (Gasttr.opoda)
O
4NliN §ludgeworrn ' ( Epicfdae)1 11';
Sewage- fly Iktrae YellOcjidae? , *
Eta -taifed Aaggot
KAY TO FIGURE 2 r.4 fa
2!
o .II: 0


A
Effect of Wastewater Treatment Plant Effluent on Small Streams
v
:4 Invertebrates-which are.part of thebenthos, but under certain conditionsbeoorne carried downstream inappreciable numbers, are known asDrift.
Groupswhich have members forminga conspicuous part of the driftinclude the insect orders Ephemeroptera,trichoptera, Plecoptera and thecrustacean order Amphipoda.
Drift net studies are widel5r used andhave a proven validity in streamwater quality studies.
5 The collected sample is screened witha standard 'sieve to concentrate theorganisms; these are separated fromsubstrate-and debris, and the numberof ec,likin.d of organism determined.,Data are Ilieri'adjusted to number perunitc,area, usually to number of bottom;organ19185er square meter.
4.
.6 Independently, neither qualMative notquantitative data suffice for thoroughanalyses of env-ironmenta4 condftibns.A cursory examination to detect damageMay ;be taade with either method, blita combination of the two gives a 'more.precise determination:, La choice mustbe made, quantitative Saingling wouldbe best, bea`ause it incorporates apartial qualitative Sample.
7 Studi0 have shown that a significantnumber and variety of inacroinvpi-te-
: brates inhabit the hyporheic zone in streams.As Much,as 80% of the macroinilei-te-brates may be-below 5 cm in thishyporheic zone. Most sainplesbandsampling techniques do not,penetratethe substrate below the 5 en? depthsAll quantriative studies must tape this ,and other substrate factors into account.
. wberi absolute figures are presented onstanding crop and numbers per squaremeter; etc.
B' Flora
4.1?
Dire,ct quantitative sampling of natu-rally growing bottom algae is difficul4.It is basically one of collecting algaefrom a standard or uniform area of thebottom substrates without disturbingthe delicate growths and thereby dis-tort the sample. Indirect quantitativesampling is the best available method.
2 Manipulated substrates, such as wood. blocks, glass or plexiglass
bricks, etc., are placed m a Stream.Bottom-attached algae will grow )r
. these artificial substPates. After twoor more weeks, the artificial sub-strates are removed for analysis.Algal growths are scraped from thesubstrates and the quantity measv ed.Since the exposed substrate area antiexposure periodg are equal at all ofthe sampling sites, differences in thequantity of algae can be related tochanges in the quality of water flowingover the substrates.
VII ANALYSES OF MICROFLORA
97
A Enumeration
1 The quantity of algae on manipulatedsubstrates can be measured in severalways: Microscopic counts of algal*celle-and dry weight of .a algal mater-ial, are long established methods.
2 Microscopic counts involve thoroughscraping, mixing and suspension ofthe algal .cells. From this mixturearraliquot of cells is withdrawn forenumeration under a microscope.Dry weight is determined by dryingand weighing the algal sample. thenigniting the sample to burn aff thealgal materials, leaving inert inorganicmaterials that are again weighed. °
The difference between initial dry weightand weight after ignition is attributed toalgae.
3 Any organic sedinlents, however,that settle on.the substrate alongwith the, algae are processed also.
7-7

Effect of Wastewater Treatment Plant Effluent on Small Streams
Thus, if organkc wastes are presentappreciable errors matt' enter intothis method.
Chlorophyll Analysis
1 During the past decade, chlorophyllanalysis has become a popular methodfor estimating algal growth. Chloro-phyll is extracted from the algae andis used as an index of the quantity ofalgae present. The advantages ofchlorophyll analysis are rapidity,simplicity, and vivid pictorial results.
2 The algae are scrubbed from theplaced substrate-samples, ground,then each sample is steeped in equalvolumes, 90% aqueous acetone, whichextracts the ;chlorophyll from the algalcells. The chlorophyll extracts maybe compared visually.
3 Because the cholorophyll extracts fadewith time, colorimetry should be usedfor permanent records. For routinerecords, simple colorimeters willsuffice. At very high cholorophylldensities, interference with colori-metry occurs, 'which must be correctedthrough serial dilution of the sampleor wita. nomograph.
C --Autotrophic Index
The chlorophyll content of the periphyton, is used to estimate the algal biomass and
as an indicator of the nutrient content(or trophiestatus) or toxicity of the waterand the taxonomic composition of thecommunity. Periphyton growing in sur-.face water relatively free of organic fpollution consists largely of algae,which contain approximately 1 to 2 er centchlorophyll a by dry weight. If dissolved.or particulate organic matter is presentin high concentrations, large populationsof filamentous bacteria, stalked protozoa,and other nonchlorophyll bearing micro-organisms develop and the percentageof chlorophyll is then reduced. If the',biomass-chlorophyll a relationshipis expressed as a ratio (the autotro-
iphic index), valves greater than 100may result from organic pollution(Weber and McFarland, 1969; Weber,1973).
7-8
Autotrophic Index = Ash-free Wgt (mg/ra5Chlorophyll a (mg/m4)N)
VIII MACROINVERTEBRATE ANALYSES
A Taxonomic
The taxonomic level to which animals are'Identified depends on the needs,' experience.and available resources. However, thetaxonomic level to which identifications arecarried in each major group should beconstant throughout a given study.
B Biomass
Mac roinvertebratebiomass (weight of,organisms per unit area) is a usefulquantitative estimation of standing crop.
C Reporting Units
Data from quantitative samples may be usedto obtain:
I .Total standing crop of individuals, orbiomass, or both per unit area or unitvolume or sample unit, and
2 Numbers of biomass, or both, of individualtaia per unit area or unit volume or sampleunit.
3 Data from devices sampling a unit areaof'bottom will be reported in grams dryweight or ash§free 'dry weight per square.meter (gm /m ), or numbers of indi-viduals per square meter, or both.
4 Data from multiplate samplers will bereported in terms of the total surfacearea of the plates in grams dry weightor ash-free dry weight or 'numbers ofindividuals per square meter, or both.
5 Data from rock-filled basket Samplerswill be reported as grams dry weight.or, numbers of individuals per sampler,of both.
03
Effect of Wastewater Treatment Plant Effluent on Small Streams
IX FACTORS INVOLVED IN DATA INTER-PRETATION
Two very importantqactors in dataievalud-tibn are A thorough knowledge of conditionsunder which the data were collected and i.ailtical assessment of the reliability of thedata's. rppressntation pf the situation.
A Maximum-Minimum Values 0,
The evaluation of physical and chemicadata to determine their effects on aquaticorganisms is primarilydependent on -
maximum and minimum observed' values.The mean is useful only when the data arerelatively uniforni. The minimum ormaximum values usually create acuteconditions in the environment.
B Identification
Precise identification of organisms tospecies requires a specialist' for eachtaxonomic group. Many immatureaquatic forms have not been associatedwith the adult species. Therefore, onewho is certain of the genus but not thespecies should utilize the generic name,not a potentially incorrect species name.The method of interpreting biologicaldata on the basis of numbers of kindsand numbers of organisms is use,ftit,
1;0
.0 'Lake and Stream Influence
Physical characteristics'of a body ofwster, also affect animal populations,Lakes or impounded bodies of watersupport different faunal associationsthan rivers. The number of kindspresent in a lake may be less than thatfound in a stream because of a moreuniform habitat. A.lake is all pool,
. but a river is ,composed of both pools,and-riffles.° The nonflowing water.of
Jake exhibits a more complete; set-'thug of particulate organic.matter thaFtnaturally supports a higher populationpfdetritus consumers. For these
reasons, the bottom fauna of a lake orimpoundment, or stream pool cannot bedirectly compared with.that.of a flowingstream riffle.
D Extrapolation
How can bottom-dwelling macrofauna databe extrapolated. to other environmentalcomponents? It must be borne in mindthat a component of the total environmentis being sampled. Ifth,e- sampled com-ponent exhibits changes, then SO ^ ust theother interdependent components J1 the Ienvironment. For example, a clean streamwith a wide variety of .desirable bottomorganismel would be expected to have awide variety of degirable bottom fishes,when pollution reduces the number of bottom
' organisms, a comparable reduction wouldbe expected in the number of fishes. More-over, it would be logical to conclude thatany factor that eliminates all bottom otgan-
. isms would eliminate mast other aquaticforms, of life. A clean stream with a widevariety of desirable bottomigi-gamsmswould be expected to permit a variety ofrecreational, municipal and industrtal uses.
E Expression of Data
1 Standing crop and taxonomic compsition
Standing crop and numbers of taxa (typesor kinds) in a community are highlysensitive to environmental perturbationSresulting from the introduction of ,contam-inants. These parameters, particularlystanding crop, may vary Considerably inunpolluted habitats, where t hey may rangefrom the typically high standing crop,oflittoral zones of glacial lakes to thesparse fauna of torrential soft-waterstreams. Thus, it is important thatcomparisons are made only between trulycomparable environments.
99-7-9
to

Eff ct of Wastewi.ter Treatment Plant Effluent on Small Streamst.
2 Diversity
Diversity indices are an additional toolfor measuring_the..quity`of the environ-ment and the effect 'of perturbation onthe structure of a community of macro-invertebrates. Their use is based onthe generally observed phenomenon thatrelatively tmdisturbeenvironmentasupport communities having largenumbers of species with no individualspecies present in overAelmingabundance. If the species in such acommunity are ranked on the basis of
their numerical. abundance, there willbe relatively few species with largenumbers of individuals and largenumbers of species represented by onlya few individuals. Perturbation tendsto reduce diversity by making theenvironment unsuitable for some speciesor by giving other specie§ a competitiveadvantage.
3 Indicator-organism scheme ("rat-tailedmaggot studies'")
1/4
a For this technique, the individualtaxa are classified on the basis oftheir tolerance or intolerance tovarious levels of putrescible wadies'.Taxa are classified according totheir presence or absence ofdifferent environments as deter-mines by field studies. Somereduce data based on the presenceor absence of indicator organismsto a simple numerical form for easein presentation.
b Biolozists are engaging in fruit-less exercise if they intend to makeany decisions about indicatororganisms by operating at thegeneric level of macroinvertebrateidentifications. (Resh and Unzicker)
4 Reference station methods
Comparative or control station methodscompare the qualitative characteristicsof the fauna in clean water habitats withthose of fauna in habitats subject to stress.Stations are compared on the'basis ofrichness of species.
7-10
If adequateoback,ground data are avail-able to an experienced investigator.these techniques can prove quite usefulparticularly for the purpose of demon -'strating the effects of gross to moderateorganic contamination op, the macro -invertebrate community. To detectmore subtle changes in the macroinver-tebrate community, collect quantitativedata on numberp or biomass of organisms.Data on the presence of tolerant andintolerant taxa and "richness of speciesmay be effectively summarized for evalu-ation and presentation by me us of linegraphs, bar graphs, pie diagfams,'histograms, or pictoral diagrams.,
X IMPORTANT ASSOCIATED ANALYSES
A / The Chemical Environment
1 Dissolved oxygen
2 Nutrients
3 Toxic materials
4 Acidity and alkalinity
5 Etc.
B The Physical Environment
1 Suspended solidi;
2 Temperature
3 Light penetration
4 Sediment composition
5 Etc._
XI AREAS IN WHICH BENTHIC STUDIESCAN BEST BE APPLIED a 4 .
.
A Damage Assessment or StrearriHealtii
If a stream is suffering from'abuse thebiota will so indicate. A biologist candetermine damages by looking at the"critter" assemblage ince. Matter ofminutes. Usually, if damages are notfound, it will not be necessary td alertthe remainder of the agency's staff,
Effect of Wastewater Treatment Plant Effluent on Small Streams
.pack all the equipment, pay travel and perdiem, and then wait five days beforeenough data can be assembled to beginevaluation.
B By determining what damages have beendone, the potential cause "list" can bereduced to a, few items for emphasis andthe'entire "wonderful worlds" of scienceand engineering need not be practiced withthe result that much data are discardedlater because they were not applicable tothe problem being investigated.
es
C Good benthic data associated with chemi-ca'physical, and engineering data canbe used to predict the direction of futurechanges and to estimat&4the amount ofpollutants that need to be removed fromthe waterways to make them productiveand useful. once more.
ID The bentiiic macroinvefrtebrates are aneasily used index to steam health thatcitizens inay use in stileam improve-ment programs. "Ad Opt-a-stream"efforts have successfully used simplemacroinvertebrate indices.
E The potential fol. restoring biologicalintegrity in our flowing streams usingmacroinvertebrates has barely beentouched.
REFERENCES0 0
1 Freed, J. ,Randall and Slimak, 'Michael Wt.Biological Indices in Water QualityAssessment. (In The FreshwaterPotomac A a.s.p4.3.tic Communities andEnvironmen Stresses). InterstateCommission on the Potomac RiverBasin., 1978..
r ,
2 Hellawell, J. M., Biological Surveillanceof Rivers. Water Research Center.
'Stevenage and Medenham. 333 pp.1978.
8 Hynes,-1;1. B. N. The Ecology of Running,Waters. Univ. Toronto Press. 1970
4 Mackentliun,,Koll. The Practice of' Water Pollution Biology. FWQA.
281 pp. 1969.
5 Weber, Cornelius I., Biological Fieldand Laboratory Methods for Measuringthe Quality of Surface Waters andEffluents. U. S. Environmental Pro-tection Agency, NERC, Cincinnati,OH . Environmental Monitciring Series670/4.73.001 July 1973
6 Keup, L. E. and Stewart; R. K. Effectsof Pollution on Biota of the Pigeon River , ,
North Carolina and Tennessee. U. S. EPA,National Field Investigations Center. .35 pp.1966. (Reprinted 1973, National Training
Center)
7 Wuhrmann, K., Some Problems andPerspectives in Applied LkrinologyMitt. Internat. Verein Limol. 20.324-402.1974.
8 Armitag, P.-D., Machale, Angelu M., andCrisp, Diane C. A SurVey of StreamInvertebrates in the Cow Green Basin(Upper Teesdale) Before Inundation.Freshwater Biol. 4:369-398. 1974.
9 Resh, Vincent H. and Unzicker, John D.Water Quality Monitoring and AquaticOrganisms: the JWPCF 47:9-19. 1975.
This outline was prepared by Lowell Keup,Chief, Technical Studies B'ranch,Division of Technical Support, EPA,Washington, D. C. 20460, and revised byR. M. Sinclair, NationS1 Training andOperational Technology Center, OWPO,USEPA, Cincinnati, Ohio 45268.
Descriptors: Aquatic Life, Benthos, WaterQuality, Degradation, Ehirironmental Effects,Trophic fevel, Biological Communities,Ecological Distributions
101 7-ll
ME'PHODOLOGY FORE1
AL ANALYSIS OF WATER AND WASTEWATERcH4.
I INTRODUCTION
This outline deals with chemical methods whichare commonly performed in water qualitylaboratories. Although a large number ofconstituents or properties may be of interestto the analyst, many of the methods employedto measure them are based on the same'analytical principles. The purpose of thisoutline is to acquaint yob with t4e principlesinvolved in commonly-used chemical methodsto determine water quality.
II PRE --TR,EAT,MENTS
For some parameters, a preliminary treatmentis required before the analysis begins. Thesetreatments serve various purpose
A Distillation - To isolate the constituent byheating a portion ofthe sample mixture toseparate the more volatile part(s), and thencooling and condensing,the resulting vapor(s)to recover the volatilized portion.
,13 Extraction - To isolate/concentratetheconstituent by shaking a portion of thesample mixture with an immiscible solventin which the constituent is much moresoluble. .
C Filtration - To separate undissolved matter.° from a sample mixture by passing a.portiox!
of it through a filter of specified siies,-Particles .thht are dissolVed in the originalmixture are so small that they ptaS, in thesample solution and pass through the filter.-
D Digestion - To change constituents to a formamenable to the specified test by heating aportion of the sample mixture with chemicals.
III METERS. 1
cP
For some parameters,' meters have beendesigned to measure that specific constituentfor property.
A pH Meters
pH (hydrogen ion concentration) is meas-ured as a difference in potential across aglass membrane which is in contact withthe sample and with a reference solution.The sensor apparatus might be combinedinto one probe or else it is divided into anindicating electrode (for the sample) and areference electrode (for the referencesolution). Before using, the meter mustbe calibrated with a solution of known p(a buffer) and then checked for properqperation with a buffer of a different pHvZue.
, B Dissolved Oxygen Meters
Dissolved oxygen meters measure theproduecttion of a currenwhich is proportionalto the amount of oxygen gas reduced at acathode in the apparatus. The oxygen gasenters the electrode through a membrane,'and an electrolyte solution or gel acts as atransfer and reaction media. Prior to usethe meter must be calibrated against a knownoxygen gas concentration.
. -
G Conductivity .Meters
Specific conductance is measured with ameter containing a Wheatstone bridge whichmeasures the resistazice of the samplesolution td the transmission of an electriccurrent. The meter and cell are calibratedEfccording to the conductance of a standardsolution of potassium chloride measured,at 25°C by a "standard" cell with electrodesone cm Square spaced one cm 'apa.rt. Thisis why results are called "specific" con-.ductance.
D Turbfdimeters
102
A turbidimeter compares the intensity oflight scattered by particles in the sampleunder defined conditions with the intensityof.light 'scattered by a standard referencesuspension. -

Methodology for Chemical. Analysts of Water and Wastewater
IV SPECIFIC ION ELECTRODES
Justas the conventional glass electrodefor pH develops an electrical potential inresponse to the activity of hydrogenclonin solution, the specific. ion electrodedevelops an electrical potential in responseto the activity of the ion for which the electrode-is specific. The potential and activity arerelated according to the Nernst' equation.Siniple analytical technique can be appliedto convert activity to an expression of con-e.,entration. ,
These eleCtrodes are used with a pH meterwith an expanded mV scale or with a specific.ion meter..., Two examples are the ammoniaand fluoride electrodes.
A Ammonia
The ammonia electrode uses a hydrophobicgas-permeable membrane to separate thesample solution from an ammoniuni chlorideinternal solution., Ammonia in the samplediffuses through the membrane and altersthe pH of the internal-solution, which issensed by a pH electrode. The constantlevel of chloride in the internal solution issensed by a chloride selective ion electrodewhich acts as the reference electrode.
B Fluoride ,
The fluoride electrode consists of a lanthanumfl ide crystal. across which a potential isdevel ed by fluoride ions. The cell may berepr ented by Ag/Ag Cl, C1 (0.3), F(0..001)LaF/test solution/SCE/. It is used in con-junction with a standard single junction .reference electrode.
\,V GENERAL ANALYTICAL METHoDS
)
tt---Volumetric.Anslysis
Titrations involve using a buret to measurethe volume of a standard solution of a sub-stance required to completely react withthe constituent of interest in a. measuredvolisme of sample. One can then calculate.the original concentration of the constituent.of intrest.There are various ways to detect the endPoint when,the reaction is complete.
..
1 Color change indicators
The method may utilize an indicator" whichchanges color when the reaction iscomplete. For example, in the Ch'emicalOxygen Demand Test the indicator,ferroin, gives a blue-green color to themixture until the oxidation-reductionreaction is'complete. Then the mixtureis reddish-brown.
Several of these color-change titrationsmake use of the iodometric processwhereby the constituent of interest quan-titatively releases free iodine. Starchis added to give a blue color until enoughreducing agent (sodium thiosulfate or ,
phenylarsine oxide) is added to reactwith all the iodine. At this end point.the mixture becomes colorless.
2 Electrical property indicators ft,
Another way to detect end pointsts'achange in an electrical property of thesolution when the reaction is complete.'In the chlorine titration a cell containingpotassium chloride will produce a ,smalldirect current as long as free Chlorineis present. As a reducing agent (phen-ylarsine oxide) is added to reducethe chlorine, the microammeter whichmeasures the existing direct currentregisters a lower reading on a scale.By observing the scale, the end 'point oftotal reduction of Chlorine can bedetermined because the direct current.ceases.
3 Specified end points
1 93
For acidity and alkalinity titrations, theend points are specified pH values forthe final mixture. The-pH values arethose existing when common acidity oralkalinity components have been neutral-ized. Thus acidity is determined bytithating the sample with a standardalkali to pH 8.2 When carbonic acidwould be neutralized to (HCO3r. Alka-linity (except for highlyacidic samples) .
is determined by titrating the samplewith a standard acid to pH 4.5'wilen thecarbonatepresent has been converted'to carbonic acid. pH meters are used todetect the specified end points.-
Methodology for Chemical Analysis of1Water and Wastewater
B Gravimetric Procedures
Gravimetric methods involve directweighing of the constituent in a container.An empty container is weighed, theconstituent is separated from the samplemixture and isolated in the container, thenthe container with thQ constituent is weighed.The difference in the weights of, the containerbefore and after containing the constituentrepresents the weight of the constituent.
The type of container depends on the methodused to separate the constituent from thesample mixture. In the solids determinations,the container is an evaporating dish (total ordissolved) or a glass fiber filter disc in acrucible (suspended). For oil and grease,the-container is a flask containing a residueafter evaporation of a. solvent.
C Combustion
Combustion means to add oxygen. In.theTotal Organic Carbon.Analysis, combustionis used within an instrument to convertcarbonaceous material to carbon dioxide.An infrared analyzer measures the carbondioxide.
PHOTOMETRIC METHODS
I 'These methods involve the measurement of lightthat is absorbed or transmitted quantitativelyeither by the constituent of interest or else bya substance containing the constituent of interestwhich has resulted from some treatment ofthe sample. The quantitative aspect of thesepixotometric methods is based on applying theLa Thert-Beer Law which established that theamount of light absorbed is quantitativelyrelated to the concentration of theiabsorbing
Imedium at a given wavelength and a giventhickness of the medium through which the
; light passes. .
Each method requires preparing a set ofstandard solutions containing known .amountsof &e constituent of interest. Photometricvalues are obtained for the standards. Theseare used to draw a calibration (standard) curveby plotting photometric values against theconcentrations. Then, by locating the photo-metric value for the sample on this standardcurve, the unknown concentration in thesample can be determined.
0 rf%.
.04
,...
A Atomic Absorption_<
.Atomic Absorption (AA) instruments utilizeabsorption of light of a characteristic wave-length. This form of analysis involvesaspiratinesolutions of metal ions (cations)or molecules containing metals into aflame where they are reduced to individualatoms in a grouiid electrical state. In thiscondition, the atoms can absarb radiationof a wavelength characteristic for eachelement. A lamp containing the element-of-------interest as the cathode id used as a sourceto emit the characteristic line spectrum forthe element to be determined.
The amount of energy absorbed is directhrelated to the concentration of the.elemepof interest. Thus the Lambert-Beer Lawapplies. Standards can be prepared andtested and the resulting absorbance valuescan be used to construct a calibration(standard) curve. Then the absorbancevalue.forithe sample is located on this curveto determine the corresponding concenti anon.
Once the instrument is adju'sted to giveoptimum readings for the element of interest,the t6sting of each solution can be done ina matter of seconds. Many laboratorieswire recorders into their instruments torapidly transcribe the data, thus conservingtime spent on this aspect of the analysis.Atomic absorption techniques are generallybad for.metals and semi-metals in solutionoPelse solubilized through.some form ofsample processing. For mercury, the .
principle is utilized but the absorption oflight occurs in a. nameless situation with,/the mercury in the vapor state and containedin a closed glass cell.
-B Flame Emission
Flame emission photometry involvesmeasuring the amount of light given off byatoms drawn into a flame. At certaintemperatures, the flame raises the electronsin atoms to a higher energy leVel. Whenthe electrons fall back to a lower'energylevel, ,the atoms lose (emit) radiant energywhich can be detected and measured.
Again standards must be,prepared andtested to prepare a calibration (standard) -curve. Then the transmission value of thesample can be located on the curve todetermine its concentration.Many atomic absorption instruments can beused for flame emission photometry.Sodium and potassium are very effectivelydetermined by the emission technique. '
-t 8-3

Methodology for Chemical Analysis of Water and Wastewater
However, for many elements. absorptionanalysis is more sensitive because there are,a great number of unexcited atoms in theflame which are available to absorb theradiant energy. .
C Colorimetry
Colorimetric analyses involve treatingstandards which contain known Concentrationsof die constituent of interest and also thesample with reagents to produce a coloredsolution. The greater the concentration ofthe constituent, the more intense will bethe resulting color.
The Lambert-Beer Law which relates theabsorption of light to the thickness andconcentration of the absorbing mediumapplies. Accordingly, aspectrophotometeris used to measure the' amount of light ofappropriate wavelength which is absorbedby the same thickness of .each solution.The results from the standards are used tOconstruct a calibratiob (standard) curve.(Then the absorbance value for,the sampleis locate'd.on this curve to determine thecorr'esp8ncling concentration.
Many of the metals and several otherparameters (phosphorus, ammonia, nitrate,nitrite, etc. ) are determined in thismanner.
vu GA5-LIQUID CHROMATOGRAPHY
Chromatography techniques involve a Separa-tion of components in a mixture by usinga difference in the physical properties oT thecomponents. Gas-Liquid Chromatography(GLC) involves separation based on a differ-ence in the properties of volatility and solu-bility. The method is used to determinealgicides, chlorinated organic compoundsand pesticides.
The sample is introduced into an injectorblock which is at a high temperature (e. g.210°C), "causing the liquid sample to volatilize.An inert carrier, gas transports the samplecomponents through a liquid held in place asa Thin film on an inert solid support materialin a column.
Sample components pass through the columnat a speed partly governed by the relativesolubility of each in the stationary liquid.Thus the least soluble components are thefirst to reach the detector. The type ofdetector used depends on the class of compoundsinvolved. All detectors function to sense andmeasure the quantity of each .sample componentas it Come-if the column. The detectorsignals a recorder system which registersa response.
As with other instrumental methods, standardswith known concentrations of the substance ofinterest are measured on the instrument. Acalibration (standard) curve can be developedand the concentration in a sample canbedetermined from this graph.
Gas-liquid chromatography methods are verysensitive (nanogrami, picogram quantities) soonly small amounts of samples are required.On the other.hand, this extreme sensitivityoften necessitates extensive clean-up ofsamples prior to GL!C analysis.
A
VIII AUTOMATED METHODS
The increasing number of samples andmeasurements to be made in water qualitylaboratories has stimulated efforts to automatethese analyses, Using smaller amounts ofsample (senii-micrb techniques), combiningreagents for fewer measurements per analysis.and using automatic dispensers are all meansof saving analytical time.However, the term "automated laboratoryprocedures" usually means automatic intro-duction of the sample into the. instrument,automatic-treatment of the sample to test fora component of interest; automatic recordingof data and, increasingly, automatic calculatingand print-out of data. Maximum automationsystems involve continuous sampling directfrom the source (e. g. an in-place probe) withtelemetering of results to a central computer.Automatpd methods, especially ose based oncolorimetric methodology, are re ognized forseveral water quality parameters eluding)alkalinity, ammonia, nitrate, nitrite, phosphorus,and hardness.
105

Methodology Sr Chemical Analysis of Water and Wastewater
IX SOURCES OF PROCEDURESDetails of the prOceduee for an individualmeasurement can be found in reference books.
. A,There are three particularly-recognized booksof procedures for water quality measurements.
A S dard Methods(1)The erican Public Health Associatior4the A erica* Water Works Associationand the Water Pollution Control Federationprepare and publish "Standard Methods forthe Examination of Water and Wastewater."As indicatenylhe.list of publishers, thisbook contains methods developed for use bythose interested in water or wastewater('treatment.
B IISTM Standards(2)
The American Society for Testing andMaterials publishes an "Annual Book ofASTM Standards" containing specificationsand methods for testing materials. The"book" currently consists of 47 parts.The part applicable to water was formerlyPart 23.. It is now Part 31) Water.
The methods are chOsen by approval of themembership of ASTM and are intended toaid industry, government agencie4 and thegeneral public. Methods are applicable toindustrial waste waters as well as to othertypes of water samples.
C EPA Methods Manual(3)
The Unit d States Environmental ProtectionAgency pu lishes a manual of "Methods forChemical alysis of Water and Wastes. ".
PA developed this 'manual to providemethodology for mdhitoring the quality ofour Nation's waters and to determine theimpact of waste discharges. The test pro-cedures were carefully selected to meetthehe needs, using Standard Methods and
4, ASTM as 'c references., In many cases,the EP man ;- ntains completelyde ed procedures because they modified
ethods from the basic references. Merl.ise, the manual cites, page numbers in
th two referenCes where the analytical,proc dures can be found.
1064
I
X ACCURACY .AND PRECISION
A Of the Method
One of the criteria for choosing methodsto be used for water quality analysis is thatthe method should measure the desiredproperty or constituent with precision,accuracy, and specificity sufficient to meetdata needs. Standard references, then.include a stattment of the precision andaccuracy for the method which is obtainedwhbn (usually) several analysts in differentlaboratories used the particular 'method.
B Of the Analyst
Each analyst should check his own pr e( isiunand accuracy as a.test of his skill it per-forming a test. According to'the l . S. EPAHandbook for Analytical Quality Control"),he can do this in the following manner.
To check precision, the analyst shouldanalyze samples with four differentconcentrations of the constituent of interest.seven times each. The study should coverat least two hours of normal laborato roperations to allow changes in conditionsto affect the results. Then he shouldcalculate the standard deviation of each ofthe sets of seven results and compare hisvalues for the lowest and highest concen-trations tested with the standard deviation,value publighed for that method in the reference
book. (It may be stated as % relativestandard -deviation. If so, calculateresults in this form. )' An individualshould have better values than those
. averaged from the work of severalanalysts.
Tp check accuracy, he can use two of thesamples usecl to check precision by addinga..known amount (spike) of the particular-constituent in quantities to double the lowestconcentration used, and to bring an inter-mediate concentration to approximately '75%
of the upper limit of application of themethod. He then analyzes' each of the spikedsamples seven Units, then calCulates theaverage of each set of even results. Tocalculate accuracy in t ms of % recovery, t
he will also need to calc late the average of
R

Methodology for Chemical A nalysis of Water and WAstewater
a
the results he got ,vheri,he analyzed theunspiked samples, (background). Then:
.r,
observed - backgroundx 100
ao
A IDES Permits and StateCertiftt ations
A specified analytical procedure must beused when a waste constituent Is measured
1 For an application for a National PollutantDischarge,Elimination System tNPDES)permit under Section 402 of the FederalWater Pollution Control Act (FVv I-)1as amended.
-,2 For reports required to be submitte. h\
dischargers under NPDES..
3 For certlfica ons issued by atatespursuant to.S ction'401 of the FW 11( \.as amended.
% Recovery = spike[
The actual calculation involves volume-.concentration calculations for each term.
If the published accuracy is stated as% bias, subtract 100% from % recoveryto compare results. Again, the individualresult should e better than the published,figure deriv m the results of severalanalysts.
C Of Daily Performance
Even after an analyst has demonstrated *ispersonal skill performing the analysis,a daily cheek 0. precision and accuracyshould be done, About one in every tensamples should be a duplicate to check,precision and about one in every ten samplesshould be spiked to 'chick accuracy.
Itis also beneficial lo participate in inter-laboratory quality control programs. The
a U.S. EPA provides reference samples atno charge to laboratories. These samplesserve as independent checks on reagents,instruments or techniques; for traininganalysts or for Comparative analyses withinthe laboratory. There is no certificationor other formal evaluative function resultingfrom their use.
'XI SELECTION OF ANALYTICAL\ PROCEDURES_\
Standai'd sources(f. 2.3) will, for mostparameters, contain more than one analyticalprocedure. Selection of the procedure to beused in a specific instance involves consider -
ation of the,use to be made of the data. Insome cases, one must use specified procedures:In others, one may be able to chooe amongseveral^ methods.
a
Ore'
8-6
Analytical procedures to be used in thesesituations must conform to those specifiedin Title 40,,Chapter 1, Part 136, of theCode of Federal Regulations TCFR).-:Thelistings in the CFR usually cite two differentproceelires for a particular measurement..The CPR also provides a system ofapplying to EPA for permission touse methods not cited, in the CFR.. \k
Approval of alternative methods fornationwide use will`be publishedthe Federal Register.
B Ambient Water Quality Monit6
For Ambient Water Quality M toring,,-*analytical procedures have not been
tpecified by regulations. However, the.delection of procedures to be used shouldreceive attention. Use of those listed inthe CFR is strongly recommended. Ifany of the data obtained is going to, be USetin connection with NPDES permits, or ma\be used as evidence,in a legal proceeding,,use of procedures listed in the CFR isagain' strongly recommended.
o7
e
.
II
.
C. Drinking Water Monitoring. .
In December, 1975, National Interim}X^imay'DAnking Water Regulations
4 . to be 'effective June 24, 1977 werepublished in the Federal Register inTitle '40, Chapter 1, Subchapter D,Part 141. The.publication includesOecification of analytical proceduresto be used when determining compliancewith the maximum contaminant levelks
t ,of required parameters.
Methodology for Chemical Analysis of Water and Wastewater
Because of the low concentrations in-volved in the regulations, there is oftenjust one analytical method cited for-each parameter.
Individuals or organizations may applyto EPA for permission to use methodsnot cited in the above. Approval ofalternative methods for nationwide usewill.be prlished in the Federal Register.
PIEyD KITS
; Field kits have been deVised to performanalyses outside of the laboratoy. The kitmay contain equipment and reagents for onlyooe tet.or for a variety of meaprements.",It may be purchased 'c put together by anagency to seryt its particular needS.
Since Such-kits are devised for performingtests with minimum time and maximumsimplicity; the types of labware and reagentsemployed usually differ significantly frOm theequipment and supplies used to perform thesame measurement In alalaoratory.
A Shortcomings1
Field conditions do not accommodate theequipment and service's required for pre-treatments like abd digestion.
or is it practical to c ry and use calibrated.glassware like burets and volumetric pipets.Other problems are preparation, transportand storage of high quality reagents, :ofextea.supplies required to test for and removesample interferences before making themeasurement,, and of .nstriiMents which
are very sensitive in detecting particularconstituents. One just cannot carry and'set up laboratory facilities in the field whichare etiuivalent to stationary analyticalfacilities.
B Uses, J.Even though the results of firi tests are _
usually not as accurate and precise as those_performed in. the laboratory, such tests dohave "a place in water quality program's.
In situations where only an estina to of theconcentrations of various constituents is .
required, field tests serve well. They areinvaluable sources of information forplanning a full-scale sampling/testingprogr nrwhen decisions must be madere ing location of, sampling sites,schedu o pie collection, dilution ofsamples equired for analysis, and treat-ment,o samples required to remove inter-
- /7feren es to Analyses...
'C KPDES Permits and State Certificationft .
Kit meths are not app roved for obtamints,,j,_
data required for NPDES Permits or Stateconstruction certifications. If one judges
'that such a method is justifiable for these. ; .purposes,' he must apply to EPA for per-
mission to use ft..1,4L
',5. DrinkingWater Monitoring'1
,The DPD test kit for rksidual chlorine isapproved in the Deceniber. 1975 FederalRegister for monitoring: drinking water
An cases where chlorine tests are sub-stitutes for microbiological tests.
-1 08-7 .
(

Methodology for Chemical Analysis of Water and Wastewater
REFgRENtES
1 Standard Methodp for the-Examination of- Water and Wastewater. 14th Edition.
197,6. APHA-AWWA-WPCF, 1015 18th Street,N. W.. Washington, D. C. 20038
2 0.1975 Annual Book of ASTM Standards,Part 31, Water. ASTM, 1916 Race Street,Philadelphia, PA 19103. '4
3 Methgds for Chemical Analysis of Water.and Wastes. 1979, U. S. EPA, EMSL,Cincinnati, OH. 45268.,
4 Handbook for Analytical Quality Control'° in Water and Wastewater Laboratories,
1972. U. S. EPA, EMSL, Cincinnati.Ohio 45268.
This outline was prepare& by Audrey Kroner,Clie10.st, National Training and OperationalTe6hnol4gy Center, OWPO, U. S. El?A.,Cincinnati, Ohio 45268.
Descriptors: Analysis, Chemkal Analysis,MethodolOgy, Wastewater, Water Analysii3
ti
a-8
of
0
4
c
1o9
.
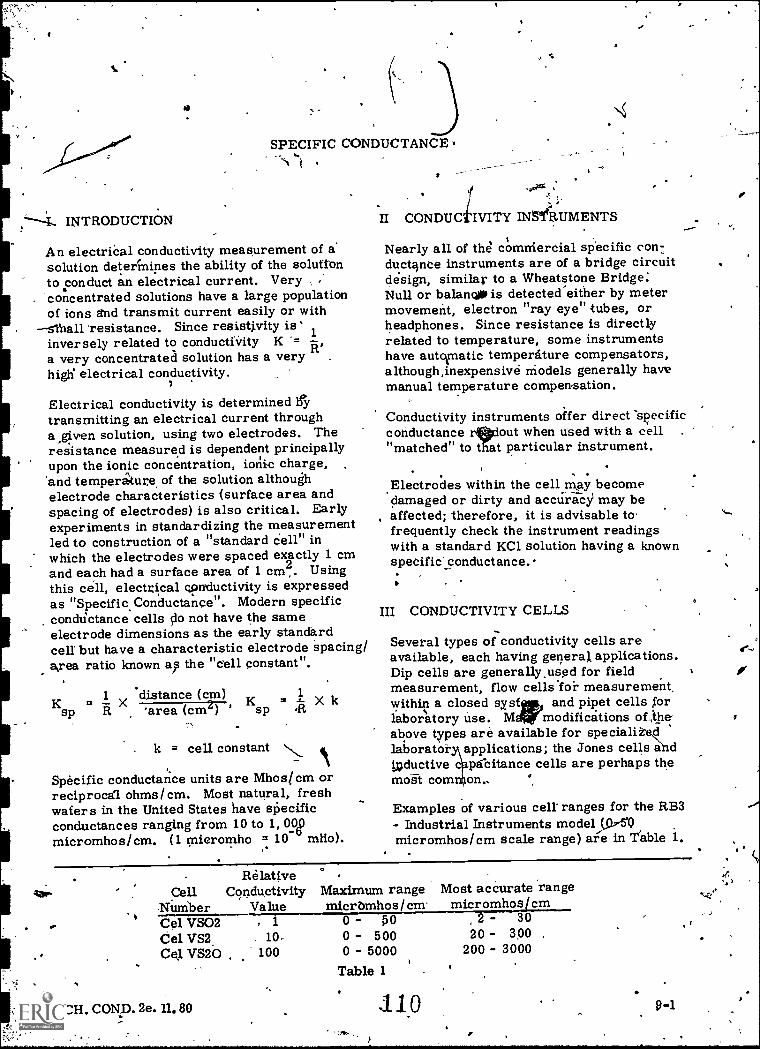
INTRODUCTION
SPECIFIC CONDUCTANCE.
An electriCal conductivity measurement of asolution determines the ability of the solutionto conduct an electrical current. Very
. concentrated solutions have a large populationof ions and transmit current easily or with
`resistance. Since resistivity is'inversely related to conductivity Ka very concentrated solution has a very .
high electrical conductivity.
Electrical conductivity is determined eytransmitting an electrical current througha ,given solution, using two electrodes. Theresistance measured is dependent principallyupon the ionic concentration, ionic charge,'and temperature of the solution althoughelectrode characteristics (surface area andspacing of electrodes) is also critical. Earlyexperiments in standardizing the measurementled to construction of a "standard Cell" inwhich the electrodes were spaced exactly 1 cm
2and each had a surface area of 1 cm,. Usingthis cell, electrical conductivity is expressedas "Specific, Conductance ". Modern specificcondiictance cells do not have the sameelectrode dimensions as the early standardcell' but have a characteristic electrode spacing/area ratio known ap the "cell constant".
K = X1 distance (cm)
sp 'area (cm2) '1
KspX k
k = cell constant
Specific conductance units are Mhos(cm orreciprocal. ohms/cm. Most natural, freshwafers in the United States have specificconductances ranging from 10 to 1, 0%)micromhos/cm. (1 mieromho = 10 mHo).
11 CONDUC IVITY INS'eli:UMENTS
Nearly all of the commercial specific con:ductance instruments are of a bridge circuitdesign, similar to a Wheatstone Bridge:Null or balano. is detected either by metermovement, electron "ray eye" tubes, orheadphones. Since resistance is directlyrelated to temperature, some instrumentshave autotmatic temperature compensators,although,inexpensive models generally havemanual temperature compensation.
Conductivity instruments offer direct -specificconductance rout when used with a cell .
"matched" to that particular instrument.
. , .Electrodes within the cell may become-damaged or dirty and accuracy may be
, affected; therefore, it is advisable tofrequently check the instrument readingswith a standard KC1 solution having a knownspecific' conductance.
III CONDUCTIVITY CELLS
Several types of conductivity cells areavailable, each having genera), applications.Dip cells are generally,used for fieldmeasurement, flow cells'foi- measurement,within a closed syst and pipet cells forfaborltory use. M modifications of,the'above types are available for speciali dlaborator applications; the Jones cells a diDductive pecitance cells are perhaps themost com on.,
Examples of various cell' ranges for the RB3- Industrial Instruments modelQmicromhos/cm scale range) are in table 1.
e
RelativeCell Conductivity
Number ValueCel VS02Cel VS2 10,Cel VS20 100
Maximum rangemicrbmhos / cm.
0 - 500 - 5000 - 5000
Table 1
Most accurate rangemicromhos/cm
2 - 3020 - 300 .
200 - 3000
I.

Specific Conductance
IV Computation of Calibration Constant
A calibration constant is a factor by whichscale readings must be multiplied to, com-pute specific conductance.'
Propertied of some inorganic ions in regardto electrical conductivity are shown below:-.--
micromhos/ cmper me11/1_, conc.
tiIon
7 CalciumKsp = cM Magnesium
where Km.sp = actual spesific cohductance SodiumPotassium
c = calibration constSant BicarbonateCarbonate
M = meter reading Chloride
For example, a 0.,001 N KC1 solution-(147 micromhos / cm standard) may showa scale reading of 147. - ,
147147 =, c 147, c = = 1.00147
In this case the cell is perfectly4"matched"to the instrument, the calibration constantis 1.00, and the Scale reading represents ,r)actual specific conductance. A variety ofcells, each covering a specific range,may be Used with any one instrument:However, a calibration constant for eachcell must be computed before solutions ofunknown specific.conduciance can bedetermined.
V RELATIONSHIP OF SPECIFIC GON1-DUCTANCE TO IONICNCONCENTRATION
Natural water consists of 'many chemic'alconstituents, each of which may differ,widely inIonic size, mobility, and solubility.Also, total constituent concentration andproportion's of certain ions in various naturalwaters range considerably. However,is surprising that for most natural wat rshaving less than 2, 000 mg/ L. diSSolv d
. solids, dissolved solids values are clgselyrelated to.specific conductance values,ranging In a ratio of .62 to .70. 'Of coursethis does not hold true for certain watershaving considerable amounts of nonionizedsoluble materials.; such as organic com-pounds and nonionized, colloidal inorganics.
52.046.648.972.043.684.675.9
VI ESTIMATION OF CONSTITUENTCONCENTRATIONS
Generally speaking, for waters having adissolved solids concentration of less than1, 000 mg/ L, calcium and magnesiumItotalhardness), sodium, bicarbonate andcarbonate (total alkalinity), and sulfate arethe principal or most abundant ions,representing perhaps,90-99% of the totalionic concentration of the water. Specificconductance, total hardness and totalalkalinity are all simple and expedientmeasurements which can be performed inthe field. Therefbre, the remaining principalions are sodium and sulfate, and concentrationsof these can be estimated by empirical.methods. For example, we find that a certainwater has:
Ksp u 500 micromhos/cmTotal Hardness u 160 mg/ L or 3.20 meq/LTotal.Alkalinity =200,mg/L or 3.28 meq/L,as bicarbonate.
Next we multiply the specific conductance by*0.61'1 (500 X 0.011 = 5.50) to estimate thetotal ionic concentration in met) /L.
* This factor may vary slightly fordifferent waters
4 Cations (meq/ Anions (meq/L)
Calcium 3, 20 Carbonate 0.00Magnesium Bicarbonate 3.28Sodium 5. 50-3.20iss 2.30 Sulfate 5.50-3.28 * 2.22Total Cations 5.50 Total Anions 5. 50 ,
................

Specific Conductance
Realizing that'several variables'are involvedin empirical analysis, application restsentirely upon testing the formula with previouscomplete laboratory analyses for thatparticular water. If correlation is withinacceptable limits, analytical costs, may besubstantially reduced. Empirical analysiscan also be used in determination of properaliquots (dilution factor) necessary forlaboratory analysis.
Records of laboratory chemical analysis may'indicate that a particular stream or lakeshows a characteristN response to variousstreamflow rates or lake water leirels. Ifthe water's environment has not been alteredand water composition responds solely tonatural causes, a specific conductivitymeasurement may-be occasionally used insubstitution far laboratory analyses todetermine water quality. Concentration ofindividual,constituents can thus be estimatedfrom a specific conductance value.
VII APPLICATIONS FOR SPECIFIC/(:CONDUCTANCE MEASUREMENTS
).A Laboratory Rperations( 2
1 Checking purity of distilled and de-ionized water
2 Estimation of dilution factors forsamples
3 Quality control check ori analyticalaccuracy
4 An electrical indicator
B Agriculture
1, Evaluating salinity1
2 'Estimating-Sodium Adsorption tio
C Industry(3)
1 Estimating corrosivenesssteam boilers
2 Efficiency check of boiler
of water in
operation-.
D-st
1 Stratigraphic identification andcharacterization
a geological mappingb oil explorations'.
E Oceanography
1 Mapping ocean currents
"2 Estuary studies
F ,Hy rology
1 Locat g new water supplis
o,
ab
uried stream channels (See Fig. 1) ,
springs in lakes andstreams (See Fig. 2)-
2;,,
Detection and regulation of seaencroachment on shore wells
..G ..Water Quality Studies
water
1 Estimation of dissolved solids(2)
(See Section V, also Fig. 3)
2 "Empirical analysis of constituentconcentrations (See Section VI, alsoreference 2)
1\3 Quality control check for salt water
conversion studies -1
112
4 Determination of mixing efficiencyof streams (4e Fig. 4)
Determination of flow pattern ofpolluted currents (See Fig. 4)
'B Identification of significant fluctuations'in'industrial wastewater effluents. .
7 Signal of significant changes in thecomposition of influents to wastetreatment plants

Specific Conductance
( A
I
FIGURE 1
DETECTION OF tURIED STREAM CHANNELS
TEST WELLS
FIGURE 2
XSECT
DETECTION OF SPRINGS IN LAKES AND STREAMS
%.0
MAN LOWERINGCONDUCTIVITY CELL
LAND SURFACE
d LAKE OR RIVER
-113
0
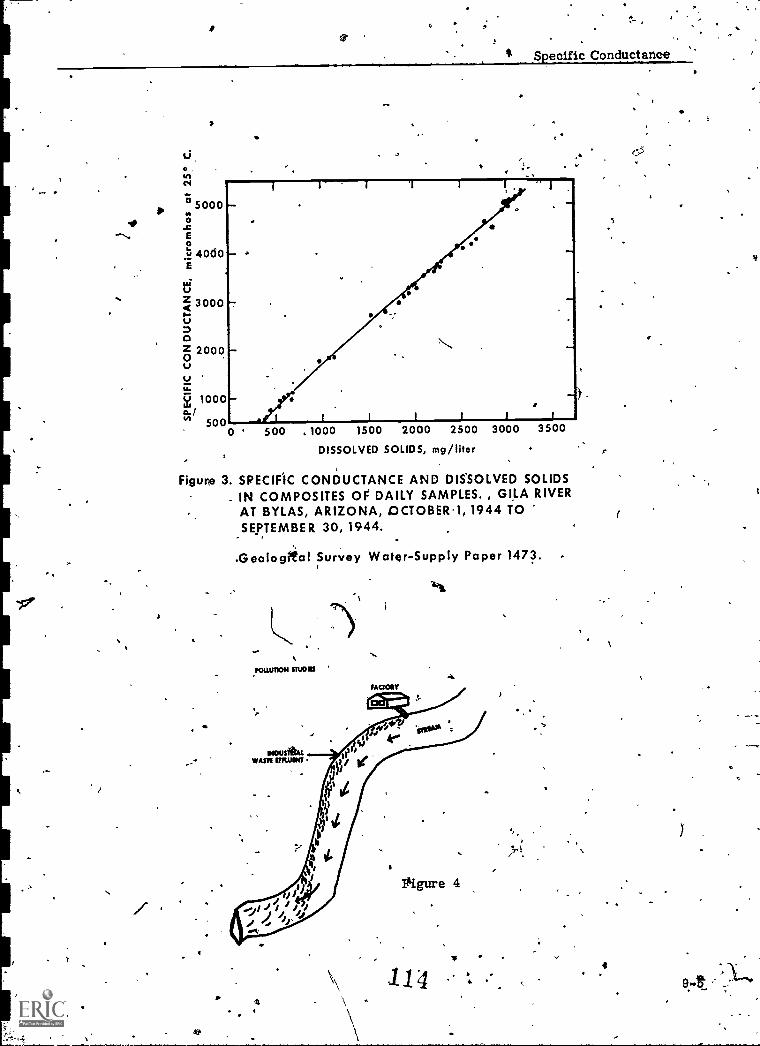
O 5000
4 .c
2 4040E
Z 3000
a2000
u.
R- 1000ct./
500 1 1 1 1 1
0 ' 500 .1000 1500 2000 2500 3000 3500
Specific Conductance
DISSOLVED SOLIDS, mg/liter
Figure 3. SPECIFIC CONDUCTANCE AND DISSOLVED SOLIDS- IN COMPOSITES OF DAILY SAMPLES. , GILA RIVER
AT BYLAS, ARIZONA, OCTOBER1,1944 TOSEPTEMBER 30,1944.
Geologrial Survey Water-Supply Paper 1473.
14
..,POLLUTION STOOKS
MCFOIT
114I
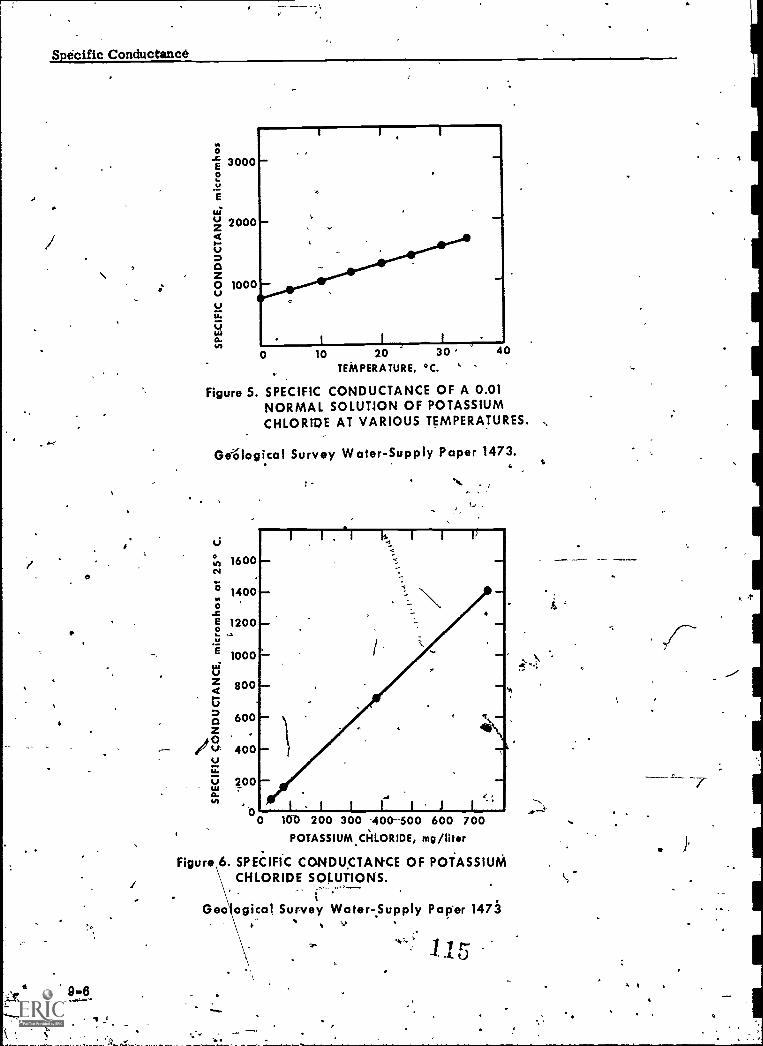
Specific Conductance
0
1
/
e
0"`E 30000U
E
vz 2000
14.
O
o 1000VV
0.ct.
0 10 20 30'TEMPERATURE, °C.
40
Figure 5. SPECIFIC CONDUCTANCE OF A 0.01NORMAL SOLUTION OF POTASSIUMCHLORIDE AT VARIOUS TEMPERATURES.
Geitlogical Survey Water-Supply Paper 1473.
V
Zest 1600
1400o
..cE 12002
1000uiV
800
600z
400VU.
U 200
,
fo
200 300 400-500 600 700POTASSIUM CHLORIDE, mg/liter
Figure 6. SPECIFIC CONDUCTANCE OF POTASSIUMCHLORIDE SOLUTIONS.
Geological Survey Water-Supply Paper 1473Y
t)r-
P
Hr
Specific Conductance
- sVIII NPDES METHODOLOGY
A: The Federal Register "List of ApprovedTest ProcedUres" for NPDES require -ments :specifies that specific conductancebe measured with a self-containedconluctivity meter, Wheatstone bridgetypeil) (2) (3)
Temperature directly affects specificconductance values (see Fig. 5). Forthis reason, samples- should preferablybe analyzed at 25 C. If not, temperaturecorrections Should be made and resultsreported as utinhos/cra at 25°C.
J1 The instrument should be standardized
using KCl solutions. (See Fig. 6)
2 It is essential to keep the conductivitycell clean.
B The EPA manual specifies using theprocedure as described in Stand .rd
Methods(2)
- or in ASTM Standards(3).
These are approved in 40 CFR136 forNPDES Report purposes.
C Precision and Accuracy(1)
Forty-one analysts in 17 laboratoriesanalyzed 6 synthetic water samplescontaining the following Ksp increments
of inorganic salts:/-100, 106. 808, 848,1640 and 1710 micromhos/cm.
1'
N.,
a
1.
The standard deviation of the reportedvalues was 7:55, 8. 14, 66.1, 79. 6,106 and 119 1.4711h08/ cm 'respectively.
The accuracy of the .reported values was-2.0. - , -29.3, -38.5, -87. 9 and
. hos/cmbias respectively.
REFERENCES
1 'Methods for ChemiCal Analysis' of Water. .
and Wastes, EPA-AQCL, Cincipnati,Ohio 45268, 1974.
. ,
2 Standard Methods for the Examination*of Water and, Wastewater,' APHA-AWWA-
o WPCF, '14th Edition. 1976.
3 ASTM Annual Book of Standards, Part1975.
This outline Was prepared by John R. Tilstra,Chemist, National Eutrophieation ResearchProgram, Cdrvallis. Oregon with additionsby Audrey D. Kroner, Chemist, NationalTraining and Operational Technology Center,
USEPA, Cincinnati, Ohio 45268.
Descriptors: Chemic-al Analysis, Concenthtion,Conductivity. Dissolved. Solids, ElectricalConductance, Ions, Physical Properties, Salinity,Sodium, Specific Conductivity, Sulfates, WaterAnalysis, Water Supplies.
a
t.
9.7
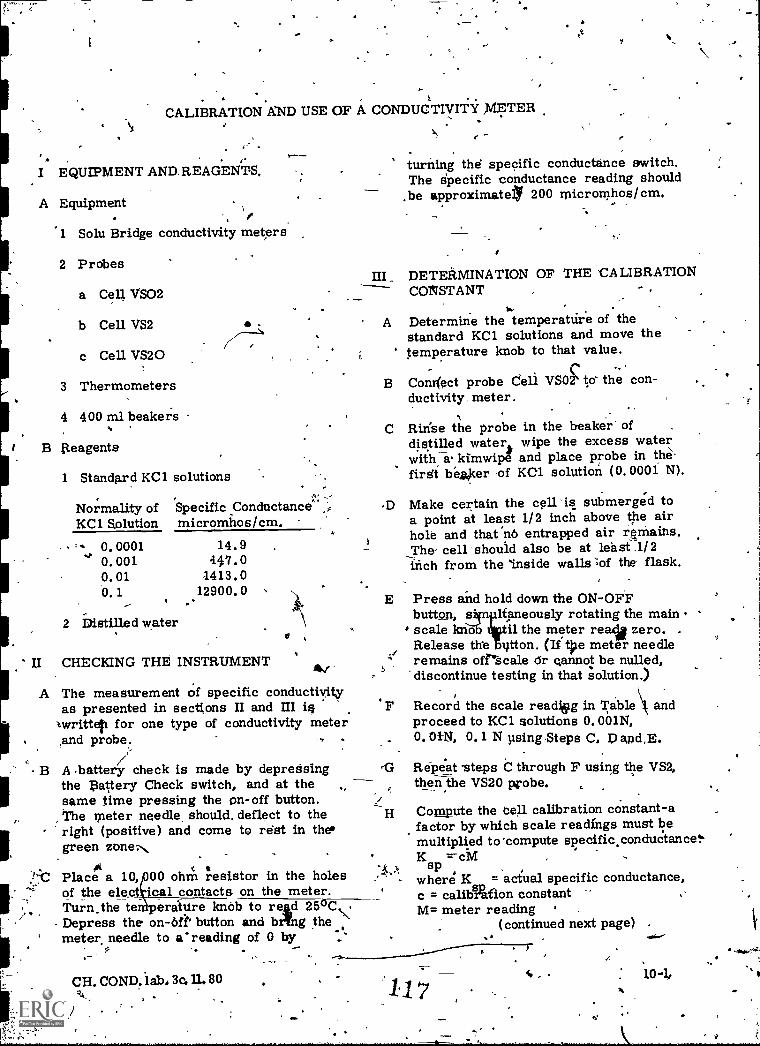
.CALIBRATION AND USE OF A CONDUCTIVITY PIETER
. ,I EQUIPMENT AND. REAGENTS,
A EquipmentI
1 So lu Bridge conductivity meters
2 Probes
a Cell VSO2,
b Cell VS2
c Cell VS2O
3 Thermometers
4 400 ml beakers
B _Reagents
1 Standard KC1 solutions
Normality of Specific Conductance;:';;KC1 Solution micromhos /cm.
turning the specific conductance switch.The Specific conductance reading should
.be approximate/ 200 micrornhos/cm,
DETERMINATION OF THE 'CALIBRATIONCONSTANT
A Determine the temperature of thestandard KC1 solutions and move thetemperature knob to that value.
.,
B Conr(ect probe Cell VSO` to the con-ductivity. meter.
C Ririse the probe in the beaker ofdistilled waters wipe the excess waterwith a kimwipe and place probe in the'firEit beer of KC1 solution (0.0001 N).
D Make certain the cell is submerged toa point at least 1/2 inch above the airhole and that no entrapped air remains.The cell should also be at least :1/2inch from the 'inside walls ''of the flask.
0.0001 14.9' 0.001 447.00.01 1413.00.1 12900.0
E
2 Distilled water6
' II CHECKING THE INSTRUMENT
A The measurement of specific conductivityas presented in sections II and III is.
Iwrittep for one type of conductivity meter'and probe.
B A battery check is made by depredsingthe Pottery Check switch, and at thesame time pressing the on-off button.The meter needle, should. deflect to theright (positive) and come to rest in thegreen zone
Place a 10, 00 ohn'l resistor in the holesof the el ical contacts on the meter.
Press and hold down the ON-OFFbutton, s4n lteneously rotating the mainscale knob it the meter resit zero. .
Release tie iitton. (If tite meter needleremains off scale Or cannot be nulled,discontinue testing in that solution.)
F Record the scale readier g in Table '; andproceed to KCI. solutions 0.001N,0.01N, 0.1 N psingSteps C D4hd,E.
Repeat 'steps C through F using the VS2,thenthe VS20 probe. ,
Compute the cell calibration constant-afactor by which scale readings must bemultiplied to 'compute specific conductance?Kspwhere K = actual specific conductance,c = colligation constantM= meter reading
(continued next page) ,
rG
Turn.the to eralttre knob to re d 250CDepress the on-oft button and bring themeter, needle to a'reading of 0 by
CH. COND. lab. 3c. U. 80
H
11
aro-
10-10

Calibration and Use of a Condu
CellNumbCellCellCell
vity Meter
_ RelativeConductivity. Maximum range
r Value micro-mhos/cmSO2 1 0 - 50
S2 10
1000 -5000 - 000
r-
20
Most accurate rangemicromhos cm
2 - 3020 ` 300
/00 -,3000
TA131,2,1, DATA FOR CALIBRAT4ON ONSTANTS .Probe cell VS02 ee-11 VS2 ' Cell vs20
HC1Solutions 0.0001N 0.001N 0.01N 0.1N 0.0001N O. 0Q1N .0. OIN. 0. IN 0.0001N 0.021N, 9. 01N 0. IN
, Test 0.1
. o 1..r, ''.
It
tellConstant ,
0,
For-eacli cell, calculate the cell constantby using the meter reading closest to the400 - 600 range. The known specific
nductance forthe corresponding KCA,so utibn can be found in IB Reagents. Recordthe cell constants on Table I.
S
IV DETERMINATION OF K sp FOR SAMPLES
Obtain meter readings, M, for samplesA, B and C using Section III C, D and E.Record M in Table 2. See Table I forthe appropriate cell constant, c, tocalculate Ksio for each sample where
sp ..-cM. Record results in Table 2.
V EPA METHODOLOGY
'. The current EPA Manual(1) specifiesusing the procedures found in References2 and 3, These procedures have beenadapted for this laboratory session andall 'are aprroved in 40CFR136 for NPDESreport purposes.
TABLE 2. SPECIFIC
er,
ACKNOWLEDGMENT
This outline containsecektain portions ofprevious outline's by Measrq. J. W. Mandia,and J. °R. Tilstra.
REFERENCES,
1 Methods for Chemical Analysis ofWatei.and Wastes, USEPA, AQCL,Cincinnati, OH 45268,' 1974. '
2 Standard Methods for the ExaminO.tiorof Water and Wastewater, 14thEdition. 1976.
3 Book of A`STM Standards, Part 31, 1975.
This outlinePwas prepared by C. R. Feldmann,Chemist, National Training and OperatiohalTechnologY Center, and revised by Audrey D.Kroner, also with National Training andOperational Technology Center, OWPO,LTSEPA, Cincinnati; Ohio 452681
Descriptors! Analytical TechniqueE4 _c,'orductivity,Electrical Conductance, Specific Conductivity,Water Analysis.
CONDUCTIVITY TESTS
Sample A..
-B
.C r
Probe CellVS02
CellliS2
CellVS2O
CellVS02
CellVS2
CellVS2O
Cell .VS02
Cell.VS2
CellVS2O
., *if*
,4.
.
,_ .. ---7- .
i .
. .,
.
-
..
Cell .Cooatant
,.
- ..
Sp. Cond.of:Mos/cm
. ..
-
104
.1
4. a
DISSOLVED OXYGENDETERMINATION BY ELECTRONIC MEASUREMENT
I INTRODUCTION
A glectronic measurement of DO is attractivefor several reasons:
1 Electronic methods are more readily ,
' adaptable for automated analysis, con-tinuous recording, remote tensing orportability.
2 Appli cation of electronic methods withmembrane protection of sensors affordsa high degree of interferenCe control.
3 Versatility of the electronic systempermits design for a particular measure-ment, situation or use.
4 Many more determinations per man-hour are possible with a minor expend-iture of time for calibration.
Electronic methods of analysis imposecertain restrictions upon the analyst toinsure that the response does,' in fact, tindicate the item sought.
k
1 The ease of reading the indicator tendsto pro, e a false sense of security.Frequent and careful calibrations areessential to establish workability of theapparatus and validity of its response..
2 The use of electronic devices requires'a greater degree of competence on thepart of the analyst. Understanding ofthe behaVior of oxygen must be supple-mented by an understanding of theparticular instrument and its behavior'during ude. .
C Definition
1 Electrochemistry - a branch of chemistrydealing, Tith relatiOnshipS between,
, electrical and chemical changes.
Note:
I
2 Electronic measurements or electro-metric procedures - -procedures usingthe measurement of potential differencesas an indicator of reactions takingplace at an electrode or plate. .
Reduction - any process in which oneor more electrons are added to an atomor art ijn, ,such as Ef2 + 2e 20The oxygen has been reduced.
3
Oxidation - any process in which oneor more electrons are removed froman atom or an ion, such as Zno - 2e
Zn+2, The zinc has becn oxidized.
5 Oxidation - reduction reactions - in astrictly chemical reaction, wetly,ctiori
. cannot occur unless an equival(ntamount of some oxidizable substancehas been oxidized. For example:
2H2
+ 02
2H2'- 4e
02 + 4e
2H204H +1 hydrogen okidized(
4-4.* - 24, 20 oxygen reduced "
Chemical reduction of oxygen may alsobe accomplished by electrons suppliedtoo a noble metal electrode by a batteryor 'other energizer.
6 Anode 71 an electrode at which oxidationof some readable substance occurs.
- ._t' 7- cathode - an electrode at which
redudUon of some reactable substanceoccurs. For example. in I. C. 3, thereduction of oxygen occurs at thecathode.
.
8 Electrochemical reaction - a reactioninvolving simultaneous conviersion ofchemical energy into electrical energyor the reverse. These conversions are
.4- .Mention of Commercial.Products and Manufacturers Do"esNot Imply Endorsement by the Environmental Protection,Agency. \
-.. '114 1
CH. 0. do. 32a. 2.114.1 ,..044.4*`'`
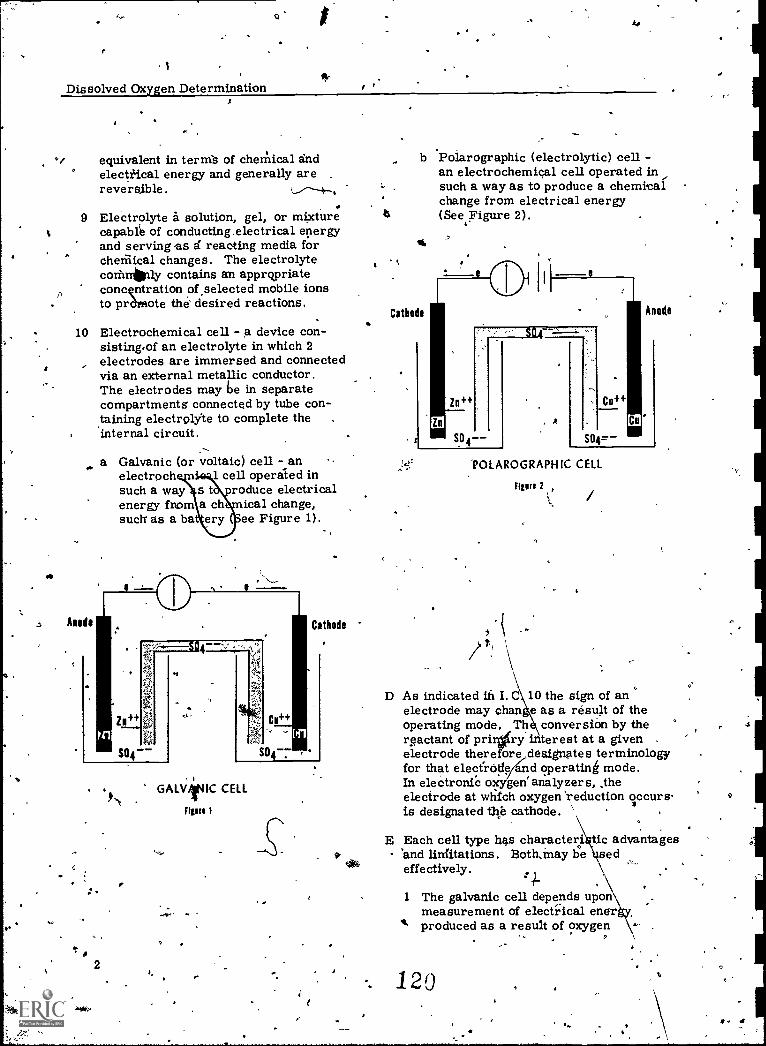
a
O
ft,Dissolved Oxygen Determination
equivalent in termb of chetliical andelectfical energy and generally arereversible.
9 Electrolyte a solution, gel, or mixturecapably of conducting electrical energyand serving as d reacting media forchethical changes. The electrolytecotimailly contains an appropriateconcqntration of selected mobile ionsto pramote the' desired reactions.
10 Electrochemical cell - a device con-sisting.of an electrolyte in which 2electrodes are immersed and connectedvia an external metallic conductor.The electrodes may be in separatecompartments connected by tube con-taining electrolyte to complete theinternal circuit.
a Galvanic (or voltaic) cell - anelectroch 1 cell operated insuch a way s t roduce electricalenergy from a ch ical change,such as a ba ee Figure 1).
p2
GALViNIC CELL
Nue 1
b Polarographic (electrolytic) cell -an electrochemical cell operated insuch a way as to produce a chemicalchange from electrical energy(See Figure 2).r
t
Cathode
A
r
Zn"
SO4--
Anode
.ROLAROGRAPHIC CELL
1' \
figure 2
D As indicated iii I. C 10 the sign of anelectrode may than e as a result of theoperating mode. Th conversion by thereactant of prilfry interest at a given .
electrode therefore designates terminologyfor that electrode d operating mode.In eleCtronie o gen'analyzers, theelectrode at which oxygen 'reduction occurs-is designated tl-te cathode.
E Each cell type has characteri'and limitations. Both.inay beeffectively.
. .
is advantagesse d
1 The galvanic cell depends uponmeasurement of electrical enerproduced as a result of oxygen
. 1204
1
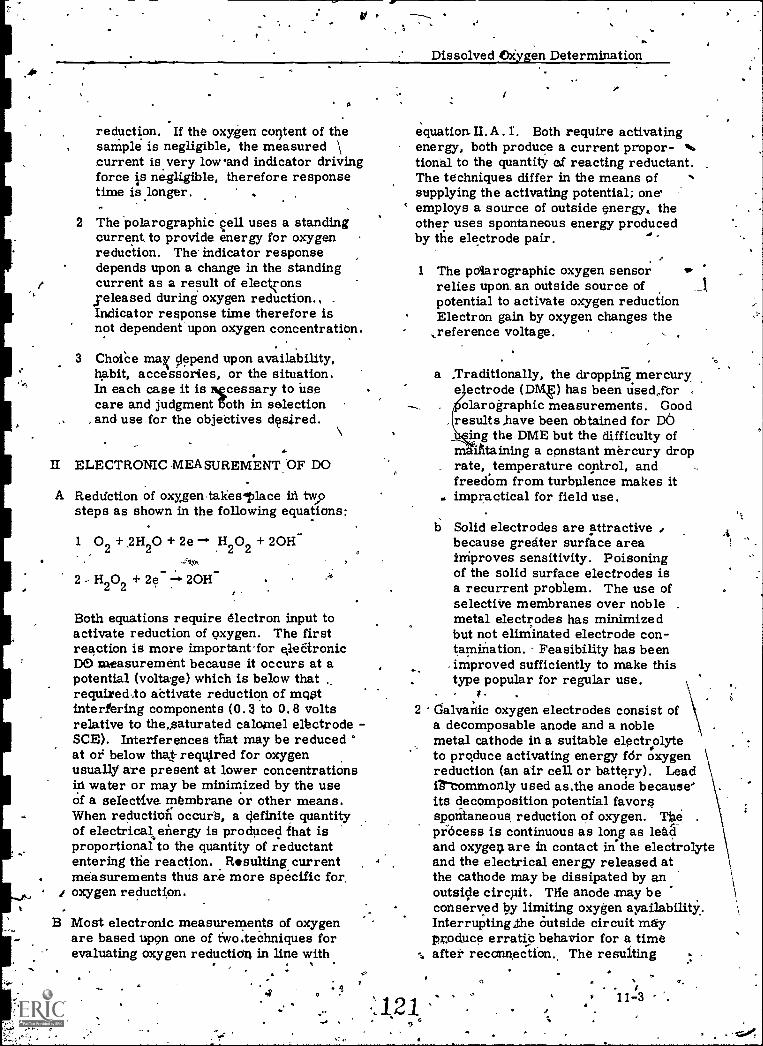
a------.
Dissolved eiygen Determination
0
reduction. If the oxygen content of thesarnple is negligible, the measured \current is very lowand indicator drivingforce is negligible, therefore responsetime is longer. .
2 The polarographic ell uses a standingcurrent to provide energy for oxygenreduction. The- indicator responsedepends upon a change in the standingcurrent as a result of electronsreleased during oxygen reduction.,Indicator response time therefore isnot dependent-upon oxygen concentration.
3 Choisce maK depend upon availability,habit, accessories, or the situation.In each case it is Necessary to usecare and judgment Toth in selectionand use for the objectives
0
II ELECTRONIC MEASUREMENT OF DO
A Rechiction of oxy,genAakes4place izi twosteps as shown in the following equations:
1 02 + 2H 20 + 2e - H202 +
2 H20
2+ 2e 20H
Both equations require electron input toactivate reduction of oxygen. The firstreaction is more important.for eleOtronicDO measurement because it occurs at apotential (voltage) which is below thatrequired #o activate reduction of mostinterfering components (0.3 to 0.8 voltsrelative to the,saturated calomel elctrode -SCE). Interferences that may be reduced "at of below that required for oxygenusually are present at lower concentrationsin water or may be minimized by the useof a selective membrane or other means.When reduction occurs, a definite quantityof electricakenergy is produced that isproportional to the quantity of reductantentering the reaction. Resulting currentmeasurements thus are more specific for,oxygen reduction.
Most electronic measurements of oxygenare based upon one of two.techniques forevaluating oxygen reducticin in line with
9
equation.II.A .1. Both require activatingenergy, both produce a current propor-tional to the quantity et reacting reductant.The techniques differ in the means ofsupplying the activating potential; oneemploys a source of outside energy,. theother uses spontaneous energy producedby the electrode pair.
1 The pcolarographic oxygen sensorrelies upon. an outside source ofpotential to activate oxygen reductionElectron gain by oxygen changes the
reference voltage.
110
a _Traditionally, the dropping mercuryelectrode (DIV1V uhas been sed,forolarographic measurements. Good
results have been obtained for DOing the DME but the difficulty of
m ittaining a constant mercury drop. rate, temperature control, and
freedom from turbulence makes it. impractical for field use.
b Solid electrodes are attractivebecause greater surface areaimproves sensitivity. Poisoningof the solid surface electrodes isa recurrent problem. The use ofselectiVe membranes over noble .
metal electrodes has minimizedbut not eliminated electrode con-tamination. Feasibility has beenimproved sufficiently to make thistype popular for regular use.l
2 Galvanic oxygen electrodes consist ofa decomposable anode and a noblemetal cathode in a suitable electrolyteto produce activating energy for oxygenreduction (an air cell or battery). Leadill-commonly used as.the anode because'its decomposition potential favorsspontaneous reduction of oxygen. The .
process is continuous as long as le &dand oxygeg are in contact in'the electrolyteand the electrical energy released atthe cathode may be dissipated by anoutside circuit. Tile anode may beconserved by limiting oxygen ayailability.Interrupting.the outside circuit mayproduce erratic behavior for a timeafter reconnecIfon.. The resulting
".11-3
- Dissolved Oxygen Determination%"
1.`current produced by oxygen reductionmay be converted to oxygen concen-tration by use of a sensitivity coefficientobtained during calibration. Provisionof a pulsed or interrupted signal makesi.t'possible to ern/3111y or control the -
signal and adjust it for direct reading.-interms of oxygen concentration or tocompensate for temperature effects.
, t
4
ELECTRONIC Mr-ANALYZERAPPLICATION FACTORS
A Polarographic or galvanic DO.instrunients' operate as a resultoof oxygen partialpressure at the sensor surface to Producea signal characteristic of oiYien reducedat 'the cathode of some electrode pair.This signal is conveyed to an indicatingdevice with or 'without modification forsensitivitrand tepiperature or otherinfluences dependitig upon the instrument
. capabilities and intended use.
B
P.
1 Many approaches'and refinements havebeen used to improve workability,applicability, validity, stability andcontrol of variables. Developmentsare continuing. It- is possible to producea device .capable of meeting any reasonablesituation, but situations differ.
2 Most commercial DO instruments aredesigned for use under specified con-4iditions. So,m e are `More versatile thanothers.- Benefits are commonly reflectedin the price. It is essential to deter=
lot. mine the requirements of the 'Measure-ment situation and objectives for use.Evaluation of a given - instrument interms of sensitivity, response time,poi`tability, stability, servicecharacteristicb; degree of automation,and consistency are used for judgmenton a cost/benefit basis to select theMost acceptable unit.
Variables Affecting klectrOnic DOAlleasurenient
1 Temperature-affects the solubility ofoxygen, the- magnitude of the,esultingsignal and the permeability of the
11.4
4
protective membrane. A curve ofoxygen;-solubility in water versusincreasing temperature may be concave
k,dowardWhile a similar curve ofsensor response VerEys temperature
. is concave upward, increasingtemperature Teri-eases oxygen solubilityand increases probe sensitivity andmembrane permeabilitY,4, Thermistoractuated compenbatiOn of proberesponse based upon a- linear relation.r.ship A); average of oxygen solubilityand electrode sensitivity is not preciOelycorrect as the maximuntispread incurvature occurs at about 3,70C with
er deviations from linearity aboveor below that temperature. If theinstrument is calibrated at a temperature.within + or - 50C of working temperature,the compensated readout is likely to bewithin 2% of the real value: Depending-upon probe geometry, the labdratorysensor may. require -4 to gffo correctionof signal per o C change irhiquiatemperature.
2 Increasing pressure tends to increase ,4electrode response by compressionand contact effects upon the electrolyte, ".%dissolved gapes and electrode surfaces.As, long as entrained gases are notcontained in the electrolyte or underthe membrane, these effects arenegligible.
Inclusion of entrained gases results inerratic response that increases withdepth of immersion.
3 Electrodjsensitiyity changes occur asa result of. the nature and concentrationof contaminants at the electrode sur,faces and possible physical chemical orelectronic side reactions produced.These may take the form of a physicalbarrier, internal short, high residualcurrent, or' cheinical changes in themetal surface.' The.znembrane isintended to allow dissolvati-gds pene-tration but to exclude passageof ionsor pirticulates. Apparently some loneor materials' producing extraneous ionswithin theelectrode vicinity are ableto pass in limited- amounts which '
i22s'

Dissolved Oxygen Determination
rbecome significant\in time. Dissolved
'`gases include 1) oxygen, 2) nitrogen,3) carbon dioxide, 4) hydrogen sulfide,and certain others. Item 4 is likely to
AT; be a major problem. Item. 3 may pro-duce deposits in alkaline media; mostelectrolytes are alkaline or tend,tobecome SC% in line with reaction ILA. 1.The usable life of the sensor varieswith the type of electrode system,surface.area, amount of electrolyteand type, membrane charabteristics,nature of the samples to which the.system is exposed and the length ofexposure. For examplA, galvanicelectro'Ues used in activated sludgeunits showed that the time betweencleanup was 4 to 6 months for electrodes
- used-for Intermittent daily checks ofeffluent DO; continuous use in the mixedliquor required electrode cleanup in 2to 4 weeks. Each eledtrometric cellconfiguration and operating .mode hasits own response chgracteristics.Some are more stable than- others.It is necessary to check calibrationfrequency required under conditionsof use as none of them will maintainuniform response indefinitely. Cali-bration belt* and after daily use isadvisable.
4 Electrolytes may consist of solutionsor gels of ionizable materials such asacids, alkalies or salts. Bicarbonates,KC1 and k.CI are frequently used.. Theelectrolyte is the transfer and reactionmedia, hence, it necessarily becomescontaminated before damage to theelectrode surface may occur. Electro-.lyte concentration, nature, amount andquality affect response time, sensitivity,
a stability, and specificity of the sensorSystem. Generally a small quantity ofelectrolyte gives'a shorter response stime and higher sensitivity but also may-be affected to a greater extent by agiven quantity of contaminating sub-stances.
.,
decrease response time and increaseensitivity-but is less selective and
e uptured'more easily. Thechcitce of material-and its uniformityaffects response time, selectivity anddurability. The area of the membraneand its permeability are directlyrelated to the quantity of transportedmaterials that may produce a signal.The permeability of the membranematerial is related to temperature andto residues accummulated on themembrane surface or interior. Acloudy membrane usually indicatesdeposition and more or less loss ofsignal.
5' Membranes may consist of teflon,polyethylene, 'rubber, and certainother polymeric., films . Thicknessthey vary front t. olgto..0`. 076 nun(0.5 to 3 mils). A thinner membrane will
6 Test media characteristics control theinterval of usable life between cleaningand rejuvenation for any type ofelectrode. More frequent cleanup isessential in low quality waters than forhigh quality waters. Reduced sulfurcompounds are ,among the moretroublesome contaminants. Salinityaffects the partial pressure, of oxygen1at any given temperature. T s effectis small compared to most, oth rvariables but is significant if salinitychanges by more than 500 mg/L.
----N_7 Agitation of the sinple,in the vicinity-
of the electrode is important becauseDO is reduced at the cathode. Underqui scent conditions a gradient hid* solved oxygen content would bestablished on the ,sample side of theembrane as well as on the electrode ,
'de, resulting in atypical response.e sample should be agitated
s ficiently to deliver a representativeportion of the main body of the liquidto the outer face of the membrane.Itkis commonly observed That no \agitation will result in a very low ornegigible response after a short periodof time. ,Increasing agitation will causethe response td rise, gradually untilsome minimum liquid velocity is reachedthat will not cause a further increasein response with increased mixingene'rgy. It is important to checkmixing velocity to reach a stable highsignal that is'independent of a reasonablechange in sample mixing. Excessive
11e5.

Dissolved Oxygen DeterminationVs .
mixing may create al vortex and exposethe sensing surface io air rather thansample liquid. This should be avoided.A linear liquid velOcityof about 30.5 cm/sec(1 ft/sec) at the sensing surface is usuallyadequate.
8 DO senior response represents apotential or currynt signal in themilli-volt or min.i-amp range in ahigh resistance system. A high.quality '
Aelectronic instrument is essential tomaintain a usable signal -to -noise ratio.Some of the more common difficultiesinclude:,
a Variable line voltage or low batteries*in amplifier power circuits.
b Substandard or unsteady amplifieror resistor components.
c Undependable contacts or junctionsin the sensor, connecting cables, orinstrument control circuits.
Inadequately shielded electroniccomponents.
e Excessive exposure to moisture,fumes or chemicals in the wrongplaces lead to stray currents,
*internal shorts or other malfUnction.
C Desirable Features in a Portable DOAnalyzer
f The unit should include steady stateperformance electronic and indicatingcomponents in a convenient but sturdypackage that is small enough to carry.
2 There should be provisos for additio nof, special accessories s h as bottleOfield sensors, agita ors, recorders,line extensions, if needed for specificrequirements, Such, additions shouldbe readily attachable and detachableand maintain gotid working characteristics.
3 The instrument should' include asensitivity adjustment which uponcalibration will provide for directreading in terms of mg of DO/L.
11-6
4 Temperature compensation and temp-erature readout should be incorporated.
5 Plug in contacts should be positive,sturdy, readily cleanable and, situatedto minimize contaMination. Waterseals should be provided wherenecessary.
6 The sensor should be suitably designedfor the purpose intended in terms ofsensitivity, response, stability, andprotection during use. It should beeasy to clean, and reassemble for usewith a minimum
A-loss, of seriiice tine.
-7 Switches, connecting Plugs, and con-tacts preferably should be lc(cated onor in the instrument box rather than -at the "wet" end of the line near thesensor. Connecting cables should bemultiple strand to minimize separatelines Calibration controls should beconvenient but designed so that it isnot likely that they will be inadvertentlyshifted during use.
8 Agitatcir accessories for bottle use .
impose special probleins because theyshould be small, self contained, andreadily detachable but sturdy .enoughto gilie positive agitation and electricalcontinuity in a wet zone. .;
9 Major load batteries should berechargeable or readily replaceable.Line. operation should be feasiblewherever possible.
10 Service and replaceMent parts avail -ayprbialiwt/nagrae primaryer ynt ifcoi nc as
ti idoenr aatni .
trouble shooting memos should becorporated with applicable operatingsiructiOns in the instrument manual
in an informative organized form.
D Sensor and Instrument Calibration
The instrument box is likely to have someform of check-to verify electronics,battery or other power supply conditionsforuse. The sensor commonly is notincluded in this check. A known reference
s ,'9
Dissolved Oxygen Determination',
sample used wioperating modemethod to compeunder use conditicalibrate beforetest conditions.in conditions, o
the instrument in ans the beet available
ate for sensor variablesns., It is advisable tod after daily use under
evere, conditions, changesossibie damage call for
calibrations d ing the use period. Thereadout scale is likely to be labeled -calibratfon is the basis for this label.
The following procedure is recommended:
1 Turn the instrument on and allow it toreach a stable condition. Perform therecommended instrument check asoutlined in the operating manual,
.
2 The instrument check li.aually includesan electronic zero correction. Checkeach instrument against the readoutscale with the sensor immersed in anagitated solution of sodium sulfitecontaining sufficient cobalt chloride tocatalyze the reaction of sulfite andoxygen. The indibator should stabilizeon the zero reading. If it does not, itmay be the result 'of residual or straycurrents,, internal shorting in theelectrode, or membrane rupture.Minor adjustments may, be made usingthe indicator rather than the electroniccontrols. Serious imbalance requireselectrode reconditioning if the electroniccheck is 0. K. Sulfite must be carefullyrinsed from the sensor until the readout
, stabilizes to prevent carry over to thenext -sample.
'Fill two DO bottles with replicateSamples of clarified water sirailar-lo__'
t to be tested. This water shouldof contain significanttest interferences.
4
5
Det rmine the DO in one by the azidemod cation of the iodomOric titration.
Insert a magnetic stirrer in the otherbottle or use eprobe agitator. Startagitation after insertion of the sensorassembly and note the point ofstabilization.
a Adjust the instrument calibrationcontrol if necessary to comparewith the Otrated DO.
b If sensitivity adjustment is notpossible, note the instrt ntstabilization point and de toit as ua. A sensitivity coe ficient,
is equal to /2-1 where DO is th/DO
titrated value for the sample onwhich ua was obtained. An unknown
DO then beconies DO = This.4)
factor is applicable as long as thesensitivity does not change.
6 Objectives of the test prdgram and thetype of instrument influence calibrationrequirements. Precise work mayrequire calibration at 3 points in theDO range of interest instead, of at zeroand high range DO. One calibrationpoint frequently may be adequate.
Calibration of a Daieensor in air is aquick test, for possible changes insensor response. The difference- inoxygen content of air and of water istoo large for air calibration to besatisfactory for precise calibrationfor use in water.
IV This section revieiva cha'racteristics ofsev 1 sample labol'atory.instruments.Mentio of a specific instrument does notimply U PA endorsement or recommendation.No attem t has been made to include all theavailable instruments fihose described areused to indicate the, approach used at onestage of development which may or may notrepresent the current available model.
A The electrode described by Carrit andKanwisher (1) is illUstrated in Figure 3.This electrode was an early example ofthose using a membrane. The anode was
- silver oxide reference cell witha platinum disc cathode (1-3 cm diafrieter).The salt bridge consisted of N/2 KC1 and
b2t-11 -7

1
DissolIed Oxygen' Determination
10.
KOH. The pobrethyle e membrane washeld in place by a retai ing. Anapplied current wats..used in a polarographicmode% Temper\hture effects were relativelylarge. Thermiitor correction was studiedbut not integrated with early models.
Retaining Ring
Polyethylene Film
SilverRing
LPtatinum Disk fElectrolyte Layer .r
Figure 3
fl
C
B The Beckman oxygen electrode is anotheruStratidn-of a olarographic DO sensor -
.4 (Figure 4). It consis s of-a-gold cathode,IDa silver anode, an electrolytic gel con-
taining KC1, covered by a teflon membrane.The instrument has a temperature readout --and compensating thermistor, a source'polarizing current, amplifier with signal,adjustment and a readout DO scale-withrecorder contacts. .
SENSOR
0 vOC
ELECTRONICSaPst/tIe
KIM 04DCUT.0NI (III
CIiSODOH
Itc000ttelS1S1011
:FenVOIS
0gRie
171.t2=11'
CAP 014S1mlia1
OHM SOOT
THI4.1S1011
GII
0 11.09.Mffb
-nr11110. moquAllAHT
PITTS HODE
010 CATHODE
Figure 4, THE BECKMANZSXYGENSENSOR
.r
The YSI Model 51 (3) is illustrated inFigure 5. This is another form ofpolarographic DO analyzer. The cellconsists of a silver anode coil, .a goldring cathode and a KC1 electrolyte witha teflon membrane. The instrument hasa sensitivity adjustment, temperature andDO readout. The model 51 A has temp-erature compensation via manual presetdial. A field probe and bottle probe areavailable.
a
'0' Ring
Membrane
KCL Solutioa
Anode Coii
VS1-Model 51 DO Sensor
Cathode Ring
Figure 5
The Model 54 YSI DO analyzer (4), is basedupon the same electrode configuration butmodified to include automatic temperaturecompensation; DO readout, and recorderjacks. A motorized agitator bottle probeis available for the Model 54 (Figttc'e 6).
Till Model VI Ail ttttt Prb
4
12G
.t
'11
t
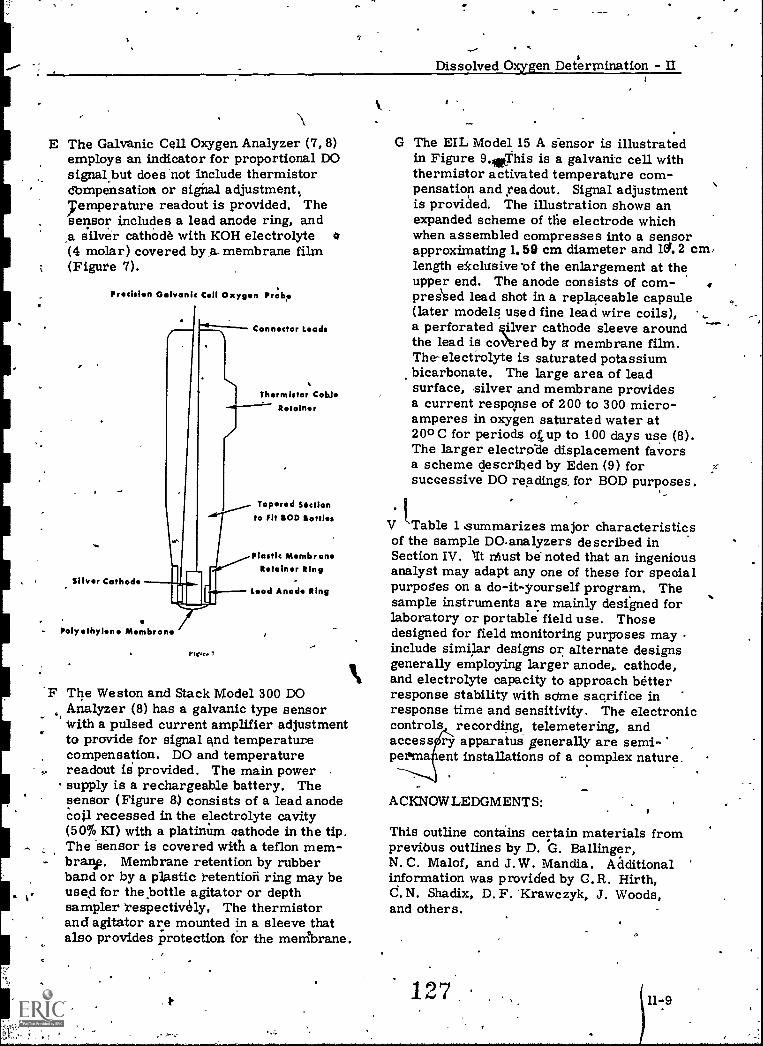
E The Galvanic Cell Oxygen Analyzer (7, 8)employs an indicator for proportional DOsignal but does not include thermistordbmpensation or signal adjustment;yemperature readout is provided. Thesensor includes a lead anode ring, anda silver cathode with KOH electrolyte sy
(4 molar) covered by a- membrane film(Figure 7).
Prcisin Galvanic Cell Oxygen probe
Silver Cathode
polyethylene Membrane
Pigure
Connector Leads
Thermistor Cab JeRetainer
Tapered Misfit:onto Fit 110D Settles
Plastic MembraneRetainer Ring
Lead Anode Ring
F The Weston and Stack Model 300 DOAnalyzer (8) has a galvanic type sensorWith a pulsed current amplifier adjustmentto provide for signal and temperaturecompensation. DO and temperaturereadout is provided. The main powersupply is a rechargeable battery. Thesensor (Figure 8) consists of a lead anodecoil recessed in the electrolyte cavity(50% KI) with a platinum cathode in the tip.The sensor is covered with a teflon mem-bran?. Membrane retention by rubberband or by a plastic retention ring may beused for the bottle agitator or depthsampler respectively, The thermistorand agitator are mounted in a sleeve thatalso provides protection for the membrane.
Dissolved Oxygen Determination - II
G The EIL Model 15 A sensor is illustratedin Figure 9.44rThis is a galvanic cell withthermistor activated temperature com-pensation and readout. Signal adjustmentis provided. The illustration shows anexpanded scheme of the electrode whichwhen assembled compresses into a sensorapproximating 1.58 cm diameter and 161.2 cm,length ekclusive of the enlargement at theupper end. The anode consists of com-pres 'sed lead shot in a replaceable capsule(later models used fine lead wire coils),a perforated kilver cathode sleeve aroundthe lead is cOtred by g membrane film.The-electrolyte is saturated potassiumbicarbonate. The large area of leadsurface, silver and membrane providesa current response of 200 to 300 micro-amperes in oxygen saturated water at200C for periods otup to 100 days use (8).The larger electrode displacement favorsa scheme described by Eden (9) forsuccessive DO readings. for BOD purposes.
V Table 1 summarizes major characteristicsof the sample D analyzers described inSection IV. 'It rust be noted that an ingeniousanalyst may adapt any one of these for specialpurposes on a do-it-yourself program. Thesample instruments are mainly designed forlaboratory or portable field use. Thosedesigned for field monitoring purposes mayinclude similar designs or alternate designsgenerally employing larger anode,, cathode,and electrolyte capacity to approach betterresponse stability with same sacrifice inresponse time and sensitivity. The electroniccontrols recording, telemetering, andaccessary apparatus generally are semi-perima ent installations of a complex nature.
1.0
ACKNOWLEDGMENTS:
This outline contains certain materials fromprevibus outlines by D. G. Ballinger,N. C. Malof, and J. W. Mandia. Additionalinformation was provided by C.R. Hirth,C. N. Shadix, D. F. Krawczyk, J. Woods,and others.
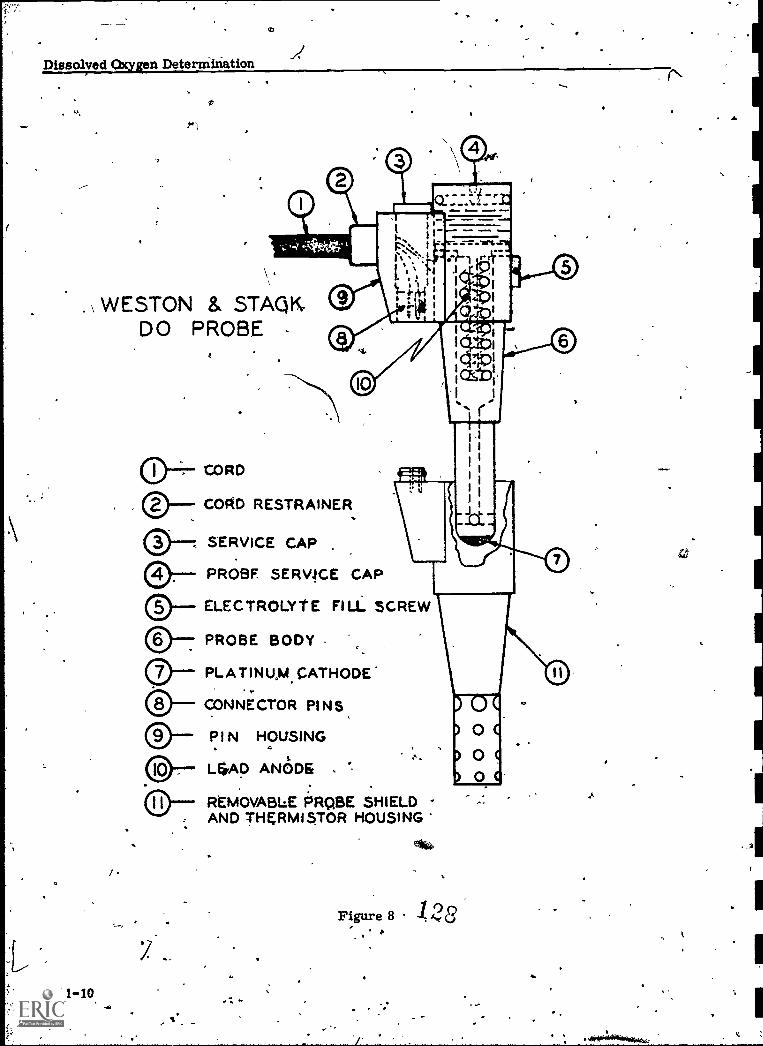
Dissolved Oxygen Deterniination
. \ WESTON & STAQPDO PROBE
1
CORD
CORD RESTRAINER
SERVICE CAP
PROBE SERVICE CAP
ELECTROLYTE FILL SCREW
PROBE BODY
PLATINUM CATHODE
CONNECTOR PINS
PIN HOUSING
LEAD ANODE
REMOVABLE PRQBE SHIELDAND THERMISTOR HOUSING
Figure 8 1 k Q

C1112 '0' RingCisnnection R524
Cover
A15016ACable Sealing
NutA 15017
C
Cable
-
Model A15A ELECTRODE COMPONENT PARTS
'0' RingR.389
Lead AnodeComplete
(A15024/0
(
MembraneiSecuring Anode
'0' Ring Contact'0' Ri 9 .--....
R317 A150140IR385 .
)(With Sleeve S24)
..-.* AnodeContactHolder
A1301iA
RingR622
---. Memb- rane Securing
SilxLricoerhode
\$ 1111 11111111r:
tstalesiustillsler,
kingR612'
Note: Red wire of cable connects to Anode Contact Holder
Black wire of cable connects to Anode Contact
Membrane not shown E. I. L. part number T22
',Figure 9
-.. -Ring
R317
FillerScrewZ471
End CapA15011A
'0' RingR622
1.30
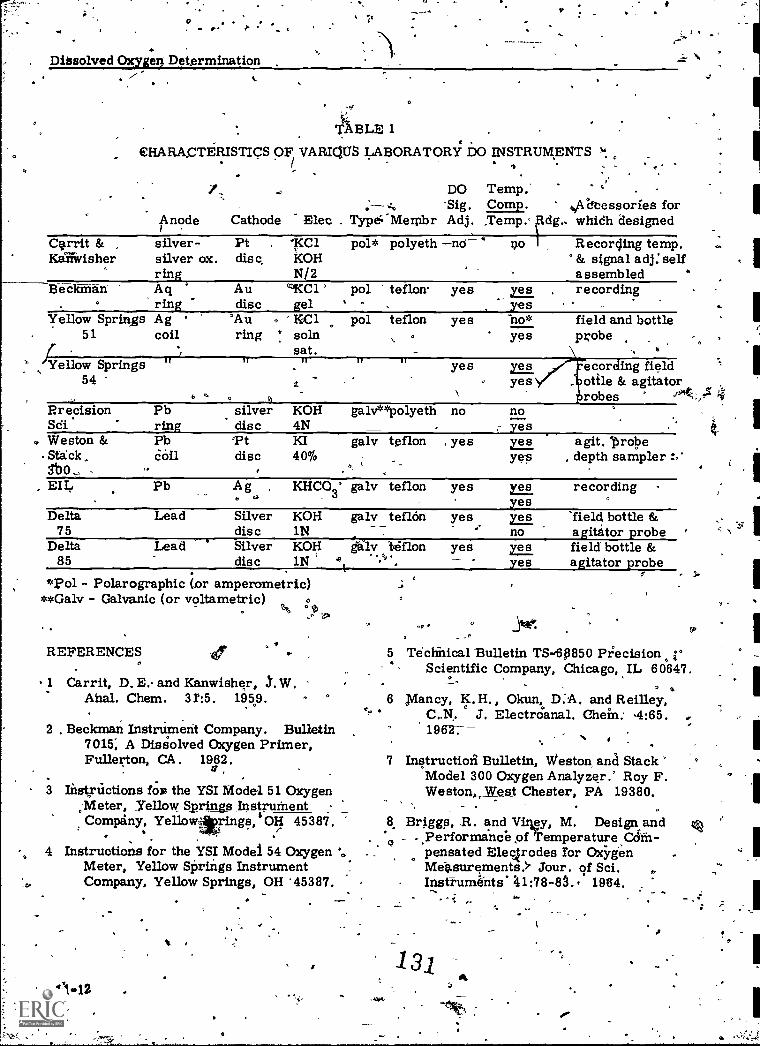
O
. Dissolved Oxyge0 Determination.
,tt
TABLE 1
CHARACTERISTICS OF VARIOUS LABORATORY DO INSTRUMENTS
Anode Cathode;
DO Temp. ° '.Sig. Comp. sAbibessories for
Elec Type'"Mernbr Adj. ,Temp.- dg, whidh designedCvrit & silver-KaThvisher silver ox.
ringBeckfan A q
ringYellow Springs Ag
51 coil
'Yellow Springs54
Erie.cisionSC
. Weston &Stick
Pt .
disc, KOHN/2
Au ''`KC1 'disc gel
'Au . -KaC1ring ° soln
sat.
pol* polyeth
pol teflon-. .
pol teflon°
yes yesyes
yes no*yes
Recording temp.° & signal adj: selfassembledrecording
. .
field and bottleprobe
b
PbringPbcoil
silverdisc-Ptdisc
KOH4NKI40%
g-a.lv**polyeth
galv teflon
yes yesyes
no noyes
yes yesyes
ecorciing fieldottle & agitatorrobes
agit. 'probe, depth sampler
EIL Pb Ag KHC 03° galv teflon yes Yesyes
recording0
Delta Lead Silver KOH galv teflon75 disc 1N
_ _
Delta Lead ° Silver KOH Litilv teflon85 disc 1N ' J't 1}' .
*pol - Polarographic (or amperometric)**Gals - Galvanic (or voltametric)
% °it>
REFERENCES
1 Carrit, D. E. and Kanwisher,Ahal. Chem. 3r:5. 1959.
2 . Beckman InstrUment Company. Bulletin7015, A Disgolved Oxygen Primer,Fullerton, CA. 1962.
3 Instrictions fox the YSI Model 51 Oxygen;Meter, Yellow Springs InstrumentCompany, Yellowttrings,'OH 45387.
447 5
4 Instruotions for the YSI Model. 54 OxygenMeter, Yellow Springs InstrumentCompany, Yellow Springs, OH '45387.
t
. 11..12
6.
o
yes yesno
yes yesyes
field bottle &agititor probefield' bottle &agitator probe
jise.
Techhical Bulletin TS-613850 Piecision rScientific Company, Chicago, IL 60647.
piney, K. H. , Okun, D:A . and R eilley,C.N. J. Electroanal. Chein. -4:65.19627
7 Instructiozi Bulletin, Weston and StackModel 300 Oxygen Analyzer.' Roy F.Weston, Vest Chester, PA 19380.
.8. Briggs, R. and Viiiey, M. Design and
- Performance of Temperature aim-pensated Electrodes for OxygenMeasurements. Jour. of Sci.Instimme-nts 41:78-8S.. 1964.
.

0
9 . Eden, 'R. E. BOD Determination Usinga Dissolved:Oxygen Meter, WaterP011ution Control. pp. 537-539. 1967:
10. Skoog, D.A. and Webt, D. M. Fundamentalsof Analytical Chemistry. Holt,Rinehart & Winston, Inc. 1966.
a
a
0
) .
. Dissolved/Oxygen Determination
11 Methods for Chemideg.Analysis ofWater & Wastes, U. S: EnVironmentalProtection Agency; EnvironmentalMonitoring & Suppqrt Laboratory,Cincinnati, Ohio 45268, 1974
This-outline was prepared by F. J. Ludzaek. formerChemist, National Training Center, OWPO,CSERA, Qincinnati, :OH' 46268 and NateMa Chemist,' USEFA., OWPO: NatiorialFlak Investigations Center, Cincinnati: OH
: .
12vjaiplars: 'Chemical Analysis, assayed.Oxygen, Dissolved Oxygen Analyzers,Instrumentation, On-Site Tests, Water Analysis,Analysis, Wastewater, Oxygen
*:
1j2
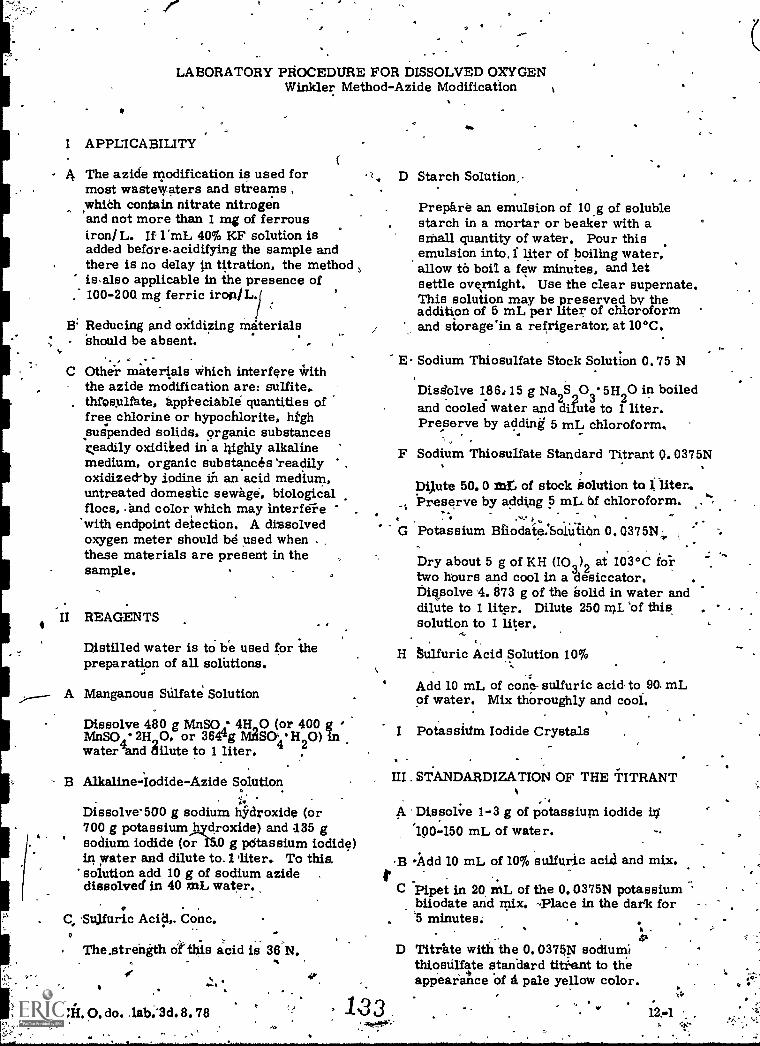
. .
LABORATORY PROCEDURE FOR DISSOLVED OXYGENWinkler Method-Azide Modification
I APPLICABILITY
- 4 The azide modification is used formost wastewaters and streams ,which contain nitrate nitrogenand not more than 1 mg of ferrousiron / L. If l'mL 40% KF solution isadded beforeacidifying the sample andthere is no delay in titration, the methodisalso applicable in the presence of
. 100-200 mg ferric iron/L./
Reducing and madizing materials'should be absent.
ti
C Othir materials which interfere withthe azide modification are: sulfite,
. thfosulfate, appreciable quantities offree chlorine or hypochlorite, highsuspended solids, organic substancesreadily oxidiked in a highly alkaline '
medium, organic substances 'readily .
oxidized-by iodine in an acid medium,untreated domestic sewage, biologicalflocs, 'and color which may interfe-iewith endpoint detection. A dissolvedoxygen meter should be used when .these materials are present in thesample.
II REAGENTS
Distilled water is to be used for thepreparation of all solutions.
A Manganous SUlfate Solution
Dissolve 480 g MnSO 4H 0 (or 400 gIVInSO, 2H00, or 3644g MitSO4 ' 'H
20) in
water7suid dilute to 1 liter.
B Alkaline-lodide-Azide Solution;.
Dissolve-500 g sodium hydroxide (or700 g potassiumhydroxide) and .135 gsodium iodide (or 15.0 g pOtassium iodide)in water and dilute to.1 'liter. To this.solution add 10 g of sodium azidedissolved in 40 niL water.
C, -Suiluric Acid,. Conc.0
The.strength ot this acid is 36 N.
4.4
Cif. 0. do. lab. 3d. 8.78
. .
,1.33_
.1 D Starch Solution
Prepare an emulsion of 10g of solublestarch in a mortar or beaker with asmall quantity of water. Pour thisemulsion into, f liter of boiling water,allow to boil a few minutes, and letsettle ovvnight. Use the clear supernate.This solution may be preserved by theaddition of 5 mL per liter of chloroformand storagein a refrigerator, at 10°C.
E Sodium Thiosulfate Stock Solution 0.75 N
Disdolve 186,15 g Na2§903. 5H20 in boiledand cooled water and dilute to 1 liter.Preserve by adding 5 mL chloroform.
F Sodium Thiosulfate Standard Titrant Q. 0375N
Dipte 50. 0 /12t, of stock Solution to 1 liter.Preserve by adding p mL. of chloroform.
°
G Potassium Briodato.Solution 0.0375N,,
Dry about 5 g of KH (103)2 at 103°C fol.^two hours and cool in a 'desiccator.Dissolve 4. 873 g of the "solid in water anddilute to 1 liter. Dilute 250 of thissolution to 1 liter.
H tulfuric Acid Solution 10%
Add 10 mL of cone- sulfuric acid to 90. mLof water. Mix thoroughly and cool.
I Potassium Iodide Crystals
III . STANDARDIZATION OF THE iITRANT
A Dissol;,re 1-3 g of potassium iodide in190-150 mL of water.
B Add 10 mL of 10% sulfuric aciAl and mix.
C pipet in 20 ML of the 0.0375N potassium -biiodate and mix. -Place in the dark for`5 minutes:
D Titrkte with the 0.0375N sodium',thiostilfite standard titi-ant to theappearance of a pale yellow color.
1.
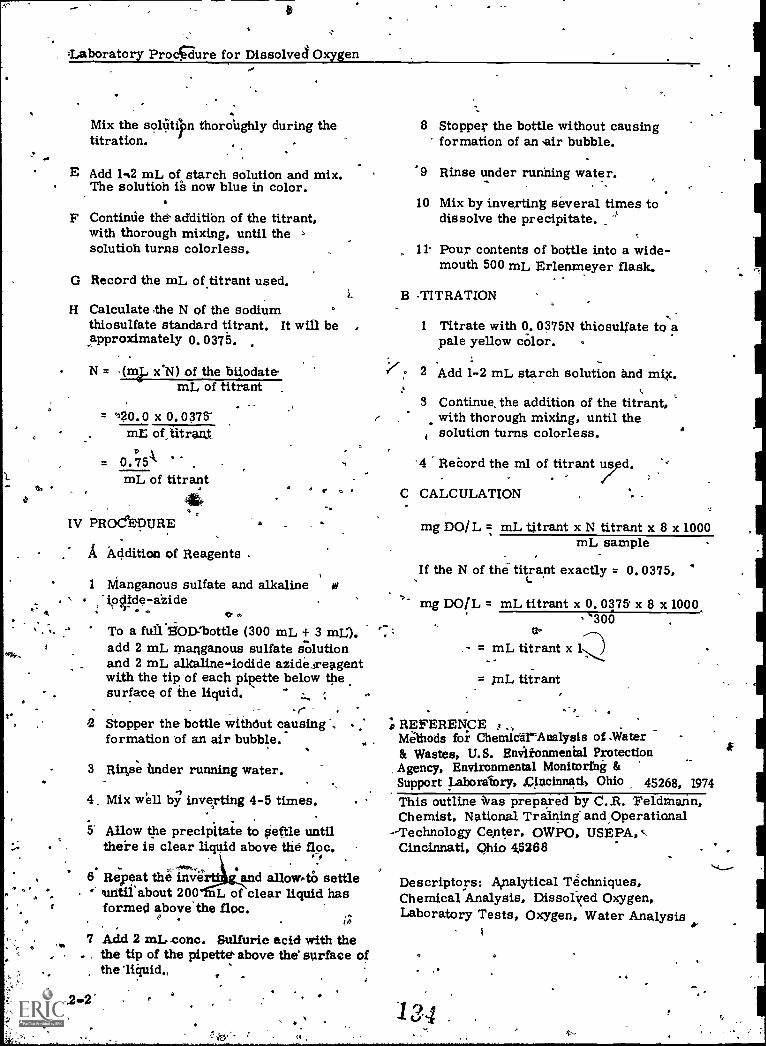
a
Laboratory ProcRure for Dissolves Oxygen0.
Mix the solciti}m thoroughly during thetitration.
E Add 1,2 mL of starch solution and mix.The solutioh is now blue in color.
F Continue the- addition of the titrant,with thorough mixing, until the ->
solutioh turns colorless.
G Record the mL of titrant used.
H Calculate the N of the sodiumthiosulfate standard titrant. It will beapproximately 0.0375.
N = (mik, x°N) of the biiodatemL of titrant
")20.0 x 0.0375-mL of titrant
= 0.75mL of titrant
IV PROCPEDURE
A 'Addition of Reagents
1 Manganous sulfate and alkalineipdprie-azide
o
To a full'itOD:bottle (300 mL + 3 mt.).add 2 mL llianganous sulfate solutionand 2 mL alkaline-iodide azide.sreagentwith the tip of each pipette below thesurface of the liquid.
Stopper the bottle withOut causing', .formation of an air bubble.
3 Rinse tinder running water.
4 Mix well by inverting 4-5 times..
5' Allow the precipitate to settle untilthere is clear liquid above the floc.
_ -...
6 Repeat the inve and allow46 settleuntil'about 200 L of clear liquid hasformed abovethe floc.
e .
7 Add 2 mL cone. Sulfuric acid with the.. the tip of the pipette' above the' surface of
12.4the liquid.,
ro .
8 Stopper the bottle without causingformation of an air bubble.
'9 Rinse under running water.
10 Mix by inverting several times todissolve the precipitate.
11 Pour contents of bottle into a wide-mouth 500 mL Erlenmeyer flask.
B -TITRATION
1 Titrate with 0. 0375N thiosulfate to apale yellow color.
2 Add 1-2 mL starch solution and mix.
3 Continue, the addition of the titrant.with thorough mixing, until thesolution turns colorless.
'4 Record the ml of titrant uusd..
C CALCULATION
mg DO/L = mL titrant x N titrant x 8 x 1000mL sample
If the N of the titr ant exactly = 0.0375,
mg DOLL = mL titrant x 0. 0375' x 8 x 1000,`300
tr= mL titrant x
= inL titrant
I REFERENCEMethods for Chemi cAT'Analysis -Water& Wastes, U.S. Environmental ProtectionAgency, Environmental Monitoring &Support labor-gory, Ciucinnatti Ohio 45268, 1974This outline Was prepared by C.R. 'Feldmann,Chemist, National Training and Operational
Technology Center. MP°, USEPA,Cincinnati, Ohio 46268
Descriptors: Analytical Techniques,Chemical Analysis, Dissolked Oxygen,Laboratory Tests, Oxygen, Water Analysis
1
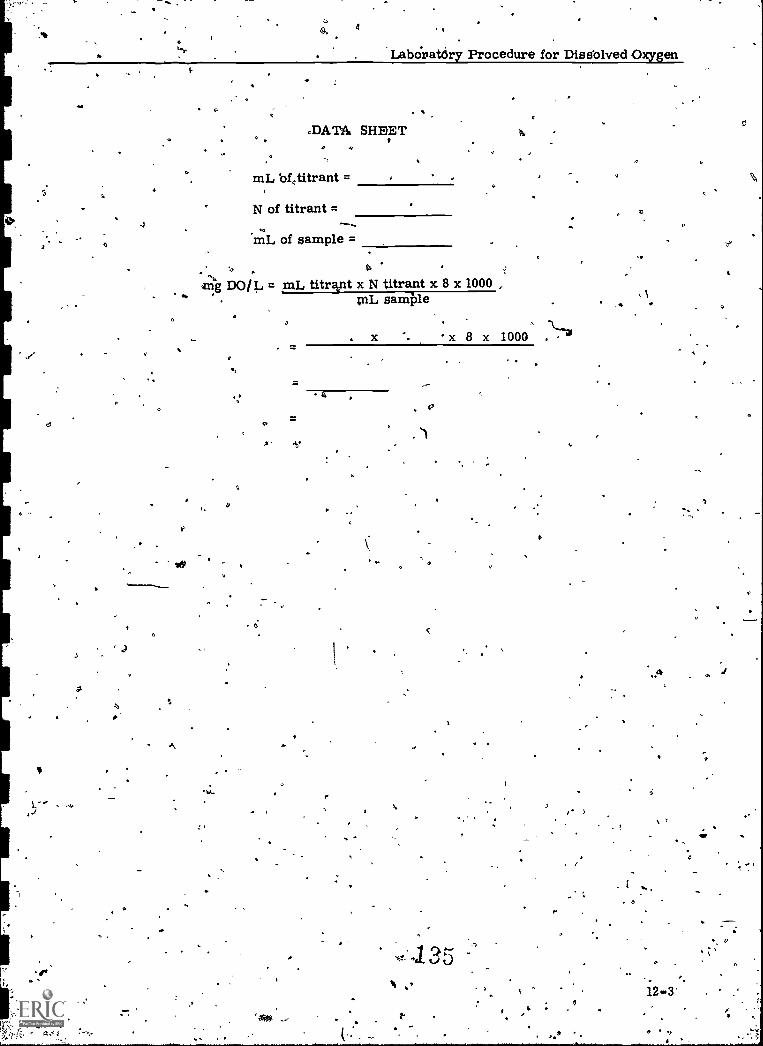
4
4
4
O
4
Labdratory Procedure for Dissblved Oxygen
°DATA. SHEET
mL bf,titrant =
N of titrant =
mL of sample =
,ang DO/ 1., = m1, titr5nt x N titrant x 8 x 1000 ,
raL sample
,8
. x x 8 x 1000 \-41
a

d-
DISSOLVED OXYGEN'Factors Affqeting DO Concentration in Water
L__ (:. <
I he Dissolved Oxygen determination is: a v importip water quality criteria fore
man reasons:.
.
< * A Oiygen is an essential nutrient for all.. ..living organisms. Dissolved oxygen is:.esstiqa.r for survival of aerobicorganisms and permits facultativeorgy isms to metabolize more effectively.Many desirable varieties of macro ormic organthms cannot.survive atdissolired oxygen concentrations belowcertain minimum values. These valuesvary with the type of organisms, stagein their life history, activity, and other,,factors.
H
B Dissolved, oxygen levels nay be used asan indicator of pollution by .oxygendemanding wastes. Low DO concen-trations are likely to be associated withlow quality Waters.
\ .
C The Presence of dissolved oxygenprevents or Minimizes the onset ofputrefactive decomposition and the
____prOductiiin-of objectionable amounts ofmalodorous sulfides, mercaptans,amines, etc.
D)ssolved oxygen is Assential for
t mina). Stabilization wastewaters.Hi h DO concentrations are normallyass ciated with good quality water.
Dissolved oxygen'changes with respectto time\ ,depth or *ction of a watermass are useful tO indicate -the degree,of stability or mixing' characteristicsof that situation.
The BOP gr other i'espirometrie test, methods for mater 'quality are commonly
based upOn the difference between aninitial and final DO determinatibn for a'iiverisample time, interval and con-
, - dition. These measnrements areusefill "to ?indicate: k
WP.NAP. 25a. 2.81
c. *'
a
1 The rate of biochemical activity interms of oxygen demand-for agiven sample and conditions.
2 The degree of acceptability -
(a bioassay technique) far bip-chemical stabilization OT a given'microbiota in response to food,inhibitory agents or test conditions
3 The degree of instability of awater mass on the basis of testsample. DO changes over anextended interval of time
4 Permissible load variations insbrfade water or treatment units.in terms` of DO depletion versustime, concentration, ororatia-of 'food'to organism mass, solids, or
' volume ratios. -t
5 Oxygenation requirempntsnecessary to meet the oxygendemand in treatment units or,.surface water situations.
G Minimumallowable DO concentrations arespecified ill' all Water Quality standards.
II FACTORS AFFECTING THE DOCONCENTRATION IN WATBR,
A Physical Factors:
13
1 DO solubility in water for anair /water system is limited toabout 9 mg DO/liter of water at20°C. This amounts to about0.0009% as dompared to 21/Obyweight of oxygen in jir.
Transfer of oxygen from air towater is limited by the interfacearea, the oxygen deficit, partialpressUre, the conditions at the
134

'Dissolved Oxygen
4
interface area, mixing p omen& rand other items.
Certain-factors tend to confusereoxygenation mechanisms ofwater aeration:
a The transfer,of oxygen in airto dissolved molecular oxygen .in water has two-principalvariables;
4 Area a the air-waterinterface:
2) Dispersion of the oxygen -saturated water at theinterface into'the body liquid.
The fiist depends upon the surfacearea of ti-e-air bubbles in the wateror water drops aiK; thesecond depends updriAhe mixingenergy in the liquid. It-diffusorsare placed in a line along the wall,dead spots may develop in the co e.Different diffusor placement ormixing energy may improve oxygentransfer to the liquid two or threefold. _
b Other variables in oxygen transferinclude:
3) Oxygen deficit in the liquid.
4) &nen content of the gasphase.4
5) Time.'
If the first four variables arefavorable, the proCess'of Wateroxygenation is rapid until the liquidapproaches saturation.. Much moreenergy and time are required toincrease oxygen saturation fromabout 95 to /100%; than to increaseoxygen saturation from 0 to about
132
-14,4k41
95 %. For example: An oxygen-depleted sample Often will pick upsignificant DO cluring. DO' testing;Changes are unlikely with,a samplecontaining equilibrium amountsof DO.
l+
c The limited solubility of oxygenin water compared to the oxygencontent of air does not requirethe Int rchange of a large mass ofoxyge a er unit volume of waterto ch ge DO saturation. DO
eases from zero to 50%saturation are common in passageover a weir.
d Aeration'of dirty water is practicedfor cleanup. Aeration of cleanwater results in washing the air andtransferring fine particulate andgasedus contaminants to the liquid.
e One liter of air at room temperaturecontains about 230 mg of oxygen. An18.9L carboy of water with 2 liters
ample oxygen supply for equilibratimof gas space above the liquid has
of DO after storage for 2 or.3 daysor shaking for 30 sec.
f Aeration tends toward evaporative):73cygen content becomes
higher than saturation values atthe test temperature, thuscontributing to high blanks.
3 Oxygen solubility varies wig? ttemperature *the wat r.Solubility at 106C is a.b ut wo:.times that at 30p C. Temperepre°often Contributes to DO variationsmuch greater than anticipated by
137 4.
N
I.

C
Dissolved Oxygen
solubility. A cold' water often hasmuch more DO than the solubilitylimits at laboratory temperature.Standing during warmup, commonlyresults in a loss of DO due tooxygen diffusion from the super-saturated sample. Sampleswarmer than laboratory, tempera-ture may decrease in volume dueto the contraction of liquid astemperature is lowered. , The fullbottle at higher temperature willbe partially fulhafter shrinkagewith air entrance around the stopperto replace the void. Oxygen in theair may be transferred to .raise thesample DO.. For example, avolumetric flask filled to the 1000 nil,mark at 300C will show a waterlevel -about 1.27 cm below the markwhen the water temperature isreduced to 200 C. BOD dilutionsshould be`adjusted to 200C + or -1 -1/20 before filling and testing.
Water density varies with tempp%.4ture with ,lia.ximum waterdensity at 40C: Colder or warmerwaters tend to promote. stratificationof water that interferes withdistribution of DO because thehigher density waters tend to seekthe lower levels.
5 Oxygen diffusion in'a water mass isrelatively slow; hence vertical andlateral mixing are essential tomaintain relatively uniform oxygenconcentrations in a water mass.
Increasing salt concentrationdecreases oxygen solubilityslightly but. has a larger effect,upon*density stratification in awater mass.
'7 The partial pressure of the oxygenin the gas above the water interfacecontrols the oxygen solubilitylimits in the water. For example,the equilibrium concentration ofoxygen in water is abut 9 mg DO/1under one atmospheric pressure of
B Biological or gio-Chemical Factors
1 Aquatic life requires oxygen forrespiration to meet energyrequirements for growth, repro-duction, and motion. The net',effect,is to deplete oxygen resourcesincthe water at a rate controlled .by the type, activity, and mass ofliving materials present, theavailability of food and favor-ability of conditions.
2 Algae, autotrophic bacteria, plantsor other organisms capable of 'photosynthesis may use lightenergy to synthesize cell materialsfrom mineralized nutrients withoxygen released in process.
a, Photo'synthesis occurs onlyunder the influence of adequatelight intensity.
Respiration of alga iscontinuous.
c The dominant effect in termsof oxygen assets orliabilities of alga depends uponalgal activity, numbers andlight intensity. Qross algalikroductivity,contributes tosignificant diurnal DOvariations.
3 H rate deoxygenation commonlyactom les assimilation ofreadily ava nutrients andconversion into ee orstorage products.. Deoxyge tiondue to cell mass respirationcommonly occurs at some lowerrate dependent upon the nature ofthe organisms present, the stage,of decomposition and the degreeOf predation, lysis, mixing and.
' regroWth. Relatively high,

Dissolved Oxygen
deoxygenation rates commonly areassociated with significant growthor regrowth of organisms.
4 Micro-organisms tend to flocculateor agglomerate to form settleablemasses particularly at limitingnutrient-levels (afteravailablenutrientshave been assimilated orthe number -of organisms are largein proportion to available food).
a Resulting benthic depositscontinue to respire as bed
Oxygen availability is limited'because the deposit is physicallyremoved from the source ofsurface oxygenation and algalactivity usually is more:favorable near the surface.Stratification is likely to limitoxygen transfer to:the bed load
b
c The bed load commonly isoxygen deficient and decomposesby anaerobic action.
d Anaerobic action commonly ischaracterized by a dominant_hydrolytic or sorubilizing actionwith relatively low rate growthof organisms.
e, , The net effect is to produce lcicirmolecular weight productsfrom cell mass with a corre-spondingly large fraction offeedback of nutrients to theoverlaying waters. Theselysis products have the effectOf high rate or immediatewoxygen demand upon mixturewith _oxygen containing waters.
f Turbulence favoring, mixing. ofsurface waters and benthicsediments commonly areassociated with extremelyrapid depletion of ,DO.
I41.
13.4
Recurrent r,esuspension ofthin benthic deposits may -contribute to highly erraticDO patterns.
g Long term deposition areascommonly act like pointsources of new pollution as
, a result of the feedback ofnutrients from the deposit.Rate of reaction may be lowfor old materials but a lowpercentage of a large mass ofunstable material may produceexcessive oxygen demands.
C Tremendous DO variations are likelyin a polluted water in reference todepth, cross section,or time of day.More stabilized waters tend to showdecreased DO variations although it islikely that natural deposits such as leafmold will produce differences relatedto depth in stratified deep waters.
ACKNOWLEDGMENTS
This outline contains significant materialsfrom previoussoutlines by J. W. Mandia.
REFERENCE
1 Methods for Chemical. Analysis ofWater & Wastes, U. S. EnvironmentalProtection Agency, EnvironmentalMonitoring & Support Laboratory,Cincinnati, Ohio, 45268, 1974.
This outline was prepared by F. 4. Ludzadk,_fOrmer Chemist, National. Training Center,_and revised by Charles R. -Feldmann,Chemist, National Training & OperktionalTechnology Center, OWPO, USEPA,Cincinnati, Chid '45268
Descriptors: Aeration, Aerobic Conditions,Air-Water Interfaces, Anaerobic Conditions,Benthos, Biolcg ical Oxygen Demand, *DissolvedOxygen, Water Pollution, Water Quality
6 -

BIOCHEMICAL OXYGEN DEMAND TEST PROCEDURES
I QXYGEN DEMAND OF POLLUTEDWATERS
Established practice includes common useof the BOD test as a tool for estimation ofthe bio-oxidizable fraction of surface watersor wastewaters discharged them. Any -
index.including a quantity per unit time suchas the BOD
5is a rate expression. The
ultimate demand is more important than anyone point on the progression. The resultsof a bottle test with minimum seeding andquiescent storage are not likely to be ashigh as -those on the same influent in a mix-
, ing situation. and abundant seed of secondarytreatment or receiving waters. The BOD,is "a" fraction of total oxygen requirement's.
A The'particillar technique used for BODcommonly is specified by State agenciesand/or supervisors. They are requiredto interpret the results as obtained by-laboratory testing. It Is essential thatthe tester and the interpreters halie acommon understanding of what was doneand how. It is highly advisable to main-tain lk given routine untirpll concernedagree"upon a change.
O
11 Each particular routine has many un-definable factor's. The particularroutine is not as important as the con=,sistency and capability with which theresult was obtained.
2 This outline and Standard Methods(1)
disCusses several valid approaches forobtaining BOD results. Selectibn of"method" is not intended-in this outlineor in the EPA Methods Manual(2).
,
B The common 5-day incubation period forBOD testing is a result of tradition andcost. Initial lags are likely to be overand, sore unknown fraction of the totaloxidizable mass has been satisfied after5 days.
C A series of observations over a period oftime makes it possible to estimate thetotal oxidizable mass and the fractionoxidized or remaining to be oxidized atany given time. The problem is to define
CH. O.bod. 57g. 2. 81
the shape of the deoxygeshation pattern andits-limits. A fair estimate of the shape ofthe deoxygenation paftern is available byobservations at 1, 2, or 3 days, 7 daysand 14 days. Increased observations, aredesirable for more valid estimates ofcurve shape, rate of oxidation and total -oxidizable mass or ultimate BOD.
D Increasing impoundment of surface watersand concurrent increases in complexityand stability of wastewater componentsemphasize the importance of long-termobsery tion'c4BOD. The 5-day observationinclude most' of the readily oxidizablemateria s but a very small fraction of the
omponents that are the main factorsin impoundment behdvior.
II DIRECT METHOD
A With relatively clean surface. waters, theBOD may be determined by incubation of
. the undiluted sample for the prescribedtime interval. This method is applicable
only to those waters whose BOD is lessthan 8 mg/L and assumes the 'samplecontains suitable organistns and accessorynutrients for optimum biologicalstabilization.
B Treated effluents, polluted surface waters,household and industrial wastewaterscommonly require dilution to provide theexcess oxygen required for the oxygendemand determination. General guidelinesfor dilution requirements for a given BODrange in terms of the percent of sample inBOD dilution water are:
For a 5-day BOD of5-20 mg/ L, use 25 to 100% sample .
Me,
For a BOD of,20-100 mg/L, use 5 to 25% sample
For a BOD of100-.500 mg/ L use 1 to 5% sample
For a BOD of¶ 500-5000 mg/L, use 0.1 to 1. 0% sample
III PROCEDURES
A Cylinder Dilution Technique
1 4 a.1471'
Biochemical Oxygen Demand Test Procedures
1 Using an assumed or estimated BODvalue as a guide, calculate the factorsfor a--Pange of dilutions to cover thedesired depletions. Those dilutions'ranging from a depletion of 2 mg/Land a residual of 1 mg/L arethostreliable. At least three ,dilutions induplicate should be used for anunknown sample.
..2 Intb a one-liter graduate cylinder (olarger container if necessary) measureaccurately the required amount of mixedsample to give one liter of diluted waste.Fill to the one liter mark with dilutionwater,Carefully mix. The initial DO bycalculation includes IDOD (VIII) adetermined initial does not. Both areessential to estimate significance ofIDOD. Entrapment of air bubbles duringmanipulation must be avoided.
3 Siphon the mixture from the cylinder intothree 300 ml glass stoppered bottles,filling the bottles to overflowing.
, 4 Determine the DO concentration,Lm oneof the bottles by the-appropriate 7%,,arWinkler modification and record as"Initial DO".
5 In-cubate the two remaining bottles at20°C in complete darkness. Theincqbated bottle0 should be water-sealedby immersion in a tray or by using aspecial water-seal bottle.
6 After 5 days of incubation, or otherdesired interval, determine the DO onthe bottles. Average the DO concentrationof the duplicates and report as "Final DO". r
B Direct Dilution Technique
1 It may be more convenient to make thedilution directly in sample bottles ofknown-capacity. A measured volume ofsample may be added (as indicated inA-1) above, and the bottle filled with dilutionwater to make the 1esired sampleconcentration for incubation. In thiscase, the sample must be preciselymeasured, the bottle -carefully filled,but not overfilled, and the bottle volumescomparable and known. ,Firecision is -likely to be poorer than for cylinderdilution.
2 Continue.the procedure as in A-4, 5,and 8 abave..
A
C Seeded ,dylincler Dilution Technique
1 Many wastewaters may be partially orcompletely sterile as a result ofchlorination, effects of other toxicchemicals, heat, unfavorable pH orother hectors detrimental to biologicalactivity. ,Validity of the BOD resultdepends upon the presence of organismscapable of prompt and effective bio-degradation and favorable conditionsduring the particular test. Correctionof tile cause resulting in sterilizationmust be corrected by adjustment;dilution, eta. , prior to reinbculation to
Aachieve meaningful BODr data. 'Receiving.7water, biologically treated effluents, and
soil suspensions are a good source oforganisms likely to be adapted forstabilization of wastewaters. Untreatedwastewaters provide numerous organisms,but are likely to contain nutrientscontributing to excessive seed correctionsand may require appreciable time foradaptation before test waste oxidationbe omes significant.,
2 T1 e amount of added inoculent must bedetermined by trial. The concentration rt
added should initiate biochemicalactivity promptly but should not exertenough oxygen demand to unduly reducethe oxygen available for.samplerequirements., -
3 Estimate the sample concentrationdesired in abcordance with A-1 and s,
C-2 above and add the sample aliquot to thedilution cylinder.
4 Add approximately half of the requiredamount of dilution water to the sampleand mix. This is necessary to assurethat the concentrated waste does notexert a toxic effect on the seed organisms.
5 Measure a suitable aliquot of seed intothe bottle or cylinder and fill withdilution water. Mix the combined sample,'seed and dilution water withott excessiveair entrainment.
6 Continue as in`ra-A steps4, 5, and 6 above:
IV INTERPRETATION OF RESULTS
Standard Methods(1) inchides-a calculation-section that is valid and concise. Preceding
6 it are details of reagent preparation
1.41
Biochemical Oxygen Demand Test Procedures
procedures for the test. These Will not be-reprinted here. This section considerscertain items that may cause concern aboutthe validity of results unless they are care-fully considered and controlled.
A The initial DO of the BOD test obviouslyshould be high. The method of attaininga high DO can trap the analyst.
1 Aeration of dilution water is the mostcommonly considered treatment.This technique does produce a high DObut it is a treacheisous ally. ,
a Dirty air passing through cleandilution water canproduce cleanair and skirty Water. This is asimple air-washing operation.Filterinethe enterin air streammay remove brickbats and 2 x 4's,but filters tend to pass organicgases, fine aerosols, and partic-
. ulatee. 0 -
..r
4'
b A stream of air passing thro ghwater tends to cool the wet rlyevaporation 1 to 3 °C below ambienttemperature. The cooled liquidpicks up more DO than it can holdat ambient temperature. Thephysicalloss of oxygen may producean erroneously high depletion valuefor a determined initial DO, or aft
. low depletion on-KCalculatedinitial DO. grroneous blanks area particular concern. The dilutionwater temperature /DO shift isentice".
2 Raising. DO by allowing the sample toequilibrate in a cotton - plugged 'bottlefor 2 of 3 'days permits oxygenationwith minimum air volume contact.
3 Shaking a partially filled bottle for afew seconds,,also oxygenates with min-imum opportunity of gas washing con-tamination, supersaturation, or -
temperature changes.
B Seeding always is a precarious procedurebut a very necessary one at times. Oftenthe application of seed corrections is a
./..
z.
142
11, if you do, if ypu don't"'situation. Hopefully, seed corrections ?
are small because each individualbiological situation is a, "universe" ofits own.
1 Unstable seeding materials- such asfresh wastewater have "seeds' organilmscharacteristic of'their origin andhistory. Saprophytes resulting insurface water stabilization may be asmall fraction of the population. Re-actable oxygen-demanding componentsproduce excessive demands upon test.oxygen resources
2 A seed containing viable, organisms ata lower 'energy state because of limitednutritional availability theoretically isthe best available seed source. Anorganism population grown undersimilar conditions should be mosteffective for initiating biochemicalactivity as soon as'the nutrient situation,favors more activity. The populationshould not be stored too long becauseorganism redistribution and die-outbecome limiting. This type of seedwould ,most likely be found in a surfacewater or a treatment plant effluentwith a history of receiving the particularmaterial,undkr consideration.
3 Seed sources and amounts can only beevaluated by trial. Different seedsources and locations require checkoutto determine the best available materialfrom a standpoint of rapid initiation ofactivity; low correction, and predictablehigh ovgen depletion under test.
C Chlorination and BOD results fundamentallyare-incompatible. Chlorination objectivesinclude disinfection as the number onegoal.. Chlorine ids, notoriously non-specificin organism effects. Chlorine acts like .
an oxidant in the DO determination. Testorganisms are leis suitable for activitythan they 'were before chlorination.Nutrlesnts may be less available-afterchlorination. Certainly the conditions areless suitable for biological response afterchlorination. Dechlbeination is feasiblewiti'respect to the oxidizing ,power of
:4
Biochemical Oxygen Demand Test Procedures
.
chlOrine, but many organic chlorine corn--pounds that do not show strong oxidizingaction still have toxic effects on biologicresponse.
Numbers are obtainable after dechlorinationand reseeding. The meaning of thesenumbers is obscure. At least two states(New York and New Jersey) specify BOD'sbefore chlorination only.
V PRECISION OF THE BODTESTA The DO test precision often has been used
to suggest precision of the BOD- result.
DO precision is a relatively minor aridcontrollable factor contributing to BOD'results. Other factors such as organismsuitability, .members, adaptation andconditional variables are much moredifficult to control or to evaluate.
B The Analytical Reference Service reporton Water Oxygen Demand, July, 1960(Sample type VII) included the results ofseeded samples of glucose- glutamic, acidBOD results from 34 agencies on 2, 3, 5and 7 day incubations.
The relative geometric standard deviation(average) was .9% on 2% sample and 24%pn 1% sample concentrations. Ratecoefficients ranged from 0.10 to 0. 27 witha median of 0.16 from .21 differentlaboratories that participated in rate studies.
VI ALTERNATE BOD TECHNIQUES
Reaeration methods are becoming increasinglypopular in order to approach more nearly theactual waste-concentration in the receivingwater. It is common to obtain "gliding" BODresults related to the concentration of wastein a series of dilutfor-113 of the same, sample.This may result from greater possibilitiesfor toxic effects at higher, concentrations, orto a different selection of organisms and changein oxidation characteristics at low concentrationsof sample. The most reliable estimate of streambehavior is likely to be from that dilution closestto the wastewater dilution in the receiving water,
A Reaeration can be accomplished by the susual series techniques by dumping all ofthe remaining sealed bottles into a common
B.
container when the residual DO reaches about1. 0 mg/L. 'After reoxygenation, the remainingbottles are refilled and a new initial DOdetermined. Subsequent dissolved oxygendepletions are added incrementally as asummation of the total oxygen depletionfrom the start of the test. If necessary,the reaeration technique may be performedseveral -times but at a sacrifice of doubleDO determinations for each day on which
eration occurs.
Special methods of reaeration have evolvedto minimize the extra manipulation forreaeration of individual sample dilutions.
-1 Elmore Method 0
A relatively large volume of the sampleis stored in an unsealed bottle. Smallbottles are withdrawn in sets of 5 ormore, sealed, incubated, and the DOdetermined at appropriate Intervals.When the DO concentration in the smallerbottles reaches 1.0 mg/L, a new set'iswithdrawn from the large unsealedbottle, after reoxygenation if necessary
2 Orford, Methodk
The deoxygenation is carried out in alarge sealed jug from which samplesfor DO are withdrawn at appropriateintervals. To maintain the waste leveland a sufficient DO in the jug, additional,waste is added from a second opencontainer. See diagram.
C Excels oxygen may be provided byoxygenation with commercial oxygeinstead of with air to increase the initialoxygen content for incubation while limitingthe number of dilutions or reaeration steps.When oxygen is used in place of air theoxygen saturation in water at 20°C is about40 mg/L instead of 9mg/L. Limited resultsare available hence th analyst Must verifyhis technique. The i tends to,decree.seas soon as the bottl is openedhence, about35 mg/L of oxygen content is the top of the ,
practical working oncentration. There hasbeen no evidence that the biota is inhibitedby the higher oxygen content with respectto BOJ progression..
D Reaeration or Oxygenation Advantages andLimitations.
1 Reaeration expands the range of BODresults obtainable directly at fieldconcentrations, but is not advisable fbrapplications when the sample BODexceeds 59 mg/L.

Biochemical Oxygen Deinand Test Procedures
2 Dilution water problems are eliminated,o the extent that the stream sample #nay(74be tested without dilution. .
3 Incubator storage space becomes a realproblem for multiple sample routine.
VII Dissolved oxygen electrodes, polarographicand othets, are feasible for use in BODdeterminations, often making it possible tomake an estim 'ate of DO or BOD when sampleinterference prevents a valid Winkler DOdetermination.
,
Electronic probe DO makes it possible to '
determine many successive DO's at differenttime intervals on the same bottle withnegligible sample loss. ,Reaeration orextended time series, therefore, are morefeasible.
Anoter outline in this series describesresAnse of reaerated BOD
5 with electronicDO probes.
A It is the responsibility of the analyst toevaluate:
1 Applicability of the specified techniqueand sample.
2 To determine requirements for mixingand possible thermal effects, whilemixing in terms of instrument responseand biochemical reaction.
3 ,To evaluate long-term calibratipn orstandardization and their effects uponprecisjon and accuracy of the BQDresuli:
VIII IMMEDIATE DISSOLVED OXYGENDEMAND (IDOD)
Immediate dissolved oxygen demand includesdissolved oxygen utilization requirements ofsubstances such as ferrous iron, sulfiteand sulfide which are susceptible to highrate chemical oxidation.
REAERATION METHODS FOR B.O.D. DETERMINATION
sealed bottles
ELMORE METHOD.
;,-4,47
fl'"P4t
sealed jug.
144 -4
reservoir
d. o. 'samples
ORFORD METHOD

t
7!-
Biochemical Oxygen Demand Test Procedures -
A' The IDOD -is an apparent, response as .indicated by a specified technique. SinceDO titration is based upon iodine titration,any fatty that causes 12 response differentfiont that produced by the reaction of K1and molecular oxygen confuses the IDODdetermination.
cv-
B IDOD Determination
1 The IDOD determination includes thedetermination of DO. on a sample anddilution water separately. A waste
'likely to have a significant IDOD isunlikely to show a DO.
2 According to mixing theory, it shouldbe possible to calculate the DO of anydefinite mixture of the sample anddilution water from the DO of, componentparts and their proportion.
3 The same relative proportions of sampleand dilution water should be mixedwithout air entrainmqnt and the DOilgeerropitdmafutmetshe arbitrarily selected
4 Any difference.between the calculatedinitial,D0 as obtained in 2 above, andthe DO determined in 3 above, may bedesignated as IDOL).
5 Sample aeration, DO interference, andother factors affect results for IDOD
C Sample CalcillEitida of IDOD
1 Sample DO checked and shown to'be O. 0 mg/1
.1
Dilution water DO found to be 8.2 mg/L
Assume a mixture of 9 parts of dilutionwater and 1 part (V/ V) of sample.
Calculated DO =
1 X0 = 0
9 X 8 2 = 73.8
'. 10 part's" of the mixture contain 73. 8/10or 7.4 mg Note that 1-nixing hasreduced t DO c ncentration becauseUfa original amo t is present in alarger package. iopt,
, .2 The mixture described above was held
for 15 minutes and the DO determinedwas 4. 3 mg/L.
100IDOD = DO ..,- DO Xcaw .detm lc sampleused
=7. 4 4. 3 X 10
'=31 mg IDOD/L
REFERENCES
-2 1 Standard-Methods, 14thed, 1975.2 Methods for Chemical AnalydIS-
Water & Wastes, U. S. ,EnvironmentalProtection Agency, EnvironmentalMonitoring & Support LabOrathry,Cincinnati, Ohio, 45268, 19'74.
---This outline was prepared by F. J. Ludzack,former-Chemist, National Training andOperational Technology Center, OWPO,USEPA, Cincinnati, Qhia 45268
Descriptors: Biochemical Oxygen Demand,Chemical Analysis$ Dissolved 0,itygen, 'Water Analysis, Analysis, Wastewater
1 4
BIOCHEMICAL OXYGEN DEMAND TESTplaiTION TECHNIQUE
1
I GENERAL
A Standard Methods (1) lists three waysof diluting biochemical oxygen demand(BOD) samples: in a 1 or 2 /ttergraduated cylinder, in a bottle of knowncapacity (e. g., the BOD bottle), or ina volumetric flask for dilutions greaterthan 1: 100, followed by:final dilutionin the incubation bottle.
B The dissolved oxygen (DO) determina-tions may be made using the azidemodification of the Winkler procedure,or a DO meter.
.II FthAGEATS,'
,
A Distilled 5. obtained from a blocktin or all glass iitill;5or Use deionized
,
water. It must contain no more than0.01 mg of copper/L.,- It must befree of chlorine, chleramines, causticalkalinity, organic _nraterialand °acids.Aerate the water in one of three mays;loosely phig the container with cotttpand stoge at 20°C for about 48 hours;shake 20°C water fir a partially filledcontainer; bttbhle clean compressedthrough 20°C water. Use dibtilled,
...(but not necessarily aerated) water forthe preparation of all solutions.
.
B Phosphate Buffer Solution - dissolve*' 8.5g potassium dihydrogen phosphate;
KH2 PO4, 21.75g ciipoitilium hydrogen-phosphate, K2HPO4, 33.4g disodiumhydrogen phosphate heptahydrate,Na9HP0A 7H90, and 1. 7g ammoniumchroride:NH-C1, im about 500 mL of4
. water and dilute to 1 L. ThepH ofthis solution is 7.2 Discard it if anybiological growth-appears in-th bottle.
C Magnesium Sulfate Solution - 'sSolve°22.5g magnesium sulfate heptahydrate,MgSO47H20, in water and dilute to1
CH. O. bod. lab. 3c. 2.81
D Calcium Chloride Solutron.- dissolve. 27.5g anhydpous calcium chloride, 5,
CaC12, in water and dilute to 1 liter.
E Flrric Chloride Solution -. dissolve0i25g.lerric chloride, FeCl3, in waterand dilute to 1 liter.
F Dilution water - add 1 mL each, of,-solutions II )3, II C, II p, and II E foreach liter of distilled water (HA). If. the
/dilution water is to.be stored ndd thephosphate buffer (IIB) just before use.
G Seeded Dilution Water - the standardseed material is the ,supernatantliquid from domestic wastewater whichhas been allowed to settle for 24-36 hours
Nat:20°'6. Use an amount which will producese& orrection of at least 0.6 Mg/ L.
. Add "thee seed to the dilution water. (II F)of day the dilution water is to be used.
H ,Sockpli Sunete.Solution, 0.025N dissolveer. 1.575 anhydrous sodium sulfite, Na SO ,
.3in4ater and dilute 101 liter: Prepare tnAp- solution daily' it is unstable.
"I Abetie Acid Solution 50%.-.slowly Pliur 50 mL.
tIacetic acid, 1:1C H 0 into 50 mL of water.2..3 2'
Potassium Iodide Solution,. 10% - dissolvelog potassium iodide, KI, in 90 mL-water.
K Sodium' Hydroxide Solution, 1N -dissolve 4gsOdium hydroxide, ,,NaOH, in water and diluteto 1,00smL.
L Bulfuritc,Acid Solution, 1N - slowly pour ,
2.844ni>f conc., sulfuric acid, H2SO4,unto 98 mL of Water. .
Caution: heat will be/generated. 4
M Powdered Starch Indicator,- Thyodene isone brand name.
N bromthypl Blue Indicator, or a pH meter..1 , t
146°

C
411
Biochemical Oxygen Demand Test Dilution Technique
III INTERFERENCES/ PRETREATMENT
A Caustic Alkalinity or Acidity - thismust be neutralized to a pH of about 7with 1 N sulfuric acid or, soditirn hydroxide.Use a.pH meter or bromthymol blue asan external indicator.
B Residual Chlorine Compounds - someresidual chlorine will dissipate if thesample is allowed to stand for 1 or 2hours. Higher residuals must bedetermined, and then neutralized. Toa known volume of sample between 100and 1000 mL, add 10 mLof acetic acid4solution, 10 mL of potassium iodide solu-tion, mix, and titrate to the disappearanceof blue colo w 0. 025N sodium sulfiteand using powders tarch indicator (orstarch solution). U- a proportionateamount of the 0.02 sodium sulfite todechlorinate the entire sample. (Theportion of sample used aboye to.;determine the 6hlorine content of thesample should be discarded, and is notto be used for the BOD determination.)After 10-20 minutes, check a portion ofthe dechlorinated sample to make surethe dedhlorination is complete.
C Other Toxic Substances - samples contain-, ing other toxic substances, e.g. metals in
plating wastes, require special study andtreatment.
'
st-*.During the 5-day incubation period,,zatleast 2 mg of oxygen/L must be ,,'conspmed, and at least 1 mg of oxygen/ Lmust remain at the end of the incubationperiod. ..
PROCEDURE'0*
-.
The steps below repreisexit one ofseveral ways in which the BOD can be set up.For example purposes, assume the dilutionwater dries not have to be seeded.
A Siphon 20°C high qttality distilledwater to the 1000 mL line in a,graduated cylinder. Tilt the cylinderslightly and allow the water to rundown the aides of the cylinder. If the,siphon was "primed'', with other water,"waste" about 100 mL before filling thecylinder.
B Add 1 mL of the calcium solution andMix with a plungerTtype mixer.
C Add 1 mL of the magnesium solution and-mix with a plunger-type mixer.
D Add 1 mL of the ferric solution and mixwith apluaer-type mixer.
E Add 1 mL of the buffer solution and mixD Supersaturation - if you
sample contains more thanoxygen/ L at 20°C, shakein aIarge bottle or flask,
suspect that the9 mg cif
it vigorously.or pass clean
with a plunger -type mixer. (If thedilution,water were to be deeded; itwould be done at this point).
compressed air through the sample. F. Siphon about 250 -mL of the dilution waterinto a 1 liter graduated cylinder.. If morethan 750 03aL of sample are to be used, less
IV SUGGESTED'SAMPLE DILUTIONS than 250 "mL of dilution wate would, Of
Standard Methods (1) sugge ts the followingsample dilutions. However actual dilutionsshould be determined on tie basis of experience,or information supplied with the sample.
"Type of Waste % Dilutionton
Strong Trade . O. 1 -Raw Settled Sewage 1 -Oxidized Effluents 5Polluted River Waters 25 -
152
1.0525*100
14.
-14
course, be siphoned in initi y. Ube thesame technique as irrA abov
G Measure the amount of well miXed sampleto be used. Use a graduated pipet forsmaller sarnple volumes.' If solids arepresent in the sample, the tiplif thepipet may be ,cut off below the bottomgraduation line. For larger samplevolumes, use the apprOpriate sizegraduated cylinder.
t
r.
N.*
)
\'';%.dd the sample to the cylinder containingthe 200 mL of water. Allow the sample
tp run down the sides of the cylinder.
Biochemical.Oxygen Demand Test Diltion fechnique-
I Siphon in additional dilutiOn water to the.1000,m1, line, and, nix with a plunger-tyRe niixer. If other dilutions of thesame sample, or other smaples, arebeing setsuip, be sure to rinse themixer .between uses. `$
J Siphon the dilution water-sample \mixtureinto two BOD bottles. Hold-the end 'of thesiphbn close to the bottom of the bottle,open the siphon slowly, and keep the tipof the siphon just above the surface ofthe surface of the litluid as the bottlefills. Allow a small amount of the s,mixture to overflow the bottle. If thesiphon was "orimed", "waste" about.100 mL before filling the bottles.
K Insert the stoppers into the, BODbottles with a slight twisting motion.Do not use so much force that azais...,bubble is created.
L Determine the initial DO (DOi) on one ofthe bottles within 15 minutes. , Use theWinkler procedure, azide modification,or a DO meter.
M Water-seal the second bottle and incubatein the dark, at 20°C + 1°C, for five days.
/N Determinerthe final DO (DOf) on the' ,
second bottle, Use the same method asL above. (Recall the restrictions noted
at the end of sectionfV).
VI EXAMPLE CALCULATIONS
DO initial = DO i = 7:5 mg/LDO final = DO f = 2.5 mgL100 mL =_ sample volume diluted in the
. 1 liter graduated cylinder =10% dilution (0.1 as a decimalfractiop)-
mg five-day BOD/1 = DOi DOfTgisample dilution.expressed as adecimal
t
IV
mg five-day BOD/L, = 7.5 2.50. I
= 50
VII SEED CORRECTION
A If you 09 seed the dilution water, acorrection must be applied to thecalculation in VI above.
B Do this-by setting up another five-dayBOD exactly as described above, except,use seed material instead of sample.
C In this case however, the five-day oXygendepletion must be 40-70%. (In the case ofthe sample it was a depletion of at least2 mg/L with at least 1 rng /L remaining).Consequently, tt may be necessary to setup several dilutions of the seed in orderto
jet one with a 40-70% depletion.
El Example Seed Correction Calculation
Two hundred fifty mL of seed materialare diluted ¶o 1000 mL with dilution water.
250 x 100.= 25% seed material1000
= 7.0 mgiLDO f = 3.0 mg/L
Depletion = 0 Mg/L - 3.04 mg/ L= 4.O mg/ L
P / 0 depletion = 4. 0 mg/ L x 1007.0 mg/L
= 56
Since the 25% seed dilution gave an oxygendepletion in the desired 40-70%range (56%),it can be used to calculate .the seed correction. ,
E Example Segg Correction Calculation(Continued)
Assume that in preparing the dileution water(V A thr.oUgh V E), you added 2 ml-of seedmaterial to the graduated cylinder before'adding dilution water. to the 1000 mL,Aine.
14315-3
S

4
Biochemical Oxygen Demand Test Dilution 'technique-
1 a
2 x 100 = 0. 2% seed material:in the10001 dilution water.
17:F Example Seed Correction Calculation(Continued)
In the e mple calculation in VI, 4 10%sample ution was assumed.
If the BOD bottles contained 10% sample,they therefore contained 90% dilutlonwater.
t
3 00 mL (volume of BOD bottles)0.90 (% dilution water in'the BQD
bottles expressed as a decimal)
mL (voluine of dilution water in theBOD bottles)
. ,
G Exaniple Seed Correction Calcufation(Continued)
270 mL (volume of dilution water in theBOD bottles)
0.002 (% seed material in the dilution0.540 ml.,,.water expressed as a deCimal)0.540 mL volume of seed material in the
BOD bottles)
H ExaMple Seed Correction Calculation(Continued)
0.54 x 100 = 0. 18% seed material inthe3 00 BOD bottles
0270.00
I You now have all the data you need t6,calculate the seed correction.
, 6
mg five-day BOD/L =(DOi - D0f) of Elimple- ..,
[(DOi - DOf) of seed material x"factorl% of sample expressedas a decimal
.;
% of seed in the sample BOD bottles =0.-18 (front VII H above)
DOi of sample = .7.5 mg/ L )from VI abo4e)
DOf of sample = 2.5 mg/ L (from VI ats63;er
DOi of seed material = 7.0 mg/ L (from VII Dabove) H
DOf of s:eed material = 3.0 mg/ (from VII Dabove
,'15-4
To of seed in the seed.BOD bottles la 25(from VII D above)
% of sample expressed as a decimalfraction = 0. 1 (froin VI above)
faCtor .4.N % of-seed in the sample BOD bottles.50 of seed in the seed $0D-bottles
= 0. 1825.
= 0.0072 ' f
Finally, mg five-day BODE L, (7. 5 - 2.5) -[ ( 7 . 0 - 3 . 0 ) x 0 . 0 0 7 2
5.0,- [ 4). 0 x 0.00721O. 1
_ 5. 0 - O. 03**/
0. 1
= 49.7
VIII Dilution Water Check
A five-day BOD on unsfecied dilution w"a"termugt not be greater than 0.2 mg/ L (andpreferably not more than 0.1 mg/ L ). If it isgreater than 0.2 mg/ L check for contamination
tin the distilled water and, or,:dirtY BOD bottles.Do not use the value as a correction on the BOD.
REFERENCES
1 Standard Methods.forthe Examination ofI Wastewater,. 14th ed, APHA, AWWA,.
WPCF, New York, pg 543, 1975.
This outline was preparecby Charles R. Feldmann,Ch mist, National Training and OperationalTe hnology Center; OWPO, USEPA,C cinnatt; Ohio 45268
.Descriptors: Analytical Techniques,BioctAemical Oxygen Demand, ChemiealAnall ysis, Laboratory Tests, WaterfAnalyEsiis
"no
4,9
.
v-BiOchemical Oxygen Demand Test Dilution Technique
.1
DATA SHEET \
,Initial DO.in mg./ I; DOi =
Final DO in mg/ L DOf-
sample dilution expressed 1;',
as a decimal (e.g., 18% = 0. 18) =
mg 5---day unseedekBOD in 'mg/ L = DOi - DOf- decimal
O
S
15-5
4

4
OPERATING CHARACTERISTICS AND USE1 OF THE pl-t METER
I INTRODUCTION
pH is a term used to describe the intensityti 'of the acid or alkaline condition of a
solution. The concept of pH evolved from /a series of developments filet led to afuller understanding of acids and alkalinesolutions (bases). Acids and bases wereoriginally distinguished, by theit differencein physical characteristics (acidr-sour,bases-soapy feel). In the 18th century itwas recognized that acids have a sour taste(vinegar-acetic acid), that they react withlimestone with the liberatiqn of a gaseous
,44. substance (carbon dioxide) etnd that neutralsubstances result from their interactionwith alkaline solutions.
Acids are also,'"ffescril2ed asj compounds'that yield hydrogen ions when dissolvedin water. And that bases yield hydroxideions when dissolved in water. The processof neutralization is then considered to bethe union of hydrogen (H+) ions and hydroxyl(OH-) ions to form neutral water 't(H+ + OH --0-H 20).
It has been determined that there are1/10, 000, 000 grams of hydrogen icms 'and °17/10, 000;000' grams: of hydroxyl ions inone liter of pure water. the product of theH+ and OH' ions equal a constant value.Tfierefcire, if the concentration of the H+ions is increased there is a corresponding
-vdecrease in OH- ions. The acidity or,,,L4011caIinity, hydrogen ion concentration of a
,/ solution is given in terms of pH. The pirscale extends from 0 to 14 with the neutralpoint at 7. p.
II INSTRUMENTA'llitek
. A General
Becabse of the differences between themany makes, and model of pH meters
,y t
. CH. PH. 2.3..75'.
tt
0
to
which are available commercially, it isimpossible to provide detailed instruc-tions for the correct operation of everyinstrument. In each case, follow themanufacturer's instructions. Thoroughlywet the glass electrode and the calomelelectrode and prepare for use in accor-dance with the instructions givenStandardize the instrument aga st abuffer solution with a pH appro chingthat of the sample; and then chec thelinearity of electrode response againstat least one additional buffer of adifferent pH. The readings with theadditional buffers will afford a roughidea of the limits of accuracy to beexpected .of the instrument and the technicof operation.
B 'Electrode Design t
Aboxit1925 it was cif coverad that anelectr,ode could be constructed of glasswhich would develop a potential relatedto the hydrogen -ion concentration with-out interference 'from,most other ions.The glass pH electrode is the nearestapproach to a universal pH indicatorknown at present. It works on t4eprinciple of establishing 'a potentialacross a pH-sensitive, glass membranewhose magnitude is proportional to thedifference in pH of the solutionseparated by this membrane.
All glass pH indicatina similar b-one side of apis wsolutio f tart
- gn.op,
ectrodes haveContained one glass membrane
. In contactlakkth the other o of this H sensitiveglass is the solutio of un oWn pH.Between the surfakes of the glass mem-brane, a potential is establi: ed whichis groportional to the pH differ- ce ofthese solutions. As the pH of onesoluticarls. constant, this developedpotential is a measure of the, pH of the
' other.
164

Operating-Characteristics and Use of.the pH Meter
To measure this potential, a half -cellis introduced into both the constant,Internal solution and into the unknown,ekternal.. tisoluon. These half-cells arein turn connected to your pH meter. Theinternal. reversible half-cell sealedwithin the chamber of constant pH isalmost exclusively a wire of silver-silver chloride. The externalreversible half-cell is often silver-silvei'v.hloride. If both .the internal andexternal electrodes are combined in acommon pH measuring device, theelectrode is-a combination pH electrode:
As the function of these half-cells is toprovide a steady reference voltageagainst which voltage changes at theglass pH 'sensitive membrane can bereferred, .they biust be ISrotected fromcontamination and dilution by the unknownsolutions. This is accomplished`bypermanently sealing the internal half-cell in a separate chamber which makeselectrical contact to the unknownsolution through a pOraus ceramic plug.This ceramic plug allows current to flow,but does not permit exchange of solutlonto this chamber. %Gradually the kcLsolution is slowly lost, therefore a 'fillingport is-placed in this electrode so that.additional saturated potassium chloride
,.can be added.'
C Instrument Calibration
The pH balance control, by adding avoltage in series with ,the pH electrodesystem, allows the operator to adjustthe meter readout to conform to the pHof the .calibrating Ver. In general,calibrate the meter ih\the general range
of th, unknown solution: Appropriatebuffers can be selected (pH 4.0, 6. 8,7.4 and 10.0). Always set'theperature compensator on the instrumentto the temperature of the standard ~buffersolution.
For most accurate analYsie the pH of thesample should be determined, and thenbuffered solutions of,a pH above andbelow the determined pH should be ,
Mt,
selected to re-calibrate the instrumentand'the determination of the pH of thesample repeated for g final reading.
D Precision and Accuracy.,
The precision and accuracy attainablewith a given pH meter will depend uponthe type and condition of the instrument'employed andthe technique of standard-ization and opera ion. With the propercare, a precision of t 0.02 pH unit andan accuracy of t 0.05' pH unit can beachieved with many of the new andimproved models. However, ± 0.1 pH'unit represents the limit of accuracyunder normal conditions. For. thisreason, pH values generally should bpreported to the nearest 0. 1-pH unit.
E Maintenance Practices
The reference chamber of the pHelectrode system should always be keptnearly full of saturated kcL solution.Routinely check the level and saturationof potassium chloride in this referencechamber and add saturated kcL ifnecessary. t.
The pH sensitive glass membranedehydrates when removed-from water,and -.thus it is imperative thelectrodes be soaked in buffor several hours before usavoid this break-in period althe glass pH sensitive membrbetween periods of use.
t dryr or water
. Toays keep
e wet
The buffers are pH standards; do notcontaminate theme
If the meter is a battery operatedinstrument. To conserve the battery
theinspument should be turnedofrwhen not in use.
N
PROCEDURE
In the measurement of pH values of industrialwastes, effluents, sludges and similar' 1

- Operating Characteristics and Use of he pH Meter '
samples, the electrodes must be thoroughlyrinsed with buffer solution between samplesand after calibrating. Buffer solutions can
qbe prepared by use of the formulations shownin Table. I.
The electrodes should be kept free of oiland grease'and stored in water when, not
use. In testing samples containing gaseousor volatile components which affect the pHvalue, any handling technic such as stirringor heating may cause loss of such componentthand thereby intveduce error. For example,the loss of carbon dioxide from an anaerobicsludge digester sample due to stirring willresult in an observed pH value which is too
Table I
Preparation of pH Standa.rd Solutions
Standard Solution (Molality) pH at 25°C
Primary standardsPotassium hydrogen tartrate
(saturated at 25°C) 3.'557 .,
0.05 potassium dihydrogen citrate 3.776
0.05 potassium hydrogen phthalate 4.008
0.025 potassium dihydrogenphosphate + 0.025 disodium
. hydrogen phosphate . 6.865 °
0.008695 potassium dihydrogenphbsphate + 0.03043 disodium 'hydrogen phosphate ; 7.413
B, 9.1800.01 sodium borate decahydrate
(borax)
0.025 sodium bicarbonate + 0.025sodium carbonate4
Secondary Standards
10.012
0.05 potassium tetroxalate dihydrate 1.679
Calcium hydroxide (saturated at 25°C) 12.454
, Weight of Chemicals Needed per 1,000. ml of Aqueous Solution at 25°C
6.4gKHC41-1406*
11.41g1(112C6H507
10. 12gKHC8H4O4
3.388i1CH2PO4
t + 3.533 gN a2HP04tt
1.179gICH2PO4t + 4.302gNa2HPO42
3.80gNa2A407' 10H2O '
2.092gNaHCO3 + 2.640gNa2CO3
1.2:61gKH3C408-21i20
1.5gCa(OH)2*
*Approximate solubility
tDry cheinical at 110-130°C for 2 In:er
tPrepare with freshly boiled and cooled distilled water (carbon dioxide-free)
153 16-3
a
Operating Characteristics and Use pf the pH Meter
high. If a sample of sludge or mud is highlybuffered, a small amount of water may beadded but the result cannot be considered <
valid unless further dilutions yield the samepH value. All dilutions should be 1. eported'along with the, result.
REFERENCES
1 Nebergall, W.H., Schmidt, F. C. andHoltzclaw, Jr. , H. F. College Chem.,2nd Ed. Heath and Co., Boston, 1963.
2 Sawyer, C. N., and McCarty, P. L.Chem. for San. Eng. 2nd Ed.McGraw-Hill? New York 1967
18 -4
3 Instruction - Manual IL 175 Porto -matic:pH meter, Instrumentation Laboratory,Inc. Lexington, Massachusetts,Standard Methods, APHA -AWWA- WPCF..14th Ed., 1975.
This outline was prepared by P. F. Hallbach;Chemist, National Training Center, NationalTraining and Operational Technology Center,OWPO, pSEPA, Cincinnati, Ohio 45288.
Descriptors: Hydrogen Ion Concentration,Instruzrontation, Chemical Analysis
15.1

a
INTRODUCTION
TURBIDITY
Turbidity as a'water quality index refersto the degree of cloudiness 'present.Conversely, it is an index of clarity.
r%
A Definition(1)
C
Turbidity is an expression of the opticalproperty that causes light to be scatteredrand absorbed rather than transmitted instraight lines through samples of water.
B Relationship to Suspended Solids
This optical property, turbidity, iscaused by suspended matter. The size,shape and reflection/absorptionproperties of that matter (not its weight)
.,determine the degree of optical effects.It is very possible to have water withhigh turbidity but very low mg/L sus -pended solids. Thus one cannot ugeturbidity results to estimate thd weightconcentration and specific vity of thesuspended matter.
C Causes
1 clay, sand
2 silt, erosion products
3 microscopic and macroscopicorganisms
4 finelydivided organic products
6 others
D Effects on Water (2)Quality.
Turbidity is an indicator of possiblesuspended matter effects such asimpeding effective chlorine disinfectionand clogging fish gills. Hoitever, thefollowing list is liritited to those effectsassobiated with the optical (clarity) _
nature of turbidity.
*"
I Reducing clarity in water
abcde
drinking water qualityfood processingindustrial processesfish (seeing natural food)swimming/ water, sports
2 Obscuring objects in water
a Submerged hazardsb water sports
3 Light penetration
a affects depth of compensationpoint for photosynthetic activity(primary food production).
4 Thermal Effects ,
_ --High turbidity causes near surfacewaters-tci-become'heated because ofthe heat absorbancy of the particulatematter.
a Results-in lower rate of oxygenResults-from air to water.
b Stabilizes water column andprevents vertical mixing.
1 decreases downward dispersionOf dissolved oxygen
2 decreases downward dispersionof nutrients
E Criteria for Standards(2):
1 Finished Drinking Water - Maximulnof one unit where the water enters tIkedistribution system: The proposed'standard is one unit monthly average andfive units average of two consecutive days.Under certain conditions a five unitmonthly average may apply at state option.
2 For Freshivater Aquatic Life"andWildlife - The combined effect of cOlorand turbidity should not change the
17-1
-41
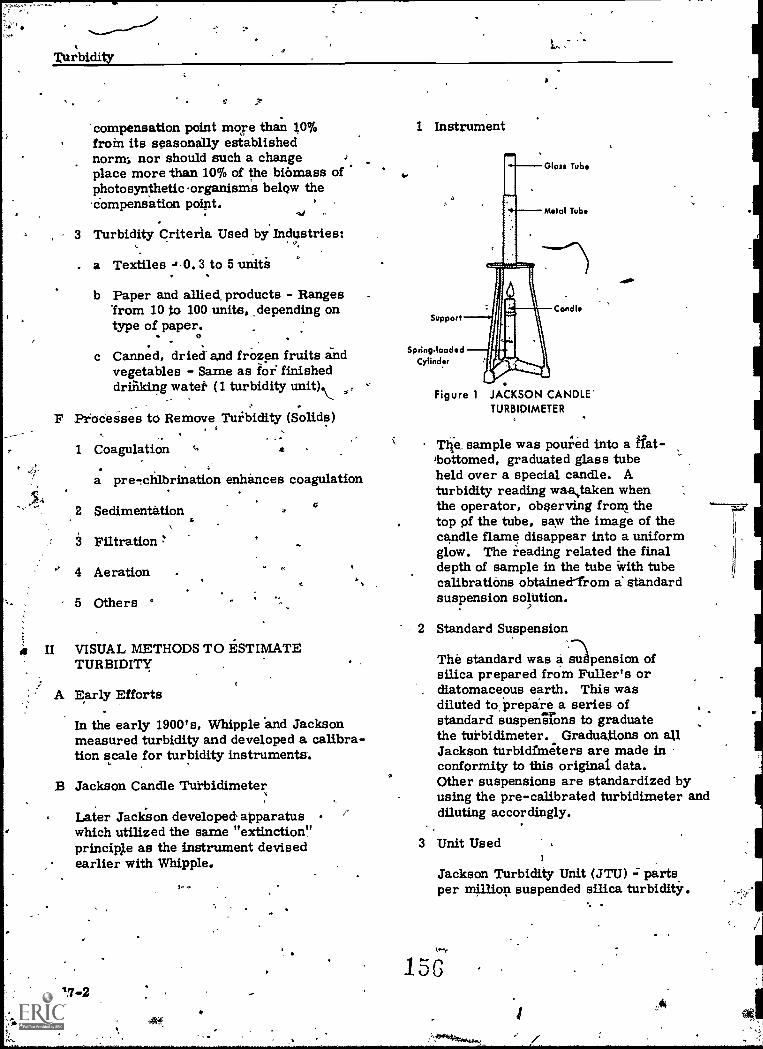
.4,
Turbidity
'compensation point more than 10%froth its seasonally establishednorms nor should such a changeplace more than 10% of the biomass ofphotosynthetic organisms below the'Compensation point.
,
, = 3 Turbidity Criteria Used by Industries:
a Textiles -1.0.3 to 5 unite
b Paper and allied, products - Ranges*from 10 to 100 unite, .depending ontype of paper..
c Canned, dried" and frozen fruits andvegetables - Same as for finisheddririldrig watef (1 turbidity unit).\,,
F Processes to Remove Turbidity (Solids)
1 Coagulation
a pre-lchlbrination enhances coagulation
2 Sedimentation
3 Filtration :*
4 Aeration
5 Others
II VISUAL METHODS TO ESTIMATETURBIDITY
A Early Efforts
In the early 1900's, Whipple and Jacksonmeasured turbidity and developed a calibra-tion scale for turbidity instruments.
B Jackson Candle Tuitidimeter
Later Jackson developed apparatuswhich utilized the same "extinctionprincip'e as the instrument devisedearlier with Whipple.
17-2,
1 Instrument
Support
Gloss Tub
Metal Tube
Spring.looddCylinder
Condl
Figure 1 JACKSON CANDLE'TURBIDIMETER
Vie, sample was pou;ed into a dat-tottomed, graduated glass tubeheld over a special candle. Aturbidity reading waajaken whenthe operator, observing from thetop of the tube, saw the image of thecandle flame disappear into a uniformglow. The reading related the finaldepth of sample in the tube with tubecalibrations obtaineerrom a standardsuspension solution.
2 Standard Suspension
The standard was a suspension ofsilica prepared from Fuller's ordiatomaceous earth. This wasdiluted to, prepare a series ofstandard suspensions to graduatethe turbidimeter. Graduations on allJackson turbiameters are made inconformity to this original data.Other suspensions are standardized byusing the pre-calibrated turbidimeter anddiluting accordingly.
3 Unit Used
Jackson Turbidity Unit (JTU) = parts.per million suspended silica turbidity.
1
Turbidity
4 Standardization of Apparatus
The current edition of Standard
Kethods (1) contains specificationsfor the three essential components,,i. e., the calibrated glass tube, the,candle and a support.
5 Current Standard SuspensionSolutions(1)
1 Natural turbid water from the same`source as that tested gives bestresults. Determine turbidity withthe instrument, then dilute to valuesdesired.
2 The supernatant of a settled solutionof kaolin is also used as a standard.
- r
6 Limitations of Method
a Apparatus - difficult to exactlyreproduce flame as to intensity and'actual light-path length. In general,it is a rather crude instrument withgeveial variables that affect abcuracY.
b Very fine suspended particles do nottend to scatter light of the longer.wavelengths produced by the candle.
Very dark and black particles canabalorb enough light in comparisonto the scattering of light.to causeen incorrect reading of iMageextinction.
d Turbidities beloW 25 JTU cannotbe directly Measured. For lowerturbidities (as in treated waters),indirect secondary methods arerequired to estimate turbidities.
C Turbidimeter(4)
This instrument utilizes Ahe sameextinction principle asthe JacksonCmdle Turbidimeter.
1 Equipment
An opal glass bulb supplies the lightwhich is reflected (usually through a
157
1hef er) upward through the sample
hich is contained in a glass tube.entire system is enclosed in a ,,
ack metal box. The operator viewse sample by looking downward through
an ocular tube screwed into the top ofthe box and adjusts the-brightness of acentral field of light by turning acalibiated dial on the .outside of theapparatus. The point of uniform lightintensity occurs when a blaCk spot in. '''.
the center of the field just disappears.
2 Range of Applicability
The equipment offers a choice of bulbs,filters and volumes of sample tubes.The variety affords a means to directlymeasure turbidity ranging from 0 through150. The ranges can be extended bydilution.. ,e
3 Results
The final reading from the dial istranslated into ppm silica turbidity unitsby using a graph corresponding to thebulb, filter and volume of sample used.
4 Standard Suspension Solution
Standardizing suspensions are not usedby the operator. The graphs aresupplied by the campany for eachinstrument.
D Secchi Disk(6)
This is a very simple device used inthe field to estimate he depth of visibility(clarity) in water.
1 Equipment
The disk is a weighted circular plate,20 cm in diameter, with blackand white quarters painted on the surface.The plate is attached to a calibrated lineby means of a ring on its center to assurethat it hangs horizontally.
2 Readings
The disk is lowered into water until'it disappears, lowered farther then
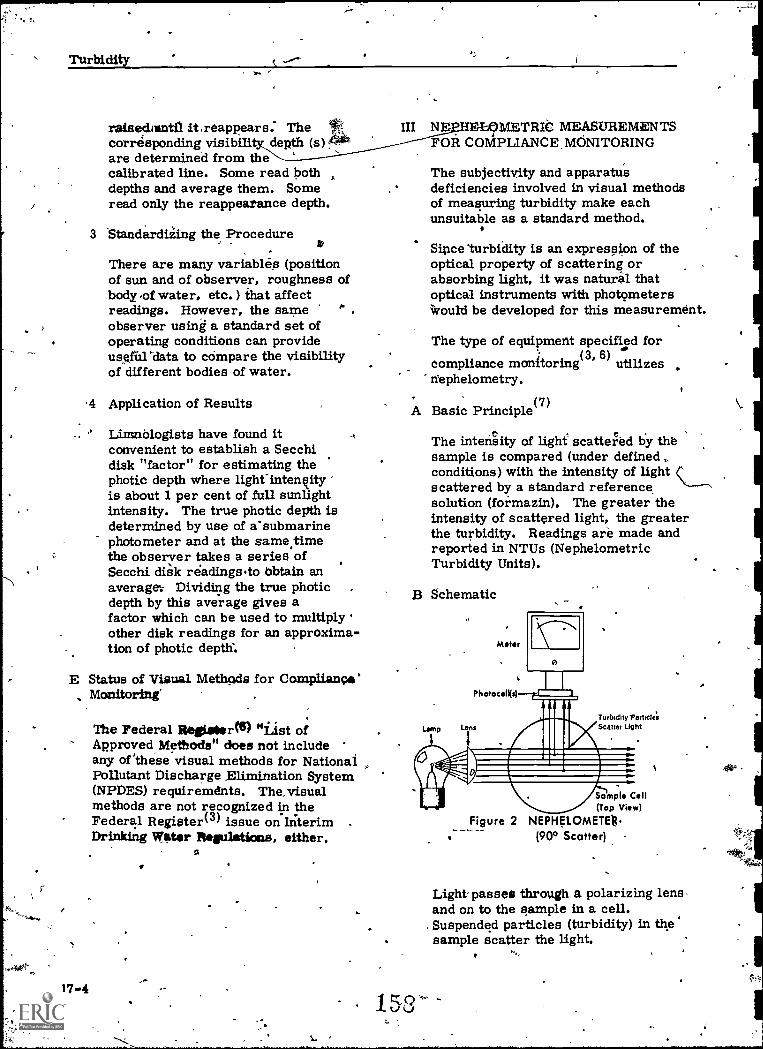
Turbidity
raisednuatl it ,reappears: Thecorresponding visibili depth (s)4*are determined from thecalibrated line. Some read bothdepths and average them. Someread only the reappearance depth.
3 'Standar diling the Procedure
There are many variables (positionof sun and of observer, roughness ofbody of water, etc. ) that affectreadings. However, the sameobserver using a standard set ofoperating conditions can provideuserurdata to compare the visibilityof different bodies of water.
4 Application of Results
Liraublogists have found it .t
convenient to establish a Secchidisk "factor" for estimating thephotic depth where light-intenqityis about 1 per cent of full sunlightintensity. The true photic depth isdetermined by use of a'submarinephotometer and at the same timethe observer takes a series of.Secchi disk readings.to Obtain anaverage: Dividing the true photicdepth by this average gives afactor which can be used to multiplyother disk readings for an approxima-tion of photic depth.
E Status of Visual Methods for Compliant`Monitoring'
17-4
The Federal Regiseer(g) "List ofApproved Methods" does not includeany of 'these visual methods for NationalPollutant Discharge Elimination System(NPDES) requirements. The, visualmethods are not recognized in theFederal Register(3) issue on InterimDrinking Water Regulations, either.
III NE METRIC MEASUREMENTSFOR COMPLIANCE, MONITORING
The subjectivity and apparatusdeficiencies involved in visual methodsof measuring turbidity make eachunsuitable as a standard method.
Since `turbidity is an expression of theoptical property of scattering orabsorbing light, it was naturil thatoptical instruments with photometerswould be developed for this measurement.
The type of equipment speci%ed for
compliance monitoring(3' 6) utilizesn'ephelometry.
A Basic Principle(7)
The intensity of light scattered by thesample is compared (under definedconditions) with the intensity of lightscattered by a standard referencesolution (formazin). The greater theintensity of scattered light, the greaterthe turbidity. Readings are made andreported in NTUs (NephelometricTurbidity Units).
B Schematic
Lamp
Turbidity Patticle'sLens Scoter Light
Figure 2
Sample Cell(Top View)
NEPHELOMETre(90° Scatter)
Light passes through a polarizing lensand on to the sample in a cell.Suspended particles (turbidity) in thesample scatter the light.
15-P/'
PhotocelL(s) detect light scattered byparthIlescat a 90° angle to the path
of the incident light. This lightenergy is converted to an electricsignal for the meter to measure.
1 Direction of Entry ofIncidentLight to Cell
a. The lamp might be positioned asshown in the schematic so thebeam enters a sample horizontally.
b Another instrument design has thelight beam entering the sample(in a flat-bottom cell) in a verticaldirection withiche photocellpositioned accordingly at a 90°angle to the path of incident light..
2 Number of Photocells
The schematic shows the photocell (s)at one 90 degree angle to the path ofthe incident light. An instrument'might utilize more than one photocellposition, with each final position beingat a 90 degree angle to the sample
3 Meter Systems
a The, meter might measure the'signal from the scattered lightintensity only.
b The meter might measure thesignal from a ratio of the scatteredlight versus light transmitteddirectly through the sample to aphotocell.
4 Meter Scales and Calbration
a The meter may already becalibrated,i.n l'iTUs4 In this case,at least one standard is run ineach instrument range to be usedin order to check the accuracy ofthe calibration scales.
b If a pre-calibrated scale is notsupplied, a calibration curve-is.preparedlor each range of theinstrunieneby using appropriate
'.dilutions of the .standard turbiditysuspension.
Turbidity
C EPA Specifibati6ns for Instrument Design(7).
Even-when the same suspension is usedfor calibration of different nephelomethrs,differenpes in physical design of theturbidimeters will cause differences inmeasured values for the turbidity of thesame siimple. To minimize such differences,'the following design ,criteria have beenspecified by the U. S. Environmental ProtectionAgency,
1 Defined Specifications
a Light Source
Tungsten lamp operated at a colortemperature between 2200-3000°K.- ;
b Distance Traveled by Light
The total of the distance traversedby the incident light plus scatteredlight within the sample tube shouldnot exceed 10 cm. '
c Angle of Light Acceptance of theDetector
Detecttr'centered at 90° to the'incident light path and not to exceed+30° from 90°P.
The detectOr, and filter system ifused, shall have a spedtral peakresponse between 400 and 600 nm.
d Applicable RangeI
The maximum turbidity to bemeasured is; 40 wilts. Several rangeswill be necessary to obtain adequatecoverage.6,,Use dilution forisamples iftheir turbidity exceeds 40 units.
2 OtherEPA Design Specificationir
a Stray Light
Minimal stray light 'should reach the ,detector in,the absence of turbidity.
15917-5

-
Turbidity
Some causes of stray light reachingthe photocell (sal are:
1 Scratches or imperfections inglass cell windows.
2 Dirt, film or condensation on theglass.
3 Light leakages in the instrumentsystem.
A schematic of these causes isshown in Figure 3.
4
turbidity differences( of 0.02 unit-or less. Several`ranges will benecessary to obtain sufficientsensitivity for low turbiditie,s.
3 Examples of instruments meeting thespecifications listed In l'an'd 2 aboveinclude: . r"
a Hach Turbidimeter Model 2100 and2100A
b Hydvcdlow Instruments DRT 100, 200,and 1000
Meter \ t Other urbidimeters(12) meeting thelisted pecifications are alsoaccepts le.
D Sources of 'Error
Light Leakagefrom Lens System
Lamp'
Photocell(s)
Light Lookage fromTronimitted Light
Light Scatter by glass tube
(Top Wow)
.Figure 3 NEPHELOMETER
SOURCES OF STRAY LIGHT
Stray light'error can be as muchas 0.5 NTU. Remedies are closeinspection of sample Cells forimperfections and dirt, and good
- design -which can minimize theeffect of stray light by controllingthe angle at which it reaches thesample. -
b. Drift.
The tu'rbidimeter should be freefrom significant drift after a shortwarm-up period. This is imperativeif the analyst is relying on a menu-facturert s solid-scattering standardfor setting overall instrumentsensitivity for all ranges.,
c Sensitivity
In raters having turbidities less. thanone unit, the instrument should detect
1 Marred Sample Cells .
a Discard scratched or etched cells:
b Do not touch cells where lightstrikes them in instrument.
c Keep cells scrupulously clean, insideand out. "6. )
1 Use detergent solution.
2 Organic solvents may also be
3 Use deionized water rinses.
4 Rinse and dry with alcohol or.acetone.
2 Standardizing Suspensions (7)
166..= 0
a Use turbidity - free water forpreparations. Filter distilled waterthrough a 0.45 pm pore Si2ig membranefilter it such: filtered water shows alowereturbidity than the distilled water.
b Prepare a new stock suspension ofFormazin each month.
c Prepare a new standard suspension'and, dilutions of Formazin each week.

9
Turbidity ,
3 Sample Interferences
a PositiveI
1 :Finely..divided air bubbles
b Negative
1 Floating debris
2 Coarse sediments (settle)
3 Colored dissolved substances(absorb light)
E Reporting Resillts(P
A Natural Materials
1 Diatomaceous Barth
2 Fuller's 'earth .
3 Kaolin
4
4 Naturally turbid waters
Such suspensions are not suitableas repi.oducible standards because_ thereis no way to control the size of thesuspended particles. ,
B Other Materials
NTUa
Record to Nearest:
0. 0-1. 0 0.05
1-10 0. 1
10-40 .1
40-100 5
100-400 10C
400-1000 50
>1000 100
F Precision and d Accuracy(7)
1 In a single laboratory',(MDQARL),using surface' water samples atlevels of 26, 41, 75 -and'.180 NTU,the standard deviationa-Were + 6.60,+ 0. 94, + ,1.2' and 401.7 units,respectively..
2 Accuracy'datais not available atthis time: _
, 3
IV STANDARD SUSPENSIONS AND RELATED
, UNITS(9)
One of tie critical problems in measuringturbidity has been to find a material whichcan be made into h reproducible suripen,-sion witli_untform sited. Particles., Variousmaterials have -beenused,
1 Ground glass
2 Microo isms
3 Barium sulfate
4 Latex spheres
Suspensions of these also provedinadequate.
Formazin
1 A pol7merformed by reacting hydrazinesulfate and hexamethylenetetrathinesulfate.
'2 It is Tnore reproducible than previously-used standards. Accuracy of + one percent for replicate solutions has beenreported..
3 In 1958, the Association of AnalyticalChemists initiated a standardized system
turbidity measurements for the brewingindustry by:, aak
16.E
a defining a -standard formula for makingstock Formazin solutions and
b designating a unit of measurementbased on Formazin, i.e., the Formazin,Turbidity Unit (FTU).
4 During the 960's Fovirbemin was increasing-ly
.used for water quality turbidity testing. .
It is thi currently recognized standard forcompliance turbidity measurements.
17-.745,'
it

Turbidity
t Units
1 At first results were translatedIto Jackson Turbidity Units(JTU). However, the JTU wasderived from a visual measurementusing concentrations (mg/liter) ofsilica suspensions prepared byJackson. They have no directrelationship to the intensity of .light scattered at 90 degrees ina nephelometer.
2 For a few ytars, results of --nephelometric measurementsusing specified Formazin ,standards were reported directlyas Turbidity Units ,(TU's).
3 Currently, the unit used is namedaccording to the instrument used formeasuring-turbidity. SpecifiedFormazin.standards are used tocalibrate, the instrument and resultsare reported as NephelometricTurbidity Units (NTUs).
TURBIDITY MEASUREMENTS FORPROCESS CONTROL
The schematic and design characteristicsdiscussed above for nephelometricinstruments is the required method formeasuring turbidity for compliancepurposes. Turbidity'data is also widelyused to check wq.ter for process 'designpurposes and to monitor water for processcontrol purposes. "-The nature 'of theliquids to'be monitored, and the degree ofsensitivity required for signalling theremedy to be applied have led to-thedevelopment of monitoring instrumenta-tion that differs in design or in principlefrom reviously described.
A Users of Control Data
I Potable. Water Treatment Plants..Pe
2. Municipal .Wastewater TrOari Plantsf
3 Industrial Processers
B Applications of Control Data (10, 11)
1 Coagulation Processes,o
To check the effectiveness ofdifferent coagulants.
r3 b To check the effectiireness ofdifferent dosages.
c To regulate chemical dosages byautomating chemical feed controls.
2 --Settling Processes
a
b
c
To determine intermittent need forsettling processes.
To control the sludge blanket heightin activated sludge treatment processes
to activate removal and re-cycling ofvery high density sludge from settlingjtanks.
d mcpitor effectiveness of settlingprocesses. .
3 Filtration Processes
a
b
c
d
e'
To determine intermittent tleedfor filtration.
To facilitate high rate filtrationpibcesses. ,
To prevent excessive loadings forfiltration systems. *:
To check the efficiency of filtrationsystems.
V
egulate filter backwash operations.
4 Rust in Water Di'stribution Sistems-.
a To-locate sources of contamination:
b To monitor intermittent occurrences.
5 Steam Boiler Operatiofis
a To detect corrosion products inboiler water.

.s--
Turbidity;
b . To detect evidences of corrosionin condensates.e
-c To deterMine the effectiveness of .corrosion treatment measures.
C Varieties of Instrumentation
1
1.. Surface Scatter Nephelometera
In forward - scattering instruments ,the angle of the incident light isadjusted to illuminate the surfaceof a smooth flowing liquid at an angleof about 15 degrees fr.om,hbrizontal;rather than beamed through a glasscell of the liquid as described forne,pheloroeter earlier in this outline.A photocell is located immediatelyabove the illuminated area so thatvertically scattered light from iss,._turbidity in the sample reaches it.
Meter
s
Turbid Path lay -PhatacelksiScaler Light
,r 'r
AFlavong Watts. Suds*
t,
T0,0 rain
4
ILan! Larnp.of' .
'
7.
Figure 4 NEMELOMVElb (aLf4ce Stutter)- 4
'. . .. <, e-or /
t ; ,\.
Variatipna of tlmethldOloky' include sidescatter 4n. 13ackscatter
'designs. 4% 4).:.. a, '
-1. 4' 1F.4
li Advantages,. it . A.. -'). . 6 : = - .
-1 Nofgas sample cells are`used. , Attendant problems ofcleanliness and condensation ..a4 -e eliminated. The surfacetit the ;ilia PrOvides a/near.. ;perfect pptical surface Which. :' i,
. -
A :'" it. ..rt.
, .
0
I 4
e4
er
is difficult to-acbieve in glass cells.
2 Stray light effects on the photocell,are minimized because the simpler
sign eliminates some of the sources,of stray light.
3. Since flowing sample is used,interferences from air huhh14s _and/
, on floating materials are quickly,
eliminated. '
4 This design is sensitive to the presdnoieof larger. suspended particles.
1
..b Disadvantage
. .
:As turbidity, becomes' high, penetrationof incident light decreases to cause a(falling off of response.
g
2 Absorption Spectrophotometry ,
,The incident light is beantred throughSmooth, flat stream of sample and thetransmitted light (in contrast tonephelometric scattered light) is measuredby a spectrophotometer., \A schematicis shown in Figure 5.
Lens
Turbidity Particles Absorb Light
"Flowing-Water Pholocelkd Matta
Frgure 5 ABSORPTION SPECTROPHOTOMETRY
a Advantages
1 No glass, sample .cells4
ins simpler design eliminate&° sources oP stray light.
.3 .Applrcable to measure high
turbidities, e. g. ,in sludges.*
.° TIrsa.dvantage
ti
A40140'
1 Lbw sensitivity for many applications.
. .2 Colocorptituents interfere.I
16 17-Es1
,
Turbidity'
IVI SUMMARY'
Turbidity measurements represent theoptical property of light scattering bysuspended solids. NTUs are an indexof the effectic of the size, etc., ofsuspended particles but ciannOt be usedto indicate mg/L quantities of those /particles, The parameter is requiredlc* finishegipottable wateroand is extreme-ly useful- in 4ference to aesthetic quality(Clarity), photic conditions and thermaleffects in bodies of water.' It is alsowidely applied for process control ofwater and wastewater treatment andof industrial processes.
There have been difficulties-in devela satisfactory standard method fo s.measurement. Earl 3)- methods dependedon a subjective judgement of an extinctionpoint where transmitted light balancedscattered light in rather prude apparatus.Although the apparatus was refined and .standardized to a large extent, thesubjectivity of these visual methods was ,*
still an unsatisfattoryielement of suchmethodology.
g
Eve_ ntually, optical instrumentation wasloped to eliminate subjectivitythe measurement. NepheloInet7
(sca ering) was chosen for the standardnietho d EPA has specified '
several strument designcritefia to,further pro ote standardiiation of the
easurement. ,rx ,
Findi3sg 'a suitable (reproducible)standard' suspension has also been aprOblem., Currantly, Formazin isspecifieefis the stan,dard because, todate, it is More reproducible thanotiv.sispendbxe proied to be.
. ,
Establishing a meaningful unit progressedalong with development of instruments.-
tion-and agreement on a standard '. suspension, The current unitiNTU) is
deri d from the method of measurement;nephelo etry, and use of a standard.,Formazin suspendion.
R Even with the efforts to standardize
17.10
V
.instrum ent design, to find a suitablestandard, suspendionr-and to agreeon a meaningful unit, there are stillproblem* abotit this measurement.,Instruments meeting the' design
' criteria add standardized withFormazin suspensions-canturbidity readings differingsignificantly for the same sample.
AI1Q 41 er problem area-is-associated-with sample dilutions. Work he.k,
- indicated a progressiveserror ' on
sample turbidities in excess of 4 units)so such- samples are to be diluteHowever, obtaining 4, dilution exactlyrepresentative of the originalsuspension is difficult to achieve.Thus dilutions often significantly failto give linearly decreased-results .z
when re- measured.
REFERENCE$
1 APHA, AWWA,' WPCF, Standard Methodsfor thg Examination of Water and-.Wastewater, 14th ed., APHA;
' - 1976. -
2 National Academy of Sciences,. NatioAcadethy of Engineering, 1974 EPArevision of Water Quality Criteria,.197?, EPA, GPO, Washington, D20402, # 5501T00520.
3 U. S. Government,..,Code of FederalRegulations, Title 40, Chapter'1,Part I4.1 . National Interim PrimaryDiVking Water Regulations, publishedin tfie Federal Register, Vol 40, No. 248,Wednesday, December 24, 1975.'
164
4 Hellige, Inc. . ..Graphs and Directions forHellige Turbidimeter, Garden City,NY, Technical Information #8900,
5- Lind, 0. T. , Handbook of Commonielethods in Limnoliogy, Mosby, 1974.
6 'U. S. Government, 'Code of FederalRegulations, `itle,.40, Chapter 1,Part 136 - Guidelings EstablishingTest ProcedUres for the Analysis ofPollutants, published in_the FederalRegister, Vol 41, No. 232, Wednesday,December 1, 1976.
v7 Methods for Chemical Analysis of
Water and Wastes, EPA -.411,1,SL_Cincinnati, Ohio. 45268, 1979.i.
. \.
8, Analytical Quality Control in Water andWastewater Laboratories, EPA -AQCL, Cincinnati, Ohio, 1972.
9 . News and Notes frit. the Analyst, HachChemical Company, Ames, Iowa,Volumft 1, No. ,3.."
1-10 Sawyer 'and McCarty, Chemist forSanitary Engineers, McGraNY, .1967.
11 Turbidimeters, Hach Chemical Company,Ames, Iowa, fifth Revised Edition,1975.
12 (Bausch and Lomb,,and Turner of Californiaare additional examPles (9/77) of modelsmeeting the listed specifications.
O.
Turbidity
This outline was prepared by' Aucitey D.Kroner, Cheist, National Trainkng.andOperational technology Center, MOTD,OWPO, USEPA, Cincinnati, Ohi6 45268
Descriptors: ChemCcal Analysis,Instrilmentation, Secchi disks, Turbidity,Wastewater, Water Analysis
165
P
CALIBRATION AND USE OF A TURBIDIMETEH (NEPHELOMETER)
I REAGENTS(1)
'A Turbidity - free water - Pass distilledwater through a 0.45 urn pore sizemembrane filter if such filtered watershows a lower turbidity than the originaldistilled water.
B Stock Turbidity Suspension 400 units
1 1 Directions are for preparing 100.0 ml.Larger volumes may be required.
2 Solution, 1: Dissolve 1.00g hydrazinesulfate, (NH2)2 H2504, in turbidity
free water and dilute to 100m1 in avolumetric flask.
3 Solution 2: Dissolve 10.00g .hexamethylenetetramine in.turbidity-free water and dilute to 100m1 in avolumetric flask.
4 Suspension: Mix 5. Oigil Solution 1with 5. Oml Solution 2 in a 100 mlvolumetric flask. Allow to stand for24 hours at 25 + 30C.- Dilute to themark and mix.
5. Stability: Prepare a new stocksuspension each month.
C Standard Turbidity Suspension - 40 units
1 Dilute 10.00M1 stock turbiditysuspension to 100m1 with turbidity -free water in a 100 ml volumetric flask.The turbidity is defined.as 40 units.
2 Stability: Prepare a new standardsuspengiorveach week.
4.
D Dilute Standard TurbiditySuspension4 units
1 Dilute 1.0 ml 3tock turbiditysuspension to 100 ml with turbidity-free water in a 100 ml volumetric
3.
fla,,t3k. The turbidity should be 4 units.
2 Stability: Pfepare a new standard'. suspension each week.
E Secondary Standards
1 Solutions standardized_with Formazincan be purchased from the manufacturerof the instrument.
2 Date such.soluticins. Store under theconditions 'specified. Discard andreplace when flocculation thesolution is observed hywhen it failsa periodic check with a Formazin Standard.
(2)(3)II PREPARATIONS FOR MEASUREMENTS
A Suspensions
1 Check /elate of preptaton and pre-pare fresh solutions if required.
B Sample Cell0)
'1 Cells should be cleaned immediatelyafter use as described in V. B. below.,
2 Inspect cells for cleanlinebs. If ,necessary, 'clean them using,V. B. belovi.
3 Check cells for scratailes and etching.Discard those with imperfections.
C Instrument
2
Scale - If a scale is inserted, checkthat it is in the correct position. Ifthe scale is blank, construct at'calibration scale for each range on'the instrument. (See III B).
Zero - Adjust meter needle to zeropoint on scale as directed by manufactuer.
3 Lens,- Check for cleanness. If required,follow manufacturer's instructions for,removing and cleaning the lens.Accurate re-positibning-of the lens iscritical for accurate measurements.
CURB. lab. 1.11.80N
16610
18;1 /
i±. 'r,s,

Calibration and Use o a Turbidimeier (Nephelometer)
4. Warm-Up Period - followmanufacturer's instructions.Continuous running is often suggestedbecause of the photomultiplier tubes.
5 Focus = Use template or methoddescribed by manufacturer to checkand, if necessary, set the focus.
D Determine Range of Sample Turbidity
1 Use steps 5 thro9.gh 16 in III A belowEXCEPT Step 12 which should be:Obtain a turbidity reading fromscale.
2 Note which Range (instrument scale)best "brackets" the turbidity of eachsample.
3 If the'turbidity of a sample exceeds40 units, use the higher scales pro-vided to determine the dilution requiredso the final reading will be,below40 units. For final measurements, usethe Range (Scale) appropriate for'thediluted sample:
III INSTRUMENT CALIBRATION AND
MEASUREMENTS(1)
A Pre-CalibratedScale
1' Each week, prepare at least onestandard for the required instrumentrange (s) (as determined in II. D. above) .by diluting one of the'Formazinsuspensions deerazited abode in I. Aeaen s.The table below gives "EXAMPLEDILUTIONS".
2 Set the instrument RANGE knob atthe first range to be tested. (Theinstrument should be ON, warmed up,zeroed, etc., as in II C above).
3 Make any instrument adjustment specifiedby the manufacturer to use this RANGE.
4 Rinse the SAMPLE CELL 2 times withthe appropriate suspension (or sample).
5 Shake the suspension to thoroughlydisperse the solids. (For secondarystandards, checis the manufacturer'sinstructions for this step)
> .
EXAMPLE DILUTIONS..
.- .
NO.
. .
EXAMPLEINSTRUMENTRANGES VOLUME
TURilDITYSTANDARD
.,
FINALDILUTION
FINALTURBIDITY
1'. 0 - O. 1 / 2.5 MI 4 unit 100.0 ml 0. 1
2)
; 0 ml5 4 unit 100.0 ml 0.2
3 . .0 O. 3 7.5 ml 4 unit 100.0 ml 0. 3
, 4 ' 0 - 1 2.5 ml 40 13pit 100.0 ml 1
0 - 3 7.5 ml 40 unit 100.0 ml 3'
6 0 - 10 25.0 ml ; 40 unit 100'. 0.'mi. 10
'7 ' 0 - 30_ 7. 5-ml 400 unit 100.0 ml 30
'8 0 - 100 . 2 5 .m1 40,0 unit 100.0 ml 100
9 0 - 300 '75 ml 400 unit - 100.0 ml 300
0 - 400 . 100 ml 400-units _10Q.0 ml 400 ,
11 0 - 1000 100 ml 40'0 unit 100.0 ml 400
18.2 16
.4
'
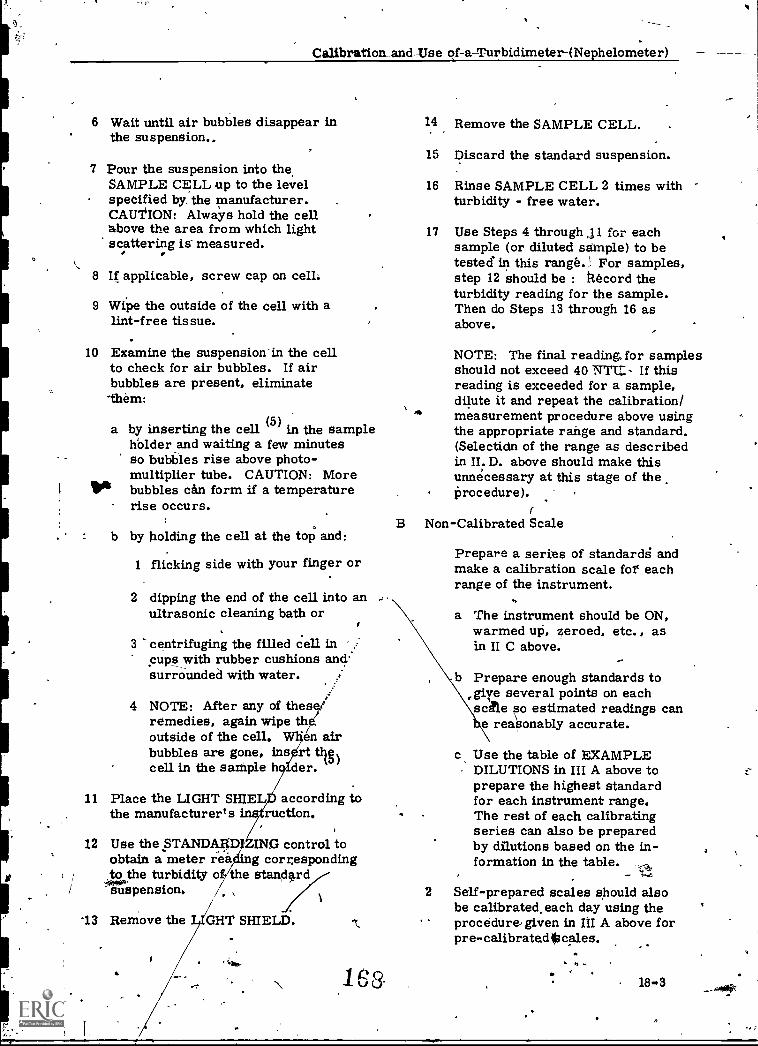
Calibration_and-Use-of-a-Turbidimeter-(Nephelometer)-
6 Wait until air bubbles disappear inthe suspension..
7 Pour the suspension into theSAMPLE CELL up to the levelspecified by. the manufacturer.CAUTION: Always hold the cellabove the area from which lightscattering is measured.
8 If applicable, screw cap on cell.
9 Wipe the outside of the cell with alint-free tissue.
10 Examine the suspension'in the cellto check for air bubbles. If airbubbles are present, eliminate
'them:
a by inserting the cell (5) in the samplehblder and waiting a few minutesso bubbles rise above photo-multiplier tube. CAUTION: Morebubbles can form if a temperaturerise occurs.
b by holding the cell at the top and:
1 flicking side with your finger or
2 dipping the end of the cell into anultrasonic cleaning bath or
3 centrifuging the filled cell incups with rubber cushions andsurrounded with water.
4 NOTE: After any of thesremedies, again wipe th ,
outside of the cell. 'en airbubbles are gone, ins rtcell in the sample h der.
11 Place the LIGHT SHIELD according tothe manufacturer's instruction.
12 Use the STANDARD ING control toobtain a meter rea g corresponding
-409,0"tO the turbidity 1/the stands.rdsuspension. /,
13 Remove the GHT SHIELD.
r. 163
14 Remove the SAMPLE CELL.
15 Discard the standard suspension.
16 Rinse SAMPLE CELL 2 times withturbidity - free water.
17 Use Steps 4 through 31 for eachsample (or diluted sample) to betested in this range., `. For samples,step 12 should be : Record theturbidity reading for the sample.Then do Steps 13 through 16 asabove.
NOTE: The final reading.for samplesshould not exceed 40 NTL.- If thisreading is exceeded for a sample,dilute it and repeat the calibration/measurement procedure above usingthe appropriate range and standard.(Selectidn of the range as describedin II. D. above should make thisunnecessary at this stage of theProcedure).
B Non-Calibrated Scale
Prepare a series of standardg andmake a calibration scale lot eachrange of the instrument.
a The instrument should be ON,warmed up, zeroed, etc., asin II C above.
b Prepare enough standards to,giye several points on eachsale so estimated readings can
e reasonably accurate.
c Use the table of EXAMPLEDILUTIONS in III A above toprepare the highest standardfor each instrument range.The rest of each calibratingseries can also be preparedby dilutions based on the in-formation in the table.
2 Self-prepared scales should alsobe calibrated, each day using theprocedure, given in III A above forpre-calibrated Obales.
'ft
183

Calibration-and-Use-of-a Turbidimeter (Nephelometer)
3 Self-prepared scales are used forsamples- in the manner described inIII A above for pre-calibrated scales.
IVjeALCULATION/RESULTS(1.)
A Diluted Samples
Multiply final sample readings by theappropriate dilution factor.
B1'Reporting Results
Report results as follows:
3 Observe stability times noted foreach in I. above.
B Sample Cells
NTU Report to Neardst:
0.0 - 1.0 0.05.
1 - 10 0. I
10 - 40 1
40 - 100 5C
100 - 400 - 10
400 - 1000 50
> 1000 100
C PreCisiah and Accuracy
1 In a single laboratory (MDQARL),using surface water samples atlevels of 26, 41, 75 and 180 NTU,the standard deviations were + 0.60,+ 0. 94, + 1. 2 and + 4.7 units,respectively.
2 Accuracy data is not available at thistime.
V STORAGE
A Standard Suspension's'
1 Store in glass containers at roomtemperature.
2, Excess agitt-or heat may. affectstability. ""y
18-4
1 So
1 Discard cells with scratches oretching.
2 Clean cells immediately after usewith this order of treatments: VI)
a detergent'
b organic solvents, if required
c deionized water
d alcohol or acetone rinses todry
e lint-free tissue, if required
3 Store in a manner to protect thecells from scratches.
Instrument 4.
1 A line operated instrument shouldbe,perrhanently located so movingit often is not necessary.
2 Turbidimeters should be protectedfrom dust, especially the lens system.
3 Store any removable :parts asdirected by manufticturer.
4 .Close any access doors./
5 Because of the photomultiplier tubes,the manufacturer may suggest con-tinuous running of the instrument toinsure maximum accuracy for mea--surements. Fi-equency of use candetermine the actual routine for warm-uptime.
6 Follow any other storage directionsin the manufacturer's manual.

Calibration and Use of a Tiiil-sidime er ep e ome er
REFERENCES
1 Methods for Chemical Analysig ofWater and Wasted, EPA-EMSLCincinnati, Ohio 45268, 1979,
2 Laborilory TurbiAiipeter, Model 2100A,Haan Chemical Co.:, 'Ames, Iowa,1973.
st,
3, Turbidimeters, Information CircularNo. 373A, Fisher Scientific,Company, Pittsburgh, IPA
4 Handbook for Analytical QualityControl, EPA-EMSL, Cincinnati.,Ohio 45268, 1979.
5 The orientation of the sample cell shouldbe identical each time it is placed inthe instrument. Mark the/cell andinstrument to ensure that the cell isoriented consistently. Use the samecell throughout the procedure.
......../-
This outline was prepared by Audrey D.Kroner, Chemist, National Training andOperational Technology Center,OWPO, USEPA, Cincinnati, Ohio 45268.
Descriptors: Analytical TechniquesLaboratory Tests, Turbidity
i
m
...11...,,
,____-_-,------
,S

CHEBECAL OXYGEN DEMAND AND COD/BOD RELATIONSHIPS
I DEFINITION
A The Chemical Oxygen Demand (COD) testis a measure of the oxygen equivalent ofthat portion of the organic matter in asample , that is susceptible to oxidationunder specific conditions of oxidizingagent, temperature and time.
,
B A variety of terms have been and are usedfor the test described here as COD:
1 Oxygen absorbed (OA) primarily inBritish practice.
2 Oxygen consumed (OC) preferred bysome, but unpopular.
3 Chemical oxygen demand (COD) currentpreference.
4 Complete oxygeii demand (COD)misnomer.
5 Dichromate oxygen demand (DOC)earlier distinction of the current pre-ference for COD by dichromate or aspecified analysis such as StandardMethods.
6 .Others have been and are being used.Since, 1960, terms have been generallyagreed upon within most professionalgroups as indicated 4n I-A and B-3 andthe explanation in B-5.
C The concept of the COD is almost as oldas the BOD. Many oxidants and Varia-tions in procedure have been proposed,Art none have been completelysatisfactory.
1- Ceric sulfate has been investibut in general it is not a ..strc$goxidant.
O. oc.:10f. 2.81
2 Potassium permanganate was one ofthe earliest oxidants proposed anduntil recently appeared in StandardMethods (9th ed: ) 'as a standard pro-cedure It is currently used inBritish practice as a.4-hr. test atroom temperature.
a The results obtained with peman-ganate were dependent upon concen-tration of reagent, time of oxidation,temperature, etc., so that resultswere not reproducible.
3 Potassium iodate or iodic acid is anexcellent'oxidant but methods employingthis reaction are time-consuming andrequire a very close control.,
4 A number of investigators have usedpotassium dichromate under a varietyof conditions. The method proposedby Moore at SEC is the basis of thestandard procedure. (1, 2) Statisticalcomparisons with other methods are.described. (3)
5 Effective determination of elementalcarbon in wastewater was sought byBuswell as a water quality criteria.
a Van Slyke (4) described a carbon\qetermination based onianhidroustitriples and mixed oxidizing agentsincluding sulfuric, chromic, iodicand phosphoric acids to obtain ayield comparable to the theoreticalon a wide spectrum of components.
Van Hall, et a1., (5) used a heatedcombustion tube with infrareddetection to determine carbon quickly,and effectively by wet sampleinjection.
6 Current development sh7Gvs a t end to41tatrwmental methods automating
t.
19-1
, I.
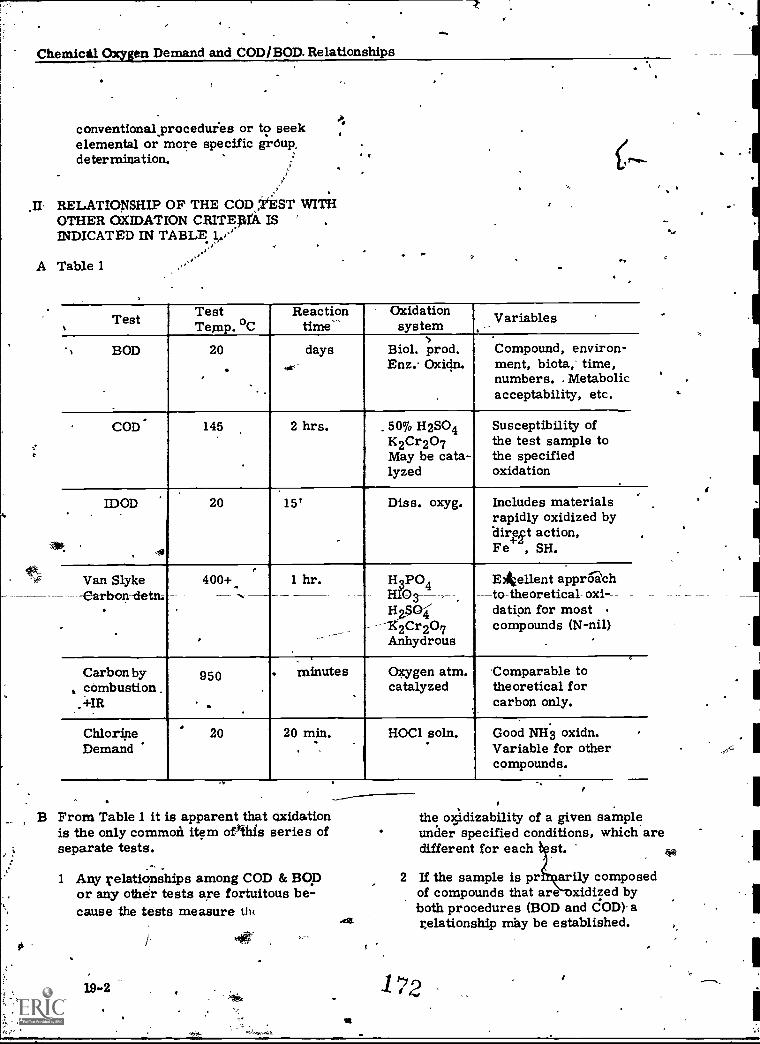
Chemical Oxygen Demand and COD/BOD. Relationships
conventional, sproceduies or to seekelemental or more specific group.determination.
X, RELATIONSHIP OF THE COD EST WITHOTHER OXIDATION CRITERIA ISINDICATED IN TABLE 1/
A Table 1e
Test Test°C.Temp
Reaction Oxidationsystem - Variables
', BOD 20
..
days Biol. prod.Enz. Oxidn.
Compound, environ-went, biota,' time,numbers.. Metabolicacceptability, etc.
COD' 145 2 hrs. . 50% H2SO4K2Cr207May be cata-lyzed
Susceptibility ofthe test sample tothe specifiedoxidation
IDOD.
20 15'
..
Diss. oxyg. Includes materialsrapidly oxidized byair:ft action,Fe , SH.
.
.
Van Slyke 400+ .0
1 hr. H PO120 4
.
Eliellent approachto-theoretical oxi----Carbon -detni . 3- ,
1-12$04-K2Cr207Anhydrous
dation for mostcompounds (N-nil)
Carbon by, combustion .
4.1R..
950
.
.
minutes Oxygen atm.catalyzed
Comparable totheoretical forcarbon only.
,
ChlorineDemand
.20 20 min.
.. HOC1 soln.
.Good NH3 oxidn.Variable for othercompounds.
B From Table 1 it is apparent that oxidationis the only common item ofihis series ofseparate tests.
1 Any relationships among COD & BCDor any other tests are fortuitous be-cause the tests measure th(
19-2
the csidizability of a given sampleunder specified conditions, which aredifferent for each st.
Art*
2 If the sample is pr arily composedof compounds that are xidized byboth procedures (BOD and COD)- arelationship may be established.
1;w

4
chpn_Aegil_ Demand and COD /BOD Relationships
a. The COD procedure may be sub-stituted (with proper qualifications)for BOD or the COD may be usedas an indication of the dilutionrequired for setting up BODanalysis.
b If the sample is characterized by apredominance of material that canbe chemically, but not biochemi-cally oxidized, the COD will begreater than the ROD. Textilewastes; paper mill wastes, andother wastes containing high con-centrations of cellulose havd ahigh COD, low BOD.
c If the situation in item b is reversedthe BOD will be higher than theCOD. Distillery wastes or refinerywastes may have %a high BOD, lowCOD, unless catalyzed by silversulfate.
d Any relationsh ip established as in2a will change in response to 'sample history and environment.The BOD tends to decrease morerapidly than the COD. Biologicalcell mass or detritus produced bybiological action has a low BODbut-a-r-elatively-high-COD.COD/BOD ratio tends to increasewith time, treatment, or conditionsfavoring stabilization.
III ADVANTAGES AND LIMITATIONS OFTHE COD,TEST(2) AS RELATED TO BOD
A Advantages
1 Time, faanipulation, and equipmentcosts are loiver for the COD test.
2 COD oxidation conditions are effectivefor a wider spectrum of chemicalcompounds.
3 COD test conditions can be standardizedmore readily to give more preciseresults.
4 COD results are available while thewaste is in the plant, not severaldays later, hence, plant control isfacilitated.
5 COD results are useful toindicatedownstream damage potential in theform of sludge deposition.
6 The COD result plus the oxygen equiva-lent for ammonia and organic nitrogenis a-good estimate of the ultimate BODfor many. municipal wastewaters.
B Limitations
1 Reslits are not applicable for estimating.BOD except as a result of experimentalevidence by both methods on.a givensample type.
2 Certain compounds are not susceptibleto oxidation under COD conditions orare too volatile to remain in the oxida-tion flask long enough to be oxidized.
Ammonia, aromatic hydrocarbons,saturated hydrocarbons, pyridine, andtoluene are examples of materials witha low analytical response in the CODteat-
3 Dichromate in hot 50% sulfuric.acfdrequires close control to maintainsafety during manipulation.
4 Oxidation of chloride to chlorine is notclosely related to BOD but may affectCOD results.
5 It is not advisable to expect preciseCOD results on saline water.
IV BACKGROUND OF THE STANDARDMETHOD'S COD PROCEDURE
A The COD rocedure(1) consideied.dichrb-mate oxidation in 33 and 50 percent sul-furic acid. Results indicated preferenceof the 50 percent acid concentration-foroxidation of sample components. This is ,the basis for the present standardproCedure.
19-3

Chemical Oxyden Demand and COD/BOD Relationships
B Muers(6) suggested ad di on of,silversulfite to catalyze oxidation of certainlo* molecular weight aliphatic acids and,alcohols. The catalyst also improvesoxidation of most other organic componentsto some extent but does not make 'the CODtest universally applicable for all chemicalpollutants-.
C The unmodified COD test result (A) includesoxidation of chloride to chlorine. Each mgof chloride will have a COD equivalent of0.23 mg. Chlorides must be determinedin the sample and the COD result correctedaccordingly.1 For example, if a sample shows 300
Mg of COD per liter and 200 mg Cl-per liter the corrected COD result willbe 300 -(200 x 0.23)or 300 - 46 = 254mg COD/L On a chloride corrected basis
. 2 Silver sulfate addition as a catalyst s.
tends to cause partial precipitation ofSilver chloride even in the hot acidtsolu-tion. Chloride corrections are qdes-tionable unless the chloride is oxidizedbefore addition of silver sulfate, i.e.,reflux for 15 minutes for chlorideox-,,idation, add Agr,S0, and continue therefleac or use,of Hgg04(D).
D Dobbs and Williams 7). proposed PriorcompleXation of chlorides with HgSO4to
event-chloride-oxidation-during the-test.A ratio of about 10 of HC- to 1 of (wt.basis) appears essential. The Cl- mustbe complexed in hcid solution before addi-tion of dichromate and silver sulfate. _
1 For unexplained reasons the 'HgSO4complexation .does not completelyprevent chloride oxidation in, the ,presence of high chloride concentrations..
p2 Factors have been developed to provide
some estimate olerror in the resultdue to incomplete control of chloiidebehavior. These tend to vary with thesample and d technique employed.**
E It is not likely that COD results will be'precise for" samples containing highchlorideb. ''Sea water contains 18 00 to21000 rager/f.., normally. Equi ntchloride correction for COD e eeds
4000 mg/L The. error in chloridedetermination may give negative COBresults upon application of the correction.
Incomplete qontrol of chloride oxidationwith RgSO4 Say give equally confusingresults.
0
HgSO4 appears to give precise resultsfor COD when chlorides do not exceedabout 2000 mg/L Interference in-? creases with increasing chlorides athigher levels.
F The 12th edition of Standard Methods re-duced the amountof sample and reagentsto 40% of amounts utilized in previouseditions. There hasbeen no 'change inthe relative proportions in the test. 'Thisstep was taken to reduce the cost of pro-viding expensive mercury and silver sul-'fates required. Results are comparableas long es the, proportions are identical.Smaller aliquots of sample and reagentsrequire, more care during manipulationto prombte precision.
G The EPA Methods for CODsat
1 For ,routine Tevel COD (iamples havingan organic' carbon concentration.greater than 50 mg/liter and a clilarideconcentration less than 2000 mg/liter),EPA has a procedure entitled,Titrimetric, mid-level."
19-4
O 2
2' For low level COD (samples with lessthan 50 mg/liter organic carbon andchloride concentration less than 2000mg/liter)E'PA provides an analyticalprocedure 19). !The.difference fromthe roOine procedure primarily iri .volveae, greater sample volume, andmce dilute, solutions of dichromateand ferrous ammonium sulfate.
3 For saline samples (chloride levelexceeds /OM mg/liter), BPA providesan analytical procedure19) involvingpreparation of a standard curve of CODversus mg/liter chloridetto correctthe calculations.. Volumes and concen-ttetions.for the sample".and reagents .
are adjusted,for this type, of detetrnination
1
s
e
V PRECISION AND ACCURACY?)
Chemical Oxygen Demand and COD/B4) Relationships
Eighty six analysts in 58 laboratoriesanalyzed a distilled water solution contain-ing oxidizable organic material equivalentto 270 mg/L COD. The standard deviationwas i 17.76 mg/L COD with an accuracyas percent relative error (bias) of 4.7%.For a solution equivalent tO".12.3 mg/LCOD (low level), the standard deviationwas ± 4.15 mg/L with ,an accuracy as percentrelative error (bias) of 0. 3%. -(EPA. MethodResearch Study 3)
. VI REMARKS PERTINENT TO FECTIVECOD DETERMINATIONS INC DE:
A ' Sample size and COD limits for Ot 250 Nreagents are approximately as given.For 9. 025' N reagents multiply COD by0.1. Use the weak reagent for ,COD'sin the range of 5-50 mg/L, (low level).
B
:
Sample Size`
20 ml10 ml'5 ml
-.4t
Most organic materials oxidize rela-tively rapidly under COD test condi-tions. A-- significant -fraction -ofoxidation occurs during the heating uponaddition of acid but the.orange color ofdichromate shouldTemain. Ifvthe °
sample color changes from orange togreenliafter acid addition the sample wastoo large. Discard without reflux anddepeat with a smaller aliquot until thecolor after mixing doeill not go beYonda brownish hue. The dichromate colorchange is less Tepid with sample com-
monents that are slowly oxidized underCOD reaction conditions.
nig COD/liter' 2000
40008000
C Chloride concentrations should be knovnifor all tee samples so approliriattheanalytical techniques can be Used,
D Split precautions advisable for the.re .cop procdure and essentialwhen using 0.025 Dkreagents include:
- .3,
*
t -21
1 Keep the apparatus assembledwhen not, in use,
2 Plug the condenser breathes tubewith glass wool to rlinimzes dustentrance.
Wipe the upper part of ge flaskand lower part of the condenserwith a wet towel before disassembly
' to minimize sample contamination.
4 Steam out the condenser after usefor high concentration samples andperiodically for regular samples,Use the regular blank reagent ,m*and heat, without .use'-of condense,water, to clean the apparatus ofresidual oxidiiable components,
5 . Distilled water and sulfuric acidmust be of very high qxiality tomaintain low blanks on the refluxed
.1
samples for the 0.025 INT oxidant.
,VII NPDES METHODOLOGY.-
Under the National Pollutant DischargeElim4nation pyfitem.;--the accepted methodcan be found in ,Standird Methods, ASTMiand the EPA manual. See the current ndNPDES Guy e es or pd--Iffi1`-----4enumberti.
ACKNOWLEDGEMENT:
Certain portions of this outline containtrebling material from prior outlines byR. C. Kroner, R. J. Lislika, andJ. W. Mandia.
REFERENCES:
1 Moore, W. A. , .Kroner, B. C. andRuchhoft, C. C. Anal. Chem.21;953, 1949;
175
19-5%
1.

Chemical Oxygen Demand and COD/BoD Relationships 1'
2 Standird Methods, 14thed, 1975
3 Moore, W. A., Ludzack, F. J. andRuchhoft, C. C. Anal. Chem.23:1297; 1951.
4 Van Slyke, D. D. and Folch, J. J.Biol. Chem. 136:509"1940.
5 Van Hall, C. E., Safranko, J. andStenger, V. A. , Anal. :Cheni.
.35:315, 1963.
6' Muers, M. M. J. Soc: Chem..Ind. (London) 55:711, 1936.
, Dobbs, R. A. and Williams, R. T.,Anal. Chem. 35:1064, 1963.
cab
:PO
ti
,
IT Annual Book of Standards, Part 31,Water, 1975.
9 Methods for Chemical Analysis-of WaterWastes, U.S. Enviionmental Protection
Agency, Environmental Monitoring &Support Laboratoiyi Cincinnati, Ohio45268, 1979
s,
This outline was prepared by F. J. Ludzack,Cheinii3t, National Training and OperationalTedhnologyeenter, OWPO, USEP4,Cincinnati, Ohio 4526'e -Descriptors Analysis, Bidchemical,Cury,gen Demand, Chemical Ankysis,Chemical Oxygen Demand, Chlorides,Oxygen Demand, Wastewater, WaterAnalysis--)
3
1I0
1.1
0.

.
a
. LABORATORY PROCEDURE UTINELEVEL CHEMICAL OXYGEN DE D
I REAGENTSI
A Standad Potassium Dichromate (0.250 N):
Dissolve 12.259 g of priMary standard gradeK 2Cr
2b2, whiCh has been dried at 103° C
for two hours, in distilled water and diluteto one liter. .
B Ferious Ammonium Sulfate (0. 1N):
. .C Fermin Indic.ator: a
Dissolve 1.485 g 1, 10-p henanthroltnemonohydrate and 0.695 g FeSO4 7H,,0 inwater and dilute to 100 ml. This inaica-tor may be purbhased already prepared.
Dissolve 39 gr of Fe(N1-146(SO4)26H20 indistilled water.Carefully add 20 ml of concentrated H2SO4.Cool and dilute to one liter,
D' Concentrated Sulfuric Acid (36 N):
E Mercuric Sulfates analytical'Giade
F Silvgr Sulfate: Analytical 'trade
G Concentrated Sulfuric Acid - Silver Sulfate:
Dissolve122 g of silver sulfate in a 9 lb..bottle.of conce'ntratecf sulfuric acid. (4-5
. hours, with stirring, for`dissolutior)
denier and flask with distilled water. In olderto prevent contamination from air-borne particles,re-assemblethe apparatus. The top of *e con-denser should be lightly plugged with glass wool&rin storage and use.
III. STANDARDIZATION(1)
OF FERROUSAMMONIUM SULFATE
,aad
A' Measure 10.0 ml of the standard potassiumdichromate sol. into a 500 ml, wide mouth'Erlenmeyer flask. .
"B Add about 90 ml distilled water and mix.
C Add 30 ml of concentrated H2SO4 and coolthe mixture to room temperature..
D Add 2-3 drops of ferroin indicator and titrateto a reddish-brown end point with the ferrousammonium sulfate sol..
E Calculate the normality, N, of the ferrousammonium sulfate sol. :
N of Fe(NI-14)2 (SO4)2 =
. II EQUIPMENT PREPARATIONo>
Before Ilse,. Erleurtieyer flask -(500 ml,24/40<standard taper joint) and reflux condenser(300 mm jacket'Liebig, West or equivalent)wii.h.24/40' standard taper joint, should besteamed out to remove trace organic contami-nants. Add 10 ml of 0.250 N Ko- Cr20 ; 50 ml-' of distilled water, and several ISOLung 7stones
: to the flask. Carefhlly add 20 ml of concen-trated H
2,so and mix thoroughly. Connect
4the flask ana condenser, but do not turn onthe water to the condenser. Boil the mixture
"so-that steam emerges from the top of the con-. . denser for several minutes. Cool the mixture'?
carefully disca'rd the acid, and rinse the con-
CH. O. oc. lab..3e. 8.78
ml K2
Cr 207 x N of K2Cr2O7
ml Fe(NH4)2(SO4)2
IV PROdEDURE (1)-
A: Pipet 20 ml of sample (or pipet a smallerportion of sample and add enough distilledwater t6 make a 20' ml volume) into a 500ml 24/40 standard taper. Erlenmeyer flask.
B Add 0.4 g mercuric fate.
C Add 6-10 boiling chips.
D Slowly, add 3 ml of concentrated sulfuricacid anti swirl to dissolVe the mercuricsulfate. (Some solid may remain). Cool'while, mixing. ,
E Add 10.0m1 of the 0.250 N potassiumdichromate'sol. and mix.`?'
177
.
0-
20-1

I '
Laboratory ProcedUre For Routine Level Chemical Oxygen-Demand
LN,F, Attabh the flask to the condenser and start
the cooling Water.
G Slowlradd 27 ml of the sulfuric abld-Silversulfate reagent through the open end of thecondenser. Try to mix the contents whileadding the acid.
H CAUT ION: ,After adding the acid, swirl theflask to thoroughly mix the contents. Other-wise)local heating can occur in the b9ttom ofthe flask and the .mixture may be brown outof the condenser.
I Plug the open end of the condenser with glasswool or cover with a small beaker (dependingon construction) to prevent intrusion ofcontaminants.
J Turn on the heat source and reflux the mix-ture for 2 hours after boiling begins.
K Turn off the heat and allow the solution tocool. Then turn off cooling water.
L Wash down the inside walls of the condenser. with distilled water..
'®
M With a %fisting motion, disconnect the con-denser from the flask, then rinse the jointso the rinses go into thgliask.
N Add distilled Water to the flask for a totalvolume of about 130 ml.
O if the mixture is still warm, cool to roomtemperature.
Add 2-3, ceps of ferroin indicator`and
Q Titrate the excess dichromate with standardferrous ammonium sulfate sol. to a reddishbrown end point.
RA-blank-bonSisting of 20 ml of distilled waterand containing all the-test-reagents istohe refluxed a,nd titrateill& the same rammeras the sample.
V CALCULATION
mg COD/ L(A-B) N x 8 x 1000
ml of sample
a.0
20.4'
COD = chemical oxygen deinand
A = ml Fe (NH4)2(604)2 used,fpr blank
B = nil Fe(NH4)2(SO4)2 used for sample
N = N of Fe(NH4)2(SO4)2
8 = equivalent weight of oxygen
ACKNOWLEDGEMENT:
Portions of this outline were taken from outlines prepared by R. J. Lishka and CharlesR. Feldmann.
,
REFERENCES
1 Standard Methods, APHA-AWWA-Wey'CF,14th Edition, 1975.
This outline was prepared by Audrey D. 'Kroner, .Chemist, National Training and Operational. --Technology Center, OWPO;- USEPA,Cincinnati, Ohio 45268.
Descriptors Chemical Analysis, ChemicalOxygen Demand, Organic,Compounds,Oxidation, Oxygen, Oxygen Demand, OxygenRequirements, Water Analysis
. r
et.
4e,
r
, 0. '

1.
S
ik
44
ta'ahoratory Prcibedure For Routine ,Level Chemical Oxygen Demand.?
-.0 ,° ,. DATA SHEET.....
*---., .
o . ' "t3t 4
.
. , ml of KACr
26 used to standardize :the ferrous ammonium sulfatSit t'AS)7 . , - $ . .v s
10.0".
N of K2Cr20,7 = 0.25
-,
lml of FA used -to titrate the K2Cr2
-$ .
'94f
0 ate ,10.0 x- 0.25N FAS --=r ml FAS °
r
,zt
I
2.5
''ml FAS used for blank,% .,, . .
1-- . - ,
,m1. FAS used for sample, b = .... , ...x. '..ial sample = . iti,
..
i
- .. `. ,,N -- ,_
-...
t (a - b) x N SFAS x 8 x 1000COD, in mg liter * * . .r ml sample
, /--,-. .0 - . <
8
.
x 81 100Q
4
1"
."415.
4
.I
yie
a
ti
-PHOSPHORUS IN THE AQUEOUS ENVIRONMENT°
I Phospliorusis closely associated withwater quality because'of (a) its: role inaquatic productivity such as algal bloorn,(b) its sequestering action, which causesinterference in coagulation, (c) the difficultyof removing phosphorus from water to somedesirable low concentration; and (d) its
--characteristic of convertingfrom one toanother of Many possible forms.
A Phosphorus is ,one of the primary nutrientssuch as hydrogen (H), carbon (C),nitrogen(N), sulfur (S) and phosphorus (P).
1 Phosphorus is unique among nutrientsin that its oxidation doe\s not contributesignificant energy because it commonlyexists'in oxidized form.
2 Phosphors is intimately involved inoxidativg4ergy release from 41c1synthesisof other nutrients into cellmass Sia:
a Transport of nutrients acrossmembra:nqs into cell protoplasm islikely to include phosphorylation.
b The release of energy for meta-bolic purposes is likely toinclude a triphosphate exchangemechanism.
B Most-natural waters contain relatively lowlevelsof P (0.0,1 to 0.05 mg/ L) in thesoluble state during periods of Significantproductivity.
1 netabolic activity tends to convertsoluble R into .cell,,ina0d (organic P) asa part of the prOrolpsiri, :intermediateproducts, or sorbed mateiiaL,
,Degradation of cellmade andlncidental',1" ciiin#ourild results. in feedback. of
fo the water at rates Orernedlysedby. the 't,g-pe of P and the en'virozfinent.
r,7'.' Aquatic Metabolic kinetics show markedinfluences',Orthid.feedbadk..
. . '
44
3 The concentrations of P iii hydrosoils,sludges, treatment plant samples andsoils may range from 102 to 106 timesthat in stabilized surface water. 'Both
, concentration and interfering compo-nents affect applicability of analyticaltechniques.
:The-primary source- of phosphorus in-theaqueous system is of geolOgical origin.Indirect sources are the processed mineralproducts for use in agriculture, household,industry or other activities.
A Agricultural fertilizer run-off is relatedto chemicals applied, farming practice..and soil exchange capacity.
B Wastewaters primarily of domesticorigin cOntaingmajor amounts of P from"
1 Human, animal and plant residues
2 . Surfactants (cleaning agent) discharge
3 Microbial and other cell inasses
C Wastewaters primarily of dustrialorigin contain P related to:
1 Corrosion control
2 Scale cointrol additives
3 Surfactants or dispersants
4 Chemical processifig of materialseluding P
5 Liquors from clean-up operations ofdusts, fumes, stack gases, or otherdischarges
..VIII Phosphorus terminology id commonly
confused because of the interrelations amongbiological, cheinical, engineering, physical,and analytical factors.
.s,
CH. PHOS. 4e.11. 80 , ,?
. 180
it.

I -
f
Phosphorus in the Aqueous Environment
A Biologically, phosphorus may be available0 ,as a nutrient, synthesized into living mass,stored in living or dead c411a, aggloMerates,or mineral complexes, or converted todegraded materials.
B Chemically, . several mineraland organic forms that may be convertedfrom one to another under favorableconditions. - Analytical estimates arebased upon-physical or chemical techniques
,ne.cessary to- convert various forms of
"into ortho phosphates which alone can be'quantitated'in termsof the molybdenumblue colorimetric test.
C
D
Engineering interest in phosphorus isrelated to the prediction, treatment, orcontrol of aqueous systems to favoracceptable water quality objectives.Phosphorus removal is associated withsolids removal.
Sohibility and temperature are majorphysical, factors in phosphorus-behavior.Solublecla is much more available thaninsoluble P for chemical or'biologicaltransformations%and the rate of conversionfrom one to another is strongly influencedby tertwzraiure.
E Table 1 includes a classification of thefour main types of cherhical P and someof the relationships controlling solubilityoreachgroup. It is apparent that nodear-cut separation -can be made on a°solubility basis as molecular weight,
'IUbstituent and other faotors affect%.. ty.
.
F Table 2 includes a scheme of analyticaldifferentiation of,various forms of Pbased upoiC.
e °
1 The technique required to convert anunknown variety of phosphorus intoortho P which is the only ox quanti-tated by the e"-Oloriajkic tattm.,
e .. :tc
2 Solubility characteristics of the sampleP or more precisely the means requiredto clarify the sample.
a Any clarification method is subjectto incomplete separation. Therefore,it is essential to specify the methodused to interpret the yield factor ofthe separation technique. Thedegree of separation of solublesand insolubles will be' significantlydifferent for:
1 Membrane filter separation(0.5 micrometer pore size)
2 Centrifugation (at some specifiedrpm and time) ,
3 Paper filtration (specify Aperidentification)
4 Subsidence (specify time andconditions)
G Analytical separations (Table..2) like thosein Table 1, do not give a precise separa-tion of the various forms of P which maybe included quantitatively with ho orpoly P. Conversely sdm the poly andorganic P will be inchi d with'ortho P ifthey have been partla hydrolyzedduring storage or ysis. Insolublesmay likewise be cluded as a result of .
poor separatiorfoand analytical conditions. .
a
.4 . #
1 The separation methbds provide anoperational type of definition adequatein most situations if the "operation"is known._ Table 2 indicates the natureof incidental P that may appear alongwith the type sought.
!1,.
4*,
O
I,
7

.Form
1. Ortho phosphates
(PO4)3
Table' 1
Phosphorus in the Aqueous Environment
PHOSPHORUS COMPOUNP111 CLASSIFIED BYCHEMICAL *AND SOLUBILITY RELATIONS
Water Soluble( 1 )
Combined,with monovalentcations such as H,+ Na,+KINH+
4
vInsoluble(r) /1_4Combined with multivalent cations such . ,
as Ca +2A1 +3Fe+3
2. Poly phosphates
(P 0 ), -4 0 )-5(P 0' ), 3
2- 7 3 10 3
and others depending uponthe degree of dehydration.
as in 1 aboveIncreasing dehydrationdecreases solubility
(a) as in 1 above(b) multi P polyphosphates
o(high mol. wt.) in-cluding the "glassy"phosphates
..\Organic phosphorus- (2)
(unusually varied, nature)fiscr,
(a) certain chemicals(b) degraddtiOn products(c) enzyme P(d) phosphorylated nutrients
(a) certain chemicals(b) cell mass, may be
colloidal or agglom-erated
(c) soluble P sorbed byinsoluble residues
4. Mineral phosphorus
a
(a) as in 1 above. (a) as in 1 above(b) as in 2 above(c) geological P suchNab
phosphosilicates(d) certain mineral com-'
'plexes:
(1) Used in reference to predominance under common condition's.3(2) R reprissats an organic radical, PreRresents P. PO4, or its.iierivatives.
o
2 Total P in Table 2 includes liquld,andseparated residue P thabmay exist inthe whole sample including silt, otganic1sludges or h.ydrosoils. This i;ecognizes
. -
that the feedback of soluble P fromdeposited or suspended material has areal effect up fin the kineticd otthe
environment.
,
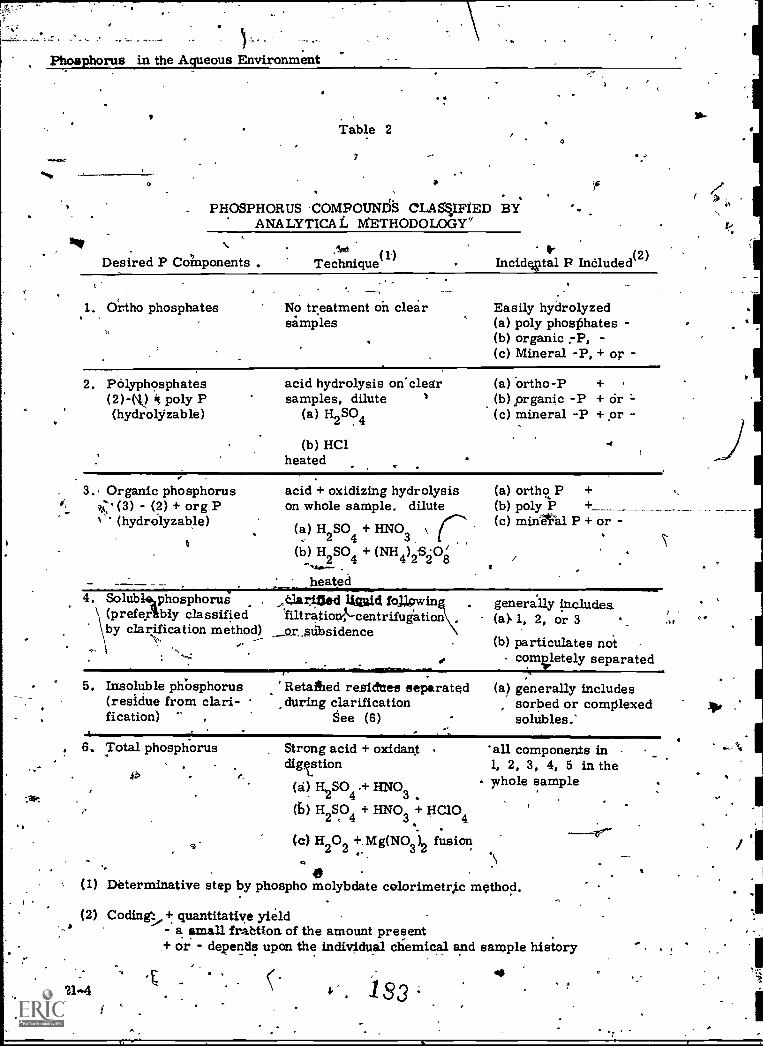
Phosphorus in the Aqueous Environment
Table 2
PHOSPHORUS -COMPOUN138 CLAS41F/ED BYANALYTICAL METHODOLOGY
Technique()Desired P Coinponents IncideRtal P Included(2)
1. Ortho phosphates No treatment on clearsamples
Easily hydrolyzed(a) poly phosphates -(b) organic -P,(c) Mineral -P, + or -
2. Polyphosphates(2) -(') k poly P(hydrolyzable)
acid hydrolysis on' clearsamples, dilute
(a) H2SO4
(b) HC1heated
,
(a) "ortho-P +(b) prganic -P + Cr ,-(c) mineral -P + or -
3., Organic phosphorus(3) - (2) + org P
' (hydrolyzable)
acid + oxidizing hydrolysison whole sample. dilute
(a) H2SO4 + HNO3
\ r(b) H SO + (NH ) $ '0'
4 4 2 2 8heated
(a) ortho P +(b) poly p +(c) mide1111 P + or -
Solublelphosphorus ,alarittad *Lad foRowin(preferibiy classified filtratiocentrifugationby clarification method) _orsnlosidence
5. Insoluble phOsphorus(residue from clari-fication)
Retathed re.sidttes separatedduring clarification
See (6)
generally 1.11 c 1 n de a(a).1, 2, or 3(b) particulates not
completely separated
(a) generally includessorbed or complexedsolubles."
6. Total phosphorus Strong acid + oxidantdiTtion
(a) H2SO4 + HNO3
(6) H2SO4 + HNO3 + HC103 4. .
(c) H202 +.Mg(NO3)2 fusion
O . .
(1) Determinative step by phoapho molybdate colorimetr,ic method.
(2) Coding4_,+ quantitative yielda small frabtion of the amount present
+ or - depends upon the individual chemical and sample history
all components in1, 2, 3, 4, 5 in thewhole sample
21.4'
& 183
.1r
4
20-
0
J
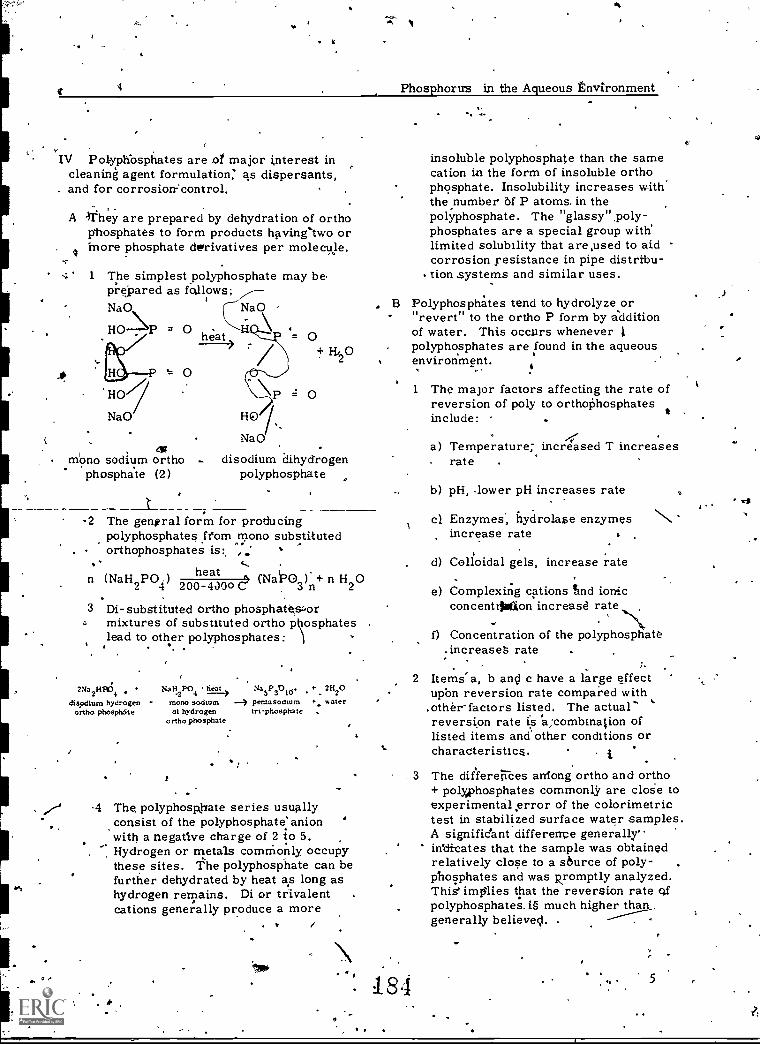
It
4 Phosphorus in the Aqueous Environment
IV Polyphbsphates are of major interest incleaning agent formulation: as dispersants,
. and for corrosion-Control.
A -They are prepared by dehydration of orthophosphates to form products having two ormore phosphate derivatives per molecule.
1 The simplest polyphosphate may beprepared as foalows;NaO NaO
0 heat
4
HO /..Na0
0
0
+ 02
mono sodium ortho disodium dihydrogen. phosphate (2) polyphosphate
-2 The gengral form for producingpolyphosphates from mono substituted
. orthophosphates is
n (NaH PO.) heat + n H02 4 200-4000 C 3 n 2
3 Di-substituted ortho phoSphat,esformixtures of substituted ortho phosphateslead to other polyphosphates:
2Na2
H1154
disodium hydrogenortho phosphSte
Nall2PO4 heat, Na3P3010. + 21120
mono sodium pentasochum waterdi hydrogen trt-phosphate ,
ortho phosphate
`r
4 The, polyphosphate series usuallyconsist of the polyphosphate'anionwith a negative charge of 2 to 5.
.Hydrogen or metals commonly occupythese sites. The polyphosphate can befurther dehydrated by heat as long ashydrogen remains. Di or trivalent .
cations generally produce a more.
insoluble polyphosphate than the samecation in the form of insoluble orthophosphate. Insolubility increases-withthe number 6f P atoms. in thepolyphosphate. The "glassy".poly-phosphates are a special group with'limited solubility that are,used to aidcorrosion resistance in pipe distribu-
. tion systems and similar uses.
B Polyphosphates tend to hydrolyze or"revert" to the ortho P form by additionof water. This occurs wheneverpolyphosphates are found in the aqueousenvironment.
1 The major factors affecting the rate ofreversion of poly to orthophosphatesinclude:
ti
184
a) Temperature; increased T increases. rate
b) pH, dower pH increases rate.cl Enzymes, hydrolaze enzymes
increase rate
d) Colloidal gels, increase rate
e) Complexing cations hand ionicconcentrjuilon increase rate
'\-f) Concentration of the polyphosphate
.increaseS rate
2 Items a, b and c have a large effectupbn reversion rate compared with,other factors listed. The actual' `reversion rate is .a;combination oflisted items and'other conditions orcharacteristics.
O
3 The differeirces aniong ortho and ortho+ polyphosphates commonly are cloie toexperimental error of the colorimetrictest in stabilized surface water samples.A signific'ant difference generally'indicates that the sample was obtainedrelatively close to a source of poly-phosphates and was Rromptly analyzed.This' implies that the reversion rate ofpolyphosphates.ig much higher than_generally believed. .
5
.

ett
Phosphotus ipthe Aqueous Environment
V SAMPLING AND PRESERVATION,TECHNIQUES
A Sampling
1 Great care should'be exercised toexclude any benthic deposits fromwater samples.
Containers should be cleaned in thesame manner as labware (see VI. B.1.beloW).-
3 Certain plastic containers may beused. Possible. adsorption of low con-centrations of phosphorus should be ,checked.
2
.4 If a differentiation of Phosphorukformsis to be made, filtration should be-carried out immediately upon samplecollection. 'A membrane filter of0. 4-5'um pore size is recommended for
.r eproducibSof separations.
B Preservation
1 If at all possible, sanfples should be6 analyzed on the day of collection. At
best, preservation measures onlyretard possible changes in the sample.
. .
a Possible physical changes includesolubilization, precipit5tion,absorption on or desorption fromsuspended matter.
b Possible chemical changes includereversion of poly to ortho P anddecompbsition of organic or min- .
eral P.
Possible biological Changesinclude microbial decompositio'nof opianic P and algal orbac4ria.legrowtit forming organio°P.
2 If it is inlpossiblo do total phos7,. ,phorus sieternuna oils on the day ofcolleaiori,*refrigerate at'4°C andadd 2 ml concentrated H2S64 perlash-. 'Limit of -hoIding'r sanipletthus preafervedts 24 hours. (6) Q
a Refrigeration decreases hydrol ysisand reaction rates and also lossevdue to volatility.
b Sulfuric acid limits biologicalchanges.
f
c Mercuric chloride also limitsbfologrcal changes, but interfereswall the analytical procedure ifthe chloride level is less than 50 IngCl /biter.. (See VI B. 2. below).Dis posal, of Mercury-containingtest wastes also adds time -to the--procedure.
3 Consult the EPA Methods Manual(6)for preservation measures applicableto samples collected to determinevarious fractions of phosphorus.
,V1 THE ANALYTICAL PROagDUREC6)
A . This is a colorimefz:ic. determination;spe4.111c for orthophosphate. Dependingdn'the.nature of the sample and on the
yF type-of data sought, the procedure in-', Volves.two, general operations:r
1 Conversion of phosphorus forms tovoluble orthophosphate (See- Fig. 1);
a sulfuric ,acid-hydz:olysis forpolyphosphates, and some -organic P compounds,
b persulfate digestion for organicP compounds
2 The color determination involvesreacting dilute solutions of phosphbruswith ammonium molybdate and-potassium antimbnyl tartrate in anacid medium to form an antimony -phosphomolybdate complex. Thiscomplex is reduced to an intenselyblue-colored complex by-ascorbicacid., The color is proportional tothe orthophosphate concentration.
4
Color, absorbance is measured-at880 nm or'650ran untis concentrationv'alue gained using aciitanclard curve.
.Reagent preparation and the detailedprocedure ban Be found in theEPAmanual...The methods describI there id*usable in the 0.01 to b. 5 mg/literphosphorus range. This range can,.be extended by dilution of sampleiff.
J
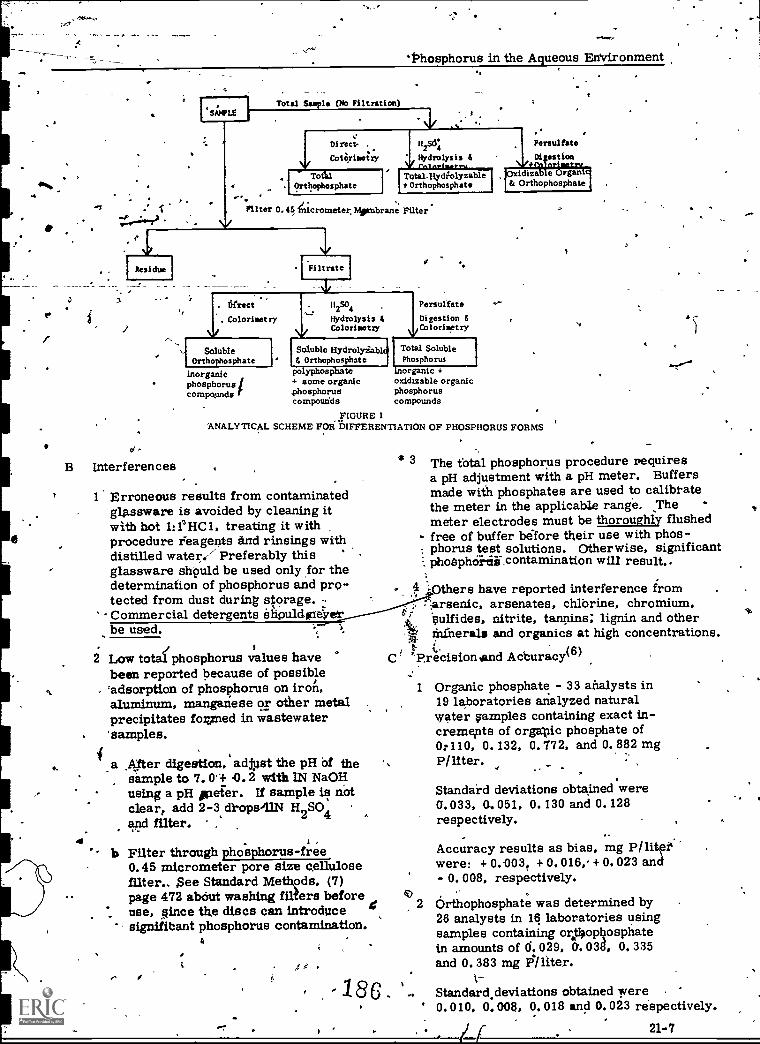
IResidue
B Interferences
4
'Phosphorus in the Aqueous Entrironment
Total Sample (No Filtration)
Direet . /1 str Persulfate2
Cotarise;ry Hydrolysis 51r +ro nrimatmy
OrthophosphateTotal.Hydolyzable rxidizab et Orthophosphate & Orthophosphate
Tottl
Filter 0, 45 micrometer Mpubrane Filter
j Filtrate
Nir
dfrut
. Colorisetry
SolubleOrthophosphate
inorganicphosphoruscompuunds
112501
Hydrolysis 1Colorisetry
Soluble llydrolyiable& Orthophosphate
polyphosphate4- some organicphosphoruscompoudds
PersulfateDigestion 5Co I orimet ry
1 Total SolublePhosphorus
inorganic +oxidizable organicphosphoruscompounds
FIGURE 1ANALYTICAL SCHEME FOR DIFFERENTIATION OF PHOSPHORUS FORMS
1- Erroneous results from contaminatedglassware is avoided by cleaning itwith hot 1:f HC1, treating it withprocedure reagents and rinsings withdistilled water/ Preferably thisglassware sh'ould be used only for thedetermination of phosphorus and pro-tected from dust during storage.Commercial detergents ehpuldgs*erbe used.
2 Low totaf phosphorus values havebeen reported because of possible'adsorption of phosphorus on iron,aluminum, manganese or other metalprecipitates fovned in wastewater
. 'samples.
4 3 The total phosphorus procedure requiresa pH adjustment with a pH meter. Buffersmade with phosphates are used to calibratethe meter in the applicable range. Themeter electrodes must be thoroughly flushedfree of buffer before their use with phos-phorus test solutions. Otherwise, significantphoSphorni,contamination will result..
.-Others have reported interference from..arsenic, arsenates, chlbrine, chromium,Sulfides, nitrite, tannins; lignin and otherfaiiierals and organics at high concentrations.
g.c ' Precision and Acburacy (6)
Alter digestion, adjpst the pH of thesample to 7.0+ 0.2 with 1N NaOHusing a pH peter. If sample is notclear, add 2-3dlopsillN H2SO4and filter. .,.
.
h Filter through phosphorus -free0.45 micrometer pore size cellulosefilter.. See Standard Metkods, (7)page 472 about washing filters beforeuse, oince the discs can introduce e,significant phosphorus contamination.
e
1 Organic phosphate - 33 analysts in19 laboratories analyzed naturalwater samples containing exact in-crements of organic phosphate of0:110, O. 132, 0.772, and 0. 882 mgPinter.
Standard deviations obtained were0.033, 0..051. 0.130 and 0.128respectively.
Accuracy results as bias, mg P/litftwere: + 0..003, + 0.016, + 0.023 and- 0. 008, respectively.
4)2 Orthophosphate was determined by
26 analysts in 16 laboratories usingsamples containing orAtophosphatein amounts of 6.029. 0.038, 0. 335and 0.383 mg Fr/liter.
486, - Standard.deviations obtained were0.010, 0.008. 0.018 and 0.023 respectively.
21-7

Phos I ()rue in the A eous Environment
AccurapiTgesults as bias, ang2ilftprwere -0.001, -0.002, -.0309' and-0.007 respectively.'
D Automated Methods
The EPA, Manual also contains a procedurefor the automated colorimetry method usingascorbic acid acs the redticing agent.
VII VARLABLESIN THE COLORIMETRIC.PROCEDURE
Several importanit variables affectformation of the yellow heteropolyacid and its reduced form, molybdenumblue, in the calorimetric test for V.
.A Acid Concentration during color develop:
ment is critical. Figure 2 shows thatcolor willfappear in a sample containiri
O no phosphate if the acid concentrationis low. Interfering color is negligthlewhen the. normalitytrith respect to 4QH2SO4 approaches 0.4.
1 Acid normality during color develop-ment of 0.3 ttzA slightly more than0.4 is feasible for use. It is prefer-able to,Clantrol acidity carefully andto seek normality closer to thehigher limits of the acceptable range.
2 It is essential to add the acid andmolybdate as one Sohn:ion.
3 The aliquot of sample must be"neutralized prior to adding thecola; reagent.
1/
21-8'
a
,
0.1 0.2 0.3 0.4 0.5 0.6
H2504 NORMALITY
Figure 20- PHOSPHATE COLOR
VS ACIDITY
33( Choice of Reductant Reagent stability,effective reduction = d freedom fromdeleterious side e r e s are the basesfor reductant sele tion. Several re- .
ductaAts have be used effectively.Ascorbic acid reduction is highly.effective in both marine and fresh water.It is the reductant specified in themanual NPDES procedure.
C Temperature fffr. ct s the rate of colbrformation. Blank, standards, andsamples must be adjusted to the sametemperature (± 1°C), (preferably roomtemperature), .before addition of theacid molybdate reagent.
D Time for Color Development must be .specified and'c ons latent. After additionof reductant, the blue color developsrapidly for 10 minutes then fades grad-wally after 12 minutes.
1
1,
.00
a c

Phosphorus' in the Aqueous 'EnViromnetit
VIII DETERMINATION OF TOTAL.PHNIFITARUS 1
A
e - 1
Deteimirlatidh of total phosphorusconteirt recitiiegthe acid.:hydrolysie°and-persulfate treatments,to convertall piniaphorus torms to' the' test-
4sensitive orthoPhosphate.forin,t .1.4
. "pyiermlning total phosphorus gOntent-yields the rtlqgcmeaningia,;aatathe various fOrm.4 4,13hosphoruk 'Laychange from one' form to. another in, ashort period'of..tlin..!(Sikt turf V; B1)
IX DEVELOPMNT OF A SWANDARDPROCEDURE
.Phosphorus analysis received intensiveinvestigation; coordination and validation Of
:methods is more difficult than changingtechnique.,
A Pa0 of the problem in nieiSods arosebedause of changes in analytical objeCtives
...such as: 4
.Methods suitable to gather "survey" a'informationAnay,not be adequate for
. tt standarils".
2. Methods acceptable fort water are nqteffective in the presemcc
`. of signifidant minertl and organicinterference characteristic of hydro-soils, marine samples, organicsArdges anrenthic deposits.
-1/..+3 liffetest has been cerxtered on "fresh"
water, It was essential to extend themfor marine waters.
)
7
4_ inatrIlinpntatinnand alitnimatinn have.required adaptationof methddology.
'B -Analysts have tended to work on their own"special:problems. If the methodapparently served their situations,- it was'Used. Each has a "favorite" scheme thatTinaibe quite effective btit progresstoward widespread application of "one'.method has been slow". Consequeritly,many methods are available., Redgentacidity, Mo content, reductant.andseparation techniques_ are the major
:variables.
C The persulfate digestion and single reagent(ascorbic acid) method deser-i-bed-irLinabove is the only method currentlylisted in the Federal Register ;'List ofApproved Procedures" for NPDESrequirements.
ACKNOWLEDGMENT:'40\
Materials in this outline include Aignificantportions of previous outlines by J. M. Cohen,L. J. Kamphake, and R. J. Lishka. Importantcontributions and assistance were made by
*R. C. Kroner, E. F. Barth, W. Allen Moore,Lloyd Kahn,.Cliffod Risley, Lee Scarce,JOhn Winter, and Charles Feldmann.
1
REFERENCES
to,
Jenkins, -David, A Study cif Methods4Suitable for the Analysis andPrese'rvation of Phosphorus Formsin the Estuarine Environment. DHEW,,Central Pacific River Basins Project.SERL Report No. 65-18, University
. of California, Berkele4 Calif.November 1965.
183
O
4

.1
4
C ti
Phosphorus in the Aqueous Environment
.
2 Gales, Morris E., Jr., Julian. 41419. Csand Kroner, Robert C. Method forQuantitative Determination of TotalPhosphorus in Water. JAWWA 58:(10) 1363. October 1966,
3 Lee, G. Fred, .Clesceri, Nicholas L. andFitzgerald, George P. , Studies on theAnalyda of-Phosphates in Algal 'Cultures."Int.. J. Air & Water Poll. 9:715. 1965..
4 Barth, E. F. and Salotto, V., V.,,'Procedure fot Total Phosphorusin, Sewage and.Sludge, UnpublishedMefno, Cincinnati WaterResearchLaboratory, FW,OA.. April 1966.
--SI-Moss-7- H. V. , (Chairman, AA SGP -.orimiffee) Determination of OrthdPhosphate, Hydrolyzable Phosphateand Total Phosphate in Surface Water,JAWWA `5er\1563. Decembe 1958.
\ 6 Methods for Cheinical Analysis of Water'& Wastes, EPA, ElVISL,Ohio 45268. 1979. '
7 StatidaidExam
0
.
, 21 -10
'
thods for4 the ,
tion of ater .and itewater, 14th ed.,AP -AWWN-WPCF,
. Washington, D.C. , 1976.
s
4,
h
VAS otttline was prepared by Ferdinand J.Luditack, former Chemist, National TrainingCenter, and by Audrey D. Kroner, Chemist,National Training and Operational TechnologyCenter, (FPO. USEPA, Cincinnati, Ohstor45268.
..'Descriptors: Chemical Analysis$ Nutrients,
Phcisphates, Phosphorus, Phosphorus Compounds,Pollutant Identification, Sampling, °Water"Analysis, Watel- Pollution Sources.
-
r
t ,
.
P
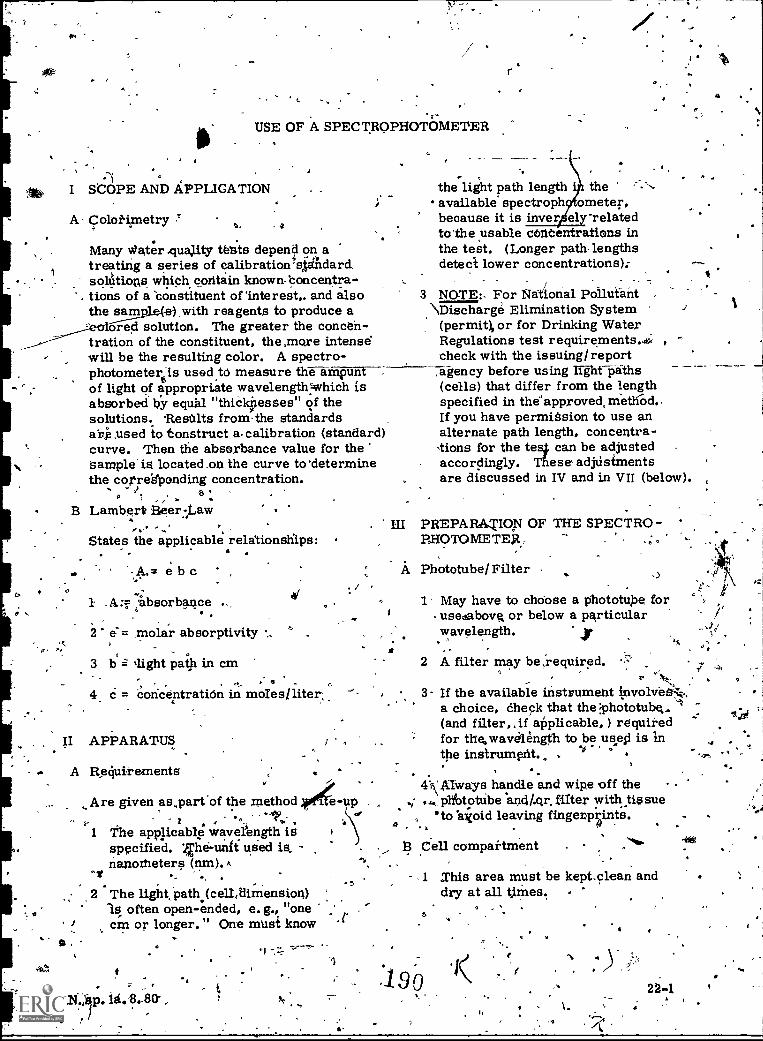
USE OF A SPECTROPHOTOMETER
,
I SCOPE AND APPLICATION
A- Colorimetry4 o.
Many Water .quality treats depend on atreating a series of calibrations*dard.solUtions which, contain known-boncentra-tions of a 'constituent of 'interest,. and alsothe sam with reagents to produce a
ored solution. The greater the concen-tration of the constituent, the,more intensewill be the resulting color. A spectro-photometersis used to measure the ampuntof light of appropriate wavelengthVhich isabsorbed by equal "thielciesses" of thesolutions. 'Results fromthe standardsalinsed to tonstruct a. calibration (standard)curve. Then the absorbance value for thesample' is located on the curve todeterminethe correeponding concentration.. -
" 7 s 1
B Lambert Beer:,Law
States the applicable relationships:
A,3 e b c
l -A:3 absorbance ..
2 e= molar absorptivity °c
dJ
3 b = 'light path in cm,
4 c = concentration in moles/liter...
II APPARATUS
A Requirements
0.
Ili
r
the light path length theavailable spectroph meter,because it is inver el -relatedtothensable concentrations inthe test. (Longer path lengthsdetect lower concentrations):
3 NOTE For NaCional Pollutant .
"Discharge Elimination System(permit), or for Drinking WaterRegulations test requirements. ..4;check with the issuing/report,agency before using Light paths(cells) that differ from the lengthspecified in theapprovedometliOd..If you have' permitsion to use analternate path length, concentra-Aions for the te4 can be adjustedaccordingly. These adjustmentsare discussed in IV and in VII (below).
I
PREPARATION OF THE SPECTRO-P.HOTOMETER.
A Phototube/ Filter
1' May have to chdose a phototube for- use.6abovg or below a particularwavelength.
2 A filter may be,required.
.1%
_-. 3- If the available instrument tnvolveaLIii.,"a choice, Check that the iphototube, ' :(and filter, ,if applicable,) required
, for the.wavelength to beuse,c1 is inthe instrument.. . .."
Are given as.part 'of the method 4e-up1 q411....e applicable wavel ength is
specified. 4h6-unit used is.nanorneters
,
2 The light, path (cell,dimension).18 often open-ended, e. g., "onecm or longer." One must know
!.
qH.114..,itp. la. 8.80-
o
,
4X Always handle and wipe off the'and/..qr. filter with tissue
Ato avoid leaving fingerpi-ints.
0a
Ce ll compai-tment -
,1 This area must be kept clean anddry at all times.
5
.190

USE OF A-SPECTROPHOTOMETER
C Cells,
1 A set must "match" each otherin optical properties. To-checkthis, use the same solution atthe same wavelength, aryl verifythat. the absorbance value is thesatne for each cell.
Alternatively, a single cell canbe used if it is thoroughly rinsed'after each reading. -
3 Irfstrument cells should be freeof scratches and scrupulounlyclean.
a Use detergents, organicsolvents or 1:1 nitric acid-water.
Caustic cleaning compoundsmight etch the.ceils°.
c Dictiroviite solutions are,not recomnfended becauseof adsorpti9dpossibilitieSt
'td Rinse with tap, then distilled
water.
. b
e A final ringing and-d g withalcohol-ckr acetoneb orestorage is a preferred practice.
..4
'D Warm -Up '
"1 14.ugin tli power'dord. ; ,
.2 Turn the poiker' sweat of and.give
it'an half-ttfrn.to keep;: *r.44 the needle, fpm 10,11riifig
80
1
ar.
E Wavelength Alignment .
One reference is the known, ma)d.mumabsorption for a dilute solution of potassium.permanganate which has a dual peak at.526 nm and 546 nm. Use 2 matched cells for thefollowing steps!1 Prepare a dilute solution of
potassium permanganate (about10 mg/ L).
-2 Follow the steps in.VI A, ZeroingOperation, using a wavelength of51b nm, and distilled water as a"reagent blank.-", Keep the water in the cell-,during this entire procedures
3 Rinse the matched cell two timeswith tap water, then two times withthe permanganate solution.
4 Pill the cell three-fourths fullwith the7permanganate.solution. Keep4 thepermanganate solution in this cell during thisentire procedure.
\ 6
1
Thoroughly wipe the cell witha tissue. Held the cell by the.top edges.
4Open- tile coyer and gently insertthe-V&Yt-aligning it to the ridgeas befbre.
Oe.
7, Close the cover. ,
,
...e... i
Record;thse wavelength and the .'absorbance reading on a'sheet of ',' '.
paper. . .
. . ,0,, # . #
9. Remove the cell of permanganate ° *solution, and Close: the 'cover.- 40.3 . ' 4 ......$
9..
.. . o ' *.
904. :3 I. Wait to use until the recoifsnetdedg Set thewavelOgli control at the 4. 4,
marm-up..time has passetfl Any-, riext graduationt 5nni). - tivf,
where from 1.0 to.30 miguites may' -
tie required. 11
,R:.
Ifthdia ilfedle is nIt aftttfillitoi
left,ITob to ressi$,It. ", !, 0%,?.4-ei-4
4 If Ile ingtruillent drift; during 'Y4410 .00) abporbai4, use'the'
4, a,.;
it-
zeroing, alloit .i -1Onter. time. ... " 4, at .a, ....---,
. 1,
12 Insbtt e szeontainIng distilled.111° 114.1: ,..,
.''..
; water using lye techniques doted in0
#. - . a. .5;6 and 7%abose:
G
1. If necegsary,,uSe the right kilobto re-set the needle at zero absorbance.
a ;- -14 Removt-the cell_and insert thinceliC__
of pel'manganate solution using the
22-2 (1 91.-L techniques noted,in 5, 6 and 7 above.' 9 t
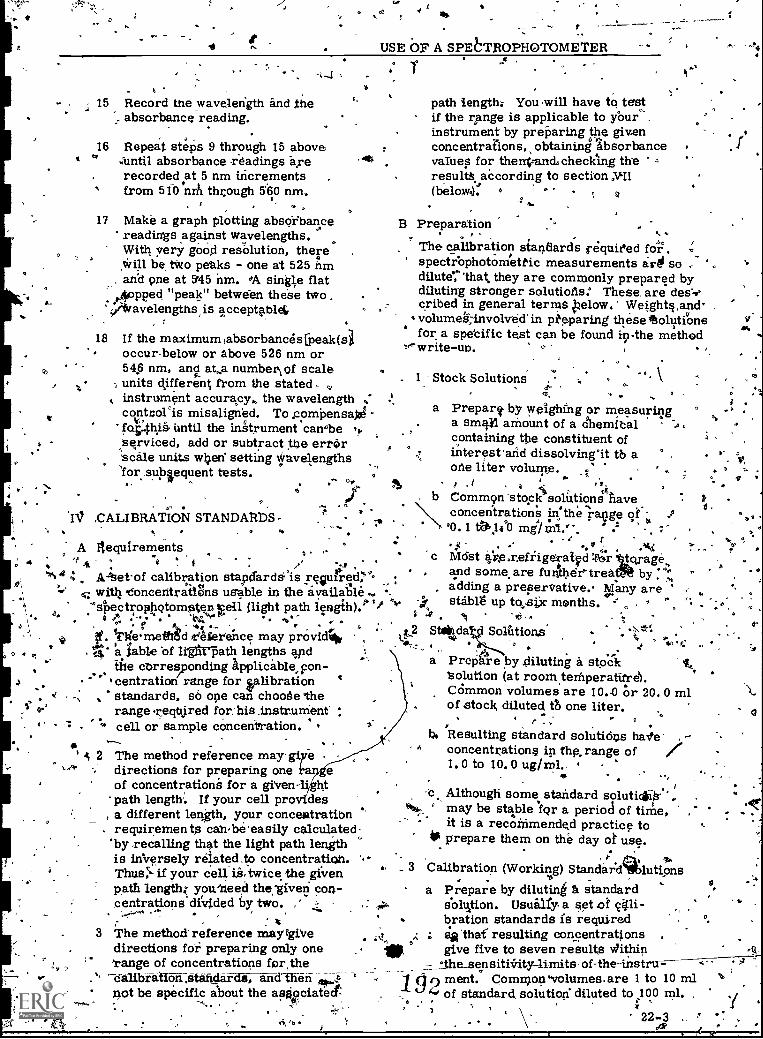
o
e
15 Record the wavelength and theabsorbance reading.
16 Repeat steps 9 through 15 above* ;until absorbance -readings lie
recorded at 5 nm incrementsfrom 510 'nth thgough 5'60 nm.
o
17 Make a graph plotting absoVbancereadings against wavelengths.With very good resolution, therewill be tWo peaks - one at 525 nmand one at 545 nm. 0A, single flat
,...0.4opped "peak" between these two .
yetvavelengths is acceptablei,
18 If the maximumtabsorbancesipeak(s3occur below or above 526 nm or546 nm, and atsa number\ of scaleunits different from the stated.instrument accura,cyk the wavelengthcorntrol`is misaligned. To ,comPensaitd °fa;..thia, until the instrument can4be iserviced, add or subtract toe errorscale units when' setting wavelengths
subiequent tests.
I/ ,CALIBRATION STANDAMDS
A Requirements- . , . . ,- 'c
*4%4 :. AAsetof calibration stapdarda.'isregurreir. ; °
4 4-,, witlz t oneeritratlens usable in the available ..t
'st)ectrophotomgen tell (light path lesgiliV", **" 47)$ oi''' a ,, ...; 'kte,'" -
°
,-;*
als
USE OF A SPEeTROPHOTOMETER
path length: You will have to testif the range is applicable to yourinstrument by preparing the givenconcentrafions obtaining absorbancevalues for thenVandcheckIng theresultS, according to section MI(below): 0
4E?
lo
B Preparation.
The calibration standards pequieedspectrOphotOmettic measurements are sodiluter 'that, they are commonly prepared bydiluting stronger solutions: These, are dea..°cribed in general terms :zelow.' Weight§,andvolumeitinvolved' in pieparing these tolutiOnefor a specific test can be found in-the method
te'write-ub.
. 1 Stock Solutions
a Prepare, by weighing or measuringa small amount of a chemicalcontaining the constituent ofinterest and dissolvinit tb aone liter volume.
.1 e
4 vb Common stock solutions thave
concentrations in'therange, t'T. 1 mg/ yd." 2,
7. ,
-0.Mast ake.r.eirigeratvd-fbritcu-age,and some are funthe'r-treafM by ^
adding a preservative.. any arestablg up to,ik Months. ", - ":0"
. '.3 ;.
V41,ff. Tieme d ,reerence may providlih.,,4, a table of lieir-path lengths arid
,,the cbrresponding Applicab/e,pon-centration range for calibrationstandards, so one can choode therange reqtkired for, his .instrument
- cell or sample concentfration.
4 2 The method reference may-gi edirections for preparing oneof concentrations for a given- ht
'path length. If your cell pro des, a different length, your concentrationrequirements canbe'easily calculated
'by recalling that the light path lengthis inversely reiated.to concentration.ThusL if your cell iertwice the givenpath 'length; you^need the,given con -centrations- divided by two.
.o-".
4 `
3 The method' reference mayTgivedirections foi preparing only one'range of concentrations fpr,thecalibration .standards, and Then ,etznot be specific about the asfiociateT
VS,Jb
aa Prepare by diluting a stock'solution (at rooniternperatifrel.COmmon volumes are 10.0 or 20.0 mlof stock diluted tb one liter.
°
b. Resulting standard solutidns hadeA concentrations in the, range of
1. 0 to 10. 0 ug/rnl.
O Although some standard soluticti'may be stable for a period of time, ,
it is a recoinmended practice toprepare them on the day of use.
3 Calibration (Working) StandarC111-b lutions
a Prepare by diluting a standarddohltion. Usualfy- a set of c41i-bration standards is required.
that- resulting concentrations
1
give five to seven results withinhe sensitiiriLyimi #s of-the-instru---ment. Common"volumes.are 1 to 10 ml
- of standard solution' diluted to 100 ml.
22-3

I
USE OF,A., SPECTOPHOTOMETER
b Resultipg.solu ns mighthave condintrati s.in therange of 0.01 &pd.)... 0 ughml.
c A reagent blank (distrled.
water) should - be includedin the set of standards.'. j
4 Adjusting Concentrations
°..
a Yob may find it necesSary. to adjust preparation.quantities- given in the me hod write-up, .
.... 'because your c 11 (light path 'length) differs ifm the .
example..
These adjustments arediscussed in *Requirements(abovA and are usuallyappliedio the Standard,.(intermediat ) Solution.
.
C chemical' T ..eatm nt. ..
,r--,_,-.--.'''''1 ,Mostbalorim trIc;methods. require that e calibration
.standards ( luding thereagent bla ) are to betreated ,as t e sample.. Thus,they are to e processedthrough pre reatments and
, through the test as if theywere samp es. Then any
_
test effect- on sample resultswill be co per23ateAby the
' same effec s on resul;ta ob-tamed for e 'treated standards:
. ,
,
e aware that pH is .
dition for mostcororimetric 'reactions.Ordinarily, a H. adjustnient .
is included in e test methodand rea exits inc de chemicalsto control pH. Thus,the pro-fessed standards correspond to*the samples regatding pH, and.thus they correspond in degreeof color development. If stand-ards are processeVinsom,e
----other manner, they-must bepH adjusted to correspond tothe samples at the time ofcolor development. ,
`b
pne shoulda critical c
Mt,
22-4
9.-
V SAMPLE DILUTIONS
A Concentration
The.concentration.of the sample must/result in'an absorbance within the range'of the calibration standards,* i. e., accu-rately detectable in the light /Seth providedby the instrument. A ilution before analysismay be required-to accomplish hitTT It-isnot accurate to dilute a sample after pro-cessing in order to obtain a usable absorb-Alice reading.
1 Record dilution volumes so a dilutionfactor can be calculated and appliedto results..
2 An analyst often has a good estimate ofthe expected concentration of a sampleif s/he routinely tests samples fromthe same source. In this case, as isindle
'dilution, if any, is usually sufficient.
If a sample is from an unknown source.,,---the analyst has several choices.
Process the sample. If -the readingshowait is too concentrated, diluteit until you get a value in the usablerange. This result is not `accurateenough to report, but you now knOw.him to dilute the sample to proces6it through the test to get usable re-sults.
a
0
7b Prepare at least a 50% diluti6n andanalyze it plus an undiluted aliquot.
c Prepare a,variety of dilutions.
4 Use some other analytical methodto get a rough estimate of the ex-pected concentratiOn\
3:3EFinal Volumes
1 Dilute to a final volume sufficient to rinsethe measuring glassware and provide the.test svblume cited in the referenced method.
2 Save any undiluted sample.,
193.

VI PROCEDURE FOR USING A SPECTRO-PHOTOMETER
A Zeroing Operation
The following steps haye been Writtenfor spectrophotometers used in thiscourse.' Check the manual for theavailable instrument for the stepsapplicable for your work.
1 Set the wavelength control tothe setting specified for the
:standards you are testing.Approach the setting by be-
. ginning below the numberand dialing up to it.
2 If a cell is in the holder, re-move it.'
3 , Close the cell holder-cover.
4 Turn the power switch/ zerocontrol (left) knob until the .
needle reads infinite (symbol co )absorbaripe (on the lower-scale).
5* Rinse-#cell two times withtap water, two times withdistilled water, then twotimes with the reagent blanksolution.
6 6 Fill the cell about three -fourths full with reagent
, blank-solution. ,
7 'Thoroughly wipe the outsideof the cell with a tissue toremove fingerprints and anyspilled solution. Hold thecell by the top edges.
8 Open the cell holder cover andgently slide the cell down intothe sample holder.
9 Slowly rotate the cell untilthe white vertical line onthe cell is in line with theridge on the edge of thesample holder.
es)
USE OF A SPECTOPHOTQMETER
,,
10 Clos he cover and turn the lightcontr. I (right) knob until the needlereads zero absorbance (dn the .lower scale).- .Record an absorbance of zero forthis zero concentration solution ona data- sheet. (See next page),,
12 Slowly remove the cell and close thecover-6 No solution should spill insidethe instrument). Keep the solution inthe cell.
13 \, Tht needle .should return to-the infiniteabsorbance setting. It it does not:
a Reset the needle to thew absorbancemark using the power switch/zero(left) control knob.
b Re-test the reagent blank solutionu,sing steps 7 through 12'above.
c If the needle does not return to the--co absorbance mark, another settingas noted in a. and b. is required.AdditionaL warm-up time may benecessary before these settings canbe made.
B Reading Absorbances..
Using a single cell in the spectrophotometersBused in this course
1 Discard any solution in the cell.
2 Rinse the ce4ll two times with tap water,and two times with distilled water. Then
- rinse it two times with the lowest concen-f tratioii standard remaining to be'tested,
or with processed sample.
3 Fill the cell about three-fourths full withthe same standardor °sample.. '
4 Use a tissue to remove any fingerprintsfrom the cell and any droplets on theoutside. Hold the cell by the, top edges.
5 'Open the cell holder_cover and'gentlyslide the c01 down into the sample holder.
2?:-5
1".
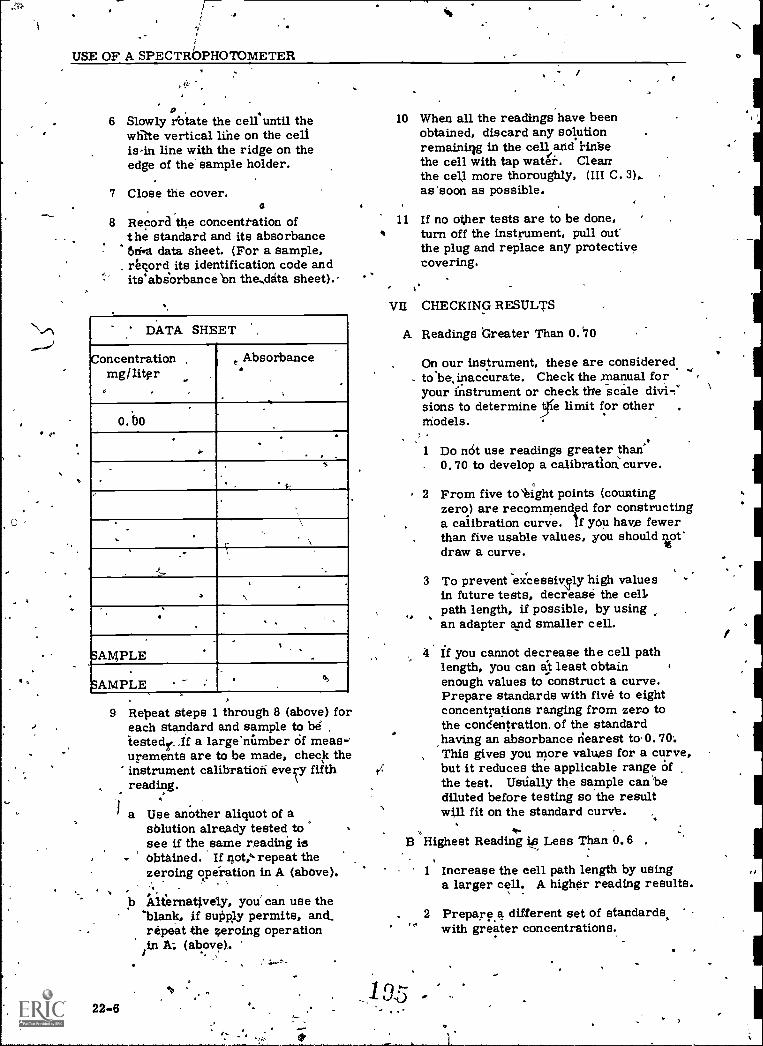
U
..
USE OF A SPECTROPHOTOMETER
6 Slowly rbtate the cell until thewhite vertical lihe on the cellis-in line with the ridge on theedge of the sample holder.
7 Close the cover.
8 Record the concentration ofthe standard and its absorbance
. brfra data sheet. (For a sample,t4qord its identification code andits.abiorbancebn the-Akita sheet).
DATA SHEET
Concentrationmg/liter
,,
e Absorbance.
.
,
0.b0.
.A,
.
..,
\
-f,-,
I.
..
\.
'. -
.
SAMPLE
SAMPLE. . 0,
9 Repeat steps 1 through 8 (above) foreach standard and sample to betestedr. if a large'rnimber of meas.,urements are to be made, check theinstrument calibration every fifthreading.
a Use another aliquot of aablution already tested tosee if the same reading isobtained. If not,`,repeat thezeroing opeiation in A (above).
22-6
.,b Alternatfvely, you' can use the
blank, if supply permits, an&repeat the zeroing operationin A-. (above).
'o
10 When all the readings have beenobtained, discard any solutionremaining in the cellaridthe cell with tap water. Clearthe cell more thoroughly, (III C. 3)..as'soon as possible.
11 If no other tests are to be done,turn off the instrument, pull outthe plug and replace any protectivecove ring.
VII CHECKING RESULTS
A Readings Greater Than 0.70
On our instrument, these are considered.tobe,inaccurate. Check the manual foryour instrument or check the scale divi-'sions to determine t e limit for othermodels.
1 Do not use readings greater than0.70 to develop a calibration, curve.
2 From five to*ight points (countingzero) are recommended for constructinga calibration curve. If you have fewerthan five usable values, you should not'draw a curve.
3 To prevent excessively high valuesin future tests, decrease the cell.path length, if possible, by usingan adapter and smaller cell.
,
4 If you cannot decrease the cell pathlength, you can at least obtainenough values to construct a curve.Prepare standards with five to eightconcentrations ranging from zero tothe condentration, of the standardhaving an absorbance nearest to 0.70.This gives you more values for a curve,but it reduces the applicable range ofthe test. Usually the sample can bediluted before testing so the resultwill fit on the standard curve.
tiB Highest Reading 14 Less Than 6.6 .
1 Increase the cell path length by usinga larger cell. A higher reading results.
2 Preparea different set of standards,with greater concentrations.
1 (")--u,t)
1
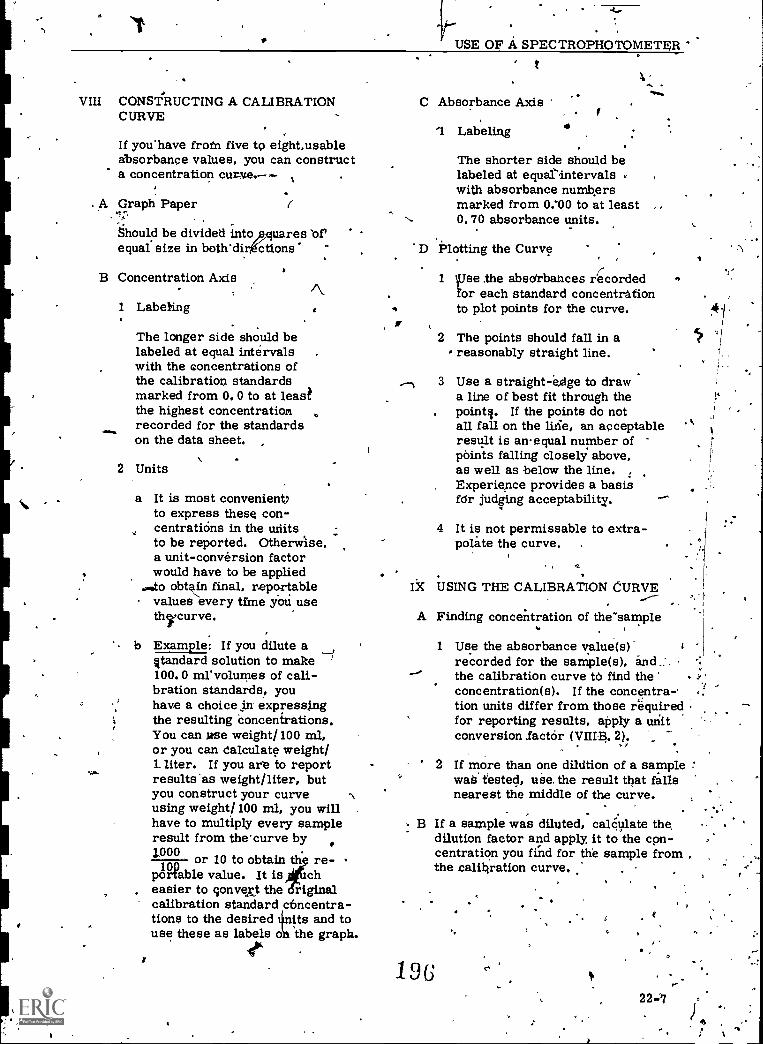
. .
USE OF A SPECTROPHOTOMETER
VIII CONSTRUCTING A CALIBRATIONCURVE
If youhave from five to eight.usableabsorbance values, you can constructa concentration curve.--
. A Graph Paper
Should be divided into
I
res ofequal size in both'di ctions
AB Concentration Axis
1 Labeling
The longer side should belabeled at equal intervalswith the concentrations ofthe calibration standardsmarked from 0.0 to at leasethe highest concentrationrecorded for the standardson the data sheet. ,
2 Units
a It is most convenientto express these con-centrations in the unitsto be reported. Otherwise,a unit-conversion factorwould have to be applied
obtin final, reportablevalues every time Youuseth'curve.
b Example: If you dilute aqtandard solution to make100.0 mr volumes of cali-bration standards, youhave a choice in expressingthe resulting concentrations.You can use weight/100 ml,or you can dalcula4 weight/1. liter. If you are to reportresults 'as weight/liter, butyou construct your curveusing weight/ 100 ml, you willhave to multiply every sampleresult from the'curve by1.000 or 10 to obtain th re-pciPable value. It is icheasier to sonvert the riginalcalibration standard concentra-tions to the desired tits and touse these as labels o the graph.
1kIL
t
C Absorbance Axis
`1 Labeling9
The shorter side should belabeled at equatntervalswith absorbance numbersmarked from 0.'00 to at least
ti 0.70 absorbance units.
'D Plotting the Curve
1
Jse the abscirbances recordedtor each standard concentrationto plot points for the curve.
2 The points should fall in areasonably straight line.
3 Use a straight -edge to drawa line of best fit through thepointq. If the points do notall fall on the lifie, an acceptableresult is anequal number ofpoints falling closely above,as well as below the line.Experience provides a basisfdr judging acceptability.
4 It is not permissable to extra-polke the curve. .
IX U SING THE CALIBRATION CURVE
A Finding concentration of the-sample
1 Use the absorbance value(s)" g
recorded for the sample(s),the calibration curve to find theconcentratiori(s). If the concentra-.tion units differ from those requiredfor reporting results, apply a unitconversion factor (VIII. 2). ,
2 If more than one dilation of a samplewaa tested, uSe, the result that fallsnearest the middle of the curve.
.B If a sample was diluted, calculate the,
dilution factor and apply. it to the con-centration you find for the sample from ,
the calibration curve...
196
z
o
224
0,
14
44 A
USE OF A`ipEcTROPHOTOME-TER
1 Dilutiop Factor=
final dilution volumeml sample used in dilution
2 Example; You diluted 10 intsample 'to 50 ml. The con-centration Idund by using a 'calibration curve was 0.5mg/ liter.
then;
5Gml x 0.5 mg' constituent, mg73. = 10 ml liter
.4"2.5' mg/liter
V
6
1
4
This outline wall prepared by Audrey D.Kroner, Chemist, National Training andOperational Technology .Center, OWPO,USEPA, Cincifnati, Ohio 45268
.Descriptors: Analytical Technique?,Chemical Analysis, Colorimetry,Laboratory Tests, Spectrophotometry
4.
* .
c CHEMICAL TESTS,ORSERVATIONS,AND MEASUREMENTS IN THE FIELD
I INTRODUCTION'4`...
A Laboratory deterrninat4.ons' with approvedequipment and convenient facilities, by-experienced specialists generally areeasier, faster, and more reliable. It isadvisable to transport thi samples to thelab>aratory whenever it-is feasible to do so.
B Field tests are essential because:
-1 Certain sample components are.ipherently unstable with respect tobiological, chemical, or physicalchanges. Any test result performed inthe labilmatory may.not represent trueconditions on site at the tifne becauseof delay, displacement, or changedconditions. ;
2 Subsequen pperations gene ally may becoordinate and made more meaningfulby preliminary on site field investigationto identify and evaluate problems, locatecritical areas, and minrmizesurprises.
4
II FIELD TEST CONDITIONALCONSIDERAIONS ,
1A ,Mciving the laboratory into the field means
:improvisation and adaptation to, more"primItive"-c 'tions.'
'1 Rugged constyfiction of field equipmentis a first consideration. Sturdy andconvenient cases are required; the caseoften may be the only available work-bench. Polyethylene bottles, beakeis,burets, and pipets generally arenecessary to eliminate breakage of
, fragile glass.\
2 Portability is dssential, particularlywhen the site is not accessible by boator car. Ideally, the field kit shouldbe small enough and light enough to be --'
carried by one person for extendedperiods.
CFI. 4c.).0. 75
4,
3 Procedures for field use are restrictedin equipment and manipulation: Ingeneral, it is not possible to use long,tedious routines or highly precisemeasurements. Numerous reagents- generally cannot. be. carried. Quickpositive reactions are essential. Smallvisual comparators, test papqs or spottests are popular. Titration assembliesmust be modified for field use. ,/
/4 Instrumentation increases objectivity
of the measurements but the instrumentsmust be adapted to the items outlinedinII. A . 1, 2 and 3.
The instruments commonly used mustbe simplified yet rugged enough to keepworking in spiteol temperature changes,
-moisture, bumps, etc. A meaningfulvalidation procedure must be worked outfor calibration on Ate with simplladjustment or repaid for emergencies.
5 Personnel engaged in field testing. oftenare unaccustomed to laboratory
. .
procedures. Advance training isessential in procedures and instrumentation.used. Field testing is a multi-disciplinarian oPeration:
a The individual,s must be goodobserirers and recognize what.mayb.significant later.
b They must be good interpretersof a variety of observed andderived test information.
c They must be good technicians tofollow prescribed proceduresdFigently and.recognize anomalousbehavior when it occurs.
d They must be good reporters todescribe what happened, whereit happened, and when. Failu?reto report anomalous behavior
199
.
25-1
Chemical Tests Observations and Measurements in the Field
and related events in an understandableand consistent fashion may render theentire effort meaningless because ofsome doubt or inconsistency:Subsequent operations also may be.mislead by the early observer.
B Use of field data imposes certain con-sstraints relatable to the item, the methods,and to the personnel involved:
1 How valid is it?
2 How consistent is it in line with oth4robserved or recorded inforination?,
3 What backup information is requiredto verify suggested information?
C Decisions-must be made on all fielddata applications:
1, Where "in- place" and "now"measurements are required how muclfof the laboratory must be moved outto the site to obtain data reliableenough to meet objectives?
2 Which items are to be determined onsite? Which items in a centrallaboratory?
3 What use is to be made of thepreliminary field estimates?
4 What do you "need" to know?
5 What would be "nice" to know?
6 In line ivith facilities, time, cost,manpower aid objectives, whatCan you determine?
III COMPONENT CHARACTERISTICSFAVORING FIELD TESTING:
'4
A Any item that changes rapidly' during aholding'period as a result of temperatUreor pressure variations, or is highlyreacts from a biological, chemical,or phy cal standpoint, usually meansthat it must be determined on site and inplace with minimum time lapse andmanipulation.
2 op234
nr
A
1 Dissolved gases, such as 02, CO2,H
2S, Cl2, are sensitiveto pressure
or temperature changes and mayreact with other Sample componentsreadily. These require in place andnow readout.
2 The collective analysis of 'all 'formsof a given item may be preservedand analyzed later. Estimates ofdifferent forms'of the sane substanceare not subject to delay unless theycan be separated, promptly. Examplesof this include the relative ratios ofoxidized or reducecesihstances, suchas Cu 1 andtCu ..Fe and Fe , Cr +3.+2 -
arid Cr+6+3
z,,hy,drolysia is the prinOpalfactor in the ratios of organic andNH3.-N and in changes among organic,poly and Ortho-P,
3 Reactive Substances contributing toitoxygen. demand" tests, such as BO;or other respiratory tests generallyrequire a minimum time delay beforetesting and are not amenable topreservation without altering results.
4 Soluble/insoluble ratios commonlychange with.timed conditions dueto comAxation, hydrolysis?recipitation, agglomeration, orother factors. Particulate size mayincrease or decrease. Solubles maybe sorbed on or desorbed frdm solidsurfaces. Settleability or turbidityare transient phenomena subject tochange with time or conditions.
5 'Biological progressions are dynamicentities that shift among "critters"in relation to predominenCe invariety, numbers, growth, and decay.Whatever is, will change in response'to nutrition and conditions..
. .
SITUATIONS FAVORING FIELD TESTING
d
Preliminary.inforraat ion often is neededto guide situation evaluation, problemidentification, on site variation withrespect to cross section, depth, ortime. These data are Useful to determinewhether there is a problem or not andfor planning4of subsequent operations.
-t
J
k
Chemical Tests Observations and Measurements in the Field
1 It may be necessary to locate suspectedinflows, channels, or sources of itemsaffecting water quality.
2 Definition of mixing zones often isrequired.
3 Laboratory time may be reduced ifapproximate concentrations of itemssought are known. ,
O ,
4 Field tests or observations maysuggest other tests that are morecritical in evaluation of the givensituation.
6 Stratification may be evaluated for°guidance of subsequent operations..
' 4
_, 6 Knowledge of the distribution ofcomponents is:useful for selectingmeaningful future sampling sites.
B The iield,teat may be used to checkcompli'ancelv.ith regulations prior fomore rigorous ba.ckup"testr
r An estairlished operation may be incontrol or out of control.
S
.
C
e
2 The field test may reveal'which of.multiple discharges are in conformance.
3 Undisclosed discharges may becomeapparent. .
4 It may be necessary to,"track': somehazardous discharge down stream toguide subsequent users on the'choiceof Wake or storage water.
5 A complaint or inquiry may be' evakua.ted by field tests.
In-plant field type tests are essentialto guide operations. toward the productionof continuous high quality effluents.R'ecord tests commonly are provided toolate to do anything about the situation;'quick test results are emphasized forprocess control because time, manpower,and change arecritical.
t.,
J
c
so,
t.
r
4I Surprises in the form of wastewater
changes ,in flow, concentration, orsignificant components are common for
, treatment ,process operators. Theyneed quick numbers rather thanimpressions to distinguish real fromapparent problems.
.2 Process upsets are minimized or
., prevented by regular and meaningful"tests from which trends maybeestablished. Small imbalances may becorrected before they become major, 'upsets. '
3 Backup or supplementary treatmentsuch as coagulation, 6:dsorptiort,neutralization, may prevent seriousprocess disruption if tests indicatethe problem and its mb.gnitigle in timeto. do something aboutit.
V TYPICAL FIELD 'PESTS -*INSTRUMENTALAA pH is one of the simplest and most valuable
field tests. If mineral acids or alkalies instable form are the contributing factors,then color indicators; comparators,impregnated papers or like devices may beused to obtain an estimate of pH. To obtaina pH value for Nl;)DES report purposes ,. anelectronic sensor (electrode) and extenkonwire to In indicator instrument (meter) is
-.esseptial.
This measurement should be -done on sitebecause pH is significantly affected byseveral variables. 'Temperature directlyaffects the pH of solutions. 'Free CO2 insolution, particularly in samples from thevicirkity of benthic,deposits or activebiological systems, is another majorvariable. Any delay, temperature orpressure change or sample manipulationWill affect the free CO2 concentration ofthe solution and thereby alter the pH' '
' response. t. .,
Electronic pH instruments are producedfor field use by many apparatus supplyfirms. With care, they function effectively.-
,
i.201
J .
4
23;3
,,
,
cl)
.
s.
Chemical Tests Observations and Measurements in the Fijo1
B Conductivity is. a very useful index ofionic materials and usually may becorrelated with wet chemical data togive a reasonable correlation with totaldissolved solids for a given mixture.This test I's very useful to detect salineintrustions or discharges, springs,hidden channels of different salinityfrom the main b of water. Severalreliable instrument are marketed.
C DO analyzers are available for field useapplication from several manufacturers.Theydiffer in portability, accessoryequipment and in versatility so that it ispossible to obtain one or more fitting almostany requirement. These units are basedupon reduction of oxygen at the cathodesurface to convert chemical to electricalenergy. Direct measurement of electricalenergy produced or the change in somecarrier current or voltagd may be used forreadout. The signal may be amplified inline with sensitivity to give direct' concentra-tion readout. Temperature compensation isuseful and available. Membrane covered _sensors selective for disSolve'd gases protect .sensor surfaces froth most interferingcomponents. The analyst must learn to usehis particular 'instrument effectively to enableIiiin to obtain valid results under- conditionsin which a wet chemical procedure would be
: misleading.
0
ti
PQWder pillows for buffer and indicatorare available to facilitate conducting thehardness titration in the field.
0 Chlorine tests using orthotolidine in acomparator frequently, are used for rapid
. on-site measuilenients. The necessaryequipment is readily available frOm
-several manufacturers. To obtain results.for NPDES report purposes, one must 'use alitration procedure involving eithera Starch-iodide, color-change end pointor else a meter which Provides amperage-change end pointdetection. f
VU MYMMARY.,
VI TYPICAL FIELD TESTS -'WET CHEMICAL, ,
A DO titrations fqr clean water samples maybe adapted for field use by shifting to dryreagents encased in plastic pillows,substituting phenylarsine oxide for this)and using plastic burets, sample containers,'etc. -Powdered starch substitutes also areavailable. Sarciple sizes may be altered along'with reagent concentration to maintain the 1 to,
ratio of DO to titrent volume., DO test kitsare ayailablNrorn several manufacturers.Many agencies make their Qwn.
43
B Alkalinity and hardn titrations-are.commonly soug under ,field conditionsusing standard cid and EDTA solutions;To obtain alkal results for NPDES reportpurposes, the sam e should\be titrated to .a .
-pH end point using a calibrated pH meter.
ti
24
Simple and rapid field test kits areav able from several manufacturers,iffpliers and scientific apparatus housesfor individual tests, as well ascombination test kits for the itemsmentioned and others.
It is possible for the analyst to devise onesuited to his particular requirements with /.available ! improvised materials,Effecti ess of the field operationdepends on the knowledge and care
Ax-ercised in using the equipment andprocedure. .
. . -CAUTION: Field test results are useful,
. but not alWays valid enoughfor the record.
.
ACKNOWLEDGEMENT:
This outline contains significantmateriEd from a previous outline byD. G. Ballinger.
. .
This outline was prepared by F. J. Ludzack,former'Chemist,:National Training and ,
Operational Technology Center, OWPO,USEPA, Cincinnati, Ohio. 45268.
pescriptOra: Chemical Analysis, On-SiteTests, Water Analysis
BACTERIOLOGICAL INDICATORS OF WATER POLLUTION
Part 1. General Concepts .J
rt
I INTRODUCTION
A Bacterial Indication of Pollution
_ 1 In the broadest sense, a bacterialindicator of pollution is any organismwhich, by its presence, would.demon-strata thai pollution has occurred, andoften suggest the source of the pollution,
2 In a more restrictili enee, bacterialindioatops'of polluti are associatedpkixnarily with de onst tion of con-tamination of water, *originating fromexcreta of warm-blooded animals(including man, domestic and wildanimals, and birds).
B Implications of Pollution of IntestinalOrigin°
1 Intestinal wastes from warm-bloodedanimals regularly include a widevariety of genera and species ofblacteria. Among these the coliform
oup'may bee listed, and species of-tlie genera Streptococcus, Lactobacillus,
aphy/ococcus, Proteus, Pseudomonas,certain spore-forming-bacteria, andothers.
2 In addition, _many kinds of pathogenicbacteriaand other microorganisms 'may be released in wastes on an inter-mittent basis, varying with-the geo,-\graphicarea, state of communityHealth, nature and.degree of wastetreatment, and other fadtars. These,may include the following:
a Bacteria: Species of Salmonella,Shigella, Leptbspira, Brucella,Mycobacterium, and Vibrio comma.
et.
T
3.89
I
fs
..b Viruses: A-wide variety, including
that of infectious hepatitis, \viruses; Coxsackie virus, ECHOvises (enteric cytopathogenichuMan orphan -- ':viruses iti searchof a distase"), and unspecifiedviruses postulated to account foroutbreaks of diarrheal and upperrespiratory diseases of unknown .
' etiology, apparently infective by,thOwater -borne route.
c Protozoa: Endamoeba histolytica
3 As routinely practice'd, batterial.- evidence of water pollution is a test
for fie presence and numbei8 ofbacteria in wastes which, by theirpresence, indicate that intestinalpollution has occurred. In this con-text, indicator groups discussed insubsequent this outline areas fdllows:
a ColifOrmigra4 and certain sub-groupings
:'
b :Fecal streptococci and certainsubgroupings ,
-Miscellaneous dicators of waterquality 4
4 Evidence of water contamination byintestinal wastes of warm-blooded°animals is regarded as evidence ofhealth 11/4ard In the water being tested.
U PROPE RTIES OF AN IDEAL INDICTOR.OF POLLUTION
A An "ideal" bacterial indicator of pollutionshould:
1 he applicable in all types of water. .
2441
f
V
40.).
Bacterlologidal Indicators of Water Pollution. .-
N
2 Always be 'present in water when.pathogenic bacterial constituents offecal contamination are present,
. . Ramificationsorthik includetorjts.densitir should liaise some ,direct
relationship to theidegree of fecalpollution.
b It should have greeter survivaltimein water than enteric pathogens;throughout its course of natural .
disappearance from the water body.c k 'It should disappear rapidly from
water following the disappearanceof pathogens, either through naturalor man-made processes.
d It always should be absent in abacteriologically safe water.
3 Lend itself to routing quantitativetesting procedures-Aithout interierenaeor confusion of results dug to extra-neous bacteria
4 Be harm less to man and other animals
B
)
In all probEibility,Can "ideal" bacterialindicator does not exist, The,discussionof baq.erial indicators of pollution in thefollowing parts of this.outline include .
consideration of the merits and limitationsof each, group, with their applicStions in
, evaluatiiig bacterial quality of wier,a
r'
III APPLICATIONS/OF TESTS FORPOLLUTION INDICATORS
A Tests for Compliance with BacterialWater Quality Standards
.,
1 Potability teats on drinking water toMeet Interstate Quarantine Or otherstandards of regulator! agehcies.
r 3
I
2, Determination of bacterial quality ofenvironmentarlwater for which qualitystandards may exist, such as shellfishwaters, recreational waters, waterresource's for municipal or othersupplies..
24-2\ --'C
a
4rt
2t1
3 Tests for compliance withestablishedstandards in cases involving the pro-,tection Qr prosecution of municipalities,'industries, etc. s
B Treatment plant Process Control
1 Water treatment plants
2 Wasteviattr treatment plants
C Water Quality'and Pollutant Source Monitoring`'
1 Determination of intestinal pollutionin surface water to dete,rmine type andextent of treatment requir,gd for &fin-,pliance with istantlarcis
.
2 Tracing sources of pollution
13 Determination of effects on bacterialflora, due to addition of organic orother wastes
D' Special Studies, stich as.. 0
Tcacingisources of intestinal pathogensin epidbmiblogical investigations
2 investigationS-tbf problems due to the. .
Sphaerbtilus group
1,nyeiptigattons Of bacterial interferenceto certain industrial processes, withrespe,ct to such organthms as Pseudo-*monas, A chrornobacter, or others
IV SANITARY SURVEY ,
The laboratory bacteriologist is not alo e inevaluation of indication of water pollutionofintestinal origin, On-site study (SanitarySurvey) of the aquatic environment andadjacent areas, by a qualified person, is anecessary collateral study with the laboratorywork and frequently will reveal informationregarding potential bacteriological hazardwhich may or may not be demonstratedthrough laboratoryjindings froni'47alingle
'sample short series of samples.
/T
ti
.
A
-4
Bacteriological Indicators of Water Pollution
4-
Part 2. The Coliform Group and Its Constitueffts
I ORIGINS AND DEFINITION v
A Background4 t
In 1885, Escheiich, a pioneer ba6teri-ologisto-recovered certain bacteria fromhuman feces,' which he found in suchnumbers and consistency as to lead himto term these organisms "the_charac-teristic organism of human feces."
:
He named these organisms Bacteriumcoli- commune and B. lactis aerogenes.
,171895, another bacteriologist,IVIigala, renamed B. coli commune asEscherichia ca, which today is theofficia9 l name for the type species.
2 Later work .hls substantiated much ofthe Original concept of Escherich, buthas shown that the above species arein fact a heterogeneous complex ofbacterial species and species variants.
a This hetero eneous group occurs not _only in hums eces but representativesalso are, to be found in many environ-mental media, inclu'ding sewage,surface freshwaters of all categories; /in and on soils, vegetion, etc.
418,The grouVemay be gadivi de cr intova t s categories on the basis ofnu ous bioChemical and other.difie ential *as that may beaPplied.
b
B 'Composition of the Coliform Group.,
1 Current definition
As defined in "Standard_ Methods for the,Examination of Water and Wastewater"(14th ed): "The coliforrn group deludesall of the aerobic andlacultativeanaerobic, Gram-negative, nonspore-forming-Tod- shaped bacteria whichferment lactose with gas forMationwithin 48 hours at 350 C. "
ti
e.
4
2 They term "conforms" or "colifOringroup" is an inclusive one, including\the following bacteria which maymeet the definition above: ,
a Escherichia coli; E. aurescens,E. freundii, E. intermeclia
Ente,robacter aero es, E. cloacae
c Biochemical interm diatep betweenthe genera Escherichia and Erktero-bacter
3 There is no provision in the definitionof conform bacteria for "atypical" or"aberrant" coliforrn strains.a An individual strain of any of the above
species may jaail to meet one of thecriteria of the conform group.. .
b Such an organism, by definition, isnot a member of the coiform group,
, even though a taxonomic bacteriologistmay lie'Rerfectly correct in classifyingthe strain in onej>tette above species.
II SUBDIVISIONOF COLIFORMS INTO"FECAL" AND "NONFECAL"CATEGORIES
A Need
Single ,teat differentiations betweenconform's of "fecal" origin and those ofit IIn ecal origin are bated otheas ption that typical E. Cali-and
ely related strains are of fecalor While E. 'aerogenes'and its. close
latives are not of direct fecal origin.(Th latter assumption isnot filly borneout by investigations at this Center.See Table 1, IMViC Type Anumber of single differential tests havebeen proposed to differentiate between"fecal" and "nonfecal" coliffIrms.
o
24-3
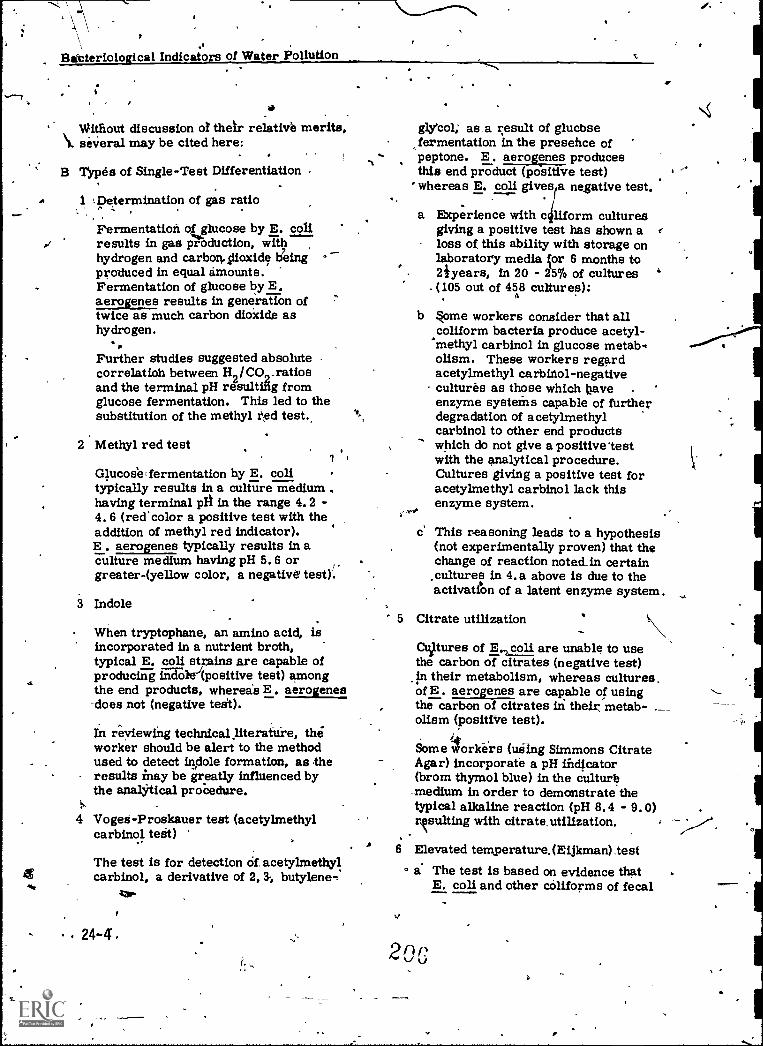
a
Bacteriological Indicators of Water Pollution
Without discussion ot their relative merits,several may be cited here:
B Types of Single-Test Differentiation
1 Determination of gas ratio
Fermentation otglucose by E. coilresults in gas production, withhydrogen and carbon.ilioxide beingproduced in equal amounts.Fermentation of glucose by E.aerogenes results in generation oftwice as much carbon dioxide ashydrogen.
Further studies suggested absolute -
correlation between H 2/C09-ratiosand the terminal pH resulting fromglucose fermentation. This led to thesubstitution of the methyl red test.,
2 Methyl red test1 .1
Glucoiefermentation by E. colitypically results in a culture mediumhaving terminal pH in the range 4.2 -4. 6 (red color a positive test with theaddition of methyl red indicator).E . aerogenes typically results in aculture medium having pH 5. 6 or
,
greater-(yellow color, a negative test).
3 Indole
When tryptophane, an amino acid, isincorporated in a nutrient broth,typical E. coli strains are capable ofproducing indoleripositive test) amongthe end products, whereas E. aerogenes
-does not (negative test).
In reviewing technicalliterature, theworker should be alert to the methodused to detect Indole formation, as theresults May be greatly influenced bythe analytical procedure.
4 Voged-Proskauer test (acetylmethylcarbinol teat).The test is for detection Of. acetylmethylcarbinol, a derivative of 2, 3-, butylene,
var.
. 24..4
glycol; as.a result of glucbsefermentation in the presehce ofpeptone. E . aerogenes producesthis end product (positive test)
° whereas E. coli gives a negative test.
a Experience with c liform culturesgiving a positive test has shown aloss of this ability with storage onlaboratory media cor 6 months to21years, in 20 - 25% of cultures
. (105 out of 458 cultures):
b Some workers consider that allconform bacteria produce acetyl -
carbinol in glucose metab,olism. These workers regardacetylmethyl carbinol-negativecultures as those which braveenzyme systems capable of furtherdegradation of acetylmethylcarbinol to other end productswhich do not give a positivetestwith the analytical procedure.Cultures giving a positive test foracetylmethyl carbinol lack thisenzyme system.
c This reasoning leads to a hypothesis(not experimentally proven) that thechange of reaction noted_in certain
,cultures in 4.a above is due to theactivation of a latent enzyme system.
5 Citrate utilization NCu).tures of E. coli are unable to usethe carbon of citrates (negative test)in their metabolism, whereas cultures.of E . aerogenes are capable of usingthe of citrates hi their metab-olism ( positive test).
SOme4orke'rs (using Simmons CitrateAgar) incorporate a pH indicator(brom thymol blue) in the culturemedium in order to demonstrate thetypical alkaline reaction (pH 8.4 - 9.0)rrulting with citrate. utilization.
. 6 Elevated temperature,(Eijkman),test° a The test is based on evidence that
E. coli and other coliforms of fecal
20c
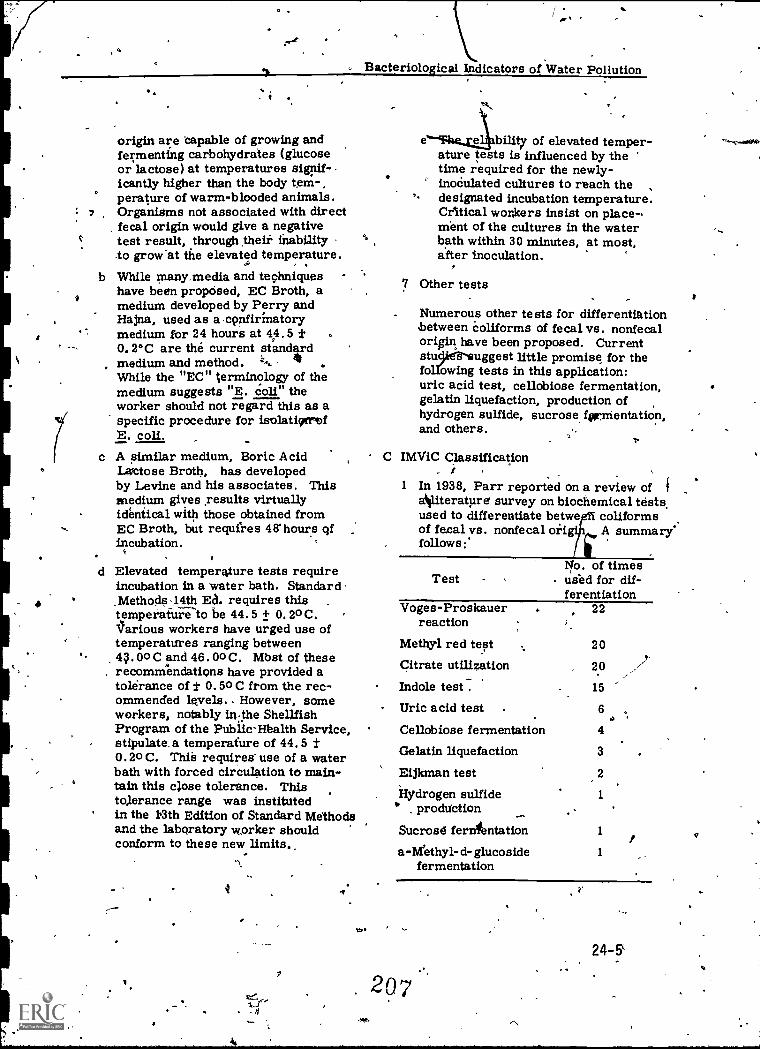
I
origin are 'capable of growing andfermenting carbohydrates (glucoseor lactose) at temperatures sighif--icantly higher than the body tem-,perature of warm-blooded animals.Organisms not associated with directfecal origin would give a negativetest result, through their inability.to grow 'at the elevated temperature.
While many,media and techniques -
have been proposed, EC Broth, amedium developed by Perry andHajna, used as a cpnfirinatorymedium for 24 hours at 44.5 ±0.2°C are the current standardmedium and method.While the "EC" terminology of themedium suggests "E. coli" theworker should not regard this as aspecific procedure for isolatiqerofI. coll.
c A similar medium, Boric AcidLe;ctose Broth, has developedby Levine and his associates. Thismedium gives results virtuallyidentical with those obtained fromEC Broth, but requires 48'hours ofincubation.
7
b
3
d Elevated temperature tests requireincubation in a water bath. Standard.Methods,14th Ea. requires this .
temperature to be 44.5 0.20C.Various workers have urged use oftemperatures ranging between44.00 C and 46 . 00 C. Mbst of theserecommendations have provided atolerance of ± 0.50 C from the rec-ommended levels.. However, someworkers, notably in.the ShellfishProgram of the Public-Hbalth Service,stipulate a temperature of 44.5 ±0.20 C. This requires-use of a waterbath with forced circulation to main-tain this close tolerance. Thistolerance range was institutedin the Ilth Edition of Standard Methodsand the laboratory worker shouldconform to these new limits.,
9
. ft
Bacteriological Indicators of Water Pollution
ta
bility of elevated temper-ature tests is influenced by thetime required for the newly-inoculated cultures to reach the ,designated incubation temperature.Critical workers insist on place-,ment of the cultures in the waterbath within 30 minutes, at most,after inoculation.
Other tests
Numerous other tests for differentiktionbetween coliforms of fecal vs. nonfecalorigin have been proposed. Currentstu9ieVvuggest little promise for thefollowing tests in this application:uric acid test, cellobiose fermentation,gelatin liquefaction, production ofhydrogen sulfide, sucrose fwirnientation,and others.
C IMViC Classification
1 In 1938, Parr reported on a review of I
aSliterature survey on biochemical testsused to differentiate betwe coliformsof fecal vs. nonfecal on A summary'ifollows:*
Testo. of times
used for dif-ferentiation
Voges-Proskauerreaction s.
22
Methyl red test 20
Citrate utilization 20 /7Indole test-. 15
Uric acid test . 6
Cellobiose fermentation 4
Gelatin liquefaction 3
Eijkman test 2
Hydrogen sulfide 1
production
Sucrosd fernientation 1
a- Methyl- d- glucosidefermentation
1
207
24-5'

L.
Bacteriological IndiCators of Water Pollution
2 Based on this summary and on his own-studies Parr recommended utilization'of a combination of tests, the indolelmethyl red, Voges- Proskauer, and thecitrate utilization tests for this differ-entiation. This series of reactions isdesignated by the mnemonic "IMVi-C"--.Using this scheme, any conform culturecan be described by an "IMViC Code"according to the reactions for eachculture. Thus, a typical culture ofE. eoli would have a code and atypical E . aerogenes culture wouldhave a code -44.
3 Groupings of conforms into fecal,non-fecal,' and intermediate groups,as shown in "Standard Methods for theExamination of Water and Wastewater"are shown at the bottom of this page.
D Need for Study of Multiple Cultures- +-
All the systems used for differentiationbetween Conforms of fecal vs. those ofnonfecal origin require isolation and sttidyof numerous -pure cultures. Many, workersprefer to study at least 100 cultures fromany environmental source before attemptingto categorize the probable source of thecoliform
4. I
1
IN.
2416
Organism
III
.
,NA TURA L DISTRIBUTION OF COLIFORMBACTERIA-
-
A Sources of Background-Information
Details of the voluminous background oftechnical informatioh on coliform bacterlarecovered from one or more environ-mental media are beyond the sdope ofthis discuEisioli. References of thisoutline are suggested routes of entryfor workers seeking to explore thistopic.
.B Studies on Coliforin Distribution
1 . Since 1960 numerous workershave engaged in a continuing study ofthe natural distribution of coliform
-bacteria and an evaluation of pro-ceduresfor differentiation betweencoIlforms of fecal vs. probable non-fecal. origin.. Results of this workhave special significance because:
a Rigid uniformity of laboratorymethqds have been applied through-out the series of studies
b Studies are based on massivenumbers of cultures, far beyondany similar, studies heretoforereported
INTERPRETATTON OFqMV1C REACTIONS
IteldY1 1YrEcsailer Citrate
Escherichia coliCitrobacter freundiiKlebsiella-Enterobacter group
+ or
+ or -
r-i
\
2 f Q
.9
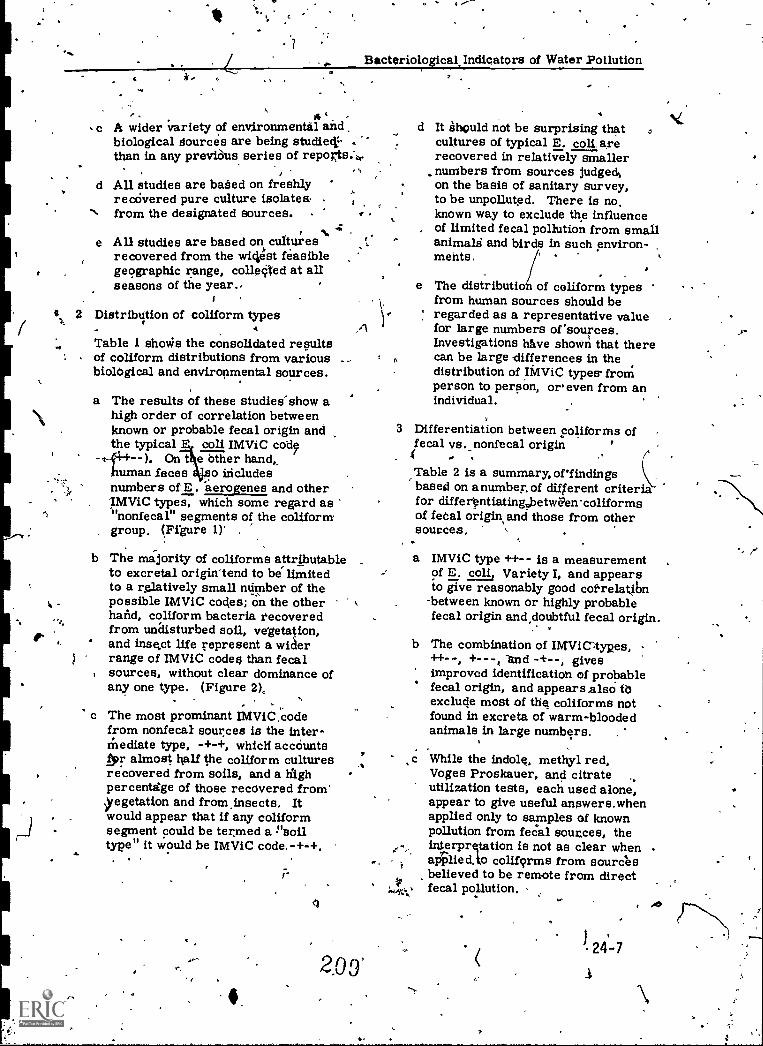
4
.1
Bacteriological, Indicators of Water Pollution
A
c A wider variety of environmental and,biological Sources are being studiest- 4than in any previOus series of reports.-.4.
d All studies are based on freshlyrecovered pure culture isolates,- from the designated sources.
e ALI studies are based on culturesrecovered from the wiciest feasiblegeographic range, collected at allseasons of the year.,
2 Distribution of coliform types4
Table 1 shovis the consolidated resultsof coliform distributions from variousbiological and environmental sources.
a The results of these studies show ahigh order of correlation betweenknown or probable fecal origin andthe typical con IMViC code
On t e Other hand,,uman faces o includes
numbers of E. 'aerosenes and otherIMViC types, which some regard as"nonfecal" segments of the conform.group. (Figure 1)' .
b The majority of coliforms attributableto excretal origin'tend to be limitedto a relatively small number of thepossible IMViC codes; on the otherhand, coliform bacteria recoveredfrom undisturbed soil, vegetation,and inse,ct life represent a widerrange of IMViC codes than fecalsources, without clear dominance ofany one type. (Figure 2),
c The most prominent IMViC.codefrom nonfecal sources is the inter-Mediate type, -+-+, which accountsNr almost half the coliform culturesrecovered from soils, and a Highpercentstge of those recovered fromtregetation and from.insects. Itwould appear that if any coliformsegment could be termed a !'soiltype" it would be IMViC
1
,.1
d It should not be surprising thatcultures of typical E. con arerecovered in relatively smaller
numbers from sources judged%on the basis of sanitary survey,to be unpolluted. There is no,known way to exclude the influenceof limited fecal pollution from smallanimals and birds in such environ- ,
ments.
e The distribution of conform typesfrom human sources should beregarded as a representative valuefor large numbers of'sources.Investigations have shown that therecan be large differences in thedistribution of IMViC types- fromperson to person, or'even from anindividual.
3 Differentiation between coliforms offecal vs. nonfatal origin
Table 2 is a summary, of'findingsbased on a number, of different criteriafor differantiating,betwgen-coliformsof fetal origin and those from othersources.
a IMViC type ++- - is a measurementof E. coli Variety I, and appearsto give reasonably good correlatibn
-between known or highly probablefecal origin anddoubtful fecal origin.
b The combination of INIViCAypes,+---, itnd -+--, gives
improved identification of probablefecal origin, and appears also tbexclude most of the coliforms notfound in excreta of warm-bloodedanimals in large numbers.
sc While the indole, methyl red,Voges Proskauer, and citrateutilization tests, each used alone,appear to give useful answers.whenapplied only to samples of knownpollution from feCal sources, theinterprqtation is not as clear when .alied.to conforms from sourcesbelieved to be remote from directfecal pollution.
24 -7
0
N4.
' p.

.
Table 1. COLIFORM DISTRIBUT1011 BY IMViC TYPES AND ELEVATED TEMPERAT,URETEST FROM ENVIRONMENTAL AND BIOLOGICAL SOURCES `, . °
IMViCtype i
1
Vegetation Insectse Soil ,Fecal , urces Poultry
No.strains
% oftotal
Undistuibed polluted , .u:'No.
. strains
_, f
4.oftotal
11111111:§ekNo.
strains% oftotal
No.L _. . 'insuas
.% oftotal
No.strains
% oftotal
No.strains
% oftotal
No. % of \strains total
.
--H-+--+++-
-+-+
++-+
I
128
----237-
23
2
168
116
32
291
88
87.
5'19
2
.r 50
1203
. 169*
.14.1*
10.6
19..7
1. 9
0. 2
14.0
9. 6.
2. 7
24.22
7. 3
7. 2
O. 4
1. 6
0. 2
0.4
<0. 1.
134
'113
..0
- Q
332
118
28., 254
46
4;0
0
0,8
8
1084
162*y
14. 9*
12.4
10.4
<0.1
<0.1
30. 6
10.9
2i6
23.44. 2
3. 9
<0.. 1
<0. 1
<0. 1
0. 7
O. 8
131
443
, 78
7
1131
87.
181,159
67
4
1
53
6
0
0
2348
216
5.2
5. 6
18. 8
3. 3
0. 3
536
13
1
0
.80.6
2.0
0.2<0.1
13. 0 .
3. 3
, 0. 7
<0..
1
<O. 1
O. 2
<0. 1
<0. 1
:<9. 1
<0..1
<O. 1
3932
245
. 99
106
50
35
21
&
14
2
0
0
0
2
4512
4349
9C 4
87,.2
5.4
2. 2
2.4 ,
.1. 1
0. 8
0.5
. 0. 1
O. 2
<O. 1
<O. 1
<0..1
<0. 1
<0. 1
<O. 1
2237
.b
14
59
1
27,
0
0 4
0
0
0
0
0
0
2339
2309
98.7
95. t<0.1
0. 6
2.5
<0. 1
1. 2
<0.1
<0. 1
<O. 1
<O. 1
<O. 1
<0. 1
<0. 1.<0. 1
<9. 1
1$57',
ti9 20.
0
5
11
0
0
0
0
0
0
I .02
1896
1765
93.0
97. 9
0.,1
1. 1
<0. I
0. 31
O. 6
<0. 1
i <0. 1
<O. 1
<O. 1
<O. 1
<IL 1
<0. 1
<0. 1
<O. 1!
.
48. 1
3, 7
1.76. 8
2. 9
O. 2
<0.1.
2. 3
0. 3.<6.-r<O. 1
' zat,
87
2-2.
5
0
0
, 1
0
0
0
0
0
665
551
82.9
+-H4
+-H
-44---+-4-+-
-r---!---,+
+---Total -
No. EC +
% EC" +
*120 of thesewers151,1'-i:--
115
*129 of thesewere 14-,27 -+.7 , = ...
.5 4.4.+4
`

\
k:
J
_Bacteriological Indicator of Water Pollution -
HUMANEC af 96.4
8.41.8 ED 94.7
SUMMARY iTyp Percent positive4+--, 912- .
1.5
0.1
--+4 2.8
EC 0) 96.3 .
,BAL8 95.3
4-
.6
LIVESTQCKEC ® 98.7
SALO ED 98.6
POULTRYEC EC (1).93.0
WILLI ED 92.5
FIGURE 1,
COUFOR,MS67 Soil Samples,(Geitireich. et. al.)
;.00
or. 4. yia
131
443 516%
18.8%
6.8159 7.7t
181
+ + +
1.131
48,1%
++
ERSE
+_4
UndisturbedSoil.
3 7
24
536 .
80%
+
Polluted'5oii
4
24-9
4
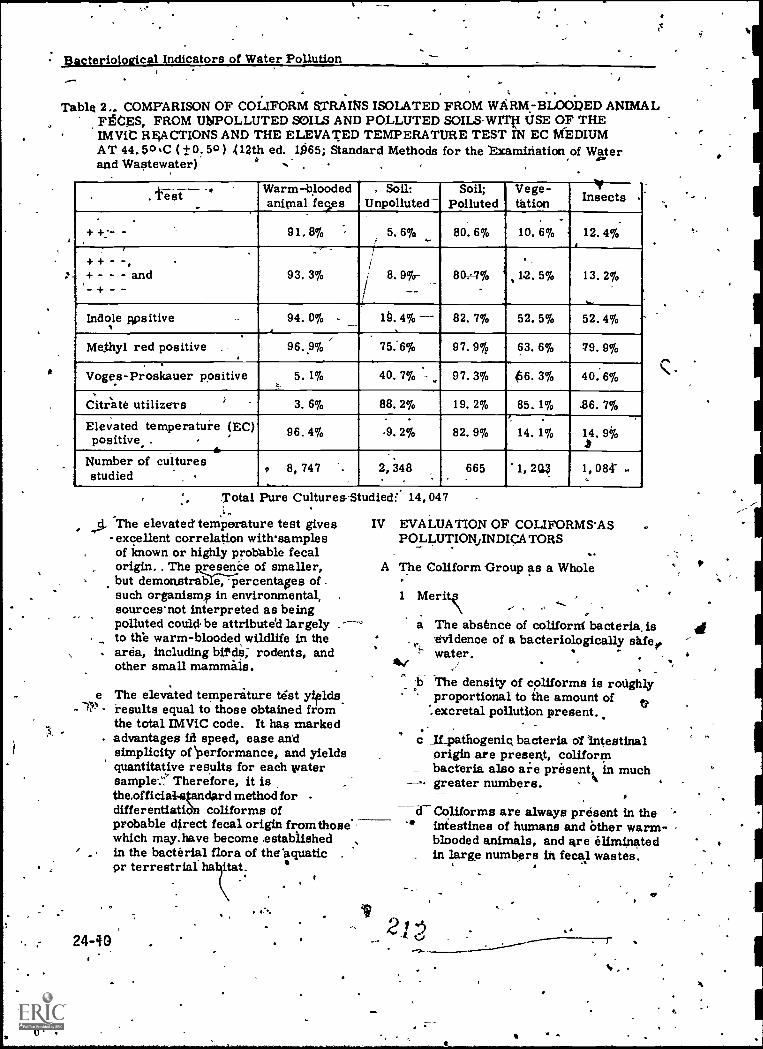
Sacteriological Indicators of Water Pollution
.. t . .
Table 2.. COMPARISON OF COLIFORM aTRAINS ISOLATED FROM WARM-BL001)ED ANIMAL., FECES, FROM UbTPOLLUTED SOILS AND POLLUTED SOILSWITkl USE OF THE
IMViC REACTIONS AND THE ELEVATED TEMPERATURE TEST IN EC MEDIUMAT 44.50 C ( ± 0. 50 ) .(12th ed. 165; Standard Methods for the 'Examination of Water
* - . ....and Wastewater)
a
. 'hest-
Warm-bloodedanimal 'fees
, Soil:Unpolluted-
Soil;Polluted
Vege-teflon
1,---Insects
.
+ +:- - 91.8% ,i
5 6, %4.
80.6%. .
10. 6% .
.12. 4%
.
+ - - - and 93. 3%
..,
/
1
/i/
8. 9%-- 80-7% .1.2. 5% 13. 2%
Indole npsitive -4 ..
94. 0% 10. 4% 82. 7% 52. 5% 52.4%.
Me.thyl red positive .
4
96. 9% 75. 6% 97. 9% 63. 6% 79. 9%
Voges-Proskauer positivea
5. 1% 40. 7% 97. 3% 06. 3% 40. 6%
CitAte utilizers ) . 3. 6% 88. 2% 19. 2% 85. 1% .86. 7%
Elevated temperature (EC)positive.. 96. 4% .9. 2% 82. 9% 14. 1% 14. 9%
atNumber of culturesstudied
, 8, 747 . 2, 348 665 1, 2Q2 1, 084" ..
Total Pure CulturesStudiee,'.. .
The elevated temperature test gives IV. .,.,- excellent correlation withsamplesof known or highly probable fecalorigin.. The RreseaCe of smaller,but demonstrable, -percentages of -such organism in environmental,sourcesnot interpreted as beingpolluted could be attribute'd largely . --to the warm-blooded wildlife in the
. area, including bitda; rodents, andother small mammals.
e The elevated temperature test yields.- F' results equal to those obtained from
the total IMViC code. It has markedadvantages in speed, ease andsimplicity of 'performance, and yieldsquantitative results for each watersample."," Therefore, it istheofficiastandard method fordifferentiatido conforms ofprobable direct fecal origin from thosewhich may. have become .established' . in the bacterial flora of the aquatic .
pr terrestrial ha itat. t1:
24-40
14, 047
EVALUATION OF COLIFORMSASPOLLUTION/INDICA TORS_ .
A The Conform Group as a Whole
1 Merits oa The absence of colifornf bacteria, is, evidence of a bacteriologically sitfee
water.1114r
-b The density of conforms is roughlyproportional to the amount of
...excretal pollution present..
c If_pathogenic bacteria of Intestinalorigin are present, conform
_ bacteria also are present in muchgreater numbers.
Q
dColiforms are always present in the'41 intestines of humans and Other warm -
blooded animals, and are eliminatedin large numbers in fecal wastes.
1
e Conforms are more persist nt-inthe aquatic environment than arepathogenic bacteria of intestinalorigin.,
r Califon:as are'generally harmlessto humane and can be determinedquantitatively by routine laboratoryprocedures.
2 Limitations
a Some of the constituents of the t.conform group have a wide environ-mental distribution in addition totheir occurrence in the.intestinesof warm-blooded animals.
b "' Some strains of the coliform groupmay multiply in certain pollutedwaters ( "aftergrowth "), of highnutritive values thereby adding tothe difficulty of 'evaluating a' pollutionsituation in the aquatic environment.Members of the E. aerokenes sectionof the coliform are commonlyinvolved in this kind of problem.
c Because of occasional aftergrowthproblems, the age of the pollution'may be difficult to evaluate undersome circumstances.
d Tests for coliforms are subject tointerferences due to other kinds ofbacteria. False negative resultssometimes occur when species aPseudomonas are present. Falsepositive results sometimes occurwhen two or more kindsof non-colifOrms produce as from lactose,when neither can do so' alone(synergism).
B The Fecal Conform Component of theConform Group (as determined by elevated
'temperature test)
I MeritsT.
a The majority' (over 95% of the con-form bacteria from intestines ofwarm-blooded animals grow,at theelevated temperature.
Bacteriolo cal Indicators ofWater Pollution
214
b These organisms are of ielativelyrequent occurrence except in
.assoofation with fecal pollution. '
c .Survival of the fecal coliform-groupis, shorter in environmental watersthan for the conform group ase.whole. It follOws, then? that ghdensities of fecal colifOrm8 is
cb indicative of relatively-recentpollution.
'd Fecal coliforms generally do nbtmultiply outside the intestines bfwarm-blooded animals. In certain
fromwastes, Etch asfrom the sugar beet refineries,exceptions have been noted.
e -In some $4.,* ages, -notably those frompulp Ad'pape mills, =Klebsiella hasbeen found' in farge numbersutilizing the elevated temperaturetest. There has been ranch contro-versyv.ersy about whether the occurrence6f.Klebsiella-is due to aftergrowthdue to soluble carbohydrates in suchwastes. The significance ofKlebsiella as an indicator ordirectdischarge Of intestinalwaStes thus,is under challenge. 'he issue isstill further complicated by questions 'over whether Klebsiella and ofitself a pathogenic organism or ispotentially pathogenic. This is a'serious problem' which is the subjectof intensive research efforts.
I
2 Limitaaft
a Feces" from warm-blooded.animalsinclude some (though pr,opoetionatelylowl numbers of coliforms which donot yield a positive fecal coliformtest when the elevated temperaturetest is used as the criterion ofdifferkntiatibn. These organismsare E. coli varieties by present ,
taxonomic classification.
b There is at present no establishedand consistent correlation between
A
Bacteriolo cal Indicators of Water Pollution
_a
e.
ratios of total coliforms/fecalcoliforms in interpretingsanitaryquality of environmental' waters.
In domestic sewage, the fecalcoliform density commonl,y isgreater than 90/0 of the totalcolifo'rm density. In environmentalwaters relatively free from recentpollution, the fecal coliform densitymay range from 10-30% of the totalcoliforms. There are however, .too many variables "relatinitowater-borne wastes 'and surfacewater runoff to permit sweeping
'generSlization on the numericalrelationships betwee fecal- andtotal coliforms.
c .Studies have been maderegarding the survival of fecal
"'conforms in polluted waterscompared with that of entericpathogenic bacteria. In recentpollution studies, species ofSalmonella have been found in the
sliresence of 220 fecal coliforms per100 ml (Spiro), and 110 fecalconforms per 100 nil (Brezenski,Raritan Bay Project).
3 The issue of the Klebsiella problemdescribed in an earlier paragraphmayyiltimately be resolved as amerit or as a limitation of the valueof the fecal coliform test.
/
V APPLICATIONS OF CONFORM TESTS
A. Current Status in Official Tests
1 The coliform group is designated, in"Standard Methods for the Examinationof Water and Waotewater" (14th ed.,1975),.through the Completed TestMPN procedure as the official testfor bacteriological potability of water.
24-12.
!The Confirmed st MPN procedurbeis accepted where it has been demon-strated, through comparative tests,to yield results equivalent to theCompleted Teat. The membrane filtermethod also is accepted for examinationof waters subject to interstate regulation.
2 The 12th edition of Standard Methodsintroduced a standard test for fecalconform bacteria; It'ls emphasizedthat this is to be used in pollution .
studies, and does not apply to the 1"
evaluation ofwater for potability.This procedure has been. continued inthe 13th and 14th Editions.
B Applications.
1 Tests for the coliform group as awhole are used in official tests tocomply with interstate drinking waterstandards, strite standards for shell-fish waters, and in most, if not all;eases where bacterial 'standards ofwater quality have been establishedfor such use, as in recreational orbathing waters, water supplies, orindustrial supplies. Laboratory
&personnel aiould be aware of possibleimplementation of the fecal conformgroup as-the official test for recreationaland bathing waters.
2 The fecal coliform test has applicationin water qriality/surveys, as an adjunctto determination of total coliformdensity.' The fecal Conform test isbeing used increasingly in all waterquality surveys. 1 ,
.
3 'It is emphasized that no resporisibleworker adfteates substitution of afecal coliform test for total coliforms
,,ineiraluating drinking water quality.
2/P"
41-
.1
-
1'
I
\
I
Q
4
Bacterialagjcal Indicators of Water Pollution
Part 3. The Fecal Streptococci
I .414TRODUCTION
Investigations regarding streptococciprogressed prom the streptococci of medical.-concern to thosew.hich were distributed indiffering environmental aonditions which,again, related to the-welfw of man. Thestreptococci were originaM reported by Lawk4and Andrews (1894), and HoUston (1899, 1900)considered those streptococci, which we nowcall "fecal streptococci,''' as ... "indicativeof dangerous pollution, since they are readilydemonstrable in waters recently polluted and'seemingly"dltogether absent from waters abovesuspicion of contamination,.
From their discovery to the present time thefecal streptococckappear characteristic offocal pollution, being consistently present'inboth the feces of all warm-blooded animalsand in the environfhent associated with animaldischarges. As early as 1910 fec pto-cocci were proposed as indicators,Metropolitin Water Board of LondoHowever, little,progress resulted inUnited States until irnproveddmethods ofdetection and enumeration appeared afterWorld War II.
-.Renewed interest, in the group as indicatorsbegan with the introduction of azide dextrosebroth in 1950, (Mallmann- & Seligmann,The method If hich is in the current edition?of Standard Methods appeared soon after.'(Litsky, et al. 1955).
With the advent of improved methods fordetection and enumeration of fecal strep-tococci, significant body of technicalliterature has appeared.
This outline will consider the findings ofvarious investigators regarding the fecalstreptococci and the significance of dischargesof these organisms into the aquatic environment.
II FECAL MATERIALS
A Definition
The terms "enterococci, " "fecalsl ieptococci, " "Group D streptococci,"
"StrreptocOcigus fecal's, " and even'streptococci" haveibeen used in a looseand interchangeable manner to i icatethe streptodocci present in th enterictract of warm-blooded anima or of thefresh fetal Material excreted therefrom.
Enterococci are characterized by specific'taxonomic biochemistry. Serologicalprocedures differentiate the Group Dstreptococci from the various groups.Although they overlap, the three groups,fecal streptococcus, enterococcus, anddrOuRD 'streptococcus, are not synonymous.Because our emphasis is on indicators ofupsanitary origin, fec streptococcus is
e more appropriate t m and will includeenterococcus as wel as other groups.
a,
InOrea g attention is bet id to certainstreptococci found in humthis and certainbirds whic were, at one time, consideredto be. biotypes.of Str. faecalis or
,Str. faecium and therefore -legitimatefecal streptococci. These are now con-sidered to be in a separate group in theirown right,, the Group Q streptococci.
A rigid definition of the fecal streptococcusgioup is not possible with our presentknowledge. The British Ministry of Health(1956) defines the organisms as "Gram-positive" cocci, generally occurring in .
pairs or short chains, growing in thepresence of bile 'salt, usually capable ofdevelopment at 45° C, producing acid butnot gas in mannitol and lactose, failing toattack raffinose; falling to reduce nitrateto nitrite, producing acid in litmus milk*and precipitating the casein in the form ofa loose, but solid curd, and exhibiting agreater resistance to heat, to alkalineconditions and to high concentrations ofsalt than most vegetative bacteria."However, it is pointed out that "streptococcideptu-ting in.oneor,more particulars fromthe type species cannot be disregardedin water."
216' e
24-13
Bateriblo ical Indicators of Water Pollution-
Standard Methods (14th ed.. 1975)describes the fecal streptococci as pureculture Selective medium organismswhich are Catalase negatiyy, and capableof originating growth in I3HIll)roth(45°C. for 48 t...urs) and Bile brotli°
Cl
medium (35° . for 3 days).
For the proposes'of this outline, and inlinewith the consensus of most water micro-biologists in this country, the generaldOini on of the fecal streptococci
"The group'tomposed of Group Dand Qepecies coni4ntly present insignificant numbers in fresh fecalexcreta of warm-blooded animals, .which includes all of the enterococcusgroup in addition to other groups ofstreptococci."
h
B 'Species Isolated
1 Findings
a Human feces
Examination or human fecal spe'cimensyields a high percentage of theenterococcus group and usuallydemonstration of the S. salivarius3,vhich is generally considered amember of the human throat floraand to be surviving in human fetral _
materials rather than activelymultiplying in the enteric tract.Also present would be a smallpercentage of variants or biotypesof the enterococcus group.
b ° Nonhuman Feces
24T14
1) Fecal material which are from
yield high percentages of thnonhuman and not from fowlivill
S. bovis and/or S. equinus/organisms with a concomitantlyreduced percent/age of theenterococcus group.
2) Fowl excreta
r-'
Excrement from fowl racteris-tically yields a large, ercentageof enterococcal-biot s(Group CO as well as a Significant
percentage of enterococcusgroup.
2 Significance
Species associations with particularanimal hosts is an established fact andleads, to the important laboratorytechnique of partition counting of coloniesfrom the membrane filter or agarpour plates in order to establish orconfirm the source of excretalpollution in certain aquatic investi-gations.
It is important torealize that a suitablemedium is necessary In order toallow' all of itie, streptococci whiChwe consider to be (ecal streptococcito grow in order to gi e credence t&the derived opinions Use of liquid
-growth media into vf ich directinoculations from th ample aremade have not proven be successfulfor partition couhting due to tht dKfering
, growth rate's of the various species ofstreptococci alteripg the originalpercentage relationships. Due to thelimited survival capabilities of someof the fecal streptococci it is necessaryto sample fresh fecal material or watersamples 'in close proximity to thepollution source especially whenmultiple sources are contributing to areach of water. Also the pH rangemust be within the range of 4.0-9.0,
Standard Methods (14th ed., 1975) nowincludes a schematic allowing for theidentification of fecal streptococci types'present within a given sample.
HI DECAL STREPTOCOCCI IN THEAQUATIC ENVIRONMENT
A. General.
From the foregoing it is appears thatthe preponderant human fecal streptococciare composed of the enterococcus groupand, ,as this is the case, several media arepresently available which will detect onlythe enterococcal group will be suitablefor use with aquatic samples which areknown to be contaminated or potentiallycontaminated with purely domestic .
.?17

-*jko
-
'BaCieriological Indicators of Water Pollution
!es
-, (human) wastes. On the other hand,when it is known or- suspected that other-than-human wastes have potential egressto the aquatic envircinnlent under investi-gation, i is necesdary to utilizethose :media whi are capable of quantitating-the whole of the fecal streptococci group.
B Stormwaters and Combined Sewers1
1 General
Storm sewers are a series of pipesand conduits which receive' sur ace'runoffs from the action of rain tormsand do...not include sewage whi areborne by a system of sanitary sewers."'Cbmbinedesewers receive both the,stormrunoff and the water-borne
',Iyastes ofthe sanitary system.Both storm ivater and combinedsewer flows have been found tousually contain large quantities offecal streptococci in numbers whichgenerally are larger than those ofthe fecal coliform indicator organisms.
2 Bacteriological Findings
Table 1 represents, in a modified form,some of the findings of Geldreich andKenner (1969) with respect to thedensities of fecal streptococci when.considering Domestic sewage in contrastto Stormwaters:The Ratio FC/FS is that of theFecal coliform and Fecal streptococciand it will be noted that in each case,
' when considering the DomesticSewage, it is 4.0 or greater whileit is less than 0.7 for stormwaters.The use of this ratio is useful toidentify the source of pollution asbeing hunian or nonhuman warm-blooded animal polluted. When the ratiois greater than 4.0 it is considered to behuman waste contaminated while a ratioof less than 0.7 is considered to benonhuman. It is evident thatthe stormlr-waters have been primarily polluted byexcreta of rats and other rodents andpossibly domestic and/or farm animals. ,
'lost
Species differences are the mainof different fecal foliform-fecalstreptococci ratios. Table 2 compares
-rscal streptococcus and fecal conformcounts for different species. Eventhough individuals vary widely, massesof individuals in a species have charac- 'teristic proportion of indiCators.
Surface Waters
In gerieiltl, the occurrence of fecalstreptococci indicates fecal pollution andits absen4 indicates that little or nowarm-blooded fecal 'contribution. Instudies of remote surface Waters the fecalstreptococci are infrequently isolated andoccurrences of small numbers can'beattributed towild life arid/or snow meltsand resultant drainage flows.
Various examples of fecal streptOcoccaloccurrences are shown in Table 3 in
relation to surface waters of widely varyingquality.. (Geldkich and Kenner 1969)
IV FECAL STREPTOCOCCI: ADVANTAGESAND LIMITATIONS
'A General
Serious studies concerning the streptococciwere instituted when it beaame apparentthat they were the. agents responsible orsitspeqed for a wide variety of humandiseases. Natural priority then focuseditself, to the taxonomy of these, organismsand this study is still causing consteknationas more and more microbiological techniqueshave been brought to bear on these questions.The sahitary'microbiologist is. concernedwith thode streptococci which inhabit theenteric tract pf warrn4looded animals,their. detection, and utilization in develop-ing a criterium for water quality standards.
24 -13
'ts
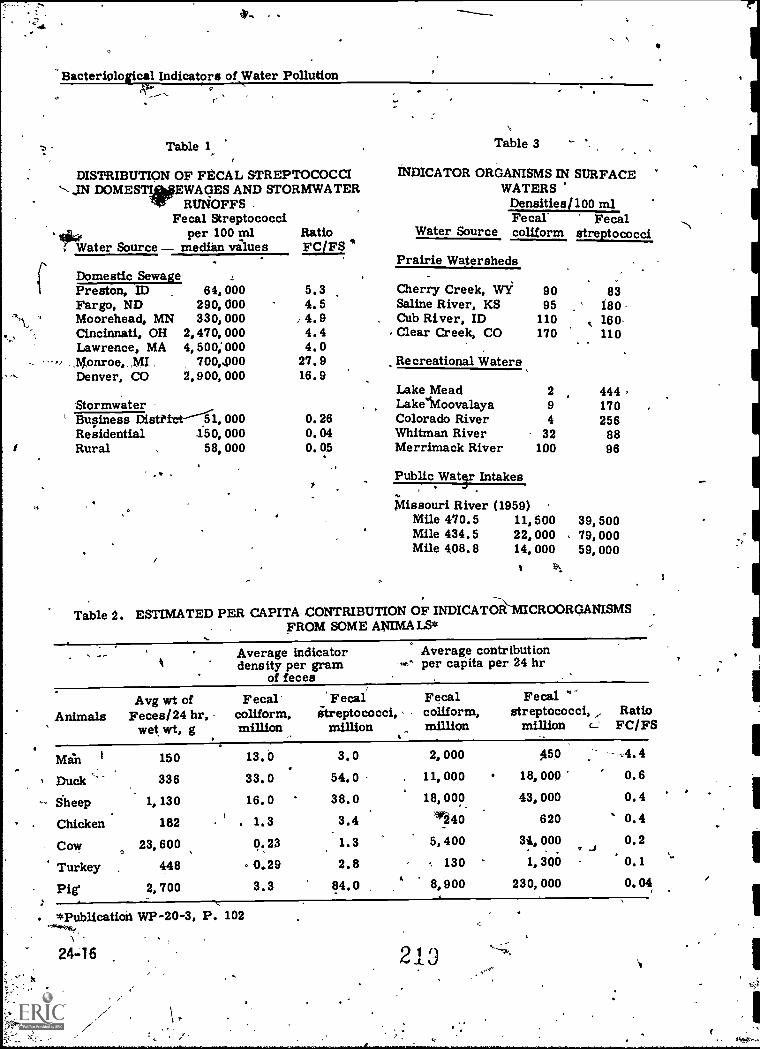
Z4
40
-
Bacteriological Indicators of Water Pollution
Table 1 Table 3
DISTRIBUTION OF FECAL STREPTOCOCCI`.IN DOMESTWEWAGES AND STORMWATER
RUNOFFS.Fecal Streptococci
per 100 ml Ratio'1,kWater Source median values FC/FS
INDICATOR ORGANISMS IN SURFACEWATERS
Densities/100 mlFecal"
Water Source conformFecal
streptococci,
Prairie WatershedsDomestic SewagePreston, ID 64, 000 5.3 Cherry Creek, WY 90 83Fargo, ND 290, 000 4.5 Saline River, KS 95 180Moorehead, MN 330, 000 /4.9 Cub River, ID 110 , 160-Cincinnati, OH 2,470, 000 4.4 Clear Creek, CO 170 110Lawrence, MA 4, 500; 000 4.0M,ozwoe, MI 700,4)00 27.9 Recreational WatersDenver, CO 2,900, 000 16.9
Lake Mead 2 444'Stormwater LakeMoovalaya 9 170Business DistPi-ct--1-1, 000 0.26 Colorado River 4 256Residential 150, 000 0.04 Whitman River 32 88Rural 58, 000 0.05 Merrimack River 100 96
Public Waty Intakes
1Viissouri River (1959)Mile 470.5 11, 500 39, 500Mile 434.5 22,000 79,000Mile 408.8 14, 000 59, 000
Table 2. ESTIMATED PER CAPITA CONTRIBUTION OF INDICATOICROORGANISMSFROM SOME ANIMALS*
Average indicatordensity per gram
of feces
Average contribution"k" per capita per 24 hr
AnimalsAvg wt of
Feces/24 hr,wet wt, g
Fecal'conform,million
Fecalstreptococci,
million
Fecalcoliform,million
Fecalstreptococci,
millionRatio
FC/FS
Min 150 13.0 3.0 2, 000 00Duck 336 33.0 54.0 11, 000 18, 000 0.6
Sheep 1, 130 16.0 38.0 18, 009 43, 000 0.4
Chicken 182 . 1.3 3.4 1140 620 0.4
Cow , 23, 600 0.23 1.3 5, 400 3i, 000 0.2
Turkey . 448 0..29 2.8 130 1, 300 - 0.1
pig 2, 700 3.3 84.0 900 230, 000 0.04
*Publication WP -20-3, P. 102
24-16 213
Bacteriolog#al Indicators of Water Pollution
Kab ler (1962) discussed the slow acceptanceof the fecal streptococci as indicators ofpollution resulting from:
1 Multiplicity and difficulty of laboratory .
procedures
2 Poor agreement between mdthods ofquantitative enumeration
3 Lack of systematic studies of . . .
a sources
b survival, and '
c interpretations, and
4 Undue attention to the S. faecalis group.
Increased attention to the fecal streptococci,especially during the last decade, haveclarified many of the earlier cldddy issuesand have elevated the stature of theseorganisms as indicators of pollutiori.Court precedents establishing legal statusand recommendations of various technicaladviadry boards have placed the fecalcoliform Soup in a. position of primacyin many water quality applications. Thefecal streptococci have evolved from aposition of a theoretically useful indicatorto one which was ancillary to,the conforms.to one which vial% ful when discrepanciesor questions evolved to the validity/ ofthe coliform data to one where an.eqtlity*status was achieved in ce ain applications.In the future it is anticipate at, forcertain applications, the feca streptococciwill achieve a position of primacy foruseful data, and, as indicated by Litsky(1955) "be take out of the realm of step- -children and given their legitimate placein the field of santiary bacteriology as
*indicators of sewage pollution."
B Advantages and Limitations'
'1. Survival r-
In general, the fecal streptococci havebeen observed to have a more limitedsurvival time in the aquatic 'environmentwhen compared to the coliform group.
They are rivaled in this respect onlyby the fecal conforms. Except for casesof persistence in waters of high electro-lytic content, as may be common toirrigation waters; the fecal streptococci`have not been observed to multiply inpolluted waters as may sometimes beobserved for some of the coliforms.Fecal streptococci usually respire agreater abundance of nutrients for-sur-vival as spared to the coliforms and
arms are more dependent uponthe oxygen tensioin the waterbody.In a number of situatio s it was concludedthat the fecal strept co i reached anextinction point more rapidly inswarmerwaters while, the reverse was true in thecolder situations as the conforms nowwere totally eliminated sooner.
2 Resistance to Disinfection
In artificiarpools the source ofcontamination by the 'gathers isusually limited to throat and skinflora and thus increasing attentionhas been paid to indicators otherthan those traditionally -from theenteric tract. Thus, one of theorganisms considered to be a fecalstreptocoscci, namely, S. salivartus,can be a more reliable indicatorwhen detect)ed along with the otherfecal streptococci especially sincestudies have confirmed the greaterresistance of the fecal streptococcito chlorination. This greaterresistance to chlorination, whencompared to the fecal conforms, isimportant since the dieoff curveclifferehces are insignificant whenthe curves of the fecal. conformsare compared to various Gram 'negative pathogenic bacteria whichreduces.their effectiveness asindicators.
3 Ubiquitous Strains
Among the fecal streptococcus aretwo orgdnisms, one a biotype andthe 'other a variety of the S. faecalis,which, being ubiquitous (omnipresent)have limited sanitary significance. *

is
Bacteriological Indicators of Water Pollution
The biotype, or atypical, S. faecalisis characterized by its ability tohydrolyze starch while the varietalform, liquefaciens, is nonbetahaemolytic and capable of liquefyinggelatin. Quantitation of these organismsin anomalous conditions. is due to theircapability of survival in soil or highelectrolytic waters and in waters witha temperature of less than 12 Degrees C.
Samples have been encountered whichhave been devoid of fecal coliformsand yet contain a substantial number of"fecal streptococci" of which theseubiquitotis strains constitute the majorityor all of the isolations when analyzedbiochemically.
Lake Michigan waters. Several sets ofcriteria were established to fit the intendeduses'for this area. The use of the fecalStreptocopcLas a criterium is indicated tobe tentative Pending the accumulation ofexisting densities and could be modified infuture standards.
V STANDARDS AND CRI*RIA
Acceptance and utilization of Total Conformcriteria, which must now be considered apioneerineeffort, has largely been supplantedin concept and in fact by the fecal coliformsin establishing standards for recreationalwaters.
The first significant approach to the utiliza-tion of the fecal streptococci as a criteriumfor recreational water standards occurred in1966 when a technical committee recommendedthe utilization of the fecal streptococci with thetotal coliforms as criteria for standardspertaining to the Calumet River and lower
.24 -1!
e
With the existing state-of-the-art knowledgeof the presence of the fecal, streptococci in
'waters containing low numbers of fecalconforms it is difficult to establish a specificfecal streptococcus density limit of below100 otganisms/100 ml when used alone orin conjunction with the total cOliform's.
The mast useful application of the fecalstreptococcus test is in the developmentof the fecal coliform: fecal streptococcusratio as previously described.
221
a.
.;
a
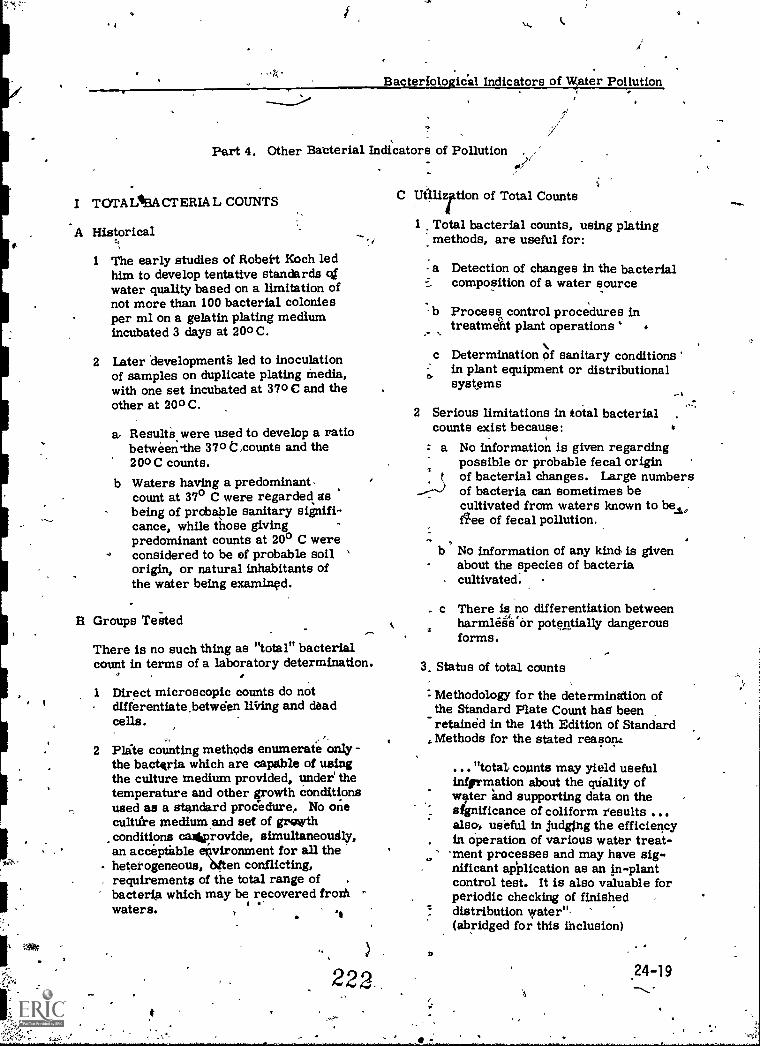
4 0
Ba ter olo ic.al Indicators of ater Pollution
Part 4. Other Bacterial Indicators of Pollution
I TOTALSBACTERIA L COUNTS
A Historical
1 The early studies of Robert Koch ledhim to develop tentative standardswater quality based on a limitation ofnot more than 100 bacterial coloniesper ml on a gelatin plating mediumincubated 3 days at 200 C.
2 Later development's led to inoculationof samples on duplicate plating media,with one set incubated at 370 C and theother at 200C.
a, Result's, were used to develop a ratiobetween the 370 t ,counts and the200 C counts.
b Waters having a predominant,count at 37° C were regarded asbeing of probable sanitary signifi-cance, while those givingpredominant counts at 20° C wereconsidered to be of probable soilorigin, or natural inhabitants ofthe water being examined.
B Groups Tested
There is no such thing as "total" bacterialcount in terms of a laboratory determination.
1 Direct microscopic counts do notdifferentiatabetwden Wring and deadcells.
2 Plite counting methods enumerate only -the bacteria which are capable of usingthe culture medium provided, under thetemperature and other growth Conditionsused as a standard procedure,. No oneculttire medium and set of growthconditions caliprovide, simultsmeotily,an acceptable e4vironment for all theheterogeneous, Oten conflicting,requirements of the total range ofbacteria which may be recovered froth
4waters. 't
222
C Ut'ilizition of Total Counts
1 Total bacterial counts, using platingmethods, are useful for:
- a Detection of changes in the bacterialcomposition of a water source
-b Process control procedures intreatment plant operations
c Determination of sanitary conditionsri
in plant equipment or distributionalsystems
2 Serious limitations in total bacterial .
counts exist because: 6
a No information is given regardingpossible or probable fecal originof bacterial changes. Large numbersof bacteria can sometimes becultivated from waters known to bey,flee of fecal pollution.
No information of any kind is givenabout the species of bacteriacultivated.
c There is no differentiation betweenharmleas'or potentially dangerousforms.
3. Status of total counts
Methodology for the determination ofthe Standard Plate Count has beenretained in the 14th Edition of Standard
. Methods for the stated reason,:
..."totat counts may yield usefulinfprmation about the qtiality ofwater sand supporting data on thesignificance of coliform results ...also, useful in judging the efficiencyis Operation of various water treat-
'ment processes and may have sig-. nificant application as an in-plant
control test. It is also valuable forperiodic checking of finisheddistribution water"-(abridged for this Inclusion)
a
.24-19

Bacteriological Indicators of Water Pollution
Technique for the Standard PlateCount iamecessary for theperformance of the Distilled WaterSuitability Test as outlined inStandard Methods and elsewhere withinthis manual.
B Spore - Forming Bacteria (Clostridiumperfringens, or C. welchii)
1 Distiibution
This, is one of the most widely distribtitedspecies of bacteria. It is regularlypresent in the intestinal tract of warm-blooded animals.
2 Nature of 'organism
C. perfringens is a Gram-positive,spore-forming rod. The spores causea distinct swelling of thekcell whenformed. The organism fa extremelyactive in fermentation of carbohydrates,and produces the well-known "stormyfermentation" of milk.
3 Stattis
The organism, when present, indicates 'that pollution has occurred at sometime. However, because of the ex-tremely extended viability of the spores,it is impossible to obtain even anapproximation of the recency of pollutionbased only on the presence ofC. perfringens.
The'presence of the organism does notnecessarily indicate an unsafe water.
C Tests for Pathogenic Bacteria of IntestinalOrigin
1 Groups considered include Salmonellasp, Shigelia sp, Vibrio comma,Mycoliacterium sp, Pasteurella sp,Leptospira sp, and others.
24-20
2 Merits of direct tests:
Demonstration of any pathogenicspecies would demonstrairanunsatisfactory water quality, hazardousto perlons consuming or coming'intocontact with that water.
3 Limitations
a There is no available routine pro-,
cedure for detection of the fullrange of pathogenic bacteria citedabove. at .7
0..
b Quantitative methods are not avail-able for routine application to anyof the above.
c The intermittent release of thesepathogens makes it impossible toregard water as safe, even in theabsence of pathogens.
d After detection, the public alreadywould have been exposed to heorganism; thus, there is no built-inmargin of safety, as exists withtests for the coliform group.
4 Applications
a In tracing the source of pathogenicbacteria in epidemiological investi-gations
b In special research projects
Ain water quality studies concernedwith enforcement actions againstpollutign, increasing attention is 'being given to the demonstration ofenteric pathogenic bacteria in thepresence of the bacterial indicatorsof pollution.
D Miscellaneous Indicators
It is beyond this discussion to explore thetotal range of microbiological indicatorsof pollution that have been proposed and
. 223
e
1

investigated to some extent. Mention canbe made, however, of coqsideration oftests for the following.
,
1 Bacteripphages specific for any of anumber of kinds of bacteria
2 Tests for Enterovirus
3 Serological procedures for ectiOn. of coliforms and oth dicators: acertain amount of recent attention'hasbeen given to applications of fluorescentantibodies in such tests
4 Tests for Klebsiella
5 Tests for Pseudomonas aeruginosa
6 Tests for Salmonella
7 Tests for Fungi
8 Tests for Staphylococcus.
REFERENCES
1 Stindard Methods for the Examination ofWater and Wastewater, 14th ed.,APHA, AWWA, WPCF. Published byAmerican Public Health Association,1790 Broadway, New York, N. Y.`1976
2 Prescott, S. C., Winslow, C. E. A . , andMcCrady, M. Water Bacteriology.John Wiley & Sons, Inc. 1946.
3 Parr, L. W. Conform inHuman Feces.- Jour. Bact. 36: .1938.
4 Clark, H.F. and Kabler, c. W. ThePhysiology of the Coliform Group.Proceedings of the Rudolfs Researth.,Conference on Principles andAppli-cations in Aquatic Microbiology. 1063.
5 Geldreich, E. Bopdner, R.H., Huff,C. B. , Clark, H.F. , and Kabler, P.W.Type Distribution of Coliform Bacteriain the Feces of Warm-Blooded Animals.JWPCP. 34:295-301. 1962.
Bacteriological Indicators of Water Pollution_
$6 G\ldreich.oe al. The Fecal Coli-AerogenesFlora of Soils from Various Geographic
. Areas'. Journal of Applied Bacteriology25:87-93. 1962.
7 Geldreich, E. E. , Kenner, B. A . , andKabler, P. W. Occurrence ofColiforms, Fecal Coliforms, andStreptococci on Vegetation and Insects.Applied Microbiology. 12:63 -69. 1964.
Kabler, P.W. , Clark, H.F. , andGeldreich, E. E. Sanitary Significance--of Coliform and Fecal ColiformOrganisms in Surface Water. PublicHealth Reports. 79:58-60. 1964.
9 Clark, H.F. and Kabler, P. W .Re-evaluation of the Significance of theConform Bacteria. Journal.AWWA.56:931-936. 1964.
10 Kenner, B.S., Clark, H.F., and.Kabler; P.W. Fecal Streptococci.II. Quantification in Feces. Am.., J.Public Health. 50:1553-59. 1960.
11 Litsky, W., Mailman, W. L., and Fifield,C. W. Comparison of MPN ofEscherichia coli and Entero'cocci inRiver Water. Am. Jour. Public Health.45:1949. 1955.
12 Mecirek, T.F. and Litsky, W.I Comparative incidence of Coliform
Bacteria and Enterococci inUndisturbed Soil. Applied Mier:o-
r, biologIA. 8:60-63. 1960.
13 Mailman, W. L., and Litsky,Survival of Selected Enteric Organismsin Various Types of Soil. Am. J.Public Health. 41:38-44. 1850.
14 Millman, W. L., And Seligman, E. B., Jr.A Coinparatiye Study.orMe5lia for
. Detectiori of Sti.eptocodbi in Water andSewage. Am. J. Public ffealth.--40:286-89. 1950. .
411*. p15 Ministry of Health (London). The
Bacterial Examination of Water Supplies.Reports on Public Health and MedicalSubjects. 71:34.
Z4-21
4

Bacteriological Indicators of Water Pollution
16 Morris, W. and Weaver; R. H. .Streptococci as Indice's of Pollution
WWI IIin Well Water. Applied Microbiology,2:282-285, 1954.
17 Mundt, J.0., Coggin, J.H., Jr.,Johnson, L. F: Growth ofStreptococcus fecas var.diquefacienson Plants. Applied Microbiology.10652-555. 1962.
18 Geldreich, E. E. Sanitaiy Significanceof Fecal Coliforms in the Environment.U. S. bepartment of the Interior.FWPCA Publ. WP-20-3. 1966.
19 Geldreich, E. E. and Kenner, B. A.Concepts of Fecal Streptococdi inStream Pollution. J. WPCP. 41:R336.1969.
20 Kabler, P. W. Purification and SanitaryControl of %triter (Potable and Waste) '-Ann. Rev. of Microbiol. 16:127. 1962.
21L Litaky, W., Mailman, W. L. , and Fifielfl,C. W. Comparison of the Most ProbableNumbers of Etedherichia colt andEnterococci in.River Waters. A. J.P. H.
'45 :1049. 1955.
24-22
or'
22 deldreich, E. E. Applying BacteriologicalParameters to Recreational WaterQuality. J. AV/WA, 62:113. 1970.
23 Geldreich, E. E4 , Best, L. C., Kenner, B.A.and Van Donsel, D. J. TherBacteriolog-Ica! Aspects of StormwaterJ. WPCF. 40:1860. 1968.
24 FWPCA Report of Water Quality CriteriaCalkunet Area - Lower Lake Michigan,Chicago, IL. Jan. 1966.
This outline was prepared by H. L. Jeter,Formgr Chief, Program Support TrainingBranch, National Training and OperationalTechnology Center, and revised byR. Russomanno, Microbiologist, USEPA.Cincinnati, Ohio 45268
Descriptors: Coliforms, Escherichia colt,Fecal Califorms, Fecal Streptococci,Indicator Bacteria, Microbiology, SewageBacteria, Water Pollution
. .
29 !-kw ..)
,
1
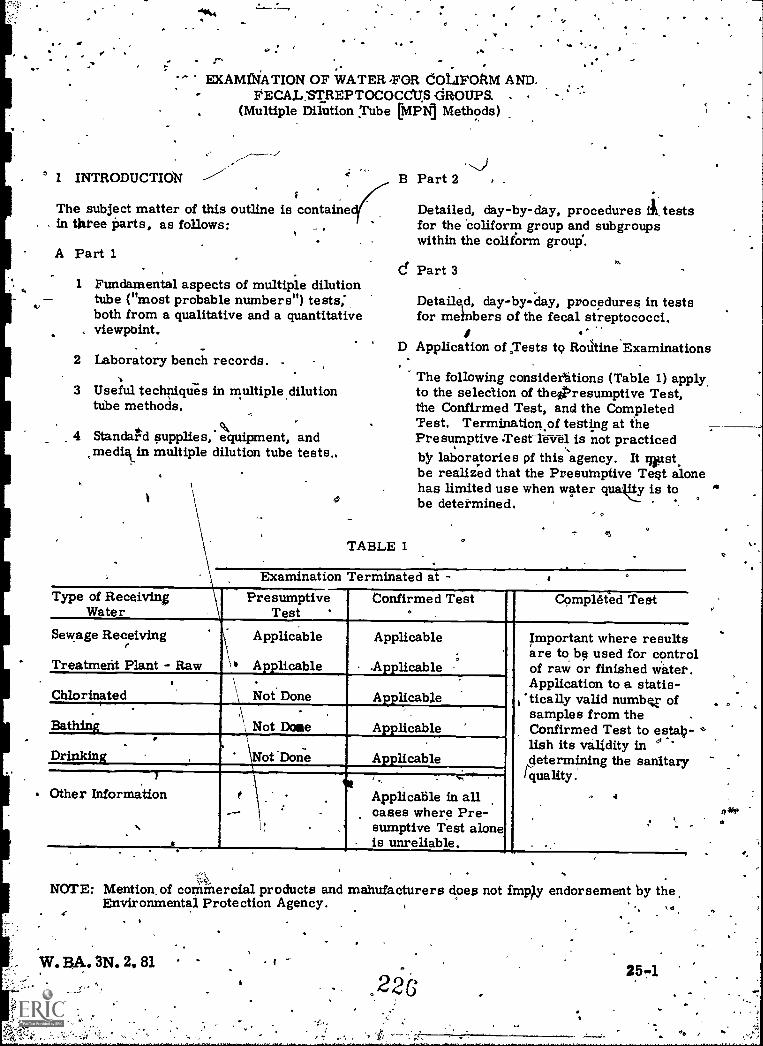
V`
V
.. '
-" EXAMINATION OF WATER FOR dOLIPORM AND. .
I INTRODUCTION
FECAL.STREPTOCOCCVS IROUPS. . .
(Multiple Dilution Tube [MPNI Methods)
;The subject matter of this outline is containe
. in three Parts, as follows:
A Part 1
1 Fundamental aspects of multiple dilutiontube ("most probable numbers") testa:.both from a qualitative and a quantitativeviewpoint.
2 Laboratory bench records.
3 Useful techniques in multiple dilutiontube methods.
4 Standard supplies, equipment, andmediclin multiple dilution tube tests..
B Part 2 .
Detailed, day-by-day, procedures it testsfor the *conform group and subgroupswithin the conform group.
Gr Part 3
Detail0, day-by-day, procedures in testsfor members of the fecal streptococci.
D Application of Tests to RothineExaminations
The following consider'ations (Table 1) applyto the selection of the'resumptive Test,the Confirmed Test, and the CompletedTest. Termination of testing at thePresumptive Testie-crel is not practicedby laboratories of this 'agency. It ;wt,be realized that the Presumptive Teat alonehas limited use when water qua y is tobe determined.
TABLE 1
Examination Terminated at -Type of Receiving
WaterPresumptive
TestConfirmed Test
° -Completed Test
Sewage Receiving
Treatment Plant - Raw
Applicable
Applicable
Applicable
.Applicable °
Important where resultsare to be used for contrlof raw or finished waterApplication to a statis-
, 'tically valid number ofsamples from theConfirmed Test to establish its validity in '''
A etermining the sanitary/quality.
. 4
. .. .
,
Chlorinated\ .
\ Not Done Applicable
Bathing.;
'\
Not Dose,
Applicable
ApplicableDrinldn& ,
..
NotDone1
Other Information
.A
.
,
It
,
1 . .,Applicable in alloases where Pre-sumptive Test aloneis unreliable.l
NOTE: Mention, of commercial products and mahufacturers does not fmr4y endorsement by theEnvironmental Protection Agency. ,
1
0
oaP

.7,7,0-2,000040
. id/qv metnoos .
.
II BASIS OF MULTIPLE TUBE TESTS
A Qualitative Aspects.t<
1 For purely qualitative aspects of testing ffor indicator organisms, it is- convenient
gp to consider the tests applied to onesample portion, inoculated into a tube
- of culture medium, and the folloii-upexaminations andjests on results of,the ,
original inikulation. Results Of testing.procedures are definite: positive(presence of the organism-gr,oup isdemonstrated)or negative (presence ofthe organism-group is not demonstrated. ),
2 Test pr duxes are based on certainfundam6ntal assumptions:
a First, even if only one living cell ofthe test organism is present in thesample, it will be able t6 grow'whenintroduced into the primary inoculationmedium; \
b Second',, growth bf the test organismin the culture'medfum will produce'a result which indicates presence ofthe test organism; and, .
c Third, extraneous organisms willnot grow, or if they do grow, theywill not limit growth of the testorganism; nor will they producegrowth effects that will be confusedwith those of the bacterial group forWhich the test is designed. j
3 Meeting these assumptions usually- makes it necessary to conduct the tests
in u series of stages (for exam10...ethePresumptive, Confirmed, and mpleted
- Test stages, respectively, of-standardtests for the coliform group)., a -
4 4Seatures 11, mulii stage .te St
a First step: The culture-rn tunusually serves priinarily as anenrichment medium for the grouptested. A good first-stage growthmedium should support growth of allthe cells of the group tested,and it should-include proititicon'forindicating the.presence of test, '
25..2 z.r!. .
6tio
organism being studied. A first-stage medium may include somecomponent which inhibits growthof extraneous blzateria, .but thisfeature never should 1)4 includedif it also inhibits growth' of anycells of the group for which,thetesOs designed. The PresuzimStstv'e'Test for-the coliform group is a '
good example. The mediuin_supports growth, prestimably, ofall living cells of the coliform
- --group; the. culture container has afermentationlrial for demonstrationof gas production eesulting fromlactose fermentation by coliformbacteria, if present; and sodiulauryl sulfate may be included-
. one of the approved media forssuppression of growth of. certainnoncoliform bacteria. Thisadditilie apparently has no adverseeffect on growth of members of theconform group in the concentration
" used. If the result.,6f.the first:stagetest is negative, the study.of theculture is terminated, a* the resultois recorded as a negative test. Nofurther study is Made of negative
%testa,: If the result of the first-"t state test is positive, the culture
may be <subjected to further studyto verify the findings Of the first, stage.o
b Second Stage: .4' transfileis made'from positive cultures of the first -stage test to a second.culture anedium.This test stage emphasizes provisionto reduce confusion of results due togowth effeCtS of extraneous bacteri4,-commonly achieved by addition ofselective inhibitory agents. (The',Confirmed Test or colifoims meetsthese requirements. Lactose andfermentation Vials are provided fordemonstration of cpliforzr in the'mediuin. Brilliant green dye andbilesalts are included asyinhibitoryagats which tend to suppress growth-:"of practically all kinds 9f noncoliformbacteria, bdt do mot suppress.growthof coliform bacteria when used 'asdirected).
0 0
6
2 2 7
) MPN Methods
If result of the second-stange test isnegative, the study of the culture-isTerminated, and the result is,recordedas a negative test. A negative test heremeans that the positive results of the .
fitst-stagetest were "false positive, "due to one or more kinds of extraneousbacteria. ,A positive second-stage testis partial confirrhation of the positiveresults obtained in the first-itage test;the culture may be subjected to finalidentification-through application of stillfurther testing procedures. In routine
:practice, most sample examinationsare terminated at the end of the secondstage, on the assumption that the resultwould be positive if carried to the third;and final stage. Thin practice should befollowed only adequate testing is doneto demonstrate that the assumption isvalid. Some workers recommend contin-uing at leant 5Vg of all sample examina-tions to the third stage to demonstratethe reliability of .the second-stage result:-
o
B 'Quantitative Aspects of Tests
1 These methods for determining bacteria)numbers are, based on the assumptionthat the bacteria can be separated from.
another. (by shaking or other means)ulting in a suspension of individual
bacterial cells, uniformly distribufedtrough the original sample when theprimary inoculation is made.
2 Multiple.cfilutioc3 tube tests for quantlta- 6
-tive determinations apply a Most ProbableNumber (MPN) technique. In this pro-cedure one or more measured portionsof each of a stipulated series of de-creasing sample volumes .is inoculatedinto the' first-stage culture medium.,Through decreasing the sample incre-ments; eventually a volume is reachedwhere only one cell'is introduced Into
some tubes, -and no cells ars.katroducedinto-other tubes. aci of the severaltubes of sample-inoculated first-stagemedium is tested independently,according to, the principles previouslydescribed, in the qualitative aspectsof testing peocedurep.
3° The combination of positive and-negative results is used in an applicationof probability mathemaUcs.to securea'singfe MPN value for the sample.
4 'To-obtain MPN values, the folloWingconditidne must be xnef:tr .
a The testing procedure mustemSultin one or"more tubes in which thetest orgahism is demonstrated tobe present; and
b 'The testing procedure must resultinone or more tubes ,in whicirthe Cy
test organism is no_ t demonstratedto be prisent.
5 The MPN value for a giVa sample is .obtained thmigh the use of MPN Tables.It is emppasized that the precision ofan indivi-eluaill-MPN value pis not greatwhen compared with most physical orchemical determinations.
6 Standard practice in water pollutionsurveys conducted by this organization,is to plint five -tubes in each of a seriesof sample increments, in samplevolumes decreasing at decimal intervals.For example; in testing known pollutedwaters, the initial sample inoculationsmight consist of 5 tubes each in volumesof 0. 1, 0. 01, b. 001, and 0.0001 ml,-respectively, This series of samplevolumes will-yield detOminate reSultsfroln a low of 200 to alhigh of 1, 600, 000orgariisms per 100 ml.
25.-3
s.
e
MPN Methods
III LABORATORY BENCH RECORDS
A Features Of a Good Bench Record Sheet
1 Provides complete identification of thesample.
,
2 Provides for full, day-by- day informa-tion about all tests performed on thesample.
3 Provides easy step-by-step record,:applicable to any portion of the sample,
4 Provides for recording orthe quantitativeresult. which will be transcribed to sub-Sequent rePorts.
5 Minimizes the amount of )tritIng by theanalyst. '
ti Identifies the analyst(s).
B. There is no such thing as ustandarc,"bench sheet for multiple tube tests; thereare many versions of benchsheets. Someare prescribed by administrative authority(such as the Office of a State SanitaryEngineerl; others are devised by laboratoryor project personnel to meet specific needs.
It is not the purpose of this discussion torecommend an "ideal" bench form; however;the form used in this trairiing coursemanual is essentially similar to that usedin certain"gesearch laboratories of thisorganization. The student enrolled in the.course for which this manual is written .
should make himself thoroughlyiaMiliarwith thebenCh sheet and its props use.See Figure 1.
25.4
IV NOTES ABOUT WORKING PROCEDURESIN THE LABORATORY
A Each bacteriological examination of waterby multiple dilution tube methods require'sa considerable amount of manipulation;much is quite repetitious. Laboratoryworkers must develop; and maintain good_routine working habits, with constant,'alertness to gUard against lapses intocareless, slip-shod laboratory proceduresand "short cuts" which only can lead tolowered quality of laboratory work.
B Specific attention is brought to the followingby no means eSchatistive, critical aspects oflaboratory procedures in multiple dilutiontube tests:
1 . Original sample
a Follow prescribed care and handlingprocedures before.testing.
.
b Miintain absolute idebtifiiitatiori ofsample at all stages in testing.
c Vigorously shake samples (andsample d4tions) before plantingin culture media.
2 Sample measurement into primaryculture Mellium
a SaMple portions must be-measuredaccurately into the culture mediumfor reliable quantitative teats to bemade. Standard Methods prescriberthat calibration errors should notexceed + 2.5 %.
20r3
S.
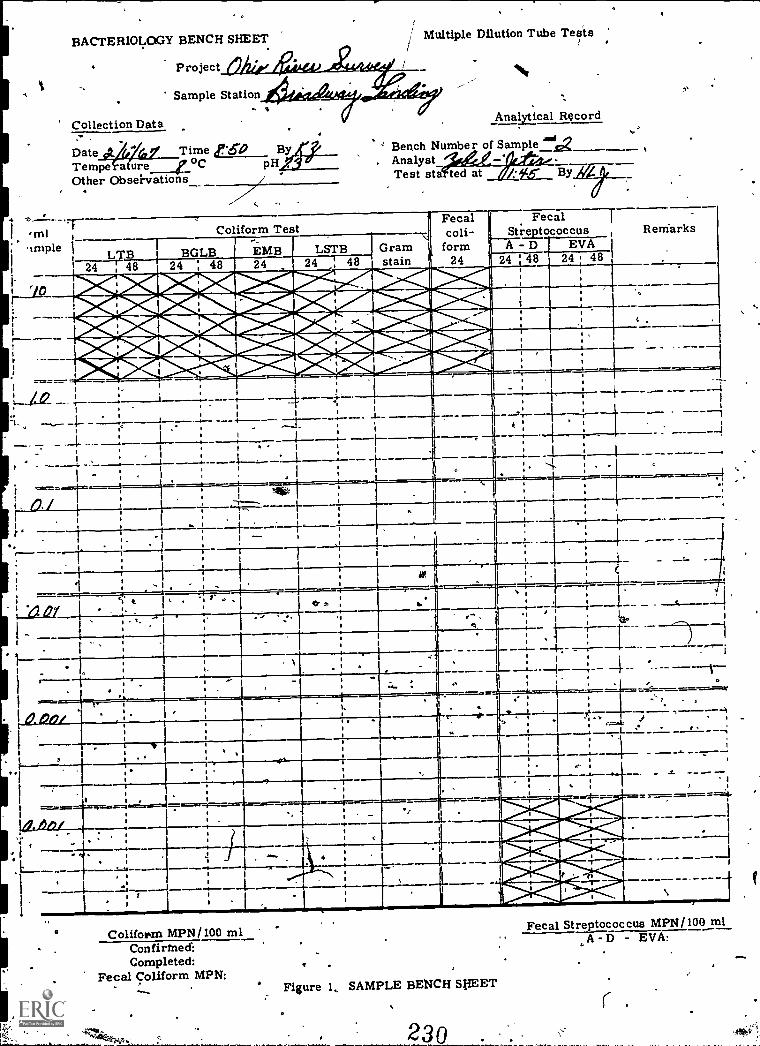
.mlimpte
.1,12 r
BACTERIOLOGY BENCH SHEET
Project
4.
// Multiple Dilution Tube Tufts
Sample Station
Collection Data
Date Time cr60 ByTempe ature i co pH
er Observations_
AnaAical Record
Bench Number of Sample 41.1a. Analyst
Test sta ted at /j(5 By
Coliform TestFetalcoli-
Fecal 7Streptococcus Rem-arks
- --7t
LTB BGLB EMB LSTB -Gramstain
1_.1. . ... .'4 4
0I
form24
4 1
A - D EVA
24 ---1- 48 24 : 48
4 44*ZW,1174.0kt--...01,/-41.W'..adde__A.4 *W 4 *. M- 4 1b ib..,..-.
Wi4. PIW4
6-
.. 4 51 2 I .
I
..' .
24
P 1 " .._,,,i 1 i . . .4
4-..._
24 48
*db4 ral
WI I II--VI
4
4ipw.
I0
*P4
24
i
48 24 : 48
,
,
.
t . .
___,
---
Oth
LO./t
1-- a0
D. Do/
1
-+
II
.r,H ...4.. I
tr.
1 -
la I
I
o
Coliform MPN/100 mlConfirmed:Completed:
Fecal Conform MPN:Figure 1.. SAMPLE BENCH SHEET
230 .
Fecal Streptococcus MPN/100 mlA - D EVA:
AM,
MPN Methods
Suggested sample measuring p ctice'sare as follows: Mohr measurin
- pipets are recommended. 10 mlsamples are deltvereat the top 'fthe culture tube, using 10 ml pipe s.1.0 inl samples are delivered dointo the culture tube, near the stirface of the medium, and "touchedoff" at the side of the tube when thedesired amount of sample' has beendeli' red. 1.0 ml or 2.0 ml pipetsare used for measurement. of thisvolume. 0.1- ml samples aredelivered in the same manner as 1.0ml samples, using 'great care thatthe sample actually gets into theculture medium. Only 1.0 ml pipets
-are usea tor this sample volume.After deliveVy of all sample incre-ments into the culture_tubes, theentire rack of culture tubes maybeshaken gently to carry down any ofthe sample adhering to the wall ofthe tube above the nittlium.
.Workers should ddmonstrate by actualtests that the pipets and the tedhniquein use actually delivers the rated volume swithin the prescribed limits of error.
b Volumes as small as 0.1 ml routinelycan be delivered directly from thesample with suitable pipets. Lessersample volumes first should be diluted,with subsequent delivery. of 'suitablevolumes of diluted sample into theculture medium. A diagramniaticsqherrie for malting:, dilutions is shownin Figure 2.
3 Reading of culture tubes for gasproduction
a On removal from the incubator,shake culture rack gently, toencourage release of gas whichmay be supersaturated in the'cuhuremediurh..
.264
/
b Gas in any quantity is a positive test.It is necessary to work in conditionsof suitable lighting for easy recog-!nition of the extremely small amountsof gas inside the tops of somefermentation vials.
4 Reacting of liquid culture tubes forgrowth as indication of a positive testrequires good lighting. Growth isshown by any amount of increasturbidity or opalescence in the cult remedium, with or without deposit ofsediment at the bottom of the tube.
5 Transfer of cultures with inoculationloops and needles
a Always sterilize inoculation loopsand needles .to glowing (white hot)in flame immediately before transferof culture; do not lay it down ortouch it to any non sterile object'before making the transfer.
. ' b After sterilization, allow',sufficienttime for cobling,i in the air, to avoidheat-killing bacterial cells which willbe gathered on the wire.
c Loops should be at least 3mm in insidediameter, with a capa,1?ility of holdinga drop of water or &attire.
For routine standard transfersrequiring transfer of 3 loopsful ofculture, (Fecal Steptococci) manyworkeis form three. 3 -mm loops on thesame length cif wire.
s6 As an alternative to use of standard.
-.inoculation loops, the use of"applicator - sticks" is .described in thb14th Edition of Standard 'Methods.
232
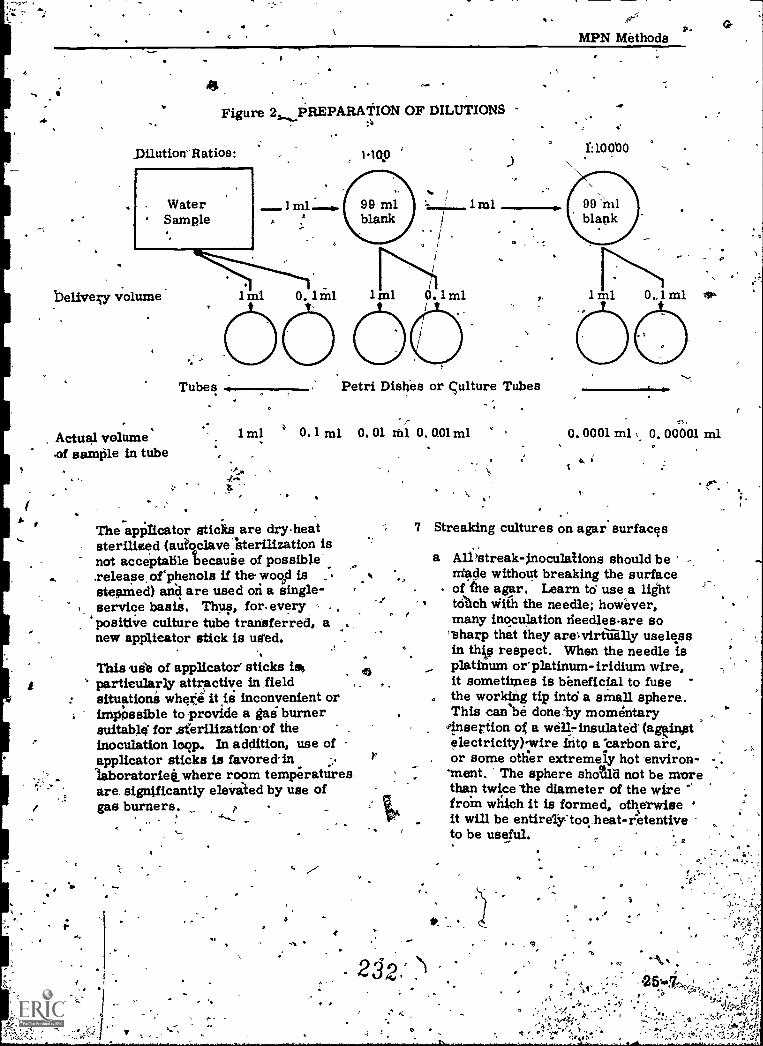
14'
MPN Methods
A
4Figure 2 _PREPARATION OF DILUTIONS
Dilution'Ratios: plop
... i
,... 1 na 1
i. r-..,,,,,
r
r1 cal 9.1ml ,. 1 ml
i
1: 10 000
Actual volume.of sample in tube
0
Tubes
1 ml
Petri Dishes or Culture Tubes
0.1 ml 0. 01 ml O. 0.01ml
The applicator sticks are dry-heatsterilized (adoclave "sterilization isnot acceptable tecause of possiblerelease, orphenols if the wood issteamed) and are used on a single-service basis. Thus, for- everypositive culture tube transferred, anew applicator stick is used.
This use of applicator' sticks lesparticularly attractive in fieldsituations where it is inconvenient orimpossible to provide a gag' burnersuitable for .sferilize.tion of theinoculation loop,. In addition, use ofapplicator sticks is favored- inlaboratoriet where room temperaturesare, significantly elevated by use ofgas burners. p
/
0.,1 ml
1111.0. 0001 ml 0. 00001 ml
7 Streaking cultures on agar surfaces
a All'streak-inoculations should beWade without breaking the surface
- of the agar. Learn to usea lighttAch with the needle; however,many inoculation needles are so'sharp that they are virtually uselessin this respect. When the needle isplatinum or platinum-iridium wire,it sometimes is beneficial to fusethe working tip into a small sphere.This can be donelay momentary
Insertion of a well- insulated' (agiOn43telectricity)-wire into a 'carbon arc,or some otiier extremely hot environ- -.ment. The sphere shotla not be morethan twice The diameter of the wirefroin which it is formed, oth,erwise °
it will be entirelY"too heat-retentiveto be useful.
MPN Methods
When the needle is nicltromeresistance wire, it cannot be heat-fused; the writer prefers to bendthe terminal 1/16 - 1/8" of the wireat a slight angle to the overall axisof the needle. The side of theterminal bent portion of the needle'then its used for inoculation of agarsurfaces.
b When streaking for'colony isolation,avoid using too much inocu.lum. TheSereaking pattern is somewhatvariable accordinglo individualpreference. The procedure'faVoredbithe writeer is shown in theaccompanying figure' . Note .particularly that when going fromany one stage of the streaking to thenext, the 'inoculation needle is heat-sterilized.
8 Preparation of cultures for Gramstain
a The Gram stain alWays should bemade from a culture grown on anutrient agar surface. (nutrient agarslants are used here) or from nutrientbroth.
I
a
iy
. c
The culture should be young, and'should be actively',-owing. Manyworkers doubt the 4ty of theGram stain Made on a culture morethan 24 hours old.
Prepare a thin smear 'for the stainingprocedure. Most beginning workerstend to use l'ed much bacterial sus-pension 'in preparing the dried smearfor staining, The,p.mount of bacteriashould be so small that the &yin:
is barely visible to the naked eye.
V EQUIPMENT AND SUPPLIES
Consolidated lists of equipment, supplies,and culture media required for all multipledilution tube tests described in this outlineare shown in Table 2. Quantitative infor-mation is not Presented; thisls variable -according to the extent of the testing pro-cedure, the number of dilutidlis used, andthe number of replidate tubes per diltition.It is noted that requirements for alternateprocedtires are fully listed and choicese.remade in accordance to laboratory preference.
233
r
IF
1

I
MPN Methods
1 a Flame-sterilize an inoculation needle and air-cool.b Dip the tip of the inoculation needle, into the bac.: °
terial culture being studied.
c Streak, the inoculation needle tip lightly back andforth over half the 'agar surface, as in (4), avoid-ing scratching or breaking the agar surface.
d Flame-sterilize the inoculation needle and air-cool.
2 a /Turn the. Petri dish one-quarter-turn and streaktheinoculation needle tip lightly back and forth over one-Walf the agar surface., working from area (1) into.one-
, half the unstreaked area of the agar,
b Flame-sterilize the inoculation needle and air-cool.
3 er Turn tie Petri dish one-quarter-turn and streak theinoculation needle tip lightly back and forth over one-half the agar surface, working from area (2) intoarea (3), the remaining unstreaked area.
b Flame-sterilize the inoculation needle and. set it aside.
c Close the culture container and incubate,as prescribed.
Figure 3. A SUGGESTED PROCEDURE FOR COLONY ISOLATION BY ASTREAK-PLATE TECHNIQUE
AREA 1 .(NeaVr inoculum) agowkbh
_
AREA 2,
. (Moderate growth)Ir
AREA 3 (Isolated colonies)
-
ct
.APPEARANCE OF STREAK PLATE
AFTER INCUBATION INTERVAL
. .
t. 9
234. a
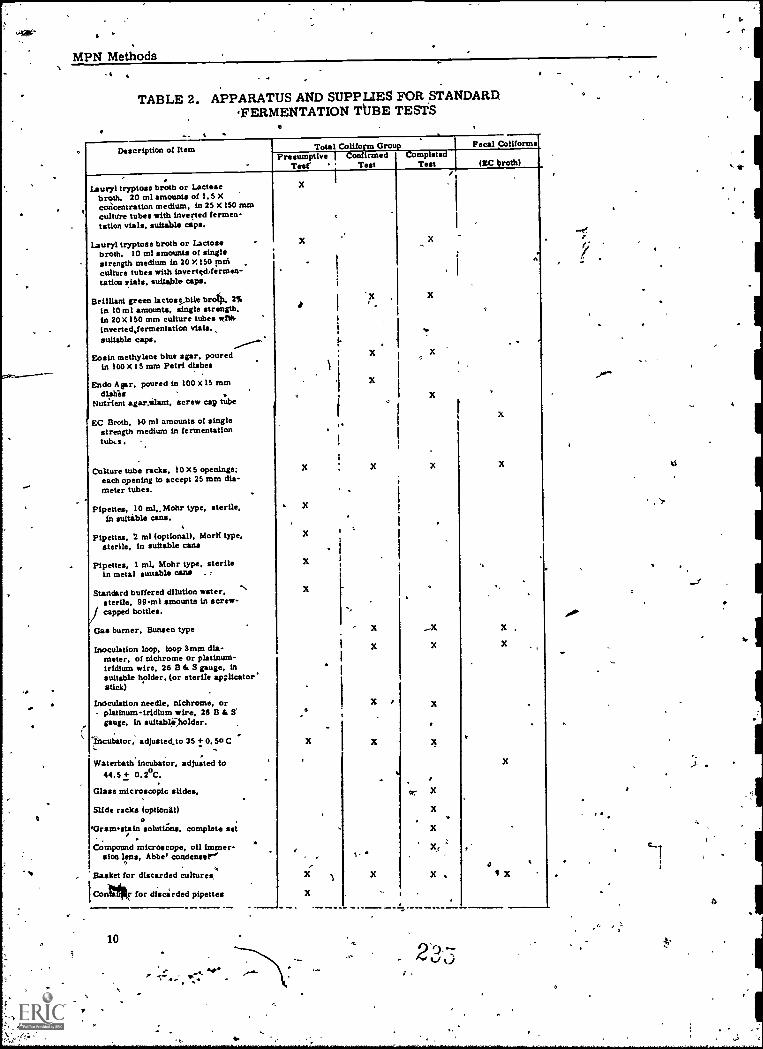
MPN Methods
TABLE 2. APPARATUS AND SUPPLIES FOR STANDARD'FERMENTATION TUBE TESTS
--Description of Item
Lauryl tryptose broth or Lactosebroth. 20 ml amounts of 1.5 Xconcentration medium, in 25 X150 mmculture tubes with inverted fermen-tation vials. suitable asps.
Lauryl tryptose broth or Lactosebroth. 10 ml amounts of singlestrength medium in 20 X150 pintculture tubes with inverteddermen-tation vials. suitable caps.
Brilliant green lactose.bile brotli. 2%in 10 ml amounts, single strength.in 20 X150 mm culture tubes wfthinverted,termentation vials.,suitable caps.
Eosin methylene blue agar. pouredin 100 X15 mm Petri dishes
Endo Apr, poured in 100 x15 mmdialfer
Nutrient agar.elant, screw cap tube
EC Broth, 50 ml amounts of singlestrength medium in fermentationtubs.
Culture tube racks, 10 X5 openings;each opening to accept 25 mm dia-meter tubes.
Pipettes, 10 ml Mohr type, sterile.in suitable cans.
Pipettes. 2 ml (optional), Morn' type,sterile, in suitable cans
Pipettes, 1 ml, Mohr type, sterilein metal suitable cans
Standard buffered dilution water,sterile, 09-m1 amounts in screw -
I capped bottles.
Gas burner, Bunsen type
Inoculation loop, loop 3mm dia-meter, of nichrome or platinum-iridium wire. 26 B & S gauge, insuitable holder. (or sterile apr.licator.stick)
Inoculation needle, nichrome orplatinum-iridium wire, 26 B & S'gauge, in suitablii,holder.
liscubstor, adjustedio 35 + 0.50C
Waterbath incubator, adjusted to44.5 + 0. 2°C.
Glass microscopic slides,
Slide racks (optional)
"Gram-stain solutbins, complete set,
Compound microscope, oil immer-sion lens, Abbe' condenser"'
Basket for discarded cultures,
Contkr for discarded pipettes
10
e.
Total Conform GroupPresumptive 1 Confirmed
Test' ' Test
X
X
X
X
X
X
X
X
X
L
X
X
X
X
X
Fecal ConformsCompleted
Test (EC broth)
X
X
'X
X
X
I
X
X
X
o
x
2`:).
I-
cii
r
e
Part 2DETAILED-TESTING-PROCEDURES FOR MEMBERS OF THE
COLIFORM GROUP BY MULTIPLE DILUTION TUBE METHODS
I SCOPE
A. Tests Described
1' Presumptive Test
2 Confirmed Test
3 Completed Test
4 Focal Coliform Test
B Form of Presentation
The Presumptive, Confirmed, andCompleted Tests are presented as total,independent procedures. It is recognizedthat thin form of presentation is someivhat.repetitious, inasmuch as the PresumptiveTest is preliminary to the tonfirrnedTest, and both the Preiumptive Test andthe Confirmed ;Test are preliminary to theCompleted Test for total conforms.
In using these procedures, the worker'must know at the outset what is tobe thestage, at which the test is to be ended, andthe details of the procedures throughout,in order to prevent the possibility ofdiscarding gas - positive tubes beforeproper transfer procedures have beenfollowed..
Thus, if the workr; knows that the test willbe ended at the Confirmed Test, he willturbt once to Section III, TESTING TO-THE CONFIRMED TEST STAGE, and willignore Sections II and IV.
The Fecal Coliform Test is describedseparately, in Section as anadjunct to the Confirmed, Test and to theCompleted Test.
II TESTING TO.PRESUMPTIVE TEST. STAGE
A First-Day Procedures
Prepare a laboratory data sheet forthe 'sample. Record the followinginformation: assigned laboratorynumber, sou of sample, date andtime o ection, temperature of the
ource, name, of sample: collector,date and time of receipt of sample inthe laboratory. Also show the dateand time of starting tests in thelaboratory, names) of worker(s) per-forming the laboratory tests, and thesample volumes planted.
2 Label the tubes. of Iftrryl tryptose brothrequired for the initial planting of thesample (Table 3). The label shouldbear three identifying marks. Theupper number is the identificationthe worker(s) performing the test(applicable to personnel in trainingcourses), the number immediatelybelow is the,assigned laboratory num-ber, corresponding with the laboratoryrecord sheet. The lower number is the
- code to designate the sample volumeand which tube of a replicate series is
'indicated,
NOTE: Be sure to use tubei containingthe correct concentrations of culture mediumfor the inoculum/tube volumes. (See thechapter on media and solUtions for multiple'dilution tube methods or refer to the current
: edition of Standard Methods. for Water-andWastewater).
236
4
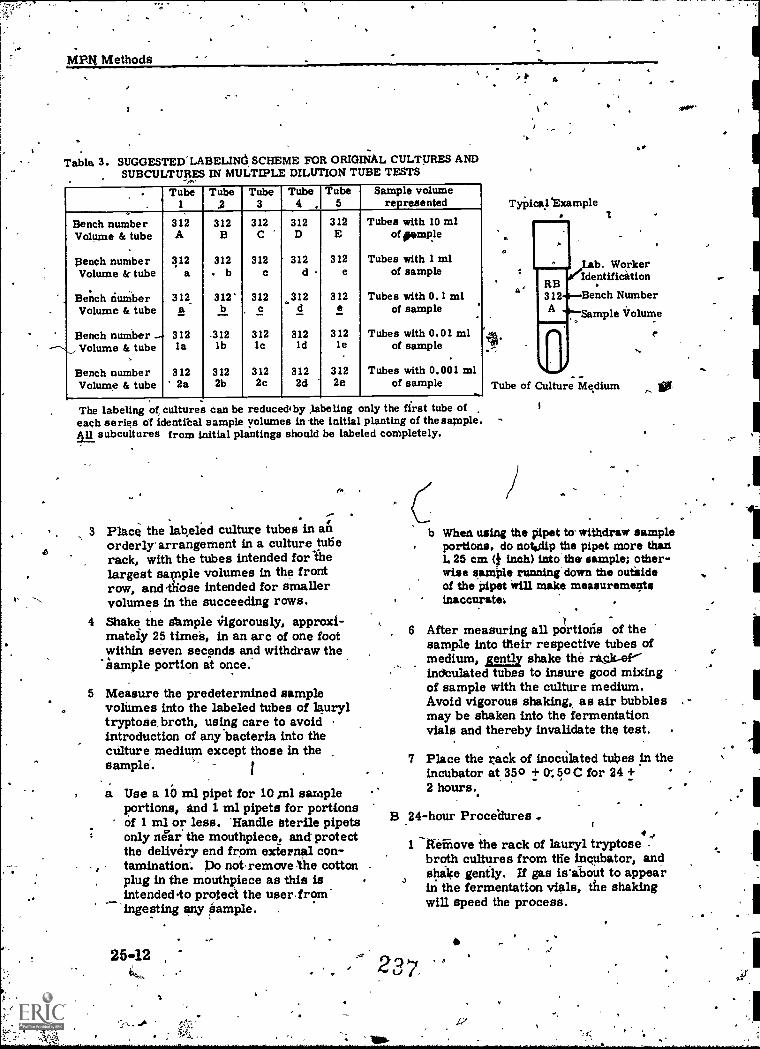
MPH Methods
Tabla 3. SUGGESTED LABELINd SCHEME FOR ORIGINAL CULTURES AND, SUBCULTURES IN MULTIPLE DILUTION TUBE TESTS
Tube1
Tube.2
Tube3
Tube4 ,
Tube5
Sample volumerepresented
Bench number 312 312 312 312 312 Tubes with 10 mlVolume & tube A B C' D E of pomple
Bench number 312 312 312 312 312 Tubes with 1 mlVolume dr tube a . b c d e of sample
Bench number 312 312' 312 312 312 Tubes with 0.1 nilVolume & tube a b c d e of sample
.
Bench number -- 312 312 312 312 312 Tubes with 0.01 ml.,,, Volume & tube la lb lc ld le of sample
Bench number 312 312 312 312 312 Tubes with 0.001 mlVolume & tube 2a 2b 2c 2d 2e of sample
-ff-
. The labeling of cultures can be reduced'by labeling only the first tube ofeach series of identibal sample volumes in 'the initial planting of the sa.paple.EL subcultures from initial plantings should be labeled completely.
6.,
3 Place the labeled culture tubes in anorderly arrangement in a culture tuberack, with the tubes intended for thelargest sample volumes in the frontrow, andiiiose intended for smallervolumes in the succeeding rows.
4 Shake the sb.mple 3:rigorously, approxi-mately 25 times, in an arc of one footwithin seven seconds and withdraw thesample portion at once.
5 Measure the predetermined samplevolUmes into the labeled tubes of lauryltryptose broth, using care to avoidintroduction of any bacteria into theculture medium except those in thesample. I
a Use a 10 ml pipet for 10 ml sampleportions, and 1 ml pipets for portionsof 1 ml or less. 'Handle sterile pipetsonly near the mouthpiece, and protectthe delivery end from external con-tamination. Do not remove the cottonplug in the mouthpiece as this isintendedto protect the user from'ingesting any 'sample. .
25-12
A
Typical' Example
St`
Lab. WorkerIdentification
Bench Number
Sample Volume
- -Tube of Culture Medium to
b When using the pipet to' withdraw sampleportions. do notadip the pipet more than1.25 cm (f inch) into the sample; other-wise sample running' down the outsideof the pipet make measurementsinaccuratel
6 After measuring all portions of thesample into their respective tubes ofmedium, gently shake the rack e&inoculated tubes to insure good mixingof sample with the culture medium.Avoid vigorous shaking, as air bubblesmay be shaken into the fermentationvials and thereby invalidate the test.
7 Place the rack of inoculated tubes in theincubator at 350 0;50C for 24 +2 hours.
B 24 -hour Proceihires
1 -Relieve the rack of lauryl tryptosebroth cultures from the incubator, andshake gently. If gas is'aoout to appearJin the fermentation vials, the shakingwill speed the process.
236

MPN Methods
2 Examine each tube carefully. Record,in the column "24" under LIST on theLaboratory data sheet, each tube showinggas in the fermentation Vial as a positive(+) test and each tube not showi g gasas a negative (-) test. GAS INQUANTITY IS A POSITIVE TEST;
3 Discard all gas-positive tubes of lauryltryptose broth, and return all the gas-negative tubes to the 35°C incubator oran additional 24 t 2 h ?ur
C 48-hour Prockedures
1 Remove the rack of cult e tu eirfromthe incubator, read and record, gasproduction for each tube.
2 Be sure to record all results under _the'48-hour LTB column,.on the data sheet.Discard all tubes. The-PresumptiveTest isconcluded at this point, and'Preaumptivecoliforms per 100 ml can
° be computed according to the methodsdescribed elsewhere in this manual.
III TESTING TO CONFIRMED TEST STAGE
- Note that the description starts with thesample inoculation and includes the' ,%.
Presumptive Test stage. The, ConfirmedTest preferred in,Laboratories of this agency_is accomplished by means of the brilliantgreen lactose bile broth (BGLB) and theacceptable alternate tests are mentioned inIII F. In addition, the Fecal Conform Test isincluded as an optiorial adjunct to the procedure,
A first-Day Procedures
1 Prepare a laboratory data sheet for thesamPle. Record the following info-mation: assigned laboratory number,'source'of sample, 'date and time ofcollection, temperature of the source,name of sample.collbctbr, .date andtime of receipt of sample in-thelaboratory.. -.Also show the dati and
\
238
2
e of starting tests in the laboratoryna e4bm ) of worker(s) performing thelaboratory tests, and the sample -
volumes planted.
Label the tubes of lauryl tryptose brothrequiredtor the initial planting of thesample. The label should-bear threeidentifying marls. The upper numberis the identification of the worker(s)performing the test (applicable topersonnel in training courses), thenumber immediately below is theassigned laboratory number, corres-ponding with the laboratory recordsheet. The lower number is the codeto designate the sample volume andwhich tube of a replicate series is indicated.
NOTE0,-ml samples are beingplanted, it is necessary to use tubes
. coqtaining the correct cdncentrationof culture medium, This has previbuslybeen noted in II A-2.
3 Place the labeled culture tubes in anorderly arrangement in a culture tube.rack, with the tubes intended for thelargegt sample volurhes in the frontrow, and those intended for smallervolurries in the succeeding rows.
4 Shake the sample vigorously, approxi-mately 25 times, in up-and-downmotion.
5, Measure-the predetermined samplevolumes into the labeled tubes of lauryltryptbse broth, using care to avoidintroduction of any bacteria into theculture medium except those in the sample.
a Use a 10-ml pipet for 10 ml sample.portions, and 1-:m1 pipets for portionsof 1 ml or less. Handle sterile pipetsonly near the mouthpiece, and protectthe delivery end from external con-tamination. Do not remove the cottonplug in the mouthpiece as this is intended'to protect the user from ingesting anysample.
25.13
;

MPN Methods
b When using the pipet to withdraw sampleportions. do not dip the pipet more than1.25 cm (.1 inch) into the sample; other-wise sample running down the outside`of the pipet will make measurementsinaccurate.
c When delivering the sample into theculture medium, deliver sampleportions of 1 ml or less down intothe culture tube near the surface ofthe medium. Do not deliver smallsample volumes at the top of the tubeand allow them to run down inside_the tubeitoo_much-orthe sample
will fail to reach the culture medium.
d Prepare preliminary dilutions ofsamples for portions of 0.01 ml or .less before delivery into the culturemedium. See Table 1 ftfispreparationof dilutions. NOTE: Always deliverdiluted sample portions into theculture medium as soon as possibleafter preparation. The interval
1/ bitween preparation of dilution andintroduction of sample into themedium never should be ag muchas 30 minutes.
6 After measuring all portions of the .
sample into their respective tubes ofmedium, gently shake the rack ofinoculated tubes to insure good-mixingof sample with the culture medium.Avoid vigorous shaking, as air bubblesmay be shaken into the fermentationvials and thereby invalidate the test.
N7 Place the rack of inocnIiiited tubes inthe incubator at 350 0.50 C for 24 ±2 hours.
B ,24-hour Procedures
1 Elemove the rack of lauryl tryptbsebroth cultures from the incubator, andshake gently. If gas is about to appearin the fermentation vials, the shakingwill speed the process. .
A./
2 Examine each tube carefully. Record,in the column "24" under LST on thelaboratory data sheet, each tube showinggas in the fernientation vial as apositive (+) test and each tube not
showing gab as a negative (-) test.GAS IN ANY QUANTITY IS A POSITIVETEST. -
3 Retain all gas-positive tubes of lauryltryptose broth culture in their placein the rack, and proceed_
4 Selectthegas- positive tubes of lauryltryptose broth culture for ConfirmedTest pfocedures. Confirmed Testprocedures knot be required for allgas-positive cultures. If, after 24-hoursof incubation, all five replicate culturesare gas-positive for two or more con-secutive sample volumes, then selectthe set of five cultures representingthe smallest volume of sample, in whichall tubes were gas-positive. ApplyConfirmed Test procedures to all thesecultures and to any other gas-positive.cultures representing smaller volumesof sample, in which some tubes weregas-positive and some were gas-negative.
5 Label one tube of brilliant 'green lactosebile brotlill3GLB) to correspond witheach tube of lauryl tryptosebroth-selected for Confirmed Test procedures.
6 Gently shake the rack of PresumptiveTest cultures. With''a flame-sterilizedinoculation loop transfer one loopful ofculture from each gas-positie tube tothe corresponding tube of BGLB.- Placeeach newly inoculated culture in BGLBin the position of the original s-positive -,tube. -
7 After making the transfers, the rack._should contain some 24-hour gas-negative tubes of lauryl tryptos§iproth-and the newly inoculated BG,J.13.'w
8 If the Fecal Conform Test is includedin the testing procedures, consultSection V of this part of the outline oftesting procedures.
239
I .

MPN Methods
9 'Incubate the 24-hour gas-negative, BGLB tubtubes ohours t 35o + 0.5o
C.
C 48-hour Procedures
and any newly-inoculatedGLB an additional 24 + 2
1 Remove the rack of cUlture_tubetti-from.the_incubator, and record, gasproduction for each tube.
( 2 Some tubes will be lauryl tryptoae brothand some will be brilliant green, lactosebile broth (BGLB).' Be sure to record
' 'results from LTB under the 48-hour
thecolumnand the BGLB results under
the 24-hour column of the data sheet.
3 Label tubes of BGLB to-correspond withall (if any) 48chour gas-positive culturesin lauryl tryAose broth. Transfer oneloopful of culture from each gas-positiveLTB culture to the correspondingly-labeled tube- of ,BGLB. NOTE: Alltubes of LTB culture which werenegative at 24 hou.r,s and becamepositive at 48 hours are to be transferredThe optiott described above for 24-hourcultures does'not apply at 48hours.
6
4 If the Fecal Coliforti. test is includedin the testing'procedure, consultSection V of the part of the outlineof testing procedures.
5 Incubate the 24-hour gas-negativeBGLB tubes and any newly-inoculatedtubes of BGLB 24 + 2 hours at 35cr -O. 50 C.
6 Discard all tubes of LTB and 24-hourgas-positive BGLB cultures.
D 72-hour Procedures--. , *!. . . ,
1 If any ,cultures remain to be examined;. . ': all:will be BGLB. Some may be 24
. . ,
?4o
41.
hourshours old and some may be 48 hoursold. Remove tekh culture, from the
examine each tube for, gasproductio,n, and record results on thedata sheet.
2 Be sure to record the results of 24-hourBGLB cultures in the "24" column under.BGLB and the 48-hour results under the"48" column of the dAta sheet. '
3 'Return any 24-hour gas-negative cultureiifor incubation 24 +-2 hours at 35 +0. 50C. -
A 1
4 Discard all gas .positive BGLB,culturesand all 48-hour gas-negative culturesfrom BGLB.
5 It is possible that all cultural work Ad. results for the Confirmed Test have.been finished at this point.' If so, codifyresults and determine Confirmed Testcolifor per 100 ml as described inthe' outl e on use Of MPN Tables.
E 96-hour Procedures
At most only a few 48-hour cultures inBGLB may be present. Read and recordgas production of such cultures in the "48"column under BGLB on the data sheet.Codify results and determine ConfirmedTest coliforms per 100 ml.
F- Streak-plite methods for the ConfirmedTest, using eosin methylene blue agar orEndo agar plates, are accepted proceduresin Standard, Methods. Thearorker whoprefers to ?file one of these'media inpreference to BGLB (also approved inStandard Methods) is advised to refer toth curre9t edition of "Standard Methothi-f r the E:xaitninittLon of Water and Waste-water" for procedures.
25-15

IV TESTING TO COMPLETED TEST STAGE
(Note that this description starts with thesample inoculation and proceeds through thePresumptive and the Confirmed Test stageti.In-addition; the Fecal Conform Test is,referred to as an optional adjunct to theprocedures)
A First-Day Procedures
1 Prepare a laboratory data sheet for thesample. , Record the following information:assigned laboratory number, source ofsample, date and time of collection,temperature of,the source, name ofsample-collector, date and time ofreceipt of sample in the laboratory.Also show the date and time of startingteste in the laboratory, name(s) ofworker(g) performing the laboratorytests, and the sample volumes planted.
-'2 Label the tubes of lauryl tryptose broth
required for the initial planting of thesample. The label should bear threeidentifying marks. The upper numberis the identif&ation of the worker(s)performing the test (applicable topersonnel in training. courses),the number immediately below is theassigned laboratory number, corres-ponding with the laboratory recordsheet. The lower nimber is the codeto designate the'sample volume andwhich tube of.a replicate series isindicated: Guidance on labeling forlaboratory data number and identificationof ifidividual'tubes is.describe,d else-where in this outline.
4.
e
NOTE: If 10-m.l. samples are beingplated, it.is necessary to use tubescontaining the correct concentration .
of culture Medium. This has previouslybeen noted elsewhere in this outlineand referral is 'made to
3 -Place the labeled culture tubee.in.ahorderly arrangement in a culture tuberack, with the tubes intended for thelargest sample volumes in the frontrow, and intended for sritallervolumes in the succeeding now's..
4 Shake the sample vigorously, approxi-mately 25 times, in an up-and-down ,
motion. .
5 Measure the predetermined samplevOluines into the labeled tubes of lauryltryptose broth, using care to avoidintroduction of any bacteria into theculture medium except those in thesample.
a Use a 10-m1 pipet for°10 ml sampleportions, and 1-ml pipets for portions.of 1 ml or less. Handle sterilepipets only near the mouthpiece,and protect the 'delivery end fromexternal contarhinatiph.. Do not movethe cotton plug in the "mouthpiece
this is intended to protect theuser from inAgsting any sample.
b When using the) pipe'i to v4tkdraw-tiainple' portions, do not dip the pipet more than
1. 25 cm (I inch) into the sample; other-wise sample running down the outsideof the pipet will make measurementsinaccurate.
c When delivering the sample into theculture medium, deliver sampleportions of 1 ml or less down into
the milturetube near the surface ofthe medium. Do notdeliver smallsampleirolumes at the to of thetube and allow them-t dovininside the tube; too ch of thesample will fail to reach the cultumedium.
._,
Prepare preliminary dilutiOns ofsamples for portions of 0.01 ml orless before delivery into, the culturemedium. See TE,Lble _2 for preparationof dilutions. NOTE: Always, deliverdiluted sample portions into the; _
culture medium as soon as possibleafter preparation. The intervalbetween preparation of dilution andintroduction of sample into themedium never should be as much as30 minutes.
° ,
6 After measuring all portions of thesample into-"their xYespeotive tubes ofmedium, erz_lay shakeltie rack ofinoculated tubes to ,ipsirf good mixingof camp e with the odlture medium. .
Avoid gorous shaking, as air bubblesmay b shaken into the fermentationvials d thereby'invalidate thebest.-
7. Place the rack of, inoculated tubes inthe incubator at 35'0 + 0.50C for 24,+2 hours.- ;
B 24-hoir Procedures.
. 1 Remove the rack of lauryl tryptosebrothcultures from the incubator, and shakegently. If gas is about to appear in thefermentation viala, the shaking willspeed tale process.
2 Examine 'each tube 0irefully. Record,in thelcolumn "24" under LSt on thelaboratory data sheet, each tube. showinggas the fermentation vial as a positive(+) test and each tube not showing gasas ' negative (-) test. GAS IN ANY .
QU NTITY IS A POSITIVE: TEST.
3 R tain all gas - positive tubes of lauryltryptose blOthcultiire in their plade inthe rack, and proceed.
I
4 .
4 Select the gas-positive tubes, of lauryl.""Ntti tryptose broth-culture -for the CoSifirmed
Test procedures. 'Confirmed TestproceduresinaLnot be required forall gas-positive cultures. If, 'after24 -hours of incubation, all fivereplicate cultures are gas-positive %for,-two or more consecutive' sample,volumes, Then select the set of fivecultures representing the smallest ".
volume of sample in which all tubeiwere gas-positive Apply ConfirmedTest .procedures, to all these Culturesand toany other gas-positive culturesrepresenting smaller volumes ofsample, in which some tubes weregas-positive and some were gas-negative..
5 Libel one tube of brilliant green lactosebile broth (BGLB) to correspond with.each tube of lauryl tiyptose brothselected for Confirmed Test procedures.
6, ,Gently shake the rack of PresumptiveTest cvliirsts. -With a flame- sterilikedinoculation loop transfer-one loopful ofculture from each gas-positive tube te-the 'cOrres#04ing tube -of BGLB. "Place
4ph tiewly in ,ciprulated, culture fritoBGLB in the' poiiition of. the 'originalgas7positivee.
..7 If the FecalC011fOrm Test is included
pi the testing procedure, consultSection V of this outline for details of.the-testing, pxocedure..
8 After making the transfer, the rackshould contain'some 24L,hour gas-negatiire tubes of lauryl tryptose borthand-the newly inoculated BGLB.Incubate the rack of cultures at 350C+ 0.50C for .24 * 2 liouKs.
C 48-hour Procedur
1 Remove the .rack ofthe incubator, readproduction for each
culture tubes fromand record gastube.
2 Some tubeErwal be lauryl tryptose brothand some will be brilliant green lactose
o
t
MPN Methods
bile broth (BGLB). .Be sure to recordresults from LTB under the 48-hourLTB column and the BGLB results,_under the24-hourlolumn of e datasheet. -
.
3 Iltbel. tubes of BGLB to corresp d withall (if any) 48-hour gas-positive c turesin lauryl tryptoie broth. Transfer neloopful of culture from each gas- sit yeLTB culture to the correspondingly-labeled tube of - BGLB.. NOTE: All tubesof LTB culture'which were negative at24 hours and became positive- at 48 hoursare to be transferred. The Optiondescribed above for 24-ho LTBcultures does not apply at 48 s.
4 Incubate the'24-hour gas-negative BGLBtubes and any newly - inoculated ttlizes ofBGLB q4 + 2.hours at 350 + -0.50C..Fietain11 24 -hour gas-positive culturesin BGLB for, further test procedures.
5 Label a Petri dish preparation of eosinmethylene blue agar (EMB agar) tocorrespond with each gas-positiveculture in BGLB.
EP Prepare a streak plate for colonyisolgtion from eac# gas-positive culturein BGLB on the correspondingly-labeledEMB agar' plate.
Incubate the 'EMB agar plates 24 + 2hours at 350 L 0.50C.
D 72-hou Pr'ocedures
1 Remove the cultures from the incubator.Same may be on BGLB; several EMBagar plates also can be expected.
2 Examine and record,gas productionresults for any cultures ins BGLB.
. -
.3 Retain any gas-positive BGLB culturesand prepare streak plate inoculationsfOr*colony isolation in EMB agar.;Incubate the EMB agar plates 24 + .
2 hours at 35 + 040 C. Discard theBGLB cultures after -
transfer, -
25'48A
6
a
I
4 . Reincubate any gas-negative BGLB1-cultures 24 + 2 hours at 350 + 0.50C.
5 Discard all 48-hour gasznegative BGLBcultur s.
6 Examine the EMB agar plates for thetype of colonies developed thereon.Well-isolated colortes having a darkcenter (when-viewed from the lowerside, held toward a light) are termed"nucleated or fisheye., colonies, andare regarded as "typical" conformcolonies. A surface shben may or maynot 'be present on "typical" colonies.Colonies which are pink or opaque butare not nucleated are regarded as"atypical colonies.." Other colonytypes are considered. "noncoliform. "Read and record resultb as + for"typical" (nucleated) colonies + for"atypical" (non-nucleated pink oropaque colonies); and - for other types .
. of colonies which might'develop.
7 With plates Searing "typical" colonies,select at least one well - isolated colonyand transfer it to a correspondingly-
' labeled tube of lactose broth and to anagar slant. As a second choice, select'
:,at least two "atypical" colonies (.iftypical colonies areonot present) andtransfer them to labeled tubes oflactose broth and to agar slants. As athird choke, in the absence of typicalor atypical,coliform-like colonies,aelect at least two well - isolatedcolonies representative of thoseappearing on the EMB plate,_ and trans-fer them to lactose broth and to agarslants.
8 incubate all cultures transfered from- EMB agar plates 24 + 2 hours ac15 +
0.,5oc,
E 96-hour Procedures
1 Subcultl.u.4 from the samples beingstudied May include; 48-hour tubes
, of BGLB, EMB agar plates, lactosebroth tubes, and agar slant cultures..

2414-
If any 48-hour tubes of BGLB are .
present, read and record gas productionin the "48" column under BGL.13. Fromany gas-positive B4OLB cultures pre-pare strdak plate inoculations for colonyisolation on EMB a ar. , Discard alltubes of BGLBfd incubate EMB agarplates 24 + 2 hours at 0.5o C.
3 If any EMB plates are present, examineand record results in the "EMB" columnof tlfe data sheet. Make transfers toagar als.nts and to lactose broth from
EMB agar plate cultures. Indecreasing order of preference, transferat least One typical colony, or at leasttwo atypical colOnies, or at least twocolonies representative of those on thePlate.
4. Examine and record results from thelactose broth cultures.°
5 Prepare a ,GramsPstained smear fromeach of thiagar slant cultures, asfollows:-
NOTE: Always prepare Gram stainfrom an actively growing culture, -preferably about 18 hours old, andnever more than 24 hourscold. Failureto observe this precaution often resultsin irregular staining reactions.
a Thoroughly clean a glass slide tofree it olginY trace of oily film.'
b Place one drop of distilled water: onthe slide.
c Use the inoe lotion needle to suspenda tila amount Of growth from thenutrient agar t culture in thedrop of water.
d Mix the thin sus eniion of cells withthe.t.ip of the ino ulation needle, andallow the water to ea.porate.
e "Fix" the smear by gently warmingthe slide over a flarne.
f Stain the smear by flloding it for 1 ."
minute with ammoniurn oxylate7crystaliolet solution.
MPN Methods
t.g Flush the excess dye solution
off in gently running wafer.
h Flood the `smear with Lugol'siodine err 1 minute.
i Wash the slide in gently runningwater.
Decolorize the smear wititAcetonealcohol solution,with gentle agitationfor 10-30 seconds, depending uponextent of removal of crystal violet dye.
k Counterstain for 10 seconds withsafranin solutiOn, then wash in' runningiratersand gently blot dp with bibulouspaper.
1 Examine the slide under the microscope,using the oil immersion lens. Conform/bacteria are Gram-negative (pink to reicolor and nonspore-formingt rod-shapedcells, occurring singly, in orrarely in short chains.
,
Ili If typical oliform staining eaction andmorphology are observed, record + inin the appropriate space under t "Gram..Stain" column of the data -s feet If typical
&,morphology and staining reaction are notobserved, then mark it + or - and makesuitable comment in theThre arks" columndt the right-hand side of the data sheet.
n If spo re-forming bacteria are observed, itwill be necessary to rep ify the culturefrom,which the observa onsNkere made.Consult the indtructor, or refer to StandardMethods, for procedur s.
.At this point, Willi possi le that all culturalwork for the Completed Test has been finished.If so, codify results any determine CompletedTest conforms per ,10
25'19
MPN Methods
F 120.-hour Procedures and following:
1 Any procedures to be undertaken fromthis, point are "straggler" cultures onmedia already describedrand requiringstep7by-step methodology already givenin detail: Such cultures ma,, be on:EMB plates, agar slants, or lactosebroth. The same time-and-temperatureof incubation required for earlier studiesapplies to the "stragglers" as do theobservations, staining reactions, andinterpretation of results. On con-clusiOn of all cultural' procedures,codify results and determine CompletedTest coliforms per 100 ml.
V FECAL COLIFORM +TEST
A General Information
1 The procedure dscribed is'an elevatedtemperature test for fecal coliformbacteria.
2. Equipment required for the tests p.rethose requii'ed for the PresumptiveTest of Standard Methods, a water-bathincubator, andthe appropriate culture,media. to4
B Fecal Coliform Test with EC Broth
1 Sample: The test is applied to gas-positivepeer frOm the StandardMethod Presumptive Test (lauryl.'tryptose broth), in parallel with,Confirmed Test procedures.
2 24-hour Operations. Initialprocedur/esare'the planting procedures describedfor the Standard Methods .PresumptiveColiform test.
a After reading and recording gas-production on laurzl tryptose broth, c
temporarily retain all gas-positive'tubes. y
b Label a. tube of EC broth to corre-_spond with each gas-positive tube
'roj lauryLfryptose broth. The optionregarding transfer of only A limited '2 e4
z
2540
number. ot tube's to 'the ConfirmedTeat sometimes can be applied here.However, the worker is urged toavoid exercise of this optionuntilhe has assured- the applicability ofthe option by preliminary testh onthe sample 74ouree.
c Transferone loqpful of culture fromeach gas - positive, culture in lauryl '
tryRtose broth to the correspondinglylabeled tube of EC broth..
d Incubate EC; broth tubes 24 + 2 hoursat 44. 5.±. 0.2°C in a waterbathwith water depth sufficient to collieup at least BA high as The top of theculture medium in the tubes. 'Place'in waterbath as soon as possaleafter inoculation and always within30 minutes after inoculatio&
.48- hour operation!?
a Remove the rack of EC culturesfrom the waterbath, shake gently,and record as production for each .tube. Gas in any quantity is apositive .test.
b As soon as results are recorded,discard all tubeS. .(This is a 24-hout test for EC broth inoculations
. and not a 48-hour test.. -
c Transfer" any additional 48-hourgas-positive tubes of lauryl tryptose,broth to correspondingly labeled
. tubes of EC broth. Incubate 2'4 +hours at 44\.:5 ,
4 72-hour operations
a Read and record gas production foreach tube. Disbard all cultures.
b. Codify results and determine fecal. coliform coup per 4,00 ml of sample.
A
a
tiy

0.4)
SE
1.0
A
-9°
"id
Examination. of Water for Colifoxin
.5,
eA
O
, ..
.StieptdeOpeus Groups
TESTS OR C01.1NRM
SAMPLE I
LACTOSE OR LAURYL TIMOR /BOTH IFERMENTATION TUBES (SERIAL DILUTION)
OAS POSITIVE --!..,,GAS NIGANTIVEI (24 HI t 2 HR.)I .
1' I ° 1
II
.66
o t,'. .
1
8' .
: .,-,
.LACTOSE A LAURYL TRYPTOM
.
BROTIIAll Ni! CHANGE/HUB-MU/IAANO AtE MECUM . AT 3$ DEG C0 S DEO e.
OAS POSITIVES TIMES ?ANY -A/AOUNIOF OAS) CONSTITUTE A POSITIVE
pimummtvi,Tist.
OAS POSITIVE 'GAS. NECOLTIIIP Tatm. INCUBATION TIME FOlt ectonII opuFALTisr:131.out: L33 IS 48, 433
9 p.
5, 5.
CONFIRMATORY BROTH I 9
BRILLIANT OREM LACTOSE BILE
. L.MI PLATESOIL ENDOAGAR flATES.
ALTERNATECONFIRMED
- OAS POSITIVECOLIFOR/A OROUP
CONFIRMED
Nuption AGAR SLUT
.OAS NEGATIVE
COLIFORM OROUPNOT CONFIRMED
LACTOSE BROTH TUBE
GRAM + ANIS GRAM NEGATIVERODS- AND/OR RODS NO SPORESSPOREFORMERSP
IF ALSOOAS POSITIVE "IN LACTOSE
. 4
<-.e
OAS POSITIV
COUFORM GROUP PRISMCOMPLETED TEST
IF ALSOOAS SEDATIVE
IN LACTOSE
I
S.
TRANSIER TO EMB PLATE COUFORM GROUP ABSENTAND MEAT PROCESS
a.
246 1'
INCUBATE ICILS TUBES FOR 5 HIS3 HIS. AT 35 DEO. Cf 0.5. DEO. C.
INCUBATE EMS OR ENDO AGARPLATES FOlt 24 HRS. t 2 HIS AT35 DEO. CS;-0.5 OEM C
OAS NEGATIVECOLUMN GROUPABSENT
4
2
,
`
80 °
P
. B 25 -21
Nz.
err

.
t
t
Part 3LABORATORY METHODS FOR FECAL STREPTOCOCCUS
(Day-By-Day Procedures).
I GENERA I:.INFORMATION
A The same sampling and holding'proceduresapply as. for the coliform test.
B The number, of fecal streptococci in watergenerally is lower than the number ofcoliform bacteria. . It is good- practicein multiple dildtion tube tests to startSample planting series, with one sampleincrement larger tlian for the coliform
. test. For example: If a sample plantingseries of 1.0, 0.1, 0.01, and 0.001 mlis planned for the, coliform test, it is
° suggested that a series of 10, 1.0, 0" 1,,and 0.01 ml be planted4Or the fecal
streptobocCus test.
C Equipment required for the lest is the santeas reqUired for the Standard MethodEtPresumptive and Confirmed Tests, exceptfor the differences in culture media.
II STANDARD METHODS (Tentative),
41 PROCEDURES
A First-Day Operations
1 Prepare the sample data sheet andlabeled tubes of azide dextrose brothin the same manner as for the -Presumptive Test. NOTE: If 10-inlsamples are included in the series, besure to usea special concentration(ordinarily double- strength) of azidedextollte broth for these sample
A
4 Shake the rack of tubes or inoculatedculture media, to ' insure good mixingof sample with medium...
5 'Place the rack of inoculated tubes inthe incubator at 350 + 0.50 C for 24 +
..-1)hours.
B 24-hour Operations
1 Remove the rack of tubes from theincubator. Read and record the resultsfrom each tube. Growth is a positivetest with this test. Evidence of growthconsists either of turbidity of themedium, a "button" of sediMentat thehottom of the cullre tune,, or, both.
2 11tbel a tube of ethyl violet azide brothto correspond with each p,otititureof azide dextrose'brOth. %inpermissible to use the same conf torytransfer option as described for thecoliform Confirmed Test, in this outline.
3 Shake the rack of cultures gently, to .
resuspend cells which have settledout to the bottom of the culture tubes.
,ster:
4 Transfer three.loopfuls or use awood applicator to., transfer culture
ti from each growth-positive tube ofazide dextrose broth to the correspond- -'ingly labeled tube of ethyl violet azidebroth.
.portiqns
2: Shake the sample vigoroualy,pproxi-.4i mately 25 times, in an up-and-downmotion. ....i' // :1°%,
3 Measure the predetermined samplevolumes into the labeledlubes.of azidedextrose hr th, using the sample'measurein and delivery techniquesused for the Presumptive Xest.
5 As transfers are made, place the newly.ti inoculated tubes of ethyl viOet azide
. broth in a separate rack vhile returning.the AD tubes_ to .their fob Mer positionsin the rack.
'46 Return the rack, all azide dextrose
broth tubes. and evtly-inoculated tubesof ethyl violet' azide broth; to the in-cubator. I ubate 24 + 2 hours at 35°+ 0. 5:C.
44,
MPN Method
C 48-hour Operations
1 Remove therack of tubes from theincubator. Read and report results.Growth, either in azide dextrose brothor in ethyl violet azide brOth, is apositive test. Be sure to report theresults of the azide dextrose brothmedium under the "48" column for thatmedium and the results of the ethylviolet azide broth cultures under, the."24" column for that medium.
2 Any 48-hour growth-positive culturesof azide dextrose broth are to betransferred (as before) to ethylviolet azide broth. Discard all 48-hourgrowth-negative tulles of azide dextrosebroth and all 24-hour growth7positivetubes of ethyl violet azide broth.
3 Re-incubate the 24 -rhour growth-negativeEthyl Violet azide tubes alter againg-e-.
inoculating with their respective positiveKzide Dextrose tubes and the newly-inoculated tubes of ethyl violet azidebroth 24 + 2 hours at 35° + 9.5°C.
D 72-thour Operations
1 Read and report growth results of alltubes of ethyl violet azide broth.
2 Discard all growth positive culturesand all 48-hour growth-negativecultures.
3 Reincubate .anye -hour growth-negativecultures in ethyl violet azide broth afterreinoculating with their respecgivepoSitkve azide dextrose! tubes for anadditional 24 + 2 hOhrs at 35° + 0.5°C.
X 96-hour Operations
1 Read and report growth results or anyremaining tubes of ethyl violet azidebroth.
t
2 Codify results and determine fecalstreptococci per 100 ml,.)
REFERENCES
1 Standard Methods for-Abe Exatination ofWater and Wastewater (14th Ed).Prep,ared'and published jointly byAmerican Public Health Association,American Water Works Association,and Water Pollution ControlFederation.. 1975.
2 draeldreich, E. E. , Clark, H. F. , Kabler,P. W. , Huff, C. B. and Bordner, R.The Coliform Group. II. Reactionsin EC Medium at 450 C.' Appl.Microbiol. 8:347-348. 195g.
3 Geldreich, E. E., Bordner, R. H., Huff,C. B. , park, H. F. and Kabler, P.W.Type Daitribution of Coliform Bacteriain the Feces of Warm-Blooded Animals.J. Water Pollution Cotrol Federation.34:295-301. 1962% '
This outline was prepared by H. L.Jeter,- Chief, Program SupportTraining Branch, USEPA,,cincinnati,Ohio 45268
Descriptors: Coliforms, Fecal -ConformsFecal Streptococci, Indicator Bacteria,Laborittory Equipment, LaboratoryTests, Microbiology, Most ProbableNumber, MPN, Sewage Bacteria,Water Analysis
J
j
DETAILED MEMBRANE FILTER METHODS
I 'BASIC PhOCEDURESq
A Introduction
Successful application of, membrane filter'methods requires development of goodroutine operational practices. Thedet.iled basic procedures described inthis Section are applicable tq all mem-brane filter methods in water bacteriology'for filtration, incubation, colony counting,and reporting of results. In addition,equipment and supplies used in membranefilter procedures described here are notrepeated elsewhere in this text in such detail.
Workers using membrane filter methodsfor the first time are urged to becomethoroughly familiar with these basicprocedures and precautions.
B General Supplies and Equipment List
Table 1 is a check list of materials.
C "Sterilizing" Media
Set tubes of freshly prepared medium in aboiling waterbath for 10 minutes. Thismethod suffices for medium in tubes up to25 X-150; mm. Frequent agitation is neededwith media containing agar.
Alternately, conform media can bedirectly heated on a hotplate to the firstbubble of boiling. Stir the mediumfrequently if direct heat is used, to aboidcharring the medium.
Dc not sterilize in the autoclave.
D General Laboratory Procedures withMembrane Filters
1 Prepare data sheet
Minimuni data required are: sampleidentification, .test performed includingmedia and methods, sample filtrationvolumes, and the bench numbersassignedto individual membrane filters.,
2 Disinfect the laborator bench surface.
Use a-suitable disinfectant solution andallow the surface"to dry beforeprocee ding.
.
3' Set out sterile culture containers in anordeX1y arrangement.
4 Label the culture containers.
Numbers correspond with the. filternumbers shown on the data sheet.
5 Place one sterile absorbent pad* ineach culture container, unless an agarmedium is being used.
Use sterile forceps for all manipulationsof absorbent pads and membrane filters.Forceps sterilityis maintained by,storing the working tips in about 1 inchof methanol or ethanol. Because thealcohol deteriorates the .filter, dissipateit by burning before-using the forceps.Avoid heating the forceps in the burneras hot metal chars the filter.
*When an agar medium is used, absorbents pads are not used. The amount ot medium should besufficient to make a layer approximately 0.3 cm (1 /Finch) deep in the culture container. In the'56 ram plastic culture containers this corresponds to approximately 6-8 ml of culture medium:
lylention of commercial products and manufacturers does not imply endorsement by theOffice Of Water Programs, Environmental protection Agency.
W. BA.mem. 86. 2. 81 264
-249 .
L
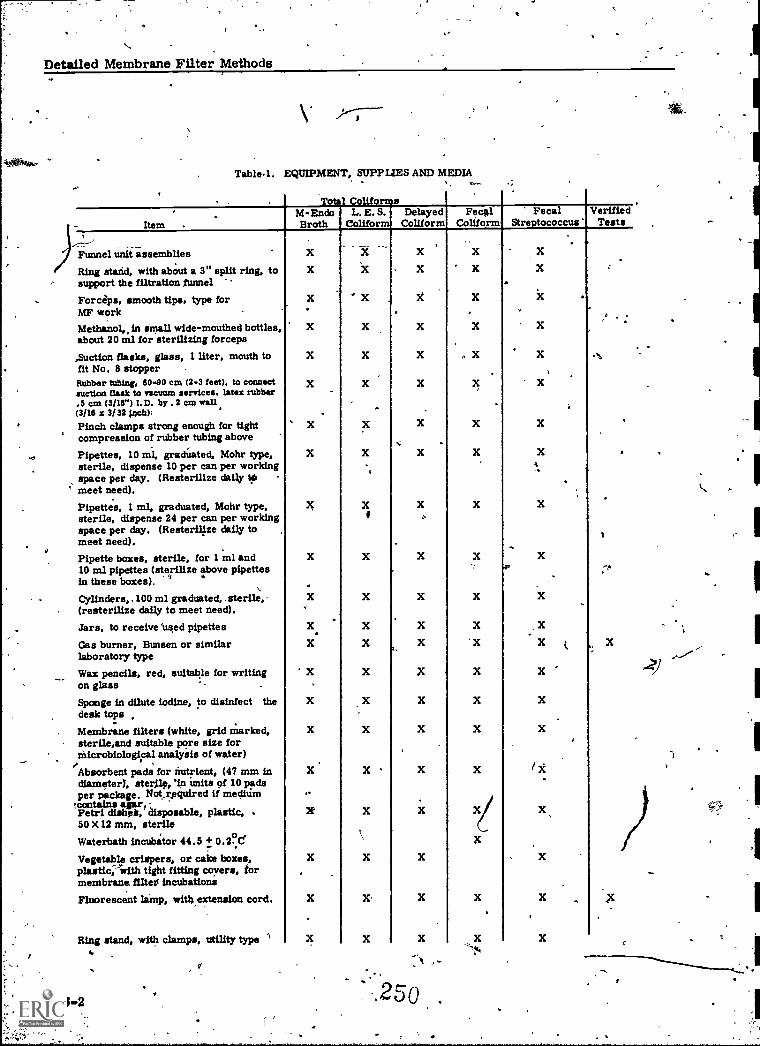
Detailed Membrane Filter Methods
Table. l. EQUIPMENT, SUPPLIES AND MEDIA
Item .
}------'Funnel el unit assemblies
Ring stand, with about a 3" split ring, tosupport the filtration funnelForceps, smooth tips, type forMF workMethanol., in small wide-mouthed bottles,about 20 ml for sterilizing forceps:Suction flasks, glass, 1 liter, mouth tofit No. 8 stopperRubber tubing, eo.bao cm (2-3 feet). to connectsuction flask to vacuum services. latex rubber.5 cm (3/16") I. D. by .2 cm wall(3/16 z 3/32 tocb):Pinch clamps strong enough for tightcompression of rubber tubing above
Pipettes, 10 ml, gradUated, Mohr type,sterile, dispense 10 per can per workingspace per day. (Resterilize daily tb
' meet need).Pipettes, 1 ml, graduated, Mohr type,sterile, dispense 24 per can per workingspace per day. (Resterilize daily tomeet need).
ta,1 ColifL. E. S. Delayed
Colifor ColUormM-EndoBroth
FecslColiform
FecalStreptococcus
VerifiedTests
Pipette boxes, sterile, for 1 ml and10 ml pipettes (sterilize above pipettes
$in these boxes).
Cylinders .100 ml graduated, . sterile,(resterili;e daily to meet need).Jars, to receive used pipettesGas burner, Bunsen or similarlaboratory typeWax pencils, red, suitable for writingon glassSponge in dilute iodine, to disinfect thedesk tops
Membrane filters (white, grid marked,sterile,and suitable pore size forMicrobiological analysis of water)
Absorbent pads for nutrient, (47 mm indiameter), Merge, 'in writs of 10 padsper package. Not,required if medium
!contains nor.Petri disheis, disposable, plastic, .50 X 12 mm, sterile
Waterbath incubator 44.5 -1; 0.2°C.
Vegetable crispers, or cake boxes,plastic,' with tight fitting covers, formembrane tine incubationsFluorescent lamp, wits extension cord.
Ring stand, with clamps, utility type
X -X X
X X X
X X
X
X
X
.x
X X
. X
2C
X
X
X
X
X
X
'X
X
X
X
X
X
op
X
X
X
X4
X
X
%
X
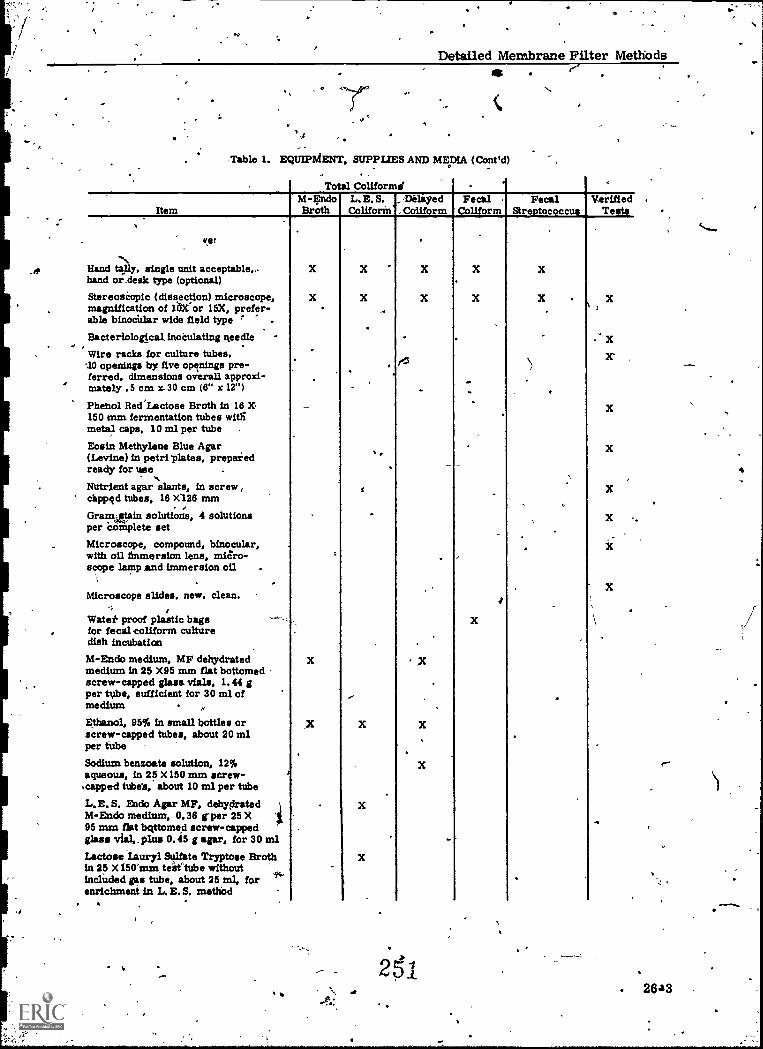
Detailed Membrane Filter Methods
-"r
, Table 1. EQUIPMENT, SUPPLIES AND MEDIA (Cont'd)
Total Coliformd
ItemM-EndoBroth
Hand 41,1y. single unit acceptable..hand or-desk type (optional)
Stereoscopic (dissection) microscope,magnification of 1or 15X, prefer-able binocklar wide field type .
Bacteriological inoculating needle
Wire racks for culture tubes.10 openings by five openings pre-ferred. dimensions overall approxi-mately .5 cm z 30 cm (6" x 12")
Phenol Red'Lactose Broth in 16 X150 mm fermentation tubes witlimetal caps, 10 ml per tube .
Eosin Methylene Blue Agar(Levine) in petri 'plates, prepaXedready for useNutrient agar slants, in screw,clapped tubes, 16 X'126 mm
GramAtain solutions, 4 solutionsper Complete setMicroscope, compound, binocular,with oil (immersion lens, micro-scope lamp and immersion oil .
Microscope slides. new, clean.
Watef proof plastic bagsfor fectlcoliform culturedish incubation
M-Endo medium, MF dehydratedmedium in 25 X95 mm flat bottomedscrew-capped glass, vials, 1.44 gper tube, sufficient for 30 ml ofmedium ,Ethanol, 95% in small bottles orscrew-capped tubes, about 20 mlper tubeSodium benzoate solution, 12%aqueous, in 25 X150 nun screw-.capped tubet, about 10 ml per tubeL.E. S. Endo Agar MF, dehydratedM-Endo medium, 0.36 (per 25 X95 mm flat bqttome,d screw-cappedglass visl,. plus 0.45 g agar, for 30 mlLactose Lauryl Sulfate Tryptose Brothin 25 X 150'mm, teitlube without!winded gas tube, about 25 ml, forenrichment in L. E. S. method
.1
X
X
X
X
L. E. S.Coliforia
X
X
X
DelayedColiform
FecalColiform
FecalStreptococCUIS
VerifiedTeIts
X
X
' X
X
X
X
X
X X
2643

Y.
Detailed Membrane Filter Methdds
Table 1. EQUIPMENT, SUPPLIES AND MEDIA (COntida
Total Conforms
Item
M-FC Broth for fecal conform,dehydrated medium in 25 X95 mmflat bottomed screW-Apped glassvials, 1.11 g per tube, sufficientfor 90 ml of culture medium
Rosolic acid. 1% solution, in0.214 NaOH, in 25 X150 mm flatbottomed screw-capped tubes,about 5 ml per tube, freshlyprepared
KF Agar. dehydrated medium in 25 X 150 mmscrew-capped tubes, sufficient for '30 ml, 2.3gper tube
M-EndoBroth
Dilution bottles, 180 ml. preferable .
boro-silicate glass, with screw-cap for rubber stopper protectedby paper), each containing 99 mlof sterile phosphate-buffereddistilled waterElectric hot plate surfaceBeakers, 400 - 600 ml (for water -bath in preparatiop of membranefilter culture media)Crucible tongs, to be used atelectric hot plates, for removalof hot tubes of culture media forboiling waterbath
26-4
X
X
X .#
E. S.
. .
X
X
DelayedConform
FecalConform
FecalStreptococcus
VerifiedTest
X
X
X
X
X
X
X
X
252
am
-y
*5
6 Deliver enough culture medium tosaturate each absorbent pad, usinga sterile pipette.
Exact quantities cannot be stated -00-because pads and culture containers vary.Sufficient medium should be applied sothat when the culture container is tipped,a good-sized drop of culture. mediumfreely drains cut of the absorbent pad.
7 Organize supplies and equipment forconvenient sample filtration. In .
training courses, laboratory instructorswill suggest useful arrangements;eventually the indiVidual will select asysfem of bench-top organization mostsuited to his own needs. The importantpoint in'any arrangement is to have allneeded equipment and supplies con-veniently at` hand, in such a pattern asto minimize lost time in useless motions.
8 Lay a sterile membrane filter on thefilter holder, grid-side.up,, centeredover. the porous part of the filtersupport plate.
Membrane filters are extremelydelicate and easily damaged. For
'manipulation, the sterile forcepsshould always grasp the outer part
4 of the filter disk, outside the partof the filter through which the samplepasses. .
9 Attach the funnel element to the baseof the filtration unit.
To avoid damage to the membranefilterd4ocking forces should only be-applielf at the locking arrangement.The funnel element never should beturned or twisted while being seated,and locked to the lower element of thefilter holding unit. Filter holding unitsfeaturing a bayonet joint and locking,ring to join the upper element to thelower element require Special care otV,tt,:.the part of the operator.'The lockingring should e turned sufficiently to
. _give imag f , but shOuld not betightened exc ssively.
Detailed Membrane Filter Methods
-10 Shake the sample thoroughly.
11 Measure sample into the funnel withvacuum turned off.
The primary objectives here are:1) accurate measurement of sample;and 2) optimum distribution of colonieson the filter after incubation. 'Tomeet these objectives, methods ormeasurement and dispensation to thefiltration assembly are varied with'different sample filtration volumes.
a With samples greater than 20 ml,measure the sample with a sterilegraduated cylinder and pour it intothe funnel. It is important to rinsethis graduate with-sterile buffereddistilled water to preclude the lossof excessive sample volum isshould be poured into the funnel.
b With samp s of 10 ml to 20 ml,measure the sample with a sterile10 ml or 20.m1 pipette, and pipetteon a dry membrane in the filtrationassembly.
c With samples of 2eml to 10 ml, pourabout 20 ml pf sterile dilution waterinto the filtration assembly, thenmeasure the sample into the sterilebuffered dilution water with a 10 mlsterile pipette.
d Withisamples of 0.5 to 2 ml, pourabout 20 ml of sterile dilution waterinto the funnel assembly, thenmea,sure the sample into the steriledilution water in the funnel with a1 ml or.a 2 ml pipette.
e If a sample of less than 0.5 ml is tobe filtered, prepare appropriatedilutions in sterile dilution Water,and proceed as applicable in item cor d above. .tz
When dilutions of samples are needed,always make the filtrations as soonas possible after dilution of thesample; this never should exceed
NOTE:. Mentiori of commercial products and manufacturers does not imply endorsement--by the Office of Water Programs,, Envronmental Protection Agency.
26-5
Detailed Membrane Filter MethodJ
30 minutes. Always shake sampledilutions thoroughly before deliveringmeasured volumes.
12 Turn on the vacuum.
-Open the appropriate spring clamp orvalve, and filter the sample.
After sample filtration' a few dropletdof sample usually remain adhered, tothe ftinne). walls. Unless theie dropletsare removed, the bacteria contained inthem will be a source of contaminationof later samples. (In laboratorypractice the funnel unit is not routinelysterilized between successive filtrationsof a series):., The purpose of the funnelrinse is to flush all droplets of a samplefret the funnel walls to the membranefilter. Extensive tests have shown thatwith proper rinsing technique, bacterialretention on the funnel walls is negligible.
13 Rinse the sample through the filter.
After,all the sample has paissed'throughthe membrane filter, .rinse down thesides of the funnel walls with at least20 ml of sterile dilution water. Repeatthe rinse twice after all the first- rinse°had passed4hrough the filter. Cut offsuction on the-filtration-assembly.
,14 Rem ove the funnel element of the filterholding unit.
If a ring stand with split ring is) used,hang thefunnel element on the ring;
o otherwise, place the inverted funnelelement on the inner surface of thewrapping material. This requirescare-in opening the sterilized package,
_ but it is effective'as a protection of thefunneLring from contamination.
15- Take the membrane Wier frpm-tbe.filter holder and carefully place it,grid-side up on the medium. ;
-`4***".
Check thatno air bubbles havebeentrapped hitween the membrane filterand,:the underlying absorbent pad oragar. Relay the membrane if necessary.
, .
26,6
16 ,Placein Incubator after finishingfiltration'series.
Invert the containers. The hilme$1iateatmosphere of the inculaating membranefilter must be at:or irery.near 100%
_ relative humidity:
17 Count, colonies which have appearedEater incubating for the prescribed:time.
.A stereoscopic microscope magnifying10 -15 times and careful illuminationgive best counts. ,
,
For reporting results, the computation
4
bacteria/100 ml =
No. colonies counted X100Sample volume filtered in ml.
O
254
Example:
A total of 36 colonies grew afterfiltering a 10 ml sample. Thenumber reported is:
36 colonies10 m X 100 = 360 per 100 ml
Repdrt results to two significant figures.
Example:
'A tota l of 40 colonies grew afterfiltering a 3 ml. sample: =
This calculation gives:
;40 colonies_
3X 100= 1333. 33 per 100 nil.ml.
But the number reported should be .'1300 per1004ral.
,
1
Mir
II MF LABORATORY TESTS FORCOLIFORM GROUP
A Standard Coliform Test (Based on M-EndoBroth MF)
1 Culture medium
a M-Endo Broth- MF Difco 0749-02or the equivalent BBL M-Coliform-Broth 01-494
Preparation pf Culture Medium. (M-Endo Broth) for Standard MF
Coliform Test
tl
Yeast extractCasitone or equivalent .Thiopeptone or equivalentTryptoseLactose :
1.5 g5.0 g5.0
1Q.0 g.12.5 g
oLSodiunt desoxycholate 0.1 gDipotassitita phosphate 4:375 gMonopotassium phosphate 1.375 gSodium chloritde 5.0 gSodiutfi lauryl sulfate 0.05. gBasic fuchsin (bacteriological) 1.05 g
2.1 grSodium sulfite. .
Distilled,watet (containing. 20.0 ml ethanol)
S
a . $
1000 ml
.
This medium is available in.dehydrated form and it is rec-ommended that the commerciallyavailable medium be usediinpreference to compounding themedium of its individual constituents.
TO preparethe"medium for use,suspend the dehydrated medium atthe rate of 48 grams per liter of,water containing ethyl alcohol atthe rate of 20 ml per Mei.'
As a time-saving convenience, it isrecommended that the laboratbryworker preweigh the dehydratedmedium in closed tubes for severaldays, or even weeks, atone operation.
Detailed Membrane Filter Methods
With this system, 'a large numberof increments of dehydrated medium(e. g., 1.44 grams), sufficient forsome convenient (e. g., 30ml)vOlume-of finished culture mediumare weighed aid dispensed intoscrew- capped Culture tubes, andstored until needed. Storage should -
preferably be in a darkened disiccator.
A supply of distilled water containing20 ml stock ethanol per liter can bemaintained.
When the medium is to be used, it .
is reconstituted by adding 30 ml ofthe distilled water - ethanol mixtureper tube of pre-weighed dehydratedculture medium.
b Medium is "sterilized" as directedin I, C.--
c Finished medi can be retainedup to 96. hours if ept in a cal,
. dark place. Man workers preferto reconstitute fresh medium daily:
2 Filtration and incubation proceduresare as given in% D.
Special instructions:
a For counting,. use the wide fieldbinocular dissecting microscope, orsimple lens. For illumination, use,a light source perpendicular tcytheplane-of the membrane filter. Asmall fluorescent lainp is. ideal forthe purpose.
b Coliform colonies have w "metallic"surface sheen under reflected lightwhich may cover the entire colony, or liot
itmay appear only in the center. Non-coliform colonies range fromcolorless to pink, but do not have
-.4 the characteristic sheen.
c _Record the colony counts on thedata sheet, and &impute the conformcount per 100 ml of sample.
2 5 5 --26-7
Detailed Membrane Filter Methods
.4- f
B Standard Coliforin Tests (Based on L. E. S.Endo Agar)
The .distinction of the L.E.S. -count is atwo hi:tut' ezirichnienfincubation on LSTbroth. /it-Endo L. E. S. medium is usedas agar rather than the'broth. .
1 Preparation of culture medium-'-(L. E. S. ^Endo Agar) for L. E. S.coliforin test-
a Formula from McCarthy, Delaney,and Grasso (2)
4
Bacto-Yeast,gxtract 1.2Bacto7Casitone , 3.7 gBacto-Thiopeptone 3.7 g.Bacto-TryptOse gBacto-Lactose 9.4 gDipotassium phosphate gMonopotassium phosphate 1.0' gSodium chloride 3.7 gSodium desoXycholate 0.1 gSodium lauryl sulfate 0.05 gSodium. sulfite 1.6 g.Bacto-Basic fuchsin 0.8 gAgar 15 g
Distilled water (containing20 nil ethyl,a1Conol)ca
1000 ml
.
b To rehydrate the inddium, suspend51 grams'in the water - .ethyl alcohol
s solution.
c Medium is "sterilized" as directedin I,, C.
d Pour 4-8,,m1 of freshly prepared Agarintothe-i3maller half othe container.Allow the medium to cool and solidify.
2 Procedures for filtration and incubation
a Lay out the culture dishes in a rowor series of rowSlissusual. Placethese with the alppeirlli'd) or topside_ down.
b Place one sterile absorbent pad inthe larger half of each container(lid). Use sterile iiir%eps for all"
284
manipulations of the pads.(Agar occupies smaller half orbottom).
c Using a sterile pipette, deliverenough single strength' laurylsulfate tryptose broth to saturatethe pad only. `Avoid excess medium.
d Follow general procedures forfiltering in I, D. Place filters onpad with lauryl sulfate' tryptose
. .broth.
'e Upon conipletion f the filtrations,invert the containers andincubate at 350C or 1 1/2 to 2hours.
3 2-hour procedures
a Transfer the membrane filter fromisthe enrichment pad in the upper half.to the agar medium in the lowerhalf of the container. Carefully ,
roll the membrane onto the agarsurface to avoid trapping airbubbles beneath the membrane.
b Removal, of the used-absorbentpad, is optional.
c Th4...container is inverted andincubated 22 hours -1:2 hours + 0.5 C.
4 Counting procedures are as in I, D.
5 L.E. S. Endo Agar may be used as asingle-stage medium (no enrichmentstep) in the same manner as M-EndoBroth, MF.
C Delayed Incubation Coliform Test
This technique is applicable in situations ,
Where there is an excestiive delay betweensample collection and plating. The procedureis unnecessary when the interval be-tween sample collection and plating iswithin acceptable
Preparation of culture media fordelayed incubation conform test
a Preservative media *Aikido Broth-base .

Detailed Membrane Filter Methods
To 36: ralrof M-Endo Broth MFprepared in accordance withdirections in .II, A, 1 of thisoutline, add 1.0 ml of p. sterile.121/0 aqueous solution of sodiumbenzoate.
L. E. S. MF Holding Medium-Conform: Dissolve 12.7 grams in1 liter of distilled water. Noheating - is necessau. Final pH
7.1 0.1.. This medium containssodium benzoate.
b Growth media
M-Endo Broth MF is used, preparedas described in II, A, 1 earlier inthis outline. Alternately, L. E. S.Endo Medium may be used.
2 General filtration followed is in I, D.
Special procedures are:
a Transfer the membtan'e finer . fromth-eiltration apparatus to a padsaturated with benzoated M-Endo
.Broth.
Close the culture dishes and-ho.1in a container at ambient temperature.This may be 'mailed or transportedto a central laboratory. The mailingor transporting tube should contain
--accurate transmittal data sheets whichcorrespo to properly-labeled-
b-
Transportat n time, in the case ofmailed con iners, should not eXcqedthree days the time of receptionby the testin laboratory.
c. On receipt in the central laboratory,unpack mailing carton, and lay outthe culture containers on the labora-tory bench.
d Remove the tops from the oulture''containers. Using sterile forceps;remove each membrane and itsabsorber, pad to the other half Of -
the culture container.
e With a sterile pipette or sterileabsorbent pad, remove preservativemedium from the culture container
f Place a sterile absorbent pad ineach culture container, and deliverenough freshly prepared M- EndoBroth to saturate each pad.
op
g Using sterile forceps, transfer the .membrane to the new absorbent padcontaining M-Endo Broth., Placethe membrane carefully to avoidentrapment of, air between themembrane-and the underlyingabsorbent pad. Discard theabsorbent pad containing pre--)servative medium.
h After incubation of 20 + 2 hoursat 356 C, colmt colonies as in theabove. section A, 2.
i If L. E. S.: Endo Agar is used, thesteps beginning with (e) above areomitted; and the membrane filter isremoved from the preservativemediuni and transferred to a reshculture contiiner with-L. E. EndoAgar, Incubated, and c escounted in the usual
D Verified Membrane Filter ColifOrm Test
This procedure applies to identificationof colonies growing on:Endo-type mediaused for determination of total coliformcounts. Isolates from thebe colonies arestudidfOr-ga-s-prOduetiontoseand typical coliform morphology. Ineffect, the procedili." e corresponds withthe Completed Test stage of the multiplefermentation tube 'test for coliforms.
Procedure:
25 7
1 Select a membrane filter, bearing .
severalcolonies. ,-
2 Using Sterile techilktie, piddle].colonies in:a selected area with theinoculation needle, making transfersinto tubes of phenol red lactose broth(or lau,ryl sulfate tryptoselactos4
26 -9

7."
Detailed Mebrane Filter Methods
t. . t
brothY. Using an appropriate data/sheet,resordthe interpretation ofeach colony, using, for instance,",,,,,C" for colonies having the typical-d6roi and sheen of conforms; "NC"for colonies not conforiAing toconform colony appearance onEndotype media., ..
3 Incubate the broth tubes at 350 C+ 0.5(.)C. 't
4 At 24 hours: t
a Read and record the results ffomthe lactoip broth fermentation tubes.The followirig code is suggested: .
. acie0 No Indication of acid or gas
production, either with orwithout evidence of growth.
A Evidence of acid but not gas -(applies only when a pH indicatoris included in the broth medium)
Growth with proddc4tion of gas.If pH indicator is used, usesymbol AG to show evidence of.acid.. Gas in any quantity is a ,-positive test.
b Tubed not showing gas productiOn arereturned to thd 350C incubator.
c Gas-positi(re tubes are transferredas follows:
1) Prepare a. streak inoculation on.EMB agar' for colonifii3olhAon;.,inclusing the same culture.
2) Inoculate a nutrient agar slant.1
3) Incubate the EMB agar plates andslants at 350Q + 0.5°c. ."
5. At 48 hours:
a Read and record results of lactose''broth tubes which were negative at24 hours and were returned forfurther incubation.,
b Gas-positive cultures are subjectedto further transfers as in 4c.Gas-riegative cultures are discardedwithout further study; they are 'conform- negative.
c Examine the culturesto EMB agar plates and to nutrientagar slants, as followsi-
s° "
1) Examine the EMB agar plate forevidende of purity of culture; ifthe culture represents'irlore thanone colony type, discard thenutrient agar culture andlreisolateeach of the representative colonialtypes on the EMB plate and resumeas with 4t for each isolation.If purity of culture appears evident,
"'continue with c (2) below.9
2) Prepare a smear and Gram 'stainfrom each nutrientagar slantculture. The Gram stain shouldbe made on a culture not morethan 24 hours old. gxernine,underoil immersion fol typical colifoi-mmorphology, andrecord results.
6 At 72 hours:
Perform procedures described in 5,cabove, and record results.
7 Conform coloniesare consideredverified if the procedures- demonstratea pure-Ent tore of bacteria which aregram negative nonspore-forming rodsand produce gas from lacthse at 350 Cwithin 48 hours.
E Fecal Coliform Count (Based on M-FCBroth Base)
.,.
The count depends upon growth on at.special medium at 44.5 4. Q. 2°C".
1 Preparation of Culture Medium(M-FC Broth Base) for FecalColiform Court
1.*

,
o
Detailed Membrane Filter Methods
a Composition
Tryptose .Proteose Peptone No.Yeast extractSodium chloride.LactoseBile salt's No. 3.Roso is acid* (Allied
Chemical)Aniline. blue (Allied Cheirlina.1)
10. 0 g3 , 5.0 g
g5.Q g12.5g,1.5kg4'0.0 ml
Q.1 g
Digilled water 1000 ml
0
b To prepare the medium dissolve37.1 granis inEr liter of distilledwater whiCh contains 10,ml of 1%rosolic acid.(prepared in 0.2 NNaOH).
Fresh solutions of rosOlid acid givebest tesults. Discard solutionswhich have changed from dark reds .to orange.,
-
To sterilize, heat to boiling asdirected I, Q.
6 ,cd Prepared medium may be retained
up lo 4 days in the dark at 2-80 C.
2 Sp4ial supplies- : 4;,- , "?'
,. . 4 f '.. 0
Small water proof.pladtic sacks capable.bf being sealedagainst water with -
scape.okity 4f,3 .to 6 dulture f..Rnittixteri.. ,,.. .
. 3 Filtration procedures are as given` i-i; D. ..
.4 -- .W. -` k.
.
Filter membranes for fecal coliforrncounts consecutively and immediately ,place them in their culthre.containers.Insert as many as six culture containersall oriented in the same way (i e.; allgrid sides facing. the same direction) -1
'.nto the sacks and seal. Tear off theperforated top, .grasp the side wires,and twirl the sack to roll the open endinside the fold of sack. Then submergethe sacks with culture containers in-verteg beneath the surface of a 44.5+ 0.2 C water
ssi 13 Incubate for 22 + hours. -
5 Counting piocedures
IISExamine and counrcolonies as folloWs:
b. Use a wide field binocular dissectipg'microscope, with 5.- 3.0X magnification.
b Low angle -liglifing from the side isa:vantageous.
:. r
co.vFecal coliforni colonies are blue,
a generally':1-3 niriin- diameter.. ,. , .. .
d 4e6Ord the colony counts on the , F-
':.' Elate sheet, and report the fecal%0. t°?Coliform coupt per 100'ml of sample.
.4-41 ' ' II,. D,' 17 illustrates method)-....7,, L
`,NESTS FOft *FECA L-STAEPTOCOCCA-LGROUP'-4M43311ANE.FICTgi METHOD /
r.
:4 A 48 hour incubation period on a choice oftwo different media, giving higheelectiVity
4 Elevateff temperature kncuBatio1:1i' , 1 for fecal streptodocci, .-are the 'distinctive
sfs., ..r sex_ `.., e . 0 features Of the tests..
a <Plaa:fecal coliform c - - 4
banes' at 44.5 + 0.2°t as y ...--
afieppasibie.,' ; . ;
,r ,,, 4,-. , .;= .../...P.
a
*Prepare
0
4
, Q
.3,
'4
4. . ,..i - . ) .. ... . . ..-.. , .
1% soliiObn,of nisolte acid in 6.'2' N Nu I. This dye is `practically insoluble in4vater. . .
fo ".. ...
59 ,
( .
..,....:..; ..
t
. it.
.
ti

;
Dtailed Membran,e FilferNethods
A 'Test for Members Of Fecal StreptococcalGroup based on KF -Agar
1 Preparation of the Culture medium
Formula; (The dehydrated-formulaof Bacto 0406 is shown, butequivalent constituents from othersources are acceptable). Formulais in grams per liter of reconstitutedMedium,
a
, Bacto proteose. peptone #3 , 10.0Bacth yeast extract 10.0Sodium chloride (reagent grade) 5.0Sodium glycerphosphate , 10.0Maltose (CP) 20.0Lactose (CP) 1; 0Sodium azide (Eastman) 0.4 g ,Sodium carbonate r 0.636 g
(Na CO2
reagent grade), I,Brom cresol purple 0.015 g
(water soluble)Bacto agar / 20.0 g
/ .. ,.i /
g
gg
b Reagent
2, $, 5 -4nyl tetrazoliumclaOride nt (TPt C)
This reagent is prepared by maki'ga- 1%-aqueous solution of the abovechemical passing it through a Seitzfilter or membrane filter. It canbe kept in the refrigeratorlin a,screw-capped tube until used.
c The dehydrated raediumdescribedsa' Wove, is prepared for laboratory
/- use as follotO:.
Suspend 7.64*granis Of the dehydrated
medium In 100 ell of distilled waterin a flask with an aluminum foil
-;cover, .
Place the flask in a boiling water-bath, melt the dehydrated medium,and feat% in the boiling yiaterbathan addional 5 ininutes.
Cool the °medium /t,o, 500 -600 C, add,1.0 ml of the TPTC reagent, and
For membrane filteritstudies, pour3-8 ml in each 50 mm glass orplastic culture dish or enough tomake a layer approximately 1/8"thick. Be sure to pour plates beforeagar tools apd
B
, 2
For plate counts, Our as for standard,agar plate counts.
NOTE: Plastic dishes containingmedia may be stored .in a dark, cool_plaCe up"to 30 days without changein productivity of the medium, pro-vided that no dehydration occurs.Plastic disheS may be incubated inan orillnary air incubator. Glass.dishes must be incubated in an
' atmosphere with saturated hUmidity., .
'2 Apparatus, and materials as given inTable 1.
.
.General procedure is as given in I. _
. ,
Special inErtryCtions k
a Incubate 48 hours, inverted with100% relative humidity afterfiltration. .
. ,
b After incubation, remove the.. cultures fromthe incubator, and,
d . count colonies under wide fieldbinocular dissecting microscope,with magnification set at 10X or20X. Fecal streptococcus coloniesare pale pink to dalk wine-color.-In size they ge froni barely
* visible pproximately 2mm indiame Colorless colonies areriot counted. .,.
__.
c 'Report fecal 4reptococcus count'per 100 ml of sample. :. This is-computed as follows:
No. fecal streptococci per 100 ml =
No. fecal strepthcoccus colonieS X100Sample filtration volume in ml
0
.

z
B Verifi': ion of Streptococcus Colonies
4
erification of colony identification ,
may be required iniwaters containinglarge numbers, of Micrococcusforga-nismi. This has 17.7='particularly with bathing waters, butthe problem is by no means limited tosuch waters.
.
2. A verificatiori procedure is describedin "Standard Methods for the Examinationof Water and Wastewater;' 14thed5;
Shoulduse .
this reference for the step-by.-step procedure.
IV PROdEDURES FOR USE OF MEMBRANEFILTER FIELD UNITS
IA 0144re Media
1- The standard coliform media used withlaboratory tests are used.
2 To simplify field operations, it"21 suggested2that the medium be sent to
the field, preweighed,. in vials orcapped culture tubes: The medium
..- then requires only the'addition of asuitable volume of distilled water- 4.ethanol prior to sterilization.
3 `Sterilization, procedures in the fieldare theisame as for laboratory methods:
n.T)Oratory preparatiOn of the In dia,ready for Use, would be permissible
_provided that the required limitationson time and conditions of storage areMet
-Operation of Millipore, Water: Testing.Bacteriological .
/1 Supporting supplies and equipment are
the same as for tbi iiiioratoryproceduz:es.
2.6,Set the incubator voltage selectorswitch to thevoltage of the availablesupply, turn on the u&t.andadjust esnecessary to establish opeilatinv-incubatOr temperature at 35 + 0.50 C.
Detailed Membrane Filter Methdds
3 Sterilize the funnel unit assembly byexposure to formaldehyde-6r byimmersion in boiling water. If alaboratory autoclave is available, thisis preferred.
Formaldehyde is produced by soakingatrasbestos ring (in the funnel base)with methanol, ighiting, and after afew seconds of burning, closing theunit by placing the stainless steelflask over the funnel and base. Thisresults inincomplete combustion ofthe methanol, whereby formaldehydeis producetf. Leave the unit closedfor '15 minutes to allow adequateexposure to formaldehyde. ;
PVtration and incubation procedurescorrespond with laboratdry.methods.
5 The unit is supplied with a bookletcontaining detailed step-by-stepoperational procedures. The workerusing the equipment should becomecompletely versed in its contents andapplication.
C Other commercially available field kitsshould be Vied according to manu-facturer's instructions. It is emphasized-.that the required standardA of.performanceare'manditory,for field devices as .fo'rlaboratory equipment.
D cloinithig. of Colonigui on Membran4 Filters'
1...
1 Equipment and materials
. Membrane filter cultures to beexamined
Illumination source,,
Simplelens, 2X tO 6X'magrzification,Hand tally (optional) .1
.
. 2 .4"roOeure ,
".a , Remove 'tlie Cultures frotn:ttheincubatorluid"arrange therri in
- numerical-sequence.
7
p

Detailed Merrihrane Filter Methods
b Set up illumination source as thatlight.will originate from-an areaperpendicular to the plane ofmembrane filters being examined.A small fluorescent lamp is idefor the purpose. It is highlydesirable that a simple lens beattached to the light source.
c Examine results. Count all conform.'and noncoliform colonies. Conformand noncoliform colonies. Conform-colonies have a "metallic" surfacesheep .under reflAted whichmay cover the entire colony or mayappear only on the center.NoncolitOrm colonies range umcolorless to pink or red, but do nothave the characteristic "metal-11;Yrsheen.
d Enter the colony counts in the datashdets.
e Enter the colifortn count per 100 mlof sample for each membrane havinga countable number of conformcolonies. Computation is as followl;:
No conform per 100 mr
No. coliform colonies on MVNo. mirmiters sample filtered
REFERENCES.
1 Standard 'Methods for the Examination ofWate'r and Wastewater. APHA, AWWA,
14thrEdition. p19'75.
X100
2 McCarthy, J. A. , pe4ney; J.E. andGrasso, R. J. Measuring Californiain Water: Water and Sewage Works.1961: R-426-31. 196.1.
This outline was prepared by L. Jeter,former Chief, Program Support Trainingbranch, National Training and Operatird=Technology Center, OWPO, tJSEPA,
- Cincinnati, Ohio 45268
Descriptors: Biological Membranes.,'Conforms, Fecal Conforms, FecalStreptococci, Filters, IndiCator Bacteria, .
Laboratory Equipment, Laboratory tests, ,
Membranes, Microbiology, Water Analysis