HYDROGEOLOGY OF HARRISON COUNTY, INDIANA · HYDROGEOLOGY OF HARRISON COUNTY, INDIANA By Gerald A....
39
HYDROGEOLOGY OF HARRISON COUNTY, INDIANA BULLETIN 40 STATE OF INDIANA DEPARTMENT OF NATURAL RESOURCES DIVISION OF WATER 2006
Transcript of HYDROGEOLOGY OF HARRISON COUNTY, INDIANA · HYDROGEOLOGY OF HARRISON COUNTY, INDIANA By Gerald A....
HYDROGEOLOGY OF HARRISON COUNTY, INDIANA BULLETIN 40
STATE OF INDIANA DEPARTMENT OF NATURAL RESOURCES DIVISION OF WATER 2006
HYDROGEOLOGY OF HARRISON COUNTY, INDIANA By Gerald A. Unterreiner STATE OF INDIANA DEPARTMENT OF NATURAL RESOURCES DIVISION OF WATER Bulletin 40
Printed by Authority of the State of Indiana Indianapolis, Indiana: 2006
CONTENTS
Page
Introduction................................................................................................................................ 1
Purpose and Background ........................................................................................................... 1
Climate....................................................................................................................................... 1
Physiography.............................................................................................................................. 4
Bedrock Geology ....................................................................................................................... 5
Bedrock Topography ................................................................................................................. 8
Surficial Geology....................................................................................................................... 8
Karst Hydrology and Springs..................................................................................................... 11
Hydrogeology and Ground Water Availability.......................................................................... 15
Unconsolidated Aquifer Systems................................................................................... 17
Unglaciated Southern Hills and Lowlands Aquifer System .............................. 17
Alluvial, Lacustrine, and Backwater Deposits Aquifer System ........................ 19
Ohio River Outwash Aquifer System ................................................................ 19
Ohio River Outwash Aquifer Subsystem........................................................... 20
Unconsolidated Aquifer Systems Registered Significant Ground-Water
Withdrawal Facilities ........................................................................................ 20
Bedrock Aquifer Systems .............................................................................................. 20
Mississippian -- Buffalo Wallow, Stephensport, and West Baden Groups
Aquifer System .................................................................................................. 23
Mississippian -- Blue River and Sanders Groups Aquifer System.................... 24
Mississippian -- Borden Group Aquifer System................................................ 24
Bedrock Aquifer Systems Registered Significant Ground-Water
Withdrawal Facilities ........................................................................................ 25
Ground Water Levels and Potentiometric Surface .................................................................... 25
Ground Water Quality................................................................................................................ 26
Summary .................................................................................................................................... 29
References Cited ........................................................................................................................ 31
Appendix
Surface Water Quality Data ....................................................................................................... 34

FIGURES
Page
1. Location of Harrison County............................................................................................... 2
2. Harrison County Physiography ........................................................................................... 3
3. Bedrock Geologic Map of Harrison County ....................................................................... 6
4. Bedrock Topography Map of Harrison County .................................................................. 9
5. Harrison County Generalized Cross Section from Southwest to Northeast........................ 10
6. Unconsolidated Deposits Thickness Map of Harrison County ........................................... 12
7. Quaternary Geologic Map of Harrison County................................................................... 13
8. Ground-Water Flow and Dissolution Features of Carbonate Rocks................................... 14
9. Cross Section Illustrating the Underground Capture of Indian Creek ................................ 15
10. Residual Drawdown of a Test Well Screened in Outwash Sand and Gravel ..................... 16
11. Unconsolidated Aquifer Systems Map of Harrison County ............................................... 18
12. Bedrock Aquifer Systems Map of Harrison County........................................................... 22
13. Hydrograph of Observation Well Harrison 8...................................................................... 25
14. Map Showing Composite Ground-Water Level Surface of Harrison County.................... 27
TABLES
1. Normal Monthly Maximum, Minimum, and Mean Temperatures for the Period
1971-2000 ............................................................................................................................ 4
2. Normal Monthly and Annual Precipitation for the Period 1971-2000 and Precipitation
Extremes for the Period 1901-2001 ..................................................................................... 4
3. Stratigraphic Column and Exposed Bedrock Thickness for Harrison County.................... 7
4. Registered Significant Ground-Water Withdrawal Facilities in Harrison County ............. 21
5. Ground Water Chemistry Data and USEPA (2006) Drinking Water Standards for
Constituents Reported.......................................................................................................... 28

INTRODUCTION Harrison County is located in south-central Indiana (Figure 1) and is bounded by Floyd County to the east, Washington County to the north, and Crawford County to the west. It is bordered on the southeast, south, and southwest by the Ohio River. Harrison County covers an area of approximately 485 square miles and had a year 2000 population of 34,325 (U.S. Census Bureau, 2005). The main population center is Corydon (2000 population 2,715), which is the county seat. The next largest towns are Palmyra (2000 population 633) and Lanesville (2000 population 614). Milltown (2000 population 932), which is situated on the Crawford and Harrison county line, had a 2000 Harrison County population of about 400. Ground water availability in Harrison County is highly variable because of the nature of the bedrock and unconsolidated deposits. Reported well yields range from less than 1 gallon per minute (gpm) to 1,000 gpm. The most productive wells are located in the glacial outwash deposits of sand and gravel within the Ohio River valley. The other main sources of ground water in the county are the bedrock aquifers, which are primarily limestone.
PURPOSE AND BACKGROUND
The purpose of this report is to present existing information on the geology, ground-water availability, and ground-water quality of Harrison County. Information came from published and unpublished reports, water well records, and ground-water quality data on file at the Division of Water (DOW). Unpublished reports on the ground-water resources of Harrison County by William J. Steen, retired DOW geologist, and J.D. Hunn of the U.S. Geological Survey were invaluable. A special thanks is owed to Dr. W. Thomas Straw, Ph.D. Indiana University, and professor emeritus Western Michigan University, for a discourse of his Ohio River Valley mapping dissertation (Straw, 1968).
Since 1959, an Indiana state law has required water well drillers to submit to the Division of Water a record, or log, for each well drilled in the state. The well logs provide information on stratigraphy, aquifer zones and depths, ground-water levels, and ground-water availability.
Approximately 1,000 records (670 field-located) of water wells drilled in Harrison County were reviewed for this study. The wells are fairly evenly distributed across the county (Figure 2). The vast majority (over 97%) of the wells were drilled into bedrock. Less than 3% of the wells were completed in unconsolidated materials. The data from the well logs were used to evaluate ground-water availability, ground-water levels, and the direction of ground-water flow.
CLIMATE
Long-term climatic data for Harrison County shown below are based on the Paoli, Indiana weather station (Midwestern Regional Climate Center, 2005). Normal monthly maximum, minimum, and mean temperatures for the period 1971-2000 are listed in Table 1. Air temperatures reach a high point in July with a monthly mean of 75.5 °F and dip to a mean of 28.2 °F in January. Precipitation averages nearly 48 inches per year. Normal monthly and annual precipitation for the period 1971-2000 and precipitation extremes for the period 1901-2001 are listed in Table 2.
1

Figure 1. Location of Harrison County.
2

Figure 2. Harrison County Physiography (adapted from USGS topographic maps and Gray, 2000).
R 3 E R 4 E R 2 E
CCrraawwffoorrdd UUppllaanndd
Norman Upland
BBuucckk CCrreeeekk
IInnddiiaann CCrreeeekk
T 1 S T 2 S
T 3 S
T 4 S
T 5 S
T 6 S
R 5 E
MMiittcchheellll PPllaatteeaauu
MMoossqquuiittoo CCrreeeekk
Ohio River Ohio
River
BBlluuee RRiivveerr
Blue River
3

Table 1. Normal Monthly Maximum, Minimum, and Mean Temperatures for the Period 1971-2000 [values, in degree Fahrenheit (°F); data from the Midwestern Regional Climate Center, 2005]. °F Jan Feb Mar Apr May Jun Jul Aug Sep Oct Nov Dec AnnualMax 37.9 43.8 54.5 65.4 75.2 83.0 87.1 85.4 79.2 68.1 54.9 42.7 64.8 Min 18.4 21.9 31.0 40.4 50.1 59.7 63.8 61.5 52.8 40.1 32.0 22.7 41.2 Mean 28.2 32.9 42.8 52.9 62.7 71.4 75.5 73.5 66.0 54.1 43.5 32.7 53.0 Table 2. Normal Monthly and Annual Precipitation for the Period 1971-2000 and Precipitation Extremes for the Period 1901-2001 (precipitation values are in inches; data from the Midwestern Regional Climate Center, 2005).
Month Normal Maximum Minimum January 3.29 17.38 (1937) 0.57 (1946) February 3.10 8.30 (1908) 0.24 (1947) March 4.37 14.29 (1964) 0.50 (1941) April 4.84 10.69 (1996) 0.88 (1962) May 5.14 12.13 (1927) 0.80 (1914) June 4.19 12.72 (1949) 0.45 (1933) July 4.46 10.69 (1979) 0.20 (1919)
August 4.17 8.83 (1977) 0.51 (1953) September 3.26 10.92 (1996) 0.48 (1960)
October 2.90 13.57 (1919) 0.04 (1908) November 4.22 9.26 (1985) 0.42 (1904) December 3.64 8.19 (1921) 0.35 (1989)
Annual 47.58 63.45 (1950) 25.38 (1901)
PHYSIOGRAPHY
Harrison County lies within the unglaciated region of Indiana (Malott, 1922), and is located within three physiographic provinces (see Figure 2): (1) the Norman Upland extends from the north into a small area in the east-central portion of the county; (2) the Mitchell Plateau (Gray, 2000) includes most of the eastern two-thirds of the county; and (3) the Crawford Upland much of the western one-third. The uplands form an area of small highland flats bordered by steeply dissected hills. The uplands subsequently merge into the undulating terrain of the plateau topography. Elevations in the county range from about 972 feet above mean sea level (msl) near the Norman Upland just south of Floyd County to 375 feet above msl in the Ohio River valley.
In Harrison County, siltstone capped with limestone predominantly underlies the Norman Upland, and its variable resistance to erosion forms an area of rugged topography. The Knobstone Escarpment, a steep slope, outlines the eastern boundary of the Norman Upland. The escarpment can be traced along SR 111 southward (see Figure 1), where steep cliffs rise above the Ohio River floodplain.
4

The Mitchell Plateau in Harrison County includes extensive areas of rolling hills underlain by limestone and large sections of karst including solution valleys, sinkholes, caves, underground drainage, and springs. Generally, the limestone is overlain by red clayey material, or terra rossa. The terra rossa commonly was thought to simply be a residual weathering product of limestone. The formation of terra rossa is evidently more complex and includes material of varied origin (Olson and others, 1980; Merino, 2005; Gray, 2000).
The rugged, dissected highland of the Crawford Upland is underlain by shale, sandstone, and limestone and is bounded along the east by the Springville Escarpment. The soils within these upland areas formed in 0-40 inches of loess over material weathered from either cherty limestone, or clastic rocks (Robbins, 1975).
The surface water drainage of Harrison County lies within the Indiana water-management basin of the Ohio River Basin. Major tributaries to the Ohio River in Harrison County are Blue River, Indian Creek, Buck Creek, and Mosquito Creek. Blue River is the largest stream and its entrenched meanders dictate its flow path. It flows in a sinuous pattern from north to south to its confluence with the Ohio River. The other main streams generally flow in an incised meandering fashion from northeast to southwest. Alluvial soils formed on bottomlands along portions of the major streams and their tributaries. However, in many places, the soil is absent or poorly developed and the streams flow on bedrock. Lacustrine silty clays were deposited in the Ohio River tributary valleys of the Blue River, Indian River, and Buck Creek.
BEDROCK GEOLOGY The rocks that underlie and crop out at the surface in Harrison County (Figure 3) are Mississippian in age (320-360 million years old), and generally dip to the southwest at about 30 feet per mile (Straw, 1968). A thin mantle of soil overlies the bedrock in most of the county. Bedrock exposures are common throughout the county in road cuts, hillsides, and where streams have cut through the unconsolidated materials. The bedrock from east to west, and oldest to youngest, is made up of rocks of the Borden Group, Sanders Group, Blue River Group, West Baden Group, and Stephensport Group (Table 3).
The Borden Group is part of a deltaic complex that accumulated sediments originating from streams flowing southwest from the rising Appalachian Mountains. The Borden Group rocks are composed dominantly of siltstone, shale, and fine-grained sandstone, along with small amounts of discontinuous lenses of limestone (Shaver and others, 1986). In Harrison County, the Borden Group outcrops only in the eastern portion of the county. The clastic rocks form an area of rugged topography and steep bluffs that rise along the Ohio River from Mosquito Creek to the northeast. Younger rocks cover the Borden Group west of their exposure. The thickness of the Borden Group in Harrison County is estimated to average about 500 feet (Amadi, 1981).
The Sanders Group formed in a shallow sea and covers the deltaic complex of the Borden Group disconformably. The Sanders Group is predominantly composed of skeletal limestone. The upper formation is the Salem Limestone, the famous Indiana building stone. The lower part of the Sanders Group contains a mixture of fine-grained limestone and dolomite commonly containing cherty intervals and minor amounts of siltstone and shale. The Sanders Group is estimated to attain a maximum thickness of about 120 feet within its outcrop area (Fenelon and others, 1992).
The Blue River Group rests conformably on the Sanders Group (Shaver and others, 1986) and covers most of the central and more than one-half of the western portions of Harrison County.
5
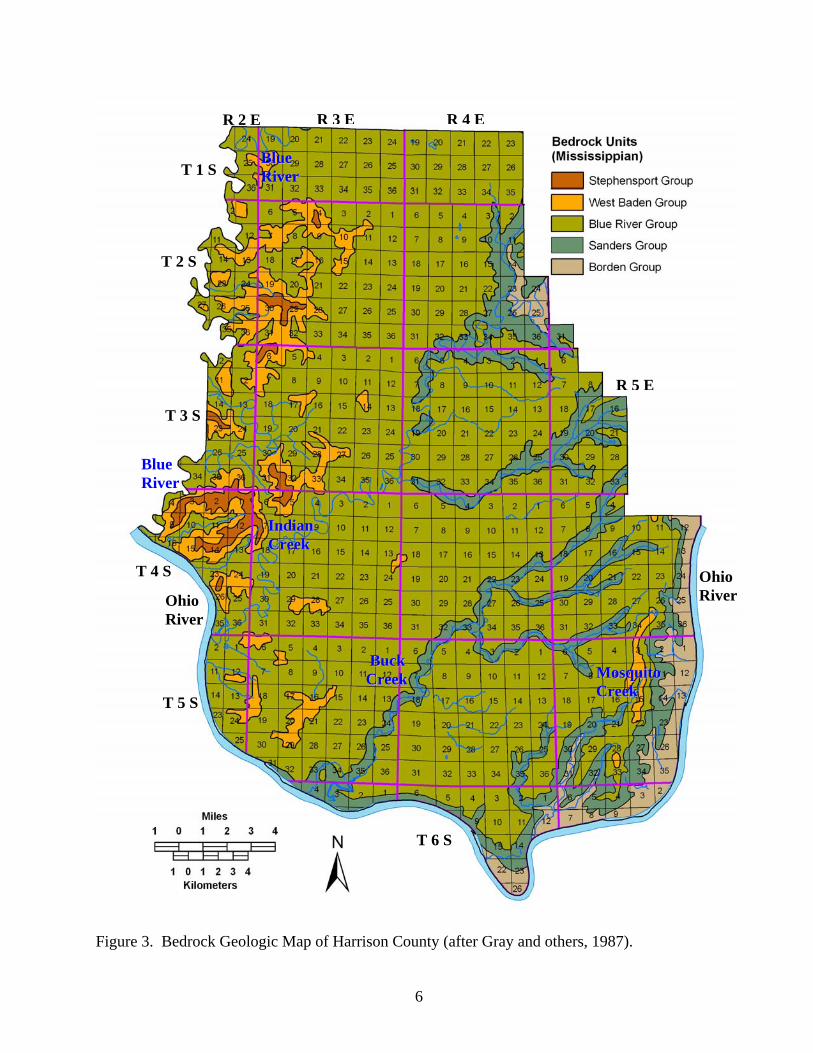
Figure 3. Bedrock Geologic Map of Harrison County (after Gray and others, 1987).
R 3 E R 4 E R 2 E
BBuucckk CCrreeeekk
IInnddiiaann CCrreeeekk
T 1 S T 2 S
T 3 S
T 4 S
T 5 S
T 6 S
R 5 E
MMoossqquuiittoo CCrreeeekk
Ohio River Ohio
River
BBlluuee RRiivveerr
Blue River
6

Table 3. Stratigraphic Column and Exposed Bedrock Thickness for Harrison County*.
Group Formation Member Exposed Thickness
(ft)
Description
Glen Dean Limestone
not noted
skeletal to oolitic to biomicritic limestone
Hardinsburg 35 gray soft carbonaceous shale and very fine grained ripple-bedded sandstone
Haney Limestone
29 skeletal limestone and micritic dolomite
Big Clifty Indian Springs Shale 30 sandstone, gray shale, and mudstone
Stephensport
Beech Creek 11-12 gray skeletal to biomicritic limestone
Elwren 30-33 sandstone, siltstone, and shale Reelsville Limestone
5-7 skeletal limestone
Sample 40 sandstone and shale Beaver Bend Limestone
13-15 gray skeletal to oolitic to biomicritic limestone
West Baden
Bethel 20-60 sandstone, gray clayey shale, and thin beds of coal
Paoli Limestone
Downey’s Bluff Yankeetown Shetlerville
Popcorn
30-35 gray skeletal, micritic, and oolitic limestone, calcareous shale, calcareous sandstone, and dark shale
Ste. Genevieve Limestone
Levias Spar Mountain
Fredonia Lost River Chert Bed
125-175 oolitic, skeletal, micritic, and detrital limestone, with small amounts of shale, dolomite, sandstone, and chert
Blue River
St. Louis Limestone
205-275 micritic, pelletal, and skeletal limestone, thin beds of shale, and silty dolomite
Salem Limestone
Somerset Shale 40-60 thick, cross-bedded fossil-calcarenite, dolomitic silty shale, argillaceous limestone and dolomite
Harrodsburg Limestone
60-75 bioclastic calcarenite and calcirudite, dolomite, shale, and argillaceous limestone
Sanders
Ramp Creek 20-25 dolomite and limestone with small amounts of siltstone and shale
Edwardsville Floyds Knob Limestone
50-55 siltstone, shale, sandstone, and sporadic limestone
Borden
Spickert Knob
240 siltstone, silty shale, some sandstone, and limestone
*After Stockdale (1931), McGrain (1943), and Shaver and others (1986).
7

Micritic, skeletal, and oolitic limestone make up the bulk of the rocks of the Blue River Group (Gray and others, 1987). In Harrison County, the Blue River Group attains a thickness of about 450 feet (Droste and Carpenter, 1990). The Ste. Genevieve Limestone is a thick, upper formation (see Table 3) and an important source of ground water.
The West Baden Group, in Harrison County, overlies the Blue River Group conformably (Shaver and others, 1986), and consists mainly of complexly interbedded shale, sandstone, and micritic and skeletal limestone (Gray and others, 1987). Isolated outcrops of the West Baden Group are found along the northwestern and western parts of Harrison County. Also included in the West Baden Group are scattered deposits of poorly consolidated sand in upland areas of southeastern Harrison County, which were formerly designated the Ohio River Formation (Wayne, 1960). Potter (1969) demonstrated that the Ohio River Formation is a remnant of an extensive channel filling that belongs to the Bethel Formation (Shaver and others, 1986).
The Stephensport Group overlies the West Baden Group conformably in Harrison County (Shaver and others, 1986) and is comprised of a complex of limestone, shale, and cliff-forming sandstone. The combined thickness of the West Baden and Stephensport Groups in the county ranges from 0 where the older Blue River Group rocks are exposed to a maximum of about 115 feet in the western part of the county.
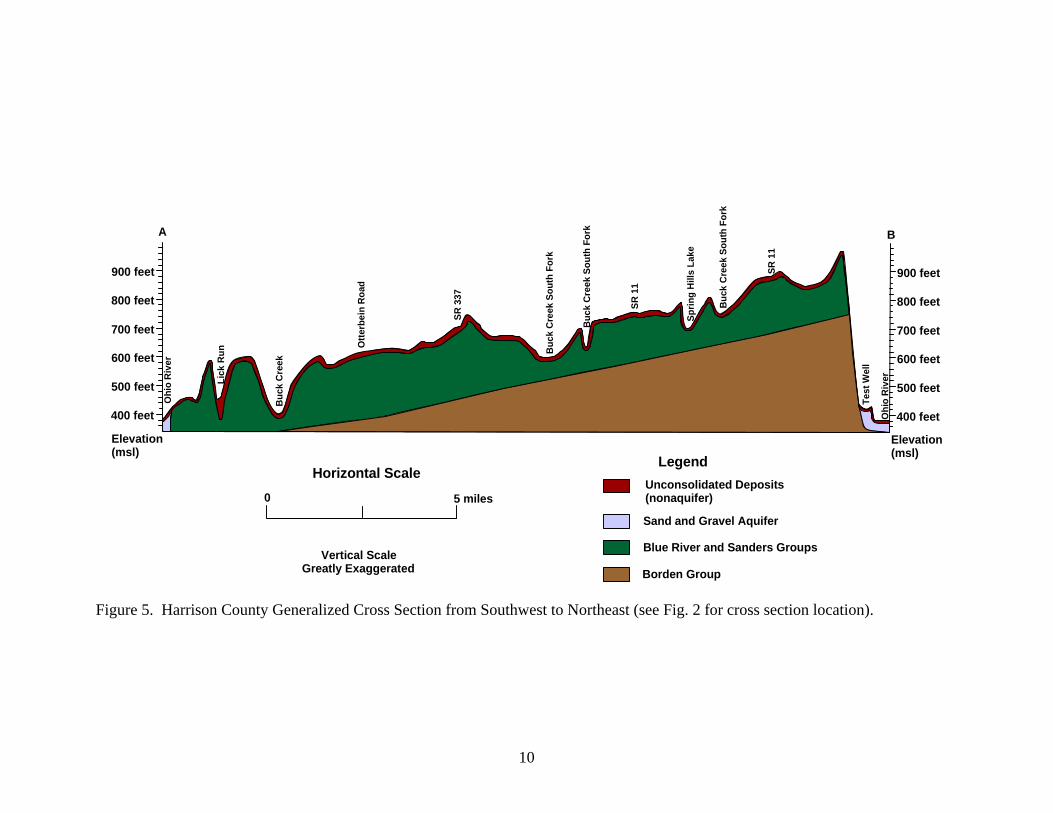
BEDROCK TOPOGRAPHY Bedrock exposures are common throughout Harrison County, although most of the bedrock surface (Figure 4) is covered by a thin layer of unconsolidated material. Bedrock topography closely mimics the surficial topography (see Figure 2) throughout much of the county. The highest bedrock elevations in the county at over 900 feet occur in the northwestern uplands, and also just south of the southern boundary with Floyd County. The lowest bedrock elevations, at about 300 feet, occur in places within the Ohio River Valley. A cross section (Figure 5) shows an example of the variability in bedrock topography within the county.
SURFICIAL GEOLOGY Late Paleozoic and Mesozoic sedimentary units are missing in Harrison County (and the surrounding area) suggesting that a very long interlude of erosion took place (Ray, 1965). Uplift, climate change, and/or world-wide changes in sea level during this interval have been proposed to explain the origin of erosional surfaces located above the present stream valleys (Powell, 1964; Ray, 1965).
The most notable physiographic and hydrogeologic feature in Harrison County is the Ohio River valley. The ancestral or pre-glacial Ohio River probably headed either near Madison, Indiana or on the dip slope of the Knobstone Escarpment (Straw, 1968; Gray and Powell, 1965). The Teays River was likely the principal regional east-west drainage in the Midwest before the Illinoian ice advances. The Teays River system crossed Indiana in a sinuous bedrock valley corridor from Adams County to Benton County (Bruns and Steen, 2003). The valley occupied by the Teays River System is filled with pre-Illinoian, Illinoian, and Wisconsin glacial deposits. The modern Ohio River probably began forming before the Illinoian Stage as southward flowing glaciers disrupted the Teays drainage system and southerly drainage divides were breached.
8
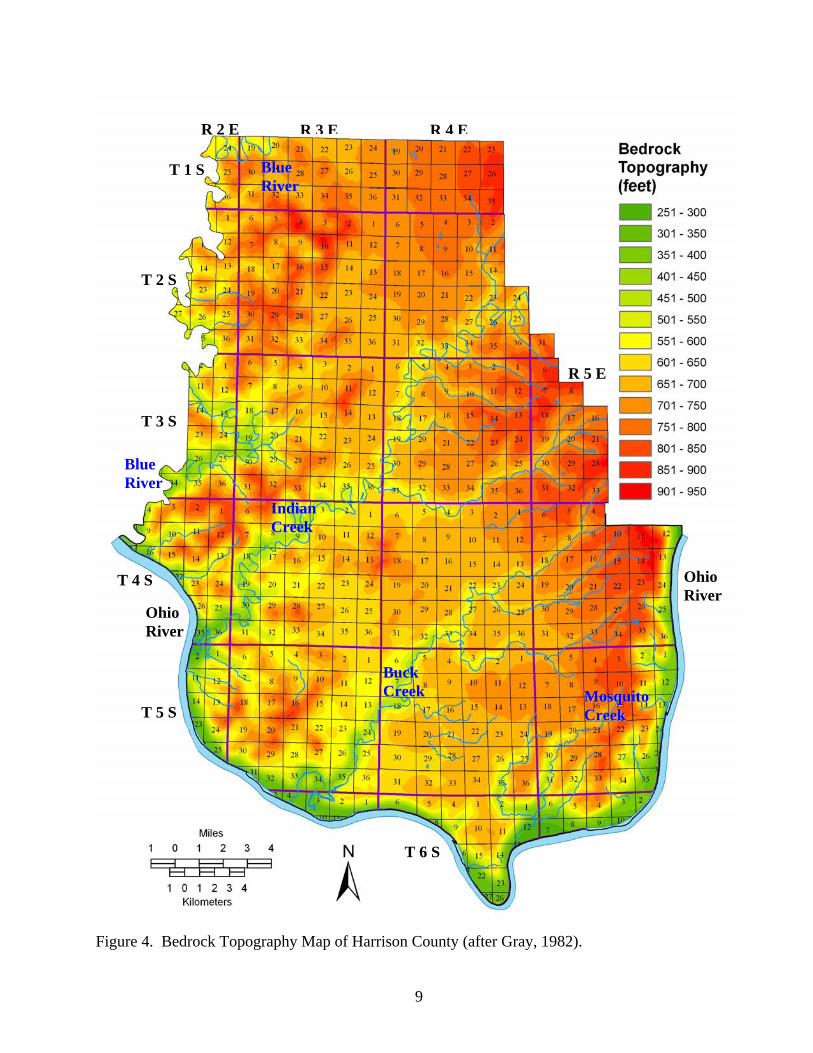
Figure 4. Bedrock Topography Map of Harrison County (after Gray, 1982).
T 4 S
Blue River
T 5 S
T 3 S
T 1 S T 2 S
Ohio River
R 2 E
BBl
9
BBuucckk CCrreeeekk
IInnddiiaann CCr
luuee RRiivve
re
er
ee
r
ek
R 3 E R 4 E
k
T 6 S
R 5 E
MMoossqquuiittoo CCrreeeekk
Ohio River
10
400 feet
500 feet
600 feet
700 feet
800 feet
900 feet
400 feet
500 feet
600 feet
700 feet
800 feet
900 feet
Ohi
o R
iver
Lick
Run
Buc
k C
reek
Otte
rbei
n R
oad
SR 3
37
Buc
k C
reek
Sou
th F
ork
Buc
k C
reek
Sou
th F
ork
SR 1
1
Buc
k C
reek
Sou
th F
ork
SR 1
1
Sprin
g H
ills
Lake
Test
Wel
l
Ohi
o R
iver
A B
LegendHorizontal Scale
0 5 milesUnconsolidated Deposits(nonaquifer)
Sand and Gravel Aquifer
Blue River and Sanders Groups
Borden Group
Elevation(msl)
Elevation(msl)
Vertical ScaleGreatly Exaggerated
Figure 5. Harrison County Generalized Cross Section from Southwest to Northeast (see Fig. 2 for cross section location).
The Ohio River flows in only a portion of its old glacial drainage valley. The maximum downcutting of Pleistocene age is called the “deep stage”, and is associated with the buried deep channel of the Ohio River. Well logs show that the bedrock elevation associated with the deep stage near Mauckport is about 290 feet msl (Straw, 1969).
Harrison County lies within the unglaciated region of Indiana, and its bedrock in places is covered by unconsolidated material, which is collectively called regolith. Most of the bedrock surface is covered by less than 50 feet of regolith (Figure 6). In the north-central section of the county, the regolith attains a thickness up to 100 feet. Along the Ohio River, unconsolidated deposits reach a maximum thickness of up to 150 feet. The unconsolidated deposits include a variety of residual and transported material, and consist of soil, clay, silt, sand, gravel, and fragmented, weathered bedrock (Figure 7).
KARST HYDROLOGY AND SPRINGS
Carbon dioxide from the atmosphere and from the soil is incorporated into precipitation and
can form a mild acid. In humid regions, where carbonate rocks (i.e. limestone) are at or near the surface, the slightly acidic water slowly dissolves the rock over time. As the dissolution process continues, large openings and solution features can form in the rock (Figure 8). The most common types of solution features develop along preexisting fractures, joints, and bedding planes, which represent the initial flow path of the water through the rock. Karst is a type of topography characterized by carbonate solution features; such as, sinkholes (closed depressions on the land surface), sinking streams, underground drainage channels or conduits, caves, and collapsed sinkholes. Artesian and perched springs seep or flow at the surface as the underground drainage emerges.
The near-surface bedrock aquifers in the Mississippian carbonates contain a highly variable fracture pattern, which greatly affects ground-water flow through the bedrock. Fractured rock represents one of the most complex types of hydrogeologic systems known. While regional ground-water flow can be somewhat predictable, local flow can be highly varied in terms of both quantity and direction. Consequently, determining the local direction of ground-water flow in fractured (and dissolved) bedrock at the scale of a specific site may require elaborate instrumentation, monitoring, and dye tracing.
The most extensive karst development in Harrison County occurs in the outcrop area of the Blue River Group, which consists mainly of carbonates with small amounts of shale, sandstone, and chert. Most of the Mitchell Plateau is underlain by Blue River Group carbonates. The Sanders Group has a few isolated sinkholes, generally within the dissected uplands of eastern Harrison County. The majority of the sinkholes or depressions are within the Mitchell Plateau physiographic region, primarily in the central portion of the county, extending from north to south through the towns of Palmyra, Corydon, and Laconia. Typically, above the solid bedrock lie 20 to 50 feet of broken limestone and reddish-brown clay (terra rossa). However, a thickness up to 90 feet has been reported in a few locations in Harrison County. The areas of thickest clays tend to occur on the Mitchell Plateau. Additionally, water well records on file at the Division of Water indicate many caves or mud-filled cavities in this group. The height of the caves may be as much as 15 feet, but are typically 1 to 5 feet. Most of the water wells showing such cavities are also in the same general area as the surface karst features.
11

Figure 6. Unconsolidated Deposits Thickness Map of Harrison County (after Gray, 1983).
R 3 E R 4 E R 2 E
BBuucckk CCrreeeekk
IInnddiiaann CCrreeeekk
T 1 S T 2 S
T 3 S
T 4 S
T 5 S
T 6 S
R 5 E
MMoossqquuiittoo CCrreeeekk
Ohio River
Ohio River
BBlluuee RRiivveerr
Blue River
12
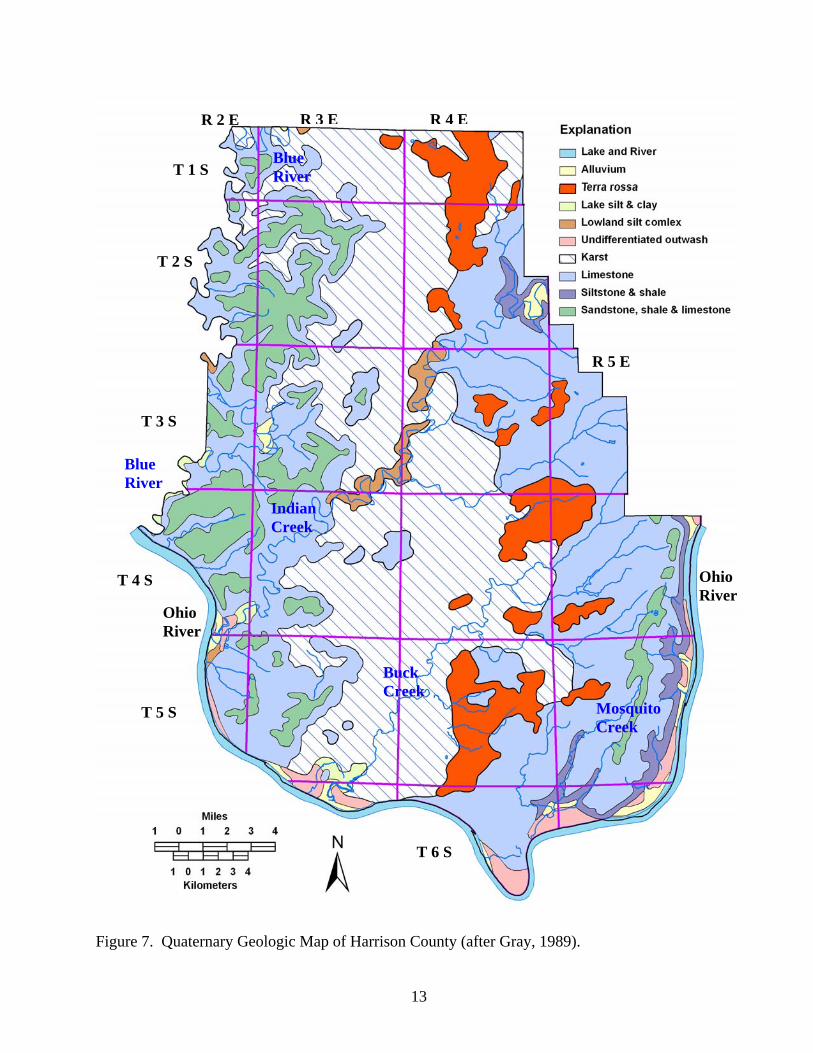
Figure 7. Quaternary Geologic Map of Harrison County (after Gray, 1989).
R 3 E R 4 E R 2 E
BBuucckk CCrreeeekk
IInnddiiaann CCrreeeekk
T 1 S T 2 S
T 3 S
T 4 S
T 5 S
T 6 S
R 5 E
MMoossqquuiittoo CCrreeeekk
Ohio River
Ohio River
BBlluuee RRiivveerr
Blue River
13

Disappearingstream
Bedrock
Zone offracture
concentration
Dep
th (f
eet)
0
50
100
150
Well
BeddingplaneJoint
Joint
Regional drainage direction
Entrenchedstream
Cavespring
Swallowhole
Collapsesinkhole
Sinkhole
Karst topography schematic
The most common solution featuresdevelop in carbonate rocks alongpreexisting fractures, joints, andbedding planes, which representthe initial flow path of the waterthrough the rock.
Whereas regional ground-water flow can besomewhat predictable, local flow can be highlyvaried both in terms of quantity and direction.Determining the local direction of ground-waterflow in fractured and soluble rock may requireelaborate instrumentation, monitoring, and dyetracing.
Solution cavity
Regional potentiometric surface Limestonebedrock
Dry cave
Figure 8. Ground-Water Flow and Dissolution Features of Carbonate Rocks.
14

The surface and subsurface drainage systems are well connected in the widespread highly developed karst region of Harrison County. For example, surface water enters the karst plain in the north central section of the county through thousands of small underground cracks and solution channels and eventually reemerges at Harrison Spring (see Figure 1), the largest spring in Indiana (Figure 9). In addition, a considerable part of the water comes from the Indian Creek watershed. Dye tests and analysis of hydrographs have shown that water can move underground from the Sinks of Indian Creek (see Figure 1) to Harrison Spring, a surface distance of over four miles, as quickly as one hour.
300 feet
500 feet
700 feet
900 feetD
900 feet
700 feet
500 feet
300 feet
C
1 Mile1 0
Harrison Spring445 feet
Sinks ofIndian Creek 495 feet
Figure 9. Cross Section Illustrating the Underground Capture of Indian Creek (from Gray and Powell, 1965).
The average flow of Harrison Spring has been estimated at 18,000 gpm. The potential for it and other karst springs of Harrison County as a source of potable water has been investigated throughout the years. Unfortunately, karst areas are extremely vulnerable to contamination from point sources (e.g., spills, leaking underground storage tanks, and individual household septic systems) and broad area contamination (e.g., road salts, vehicle emissions, pesticides, and fertilizers). The karst features of subterranean conduits or streams are in many cases connected for great distances. These connected conduits create a potential for widespread contamination downstream of a contaminant source. In places the flow rates can be similar to surface streams, with some contaminants flowing through the system rapidly (especially after a rain or snow-melt event), while in other parts of the system contaminants may be trapped in pools, sediments, or minor fractures for much longer periods of time. A study conducted by the U.S. Geological Survey (Silcox and others, 2002) showed that concentrations of E. coli bacteria in water samples collected upstream from the sinks of Indian Creek exceeded the State of Indiana single-sample standard for waters used for recreation (see Appendix).
HYDROGEOLOGY AND GROUND WATER AVAILABILITY
Ground water availability in Harrison County is primarily related to the location of the sand and gravel glacial outwash deposits in the unconsolidated aquifers, and to secondary porosity development in the bedrock aquifers. Primary (intercrystalline) porosity in the Ste. Genevieve
15

Limestone (the most important bedrock aquifer) is minor (Merkley, 1991). Thus, bedrock ground water resources are inherently dependent on secondary porosity solution channels. Bedrock wells represent over 95 percent of all wells completed in Harrison County. However, the well yields from bedrock wells are difficult to predict and typically relatively low. One notable exception is in the northwestern part of the county near Milltown, where ground water is available in sufficient quantities to supply several high-capacity wells.
Most of the population of the county is served by a public water supply distribution system whose wells are producing from the sand and gravel deposits located within the Ohio River valley. In other portions of Harrison County the bedrock aquifers are utilized for the most part by individual households and farms, where public water supply systems are inaccessible.
Values for aquifer transmissivity and hydraulic conductivity were calculated for the glacial outwash sand and gravel deposits within the Ohio River valley. A pump test was conducted on a test well screened in sand and gravel outwash deposits adjacent to the Ohio River (see Figure 1 and Figure 5 for Test well location). The test well was located near the Harrison and Floyd County line upstream from the town of Elizabeth’s well field. Well recovery data from the 48-hour single well pump test are shown in Figure 10.
0
1
2
3
4
5
6
7
1 10 100 1,000 10,000
Ratio t/t'
Res
idua
l dra
wdo
wn,
s' (
feet
)
Figure 10. Residual Drawdown of a Test Well Screened in Outwash Sand and Gravel.
16
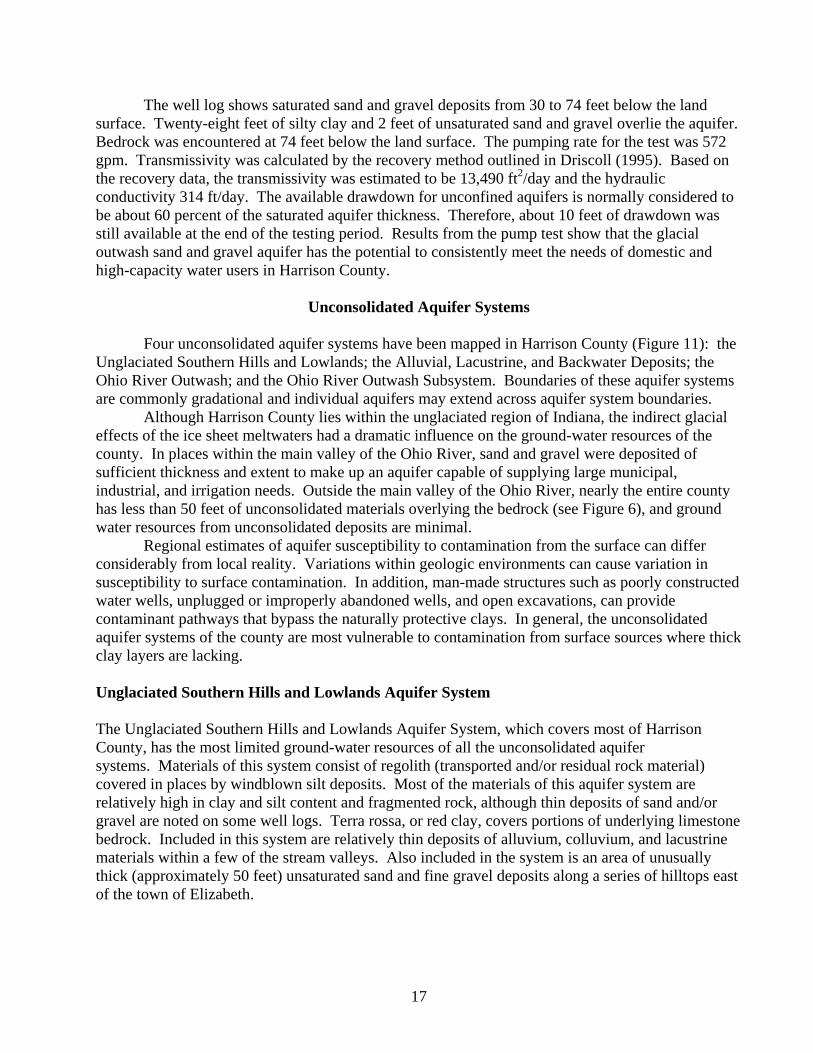
The well log shows saturated sand and gravel deposits from 30 to 74 feet below the land surface. Twenty-eight feet of silty clay and 2 feet of unsaturated sand and gravel overlie the aquifer. Bedrock was encountered at 74 feet below the land surface. The pumping rate for the test was 572 gpm. Transmissivity was calculated by the recovery method outlined in Driscoll (1995). Based on the recovery data, the transmissivity was estimated to be 13,490 ft2/day and the hydraulic conductivity 314 ft/day. The available drawdown for unconfined aquifers is normally considered to be about 60 percent of the saturated aquifer thickness. Therefore, about 10 feet of drawdown was still available at the end of the testing period. Results from the pump test show that the glacial outwash sand and gravel aquifer has the potential to consistently meet the needs of domestic and high-capacity water users in Harrison County.
Unconsolidated Aquifer Systems
Four unconsolidated aquifer systems have been mapped in Harrison County (Figure 11): the
Unglaciated Southern Hills and Lowlands; the Alluvial, Lacustrine, and Backwater Deposits; the Ohio River Outwash; and the Ohio River Outwash Subsystem. Boundaries of these aquifer systems are commonly gradational and individual aquifers may extend across aquifer system boundaries.
Although Harrison County lies within the unglaciated region of Indiana, the indirect glacial effects of the ice sheet meltwaters had a dramatic influence on the ground-water resources of the county. In places within the main valley of the Ohio River, sand and gravel were deposited of sufficient thickness and extent to make up an aquifer capable of supplying large municipal, industrial, and irrigation needs. Outside the main valley of the Ohio River, nearly the entire county has less than 50 feet of unconsolidated materials overlying the bedrock (see Figure 6), and ground water resources from unconsolidated deposits are minimal.
Regional estimates of aquifer susceptibility to contamination from the surface can differ considerably from local reality. Variations within geologic environments can cause variation in susceptibility to surface contamination. In addition, man-made structures such as poorly constructed water wells, unplugged or improperly abandoned wells, and open excavations, can provide contaminant pathways that bypass the naturally protective clays. In general, the unconsolidated aquifer systems of the county are most vulnerable to contamination from surface sources where thick clay layers are lacking. Unglaciated Southern Hills and Lowlands Aquifer System The Unglaciated Southern Hills and Lowlands Aquifer System, which covers most of Harrison County, has the most limited ground-water resources of all the unconsolidated aquifer systems. Materials of this system consist of regolith (transported and/or residual rock material) covered in places by windblown silt deposits. Most of the materials of this aquifer system are relatively high in clay and silt content and fragmented rock, although thin deposits of sand and/or gravel are noted on some well logs. Terra rossa, or red clay, covers portions of underlying limestone bedrock. Included in this system are relatively thin deposits of alluvium, colluvium, and lacustrine materials within a few of the stream valleys. Also included in the system is an area of unusually thick (approximately 50 feet) unsaturated sand and fine gravel deposits along a series of hilltops east of the town of Elizabeth.
17

Figure 11. Unconsolidated Aquifer Systems Map of Harrison County.
R 2 E R 3 E R 4 E
T 1 S T 2 S
R 5 E
T 3 S
T 4 S Ohio
River Ohio River
T 5 S
T 6 S
18
Collectively, over 80 percent of the well logs for the 650 field-located wells within the Unglaciated Southern Hills and Lowlands Aquifer System show that the total thickness of the system typically ranges from less than 1 foot to 50 feet. Potential yields of conventionally drilled wells in this system are generally known to be so small that wells are commonly completed in the underlying bedrock. The Division of Water has no record of wells actually producing from the Unglaciated Southern Hills and Lowlands Aquifer System in Harrison County. Unsaturated conditions are common because of the thinness and low permeable materials of the aquifer system, the diversion of surface water runoff by the rolling topography and, within karst areas, by subsequent subterranean drainage. Because of the generally low permeability of the near-surface materials, this system is not very susceptible to contamination from surface sources. Alluvial, Lacustrine, and Backwater Deposits Aquifer System
The Alluvial, Lacustrine, and Backwater Deposits Aquifer System consists of unconsolidated deposits adjacent to and in a few of the valleys tributary to the Ohio River. The unconsolidated deposits primarily come from three major sources. One source is alluvium deposited by the streams along with colluvium eroded from the valley walls and upland areas. The second major source includes the silty clay deposits of the waning valley train and subsequent overbank deposits. The third major source is glaciolacustrine deposits that were formed in bodies of relatively stagnant lake water. These silt and clay deposits were formed when the Ohio River valley was choked with coarser material carried by glacial meltwater that effectively dammed tributary streams, creating lakes. Thick deposits of silt and clay, sometimes called “slackwater clay,” mark the former locations of these glacial lakes. In Harrison County, these deposits can occur up to an elevation of about 450 feet above mean sea level. They are especially noted within the valleys of Blue River, Indian Creek, and Buck Creek near the Ohio River.
The total thickness of unconsolidated deposits (mostly clay and silt) in this aquifer system varies considerably, from about 20 feet to more than 90 feet. Well data are very sparse, but the scarcity of productive zones of sand and gravel in this aquifer system is apparent from the number of water wells completed in the underlying bedrock aquifer. It is doubtful that this system has the potential for more than domestic wells. This aquifer system is marked by thick deposits of soft silt and clay that have a low susceptibility to surface contamination. Ohio River Outwash Aquifer System
The Ohio River Outwash Aquifer System occupies portions of the main valley of the Ohio River. This valley carried great quantities of outwash from the melting glaciers during the Wisconsin and pre-Wisconsin glacial stages. The outwash aquifer system contains large volumes of sand and gravel that fill the main river valley. As the glaciers melted, the sediment contained within them was delivered to the Ohio River in quantities too large for the stream to transport. As a result, the increased sediment load was stored in the valley as vertical and lateral accretionary deposits. As long as the retreating glaciers continued to provide sediment in quantities too large for the stream to transport farther downstream, the valley continued to be filled. This valley-filling process formed the most prolific aquifer system in the county.
In Harrison County, unconsolidated deposits of the Ohio River Outwash Aquifer System range from less than 20 feet at the edge of the valley to more than 130 feet in thickness. However, not all of the sand and gravel is saturated with water. Saturated sand and gravel (aquifer) thickness
19
20
of the Ohio River Outwash Aquifer System ranges from about 25 to 65 feet, but most of the system has an aquifer thickness between 45 and 55 feet. Commonly, 20 to 35 feet of silty to sandy clay overlie the aquifer materials. However, in some areas this layer is absent. Because water levels are generally near the base of overlying fine-grained clay, silt, or sandy clay the aquifer could be under confined or unconfined conditions.
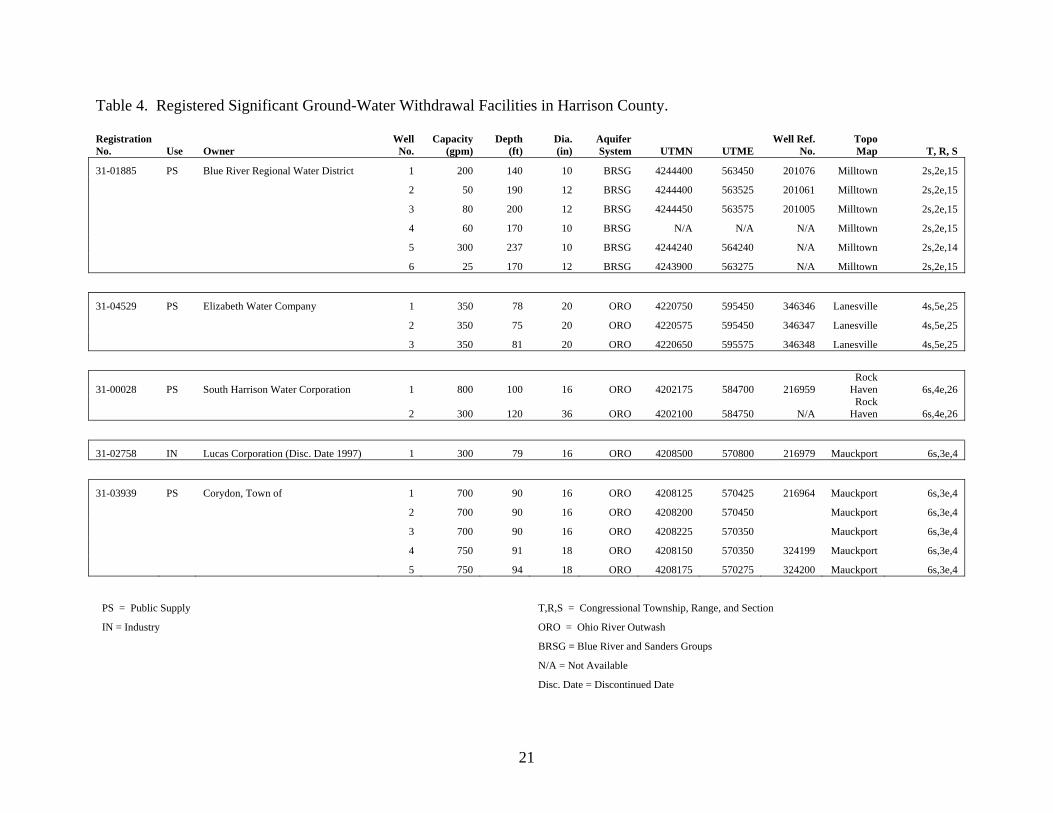
The Ohio River Outwash Aquifer System is by far the most productive aquifer system in the county and has the potential to consistently meet the needs of domestic and high-capacity water users. There are three registered significant ground-water withdrawal facilities (10 wells) in this system. Reported capacities range from 300 to 800 gpm. Static water levels typically range from about 30 to 55 feet below the land surface.
This aquifer system is highly susceptible to contamination in areas that lack overlying clay layers. Areas within the system that are overlain by thick layers of clay or silt are moderately susceptible to surface contamination. Ohio River Outwash Aquifer Subsystem
The Ohio River Outwash Aquifer Subsystem in Harrison County is located contiguous to the outwash system and is mapped as a transitional zone. Well data are scarce, but well yields are expected to be comparatively lower in the subsystem because the saturated thickness of sand and gravel is typically less than 15 feet. In places, especially on the downstream ends of most point bars, the sand and gravel deposits grade into a sand unit. In some areas silty or sandy clay, with a typical thickness ranging from 10 to 30 feet, overlie the aquifer materials.
Domestic wells completed in the subsystem typically yield 5 to 20 gpm. Prospects of completing high-capacity wells in this aquifer system are limited to areas with sufficient saturated thickness and optimal well-field design. Areas within this aquifer system that have overlying clay or silt deposits are moderately susceptible to surface contamination; whereas, areas that lack overlying clay or silt deposits are highly susceptible to contamination. Unconsolidated Aquifer Systems Registered Significant Ground-Water Withdrawal Facilities
Currently there are three registered significant ground-water withdrawal facilities using unconsolidated aquifers in the county. All of the facilities utilize the Ohio River Outwash Aquifer System for the purpose of public water supply. The Elizabeth Water Company has three wells with reported capacities of 350 gpm each, the South Harrison Water Corporation has two wells with capacities of 300 gpm and 800 gpm, and the Town of Corydon has five wells with capacities ranging from 700 to 750 gpm. Refer to Table 4 for some details on the wells and to Figure 11 for facility locations.
Bedrock Aquifer Systems
Three bedrock aquifer systems, all of Mississippian age, have been mapped in Harrison County (Figure 12). They are from west to east and youngest to oldest: the Buffalo Wallow, Stephensport, and West Baden Groups; the Blue River and Sanders Groups; and the Borden Group. The bedrock aquifer systems extend across Harrison County generally as a series of bands primarily trending north to south.
21
Table 4. Registered Significant Ground-Water Withdrawal Facilities in Harrison County. Registration No. Use Owner
Well No.
Capacity (gpm)
Depth (ft)
Dia. (in)
Aquifer System UTMN UTME
Well Ref. No.
Topo Map T, R, S
31-01885 PS Blue River Regional Water District 1 200 140 10 BRSG 4244400 563450 201076 Milltown 2s,2e,15
2 50 190 12 BRSG 4244400 563525 201061 Milltown 2s,2e,15
3 80 200 12 BRSG 4244450 563575 201005 Milltown 2s,2e,15
4 60 170 10 BRSG N/A N/A N/A Milltown 2s,2e,15
5 300 237 10 BRSG 4244240 564240 N/A Milltown 2s,2e,14
6 25 170 12 BRSG 4243900 563275 N/A Milltown 2s,2e,15
31-04529 PS Elizabeth Water Company 1 350 78 20 ORO 4220750 595450 346346 Lanesville 4s,5e,25
2 350 75 20 ORO 4220575 595450 346347 Lanesville 4s,5e,25
3 350 81 20 ORO 4220650 595575 346348 Lanesville 4s,5e,25
31-00028 PS South Harrison Water Corporation 1 800 100 16 ORO 4202175 584700 216959 Rock
Haven 6s,4e,26
2 300 120 36 ORO 4202100 584750 N/A Rock
Haven 6s,4e,26
31-02758 IN Lucas Corporation (Disc. Date 1997) 1 300 79 16 ORO 4208500 570800 216979 Mauckport 6s,3e,4
31-03939 PS Corydon, Town of 1 700 90 16 ORO 4208125 570425 216964 Mauckport 6s,3e,4
2 700 90 16 ORO 4208200 570450 Mauckport 6s,3e,4
3 700 90 16 ORO 4208225 570350 Mauckport 6s,3e,4
4 750 91 18 ORO 4208150 570350 324199 Mauckport 6s,3e,4
5 750 94 18 ORO 4208175 570275 324200 Mauckport 6s,3e,4
PS = Public Supply T,R,S = Congressional Township, Range, and Section
IN = Industry ORO = Ohio River Outwash BRSG = Blue River and Sanders Groups N/A = Not Available Disc. Date = Discontinued Date

Figure 12. Bedrock Aquifer Systems Map of Harrison County.
R 2 E R 3 E R 4 E
T 1 S T 2 S
R 5 E
T 3 S
T 4 S Ohio
River Ohio River
T 5 S
T 6 S
22
The thickness of unconsolidated materials covering the bedrock of Harrison County varies,
but for the most part is less than 50 feet (see Figure 6). Rock types exposed at the bedrock surface range from relatively unproductive shales to moderately productive limestones. Because permeability in many places is greatest near the bedrock surface, bedrock units within the upper 100 feet are commonly the most productive aquifers. Most of the bedrock aquifers in the county are under confined conditions. In other words, the potentiometric surface (water level) in most wells completed in bedrock rises above the top of the water-bearing zone. Bedrock wells represent over 95 percent of all wells completed in Harrison County. However, much of the county is served by a public water supply system originating from the prolific unconsolidated sand and gravel deposits within the Ohio River valley.
The susceptibility of bedrock aquifer systems to surface contamination is largely dependent on the type and thickness of the overlying sediments. However, because the bedrock aquifer systems have complex fracturing systems, once a contaminant has been introduced into a bedrock aquifer system, it will be difficult to track and remediate. Mississippian -- Buffalo Wallow, Stephensport, and West Baden Groups Aquifer System
The Buffalo Wallow, Stephensport, and West Baden Groups are mapped as a bedrock aquifer system in Indiana. However, no Buffalo Wallow strata are present in Harrison County. The older Stephensport and West Baden Groups outcrop primarily along ridge tops in the western portion of the county.
The older West Baden Group consists dominantly of sandstone, siltstone, and shale; however, it has limestone beds of variable thickness. The younger Stephensport Group is comprised of limestone, shale, and cliff-forming sandstone. The combined thickness of the West Baden and Stephensport in the county ranges from less than one foot where the older Blue River Group rocks are exposed to a maximum of about 115 feet in the western part of the county.
The depth to the bedrock surface is typically less than 20 feet on the uplands in Harrison County. Well depths of the very few wells started in the Buffalo Wallow, Stephensport, and West Baden Groups Aquifer System range from 94 to 503 feet. The amount of rock penetrated by a well typically ranges from about 170 to 340 feet. Therefore, all of the wells penetrate into the underlying Blue River and Sanders Groups Aquifer System. Static water levels are highly variable in the wells started in this aquifer system. Reported water levels range from 50 to 300 feet below the land surface.
The Buffalo Wallow, Stephensport, and West Baden Groups Aquifer System is not regarded as a major ground-water resource in this county. Wells started in this system are typically completed in the older, more productive Blue River and Sanders Groups Aquifer System. The domestic wells completed in the underlying Blue River and Sanders Groups Aquifer System have commonly been tested between less than 1 and 10 gpm with a few dry holes reported. At least one domestic well was tested as high as 30 gpm. However, very few wells can sustain a pumping rate over 10 gpm.
In the outcrop/subcrop area of this aquifer system the rock is predominantly shallow and contains numerous, irregular joints. In addition, karst features (sinkholes) are noted on topographic maps. These conditions warrant considering the aquifer system in Harrison County to be moderately to highly susceptible to contaminants introduced at and near the land surface.
23

Mississippian -- Blue River and Sanders Groups Aquifer System
This aquifer system outcrops throughout most of the county. The older Sanders group consists of limestone and dolomite. Chert and siliceous intervals of carbonate rocks are common, and minor amounts of shale and siltstone are present. The Blue River Group formations are primarily limestone, but they may contain significant amounts of dolomite, gypsum, anhydrite, shale, chert, and calcareous sandstone.
The combined thickness of the Blue River and Sanders Groups ranges from less than 1 foot where they are eroded along parts of the eastern and southeastern border of Harrison County to over 500 feet in the southwestern part of the county. The formations thicken as they dip to the west-southwest. Limestones within the Blue River Group are especially noted for development of karst features on the land surface where the bedrock is quite shallow. Some of the karst features in the county include caves, sinkholes, collapsed sinkholes, sinking streams, stream rises, and springs. These features are produced by the action of ground water dissolving the limestone, primarily along fracture and bedding planes or zones of weakness.
Some well records describe cavities or solution channels up to 15 feet in height. As expected, the yields of wells tapping this aquifer system are quite variable. The Division of Water has records for over 800 wells in this aquifer system in the county. The depth to solid bedrock is typically between 20 and 50 feet on the uplands of the central portion of the county (Mitchell Plateau), but may be as much as 90 feet where broken limestone and clay are present due to extensive weathering and/or karstification.
Well depths range from about 25 to 525 feet, but wells are commonly completed at depths of 75 to 175 feet. Reported test rates for water wells vary from less than 1 to 300 gpm. There is one registered significant ground-water withdrawal facility (6 wells) with reported yields of 25 to 300 gpm. Domestic well yields in this system commonly range from 1 to 20 gpm and a few isolated dry holes have been reported. Reported static water levels range from less than 1 foot to 300 feet below the land surface, but are typically between 40 and 90 feet.
In Harrison County, the Blue River and Sanders Groups Aquifer System is considered a moderately dependable ground-water source. Water quality is generally good, except for several wells reporting a sulfur odor, which may be due to chemical reactions associated with gypsum deposits in the Blue River Group. Because the rock is generally quite shallow, and contains numerous fractures, open joints, and solution channels, the aquifer system is considered very susceptible to contamination from the land surface. Mississippian -- Borden Group Aquifer System
The Borden Group Aquifer System outcrops/subcrops in small areas along the eastern county boundary. This bedrock aquifer system is composed mostly of siltstone and shale, but fine-grained sandstones are common. Carbonates are rare, but do occur as discontinuous interbedded limestone lenses, mostly in the upper portion of the group.
The Borden Group in Harrison County is up to 600 feet thick. The very few wells completed in the Borden Group Aquifer System range in depth from 48 to 145 feet. Reported static water levels in the wells completed in this aquifer system range from 10 to 120 feet below the land surface. Because the Borden Group is generally not very productive, it is typically used only where unconsolidated deposits do not contain an aquifer. In fact, some dry holes and yields of less than 1 gpm have been reported. The domestic wells completed in the group have testing rates ranging from
24
less than 1 to 40 gpm. The higher yielding wells likely occur along significant bedrock fractures. There is little chance for development of high-capacity wells in the Borden Group Aquifer System in Harrison County.
This aquifer system is regarded as moderately susceptible to surface contamination. However, in areas where coarse-grained alluvium overlies the fractured and jointed rock, there is a high risk of contamination from surface or near-surface sources. Bedrock Aquifer Systems Registered Significant Ground-Water Withdrawal Facilities
Currently there is one registered significant ground-water withdrawal facility using a bedrock aquifer in the county. The facility utilizes the Blue River and Sanders Group Aquifer System for the purpose of public water supply. The Blue River Regional Water District has six wells with reported capacities ranging from 25 to 300 gpm. Refer to Table 4 for some details on the wells and to Figure 12 for the facility location.
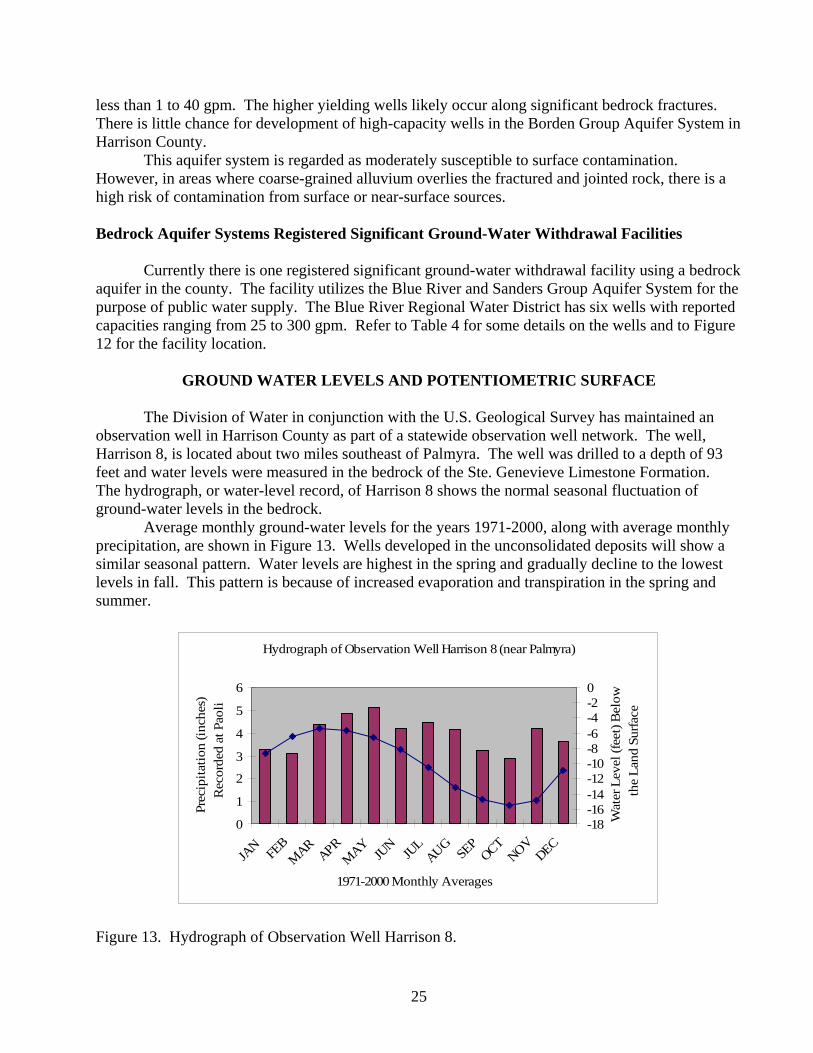
GROUND WATER LEVELS AND POTENTIOMETRIC SURFACE
The Division of Water in conjunction with the U.S. Geological Survey has maintained an observation well in Harrison County as part of a statewide observation well network. The well, Harrison 8, is located about two miles southeast of Palmyra. The well was drilled to a depth of 93 feet and water levels were measured in the bedrock of the Ste. Genevieve Limestone Formation. The hydrograph, or water-level record, of Harrison 8 shows the normal seasonal fluctuation of ground-water levels in the bedrock.
Average monthly ground-water levels for the years 1971-2000, along with average monthly precipitation, are shown in Figure 13. Wells developed in the unconsolidated deposits will show a similar seasonal pattern. Water levels are highest in the spring and gradually decline to the lowest levels in fall. This pattern is because of increased evaporation and transpiration in the spring and summer.
Hydrograph of Observation Well Harrison 8 (near Palmyra)
0
1
2
3
4
5
6
JAN FE
BMAR
APRMAY
JUN
JUL
AUGSE
POCT
NOVDEC
1971-2000 Monthly Averages
Prec
ipita
tion
(inch
es)
Rec
orde
d at
Pao
li
-18-16-14-12-10-8-6-4-20
Wat
er L
evel
(fee
t) B
elow
th
e La
nd S
urfa
ce
Figure 13. Hydrograph of Observation Well Harrison 8.
25

A composite ground water potentiometric surface map was constructed by use of static water
levels from over 500 well-driller’s records (Figure 14). The potentiometric surface map can be used only as an approximation because: the aquifer system is mapped as a continuum across the county and does not distinguish among the numerous aquifers; and seasonal and yearly variations in water levels are not taken into account. When water levels are measured in a timely manner from a single aquifer, the direction of ground-water flow is downgradient perpendicular to the contours of the potentiometric surface.
Figure 14 can be used to estimate the general direction of ground-water flow and the static water level in wells. The ground water levels shown represent the level to which water will rise in a well. For the bedrock aquifer, depending on the total head, water levels shown may actually be above ground level (potential for a flowing artesian well), at ground level (a spring), or below ground level (potential for a non-flowing artesian well). Great care and professional judgment should be used when making interpretations or performing calculations based on the ground water flow map. It is not realistic to assume that these water levels represent ground water levels for a single homogeneous aquifer. The vertical component of ground water flow may vary both spatially and temporally. In the case of the unconsolidated aquifer, local ground water levels will vary based on the volume of flow in the Ohio River. The two extreme cases are noted. During flood stage, the Ohio River will be a losing stream and groundwater levels near the river will rise. During the low flow stage of the Ohio River, the river will be a gaining stream and local ground water levels will fall. Ground water typically flows from upland recharge areas to low-lying discharge areas along major streams. The potentiometric surface map indicates that ground water generally flows from upland areas toward the Ohio River. Local ground-water divides exist in some upland areas.
GROUND WATER QUALITY
The Division of Water has on file the results of several analyses of well water from Harrison County. The samples were collected by various organizations including the DOW, Public Water Supply facilities, and the U.S. Geological Survey (Table 5). Four water samples from the glacial outwash sand and gravel aquifer and two water samples from the limestone bedrock aquifer are included in Table 5. Independent laboratories analyzed the water samples collected from wells operated by the Town of Corydon (1992) and the Blue River Regional Water District (1998). The U.S. Geological Survey analyzed the Harrison 8 water sample (1966). The Indiana Department of Health analyzed the water samples from the Elizabeth Water Company (2006), South Harrison Water Corporation (1987), and Ramsey Water Company, Inc. (1986). Although the Ramsey Water Company, Inc. well field is located just west of Harrison County in Crawford County, their water sample is included in this survey because the water company supplies much of the population of Harrison County with potable water.
The U.S. Environmental Protection Agency (2006) maximum contaminant level (MCL) is the maximum level of a contaminant that is allowed in a public water system. The secondary maximum contaminant level (SMCL) is the level for contaminants that may affect the taste, odor, or other characteristics of drinking water and is not considered to present a risk to human health at the SMCL. The MCLs and SMCLs are listed in Table 5 if established.
26
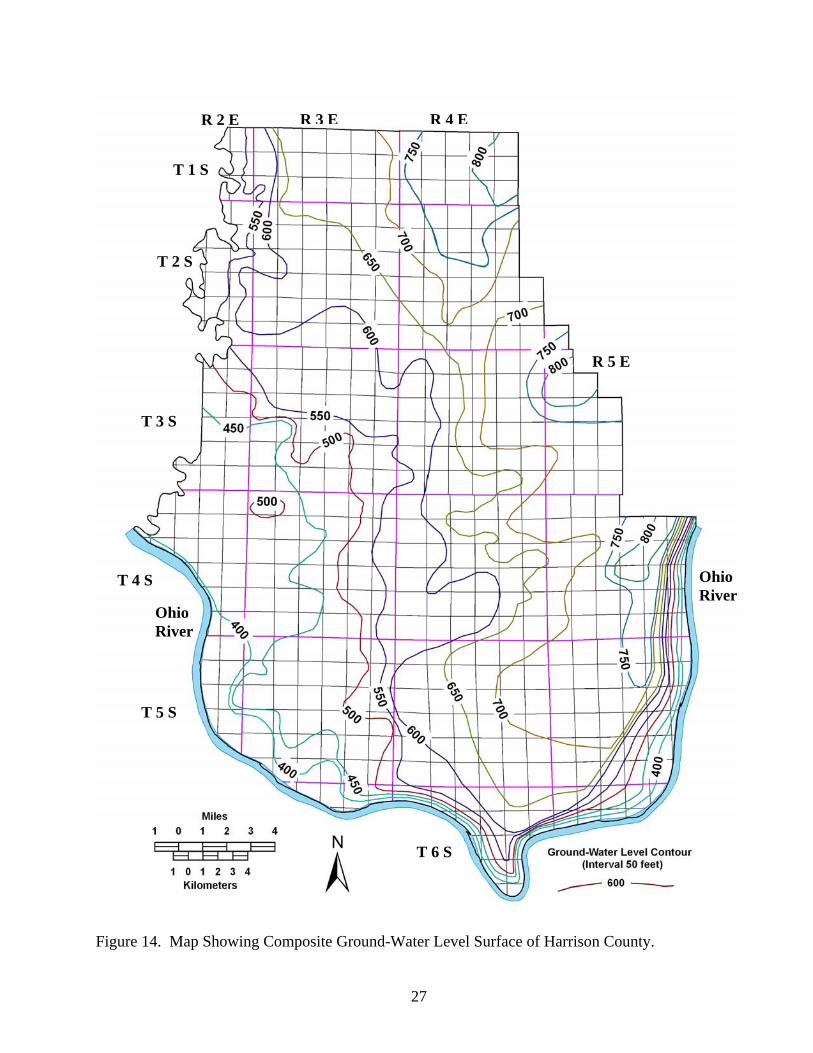
Figure 14. Map Showing Composite Ground-Water Level Surface of Harrison County.
T 4 S
T 5 S
T 3 S
T 1 S T 2 S
Ohio River
R 2 E R 3 E R 4 E
27
T 6 S
R 5 E
Ohio River

28
Table 5. Ground Water Chemistry Data and USEPA (2006) Drinking Water Standards for Constituents Reported. [The USEPA maximum contaminant level (MCL) is the maximum level of a contaminant that is allowed in a public water system. The secondary maximum contaminant level (SMCL) is the level for contaminants that may effect the taste, odor, or other characteristics of drinking water. These contaminants are not considered to present a risk to human health at the SMCL.] Well Elizabeth
Water Company
South Harrison Water
Corporation No. 1
Town of Corydon
Ramsey Water
Company, Inc.
Blue River Regional
Water District No.
4
Harrison 8 USEPA MCL
USEPA SMCL
Reference Number NA 216959 NA NA NA 121605 Township 4S 6S 6S 4S 2S 1S Range 5E 4E 3E 2E 2E 4E Section 25 23 4 8 14 33 Aquifer Type Sand & Gravel Sand & Gravel Sand &
Gravel Sand & Gravel
Limestone Limestone
Depth (feet) 80 100 90 110 237 93 Chemical Constituents
pH units 7.2 7.2 7.2 8.0 8.05 7.4 6.5 to 8.5 Temperature (°C) --- --- --- --- 16 --- Conductivity (μS/cm) --- --- --- --- --- 499 Hardness as CaCO3 288 290 289 246 214 255 Alkalinity as CaCO3 252 258 290 184 214 --- Alkalinity as HCO3 --- --- --- --- --- 310 Iron 0.0125 <0.02 0.048 <0.05 0.1 1.1 0.3 Manganese <0.001 <0.01 --- 0.02 <0.01 --- 0.05 Calcium 94.7 86 88.1 75 53.1 79 Magnesium 15.4 18 --- 14 --- 14 Sodium 14.6 6.4 13.0 16 6.35 8.4 Potassium 1.61 0.8 --- 1.4 --- 0.6 Chloride 21 9 22.5 25 8 6.0 250 Sulfate 34 20 --- 63 68 7.2 250 Phosphate <0.03 0.09 --- <0.09 --- --- Fluoride <0.1 0.2 --- 0.9 0.158 0.2 4.0 2.0 Nitrate-N 1.1 4.9 3.2 0.6 0.232 5.5 10.0 Arsenic <0.0012 0.0003 --- 0.0002 <0.002 --- 0.10 Barium 0.0398 0.030 --- 0.060 0.08 --- 2 NA = not available; Dashes (---) indicate no test performed; units are in mg/L unless otherwise noted
The pH of water is a measure of its reactivity. Water with a pH of 7 is considered neutral, whereas below 7 is acidic and above 7 basic. Values of pH for all wells sampled were within the National Secondary Drinking Water Regulations Secondary Maximum Contaminant Level (SMCL).
The hardness of water is a measure of the amount of dissolved calcium and magnesium in the water. Hardness hampers the formation of soap lather and can affect the suitability of water for use in certain industries. Bicarbonates of calcium and magnesium decompose in steam boilers and water heaters to form scale. All wells sampled had hardness values of greater than 210 milligrams per liter (mg/L). Most values were considerably above the 180 mg/L value for very hard water (Heath, 1982). Water is commonly softened for household use at values of 200 mg/L or greater.
Iron is present in most soils and rocks and is found in solution naturally in ground water. Iron will precipitate out of solution when exposed to oxygen and may stain laundry and plumbing fixtures. Iron bacteria can precipitate iron from solution in ground water with a high iron content, which can lead to encrustation and clogging of well screens. Only the Harrison 8 observation well had an iron value above the 0.3 mg/L SMCL.
Manganese is similar to iron in chemical behavior but is commonly less widely distributed. Whereas iron combines with oxygen to form rust, manganese forms brownish-black particles. All wells tested for manganese were below the SMCL.
Chloride in combination with sodium gives water a salty taste. All wells tested for chloride were at least one level of magnitude below the SMCL.
High concentrations of sulfate may give water a bitter taste. All wells tested for sulfate were practically one level of magnitude below the SMCL.
Fluoride, in certain concentrations, reduces tooth decay and at higher concentrations may cause mottling of tooth enamel. The U.S. Environmental Protection currently recommends that water supplies contain no more than 2 mg/L in water. Fluoride values for all wells tested were below the SMCL of 2 mg/L.
Nitrate as nitrogen (nitrate-N), in places, is found naturally in Indiana at low concentrations. Nitrate-N may cause methemoglobinemia (i.e. blue-baby syndrome) at high concentrations. Ground water contaminated with nitrate-N is commonly associated with animal feedlots, sewage, and/or agricultural chemicals. All wells tested for nitrate-N were below the MCL.
Arsenic is found naturally in many soils and rocks and is found in solution naturally in ground water. All wells tested for arsenic were below the MCL.
Barium is a common constituent in soil and rock and is found dissolved in ground water. All wells tested for barium were below the MCL.
SUMMARY The Quaternary age Ohio River Outwash Aquifer System and the Mississippian age Blue River and Sanders Groups Aquifer System are the primary aquifers in Harrison County. Most of the population of the county is served by a public water supply distribution system originating from the prolific glacial outwash sand and gravel deposits of the Ohio River Outwash Aquifer System. A 1,000-gpm 24-hour pump test was reported for a well screened in the Ohio River Outwash Aquifer System. Values for aquifer transmissivity (13,490 ft2/day) and hydraulic conductivity (314 ft/day) were calculated for the Ohio River Outwash Aquifer System based on the recovery data from another pump test. Outside of the Ohio River valley, there is little chance of obtaining an adequate supply of water from unconsolidated deposits, because most of the bedrock in the county is covered by less than 50 feet of silty clay material.
29
In the northwestern part of the county, ground water is available in sufficient quantities within the limestone fractures and solution cavities of the Blue River and Sanders Groups Aquifer System to supply several high-capacity wells for public water supply. These wells have reported capacities of 80, 200, and 300 gpm. In other portions of Harrison County the bedrock aquifers are utilized for the most part by individual households and farms, where public water supply systems are inaccessible. Although the well yields from bedrock wells are difficult to predict and typically relatively low, bedrock wells represent over 95 percent of all wells completed in Harrison County.
Ground-water quality of the wells tested is generally good. Four wells from the Ohio River Outwash Aquifer System and two wells from Blue River and Sanders Groups Aquifer System were tested for major ions and selected trace inorganic constituents. Very hard water values were reported for all six wells sampled. No constituents were reported above the MCL and only one well (Harrison 8 – observation well) had a constituent (iron) with reported levels greater than the SMCL.
The unconsolidated aquifer systems are generally overlain by thick layers of clay or silt and are moderately susceptible to surface contamination. The Ohio River Outwash Aquifer System and the Ohio River Outwash Aquifer Subsystem are highly susceptible to contamination in areas that lack overlying clay layers. The Blue River and Sanders Groups Aquifer System is considered very susceptible to contamination from the land surface because the rock is generally quite shallow, and contains numerous fractures, open joints, and solution channels. The Borden Group Aquifer System and the Buffalo Wallow, Stephensport, and West Baden Groups Aquifer System are regarded as moderately to highly susceptible to contaminants introduced at and near the land surface because the rock is predominantly shallow and contains numerous, irregular joints.
30

REFERENCES CITED Amadi, P., 1981, Ground-water chemistry and hydrochemical facies distribution as related to flow in
the Mississippian Carbonates, Harrison County, Indiana. Ph.D. thesis, Indiana University, Bloomington, Indiana.
Bruns, T.M., and Steen, W.J., 2003, Hydrogeology of the Lafayette (Teays) bedrock valley system,
north-central Indiana, Indiana Department of Natural Resources, Division of Water, Water Resource Assessment 2003-7.
Driscoll, F.G., 1986, Groundwater and wells: Johnson Screens, St. Paul, Minnesota, 1089 p. Droste, J.B., and Carpenter, G.L., 1990, Subsurface stratigraphy of the Blue River Group
(Mississippian) in Indiana, Indiana Department of Natural Resources, Geological Survey Bulletin 62.
Fenelon, J.M., Bobay, K.E., and others, 1992, Hydrogeologic atlas of aquifers in Indiana, U.S.
Geological Survey Water Resources Investigation Report 92-4142 prepared in cooperation with the Indiana Department of Natural Resources, Division of Water, and Indiana Department of Environmental Management.
Gray, H.H., 2000, Physiographic divisions of Indiana, Indiana Geological Survey, Indiana
Geological Survey Special Report 61. Gray, H.H., 1989, Quaternary Geologic Map of Indiana, Indiana Department of Natural Resources,
Geological Survey, Miscellaneous Map 49. Gray, H.H., 1982, Map of Indiana showing topography of the bedrock surface, Indiana Department
of Natural Resources, Geological Survey, Miscellaneous Map 36. Gray, H.H., 1983, Map of Indiana showing thickness of unconsolidated deposits, Indiana
Department of Natural Resources, Geological Survey, Miscellaneous Map 38. Gray, H.H., Ault, C.H., and Keller, S.J., 1987, Bedrock Geologic Map of Indiana, Indiana
Department of Natural Resources, Geological Survey, Miscellaneous Map 48. Gray, H.H., and Powell, R.L., 1965, Geomorphology and groundwater hydrology of the Mitchell
Plain and Crawford Upland in southern Indiana, Indiana Department of Natural Resources, Geological Survey Field Conference Guidebook 11.
Heath, R.C., 1982, Basic ground-water hydrology, U.S. Geological Survey Water-Supply Paper
2220. Malott, C.A., 1922, The physiography of Indiana, in Handbook of Indiana Geology, Indiana
Department of Conservation, publication no. 21, pp. 59-256.
31
McGrain, P., 1942, The St. Louis and Ste. Genevieve Limestones of Harrison County, Indiana, Proceedings of the Indiana Academy of Science, v. 52, pp. 149-162.
Merino, E., 2005, Origin of associated terra rossa and karst by replacement, Geological Society of
America Abstracts with Programs, vol. 37, no. 7, p. 257. Merkley, P.A., 1991, Origin and distribution of carbonate eolianites in the Ste. Genevieve Limestone
(Mississippian) of southern Indiana and northwestern Kentucky, Master’s thesis, Indiana University, Bloomington, Indiana.
Midwestern Regional Climate Center, 2005, Historical Climate Summaries, Sep. 13, 2005,
<http://sisyphus.sws.uiuc.edu/climate_midwest/mwclimate_data_summaries.htm>. Olson, C.G., Ruhe, R.V., and Mausbach, M.J., 1980, The terra rossa limestone contact phenomena in
karst, Southern Indiana, Soil Science Society of America Journal, vol. 44, pp. 1075-1079. Potter, P.E., 1969, Sedimentation Seminar, Bethel sandstone (Mississippian) of western Kentucky
and south-central Indiana, a submarine-channel fill, Kentucky Geological Survey, Kentucky Geological Survey Report of Investigations 11.
Powell, R.L., 1964, Origin of the Mitchell Plain in south-central Indiana, Proceedings of the Indiana
Academy of Science, vol. 73, pp. 177-182. Ray, L.L., 1965, Geomorphology and Quaternary Geology of the Owensboro Quadrangle, Indiana
and Kentucky, U.S. Geological Survey Professional Paper 488. Robbins, J.M., 1975, Soil survey of Harrison County, Indiana, U.S. Department of Agriculture Soil
Conservation Service in cooperation with Purdue University Agricultural Experiment Station.
Shaver, R.H., Ault, A.H., Burger, A.M., Carr, D.D., Droste, J.B., Eggert, D.L., Gray, H.H., Harper,
D., Hasenmueller, N.R., Hasenmueller, W.A., Horowitz, A.S., Hutchison, H.C., Keith, B.D., Keller, S.J., Patton, J.B., Rexroad, C.B., and Wier, C.E., 1986, Compendium of Paleozoic Rock-Unit Stratigraphy in Indiana - A Revision, Indiana Geological Survey, Indiana Geological Survey Bulletin, B59.
Silcox, C.A., Robinson, B.A., and Willoughby, T.C., 2002, Concentrations of Escherichia coli in
streams in the Ohio River Watershed in Indiana, May-August 2000, U.S. Geological Survey Water Resources Investigation Report 02-4064 prepared in cooperation with the Indiana Department of Environmental Management.
Stockdale, P.B., 1931, The Borden (Knobstone) rocks of southern Indiana, Indiana Department of
Conservation Publication 98. Straw, W.T., 1968, Geomorphology, hydrogeology, and economic geology of the Ohio River Valley,
Mauckport to Cannelton, Indiana, Ph.D. thesis, Indiana University, Bloomington, Indiana.
32

33
U.S. Census Bureau, 2005, <http://www.census.gov/>. U.S. Environmental Protection Agency, 2006, Code of Federal Regulations, Title 40, Chapter 1,
Parts 141 and 143. Wayne, W. J., 1960, Stratigraphy of the Ohio River Formation: Indiana Geological Survey Bulletin
21.

Appendix. Surface water quality data*, May-August 2000 (data from Silcox and others, 2002).
Location Date Discharge at time of sample
collection (cubic feet per second)
Water temperature
(degrees Celsius, degrees
Fahrenheit)
pH (Standard
units)
Dissolved oxygen
(milligrams per liter)
Specific conductance
(microsiemens per centimeter at 25 degrees
Celsius)
Turbidity (Nephelometric turbidity units)
Escherichia coli
(colonies per 100
milliliters)
7-10-00 24.5, 76.1 7.9 8.4 393 7.9 400 7-17-00 23.0, 73.4 7.7 8.2 400 8.0 74 7-24-00 22.0, 71.6 7.7 8.9 401 9.4 260 7-31-00 21.0, 69.8 7.4 6.2 421 29 2,100 8-7-05 24.5, 76.1 7.6 6.1 371 8.3 800
Indian Creek at SR 335 near
Corydon
Five-sample geometric mean 420 7-12-00 28.0, 82.4 8.1 8.5 417 5.6 K56** 7-19-00 24.5, 76.1 7.9 7.6 508 30 4,500 7-26-00 29.5, 85.1 8.2 11.2 576 7.1 33 8-02-00 27.0, 80.6 8.2 9.7 399 15 690 8-09-00 24.5, 76.1 7.8 9.2 395 20 1,100
Indian Creek downstream from Little
Indian Creek mouth at Corydon Five-sample geometric mean 360
7-12-00 26.0, 78.8 7.8 7.8 406 9.5 240 7-19-00 25.0, 77.0 7.4 4.0 421 18 710 7-26-00 22.5, 72.5 7.4 4.0 447 12 40 8-02-00 23.5, 74.3 7.4 2.5 433 6.6 K20** 8-09-00 24.5, 76.1 7.4 3.1 405 16 830
Indian Creek at Lickford Bridge
Road near Central
Five-sample geometric mean 160 7-12-00 13.3 25.0, 70.0 8.0 8.6 377 5.8 250 7-19-00 18.1 23.5, 74.3 7.8 7.1 351 6.5 1,100 7-26-00 4.9 21.5, 70.7 7.8 7.8 354 5.3 110 8-02-00 6.2 23.0, 73.4 7.9 6.9 378 6.8 230 8-09-00 7.7 24.0, 75.2 7.8 8.1 357 7.7 240
Buck Creek at SR 337 near
New Middletown
Five-sample geometric mean 280
34
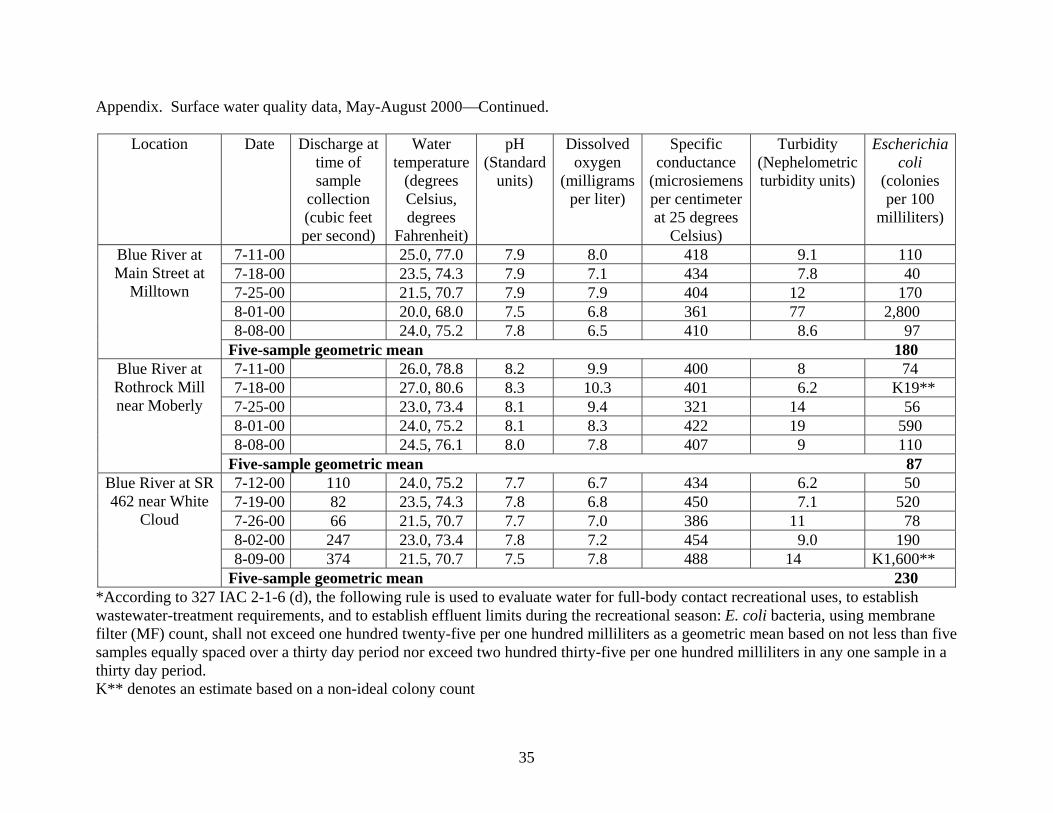
Appendix. Surface water quality data, May-August 2000⎯Continued.
Location Date Discharge at time of sample
collection (cubic feet per second)
Water temperature
(degrees Celsius, degrees
Fahrenheit)
pH (Standard
units)
Dissolved oxygen
(milligrams per liter)
Specific conductance
(microsiemens per centimeter at 25 degrees
Celsius)
Turbidity (Nephelometric turbidity units)
Escherichia coli
(colonies per 100
milliliters)
7-11-00 25.0, 77.0 7.9 8.0 418 9.1 110 7-18-00 23.5, 74.3 7.9 7.1 434 7.8 40 7-25-00 21.5, 70.7 7.9 7.9 404 12 170 8-01-00 20.0, 68.0 7.5 6.8 361 77 2,800 8-08-00 24.0, 75.2 7.8 6.5 410 8.6 97
Blue River at Main Street at
Milltown
Five-sample geometric mean 180 7-11-00 26.0, 78.8 8.2 9.9 400 8 74 7-18-00 27.0, 80.6 8.3 10.3 401 6.2 K19** 7-25-00 23.0, 73.4 8.1 9.4 321 14 56 8-01-00 24.0, 75.2 8.1 8.3 422 19 590 8-08-00 24.5, 76.1 8.0 7.8 407 9 110
Blue River at Rothrock Mill near Moberly
Five-sample geometric mean 87 7-12-00 110 24.0, 75.2 7.7 6.7 434 6.2 50 7-19-00 82 23.5, 74.3 7.8 6.8 450 7.1 520 7-26-00 66 21.5, 70.7 7.7 7.0 386 11 78 8-02-00 247 23.0, 73.4 7.8 7.2 454 9.0 190 8-09-00 374 21.5, 70.7 7.5 7.8 488 14 K1,600**
Blue River at SR 462 near White
Cloud
Five-sample geometric mean 230 *According to 327 IAC 2-1-6 (d), the following rule is used to evaluate water for full-body contact recreational uses, to establish wastewater-treatment requirements, and to establish effluent limits during the recreational season: E. coli bacteria, using membrane filter (MF) count, shall not exceed one hundred twenty-five per one hundred milliliters as a geometric mean based on not less than five samples equally spaced over a thirty day period nor exceed two hundred thirty-five per one hundred milliliters in any one sample in a thirty day period. K** denotes an estimate based on a non-ideal colony count
35