Structure and emplacement of the Nandurbar–Dhule mafic dyke swarm, Deccan Traps, and the
International Journal of Scientific & Engineering Research, Volume 5, Issue 5, May-2014 127 ISSN 2229-5518
IJSER © 2014 http://www.ijser.org
HYDROCARBON PROSPECTS IN DECCAN TRAPS
AUTHOR
NAME: YASH RASTOGI
INSTITUTE’S NAME: University of Petroleum & Energy Studies, Dehradun
CONTACT NUMBER: +91 9690865950
EMAIL ADDRESS: [email protected]
NAME: ABHISHEK SHARMA INSTITUTE’S NAME: University of Petroleum & Energy Studies, Dehradun
CONTACT NUMBER: +91 9837878998
EMAIL ADDRESS: [email protected]
CO-AUTHOR
NAME: ASHISH SAHU
INSTITUTE’S NAME: University of Petroleum & Energy Studies, Dehradun
CONTACT NUMBER: +91 7895749422
EMAIL ADDRESS: [email protected]
IJSER

International Journal of Scientific & Engineering Research, Volume 5, Issue 5, May-2014 128 ISSN 2229-5518
IJSER © 2014 http://www.ijser.org
ABSTRACT:
Deccan traps have been defined as the greatest volcanic formation of the Indian subcontinent that
consists of congealed lava flows covering an area of 400,000 square kilometers, with a thickness
estimated at about 3000 meters. The Mesozoic sediments contribute around 54 % of oil and 44% of the
gas reserves of the world. These basins are mostly overlain by Deccan traps of late cretaceous age and
are least explored .It is considered that requisite heat generation due to Deccan trap volcanism soon
after the cretaceous sedimentation may have acted as a catalyst in hydrocarbon generation .Surface
geochemical prospecting surveys along carbon isotopic studies have been used to access hydrocarbon
generation potential of this part of the basin .In the present work results of land sat , outcrop , core ,
laboratory , electrolog ,production logging(pelt),production performance and seismic studies have been
integrated to explain hydrocarbon distribution pattern within the trap .Surface geochemical studies
indicate the generation of light gaseous hydrocarbons C1 and Σ C2+ in the range of 3 to 1187ppb and 1
to 1449ppb respectively .The carbon isotopic signatures of selected soil gas samples(∆C13 in the range of
24 to -39.4% PDB) suggest the thermogenic origin.
IJSER

International Journal of Scientific & Engineering Research, Volume 5, Issue 5, May-2014 129 ISSN 2229-5518
IJSER © 2014 http://www.ijser.org
Introduction:
Increasing demands of energy have necessitated development of new strategies for hydrocarbon
exploration throughout the world .While on one hand efforts are being made to explore the gas
hydrates ,deep-sea hydrocarbon resources and coal bed methane ,exploration of hydrocarbons in
complex geological situations on land is being also considered important .The complex situations include
thrust environments and shallow carbonate covered areas ,highly folded tectonic areas and the volcanic
covered provinces .Volcanic covered provinces like the Deccan trap in India, the Columbia in north
America ,and the Parana in south America are regions where thick lava flows overlie sediments that
could be promising targets for hydrocarbon exploration .The presence of hydrocarbons under the
Deccan traps can be easily proved by geophysical ,geochemical and geo-microbial prospecting (which is
part of the geochemical surveys )of the Deccan trap.
Deccan traps cover major part of the central India, which conceal the major Pretrappean geotectonic
settings under its cover .Considering the varying resistivity and gravity characters of Deccan traps vis-à-
vis the probable underlying sediments (Mesozoic , Gondwana and Vindhyans), a correlation of electrical
resistivity survey results and gravity results have in the identification of buried sediments under the trap
cover .In the process major structures have also been delineated. Electrical resistivity surveys carried
out in the region have helped in understanding the basement configuration and the Pretrappean
topography of the area. A correlation of gravity and resistivity data will help in identifying the basement
structure in the trap-covered region.
Geo-chemical prospecting of hydrocarbons identifies the surface or near-surface occurrences of
hydrocarbons or their alteration products ,which are due to micro/macro seepage of the subsurface
hydrocarbon occurrences .The micro/macro seepage is an established phenomenon, and these occur
because processes and mechanisms such as diffusion ,effusion and buoyancy allow hydrocarbons to
escape from reservoirs and migrate to the surface where they retained in the sediments and soils or
diffuse into atmosphere or water columns.
IJSER

International Journal of Scientific & Engineering Research, Volume 5, Issue 5, May-2014 130 ISSN 2229-5518
IJSER © 2014 http://www.ijser.org
Geo-microbial prospecting is also a part of the geochemical surveys .Geo-microbial prospecting for
hydrocarbons is an exploration method based on the vertical seepage of light hydrocarbon gases and
their utilization by hydrocarbon oxidizing bacteria. The detection of anomalous population of propane or
butane oxidizing bacteria in the surface soils or sediments helps to evaluate the prospects for
hydrocarbon exploration. The reconnaissance surface geochemical surveys can be used to guide the
location and extent of subsequent seismic coverage.
Figure: 1 Geological and Tectonic map of Deccan Syneclise
IJSER

International Journal of Scientific & Engineering Research, Volume 5, Issue 5, May-2014 131 ISSN 2229-5518
IJSER © 2014 http://www.ijser.org
1 GEOPHYSICAL SURVEY
Although many 2D techniques to model basalt-covered areas are available, modeling by 3D schemes
would be more appropriate because the strike lengths of many sedimentary basins are limited. Based on
integrated modeling of deep-resistivity and gravity data, we clarify the 3D basement configuration of the
JRB. Electric and gravity methods measure different rock properties, and each one is more effective
when the contrast is significant, although these contrasts may occur at different depths for each
method. For example, resistivity data are more sensitive to vertical resistivity changes; in contrast,
gravity data are more sensitive to lateral changes in the density of the rock formations. To determine
the base of the Permian sediments from gravity anomalies, the base of the basalt needs to be
determined using another suitable geophysical method. In the present case, the thickness of the
Cretaceous formation (basalt) over the Permian sediments was estimated by analyzing 60 DES data
points, which were supported by drilling. The successful application of DES to explore deep-seated
targets is described by Zohdy. The gravity effect of the mass deficit between basalt and the underlying
sediments was computed using a 3D forward-modeling scheme and subsequently was removed from
the Bouguer anomalies of the basin along with the regional gravity field. The modified residual gravity
anomaly was then modeled using an automated 3D inversion to configure the basement structure.
1.1 SEISMIC SURVEY OF DECCAN TRAP LAYERS IN CAMBAY BASIN
In the attempt to study the buried Deccan Trap layers in the Cambay Basin, the ground magnetic surveys
have not been very useful as the data combine the effect due to the crystalline basement and the Trap
thickness. In some parts of the basin, some reflections in the seismograms obtained in the course of
seismic surveys, could be correlated to the Trap surface. These can be tied with wells drilled in the basin
upto the Traps. The synthesis of the gravity and seismic data has enabled us to prepare a map of the
Trap surface in the Cambay basin. The depth of the Trap surface increases from about 2000 m in the
northern part of the basin to about 600 m in its deepest part near Broach. The Trap surface rises
gradually south of Narbada in an average direction of SE with depths running from 2500 m to 500 m.
IJSER

International Journal of Scientific & Engineering Research, Volume 5, Issue 5, May-2014 132 ISSN 2229-5518
IJSER © 2014 http://www.ijser.org
The interpretation of the gravity anomalies, assuming their cause to be the variations in the thickness of
the Trap, has enabled the determination of the average thickness of the Traps in the basin. The
maximum thickness of the Trap is in the central part of the basin and is estimated to be about 2.4 km.
The Traps appear to gradually taper towards the flanks of the basin.
1.2 GRAVITY AND MAGNETO TELLURIC SURVEY OVER DECCAN TRAP-
Regional gravity studies were supplemented by spot refraction seismic soundings at a number of
selected points. These soundings have revealed that the trap is thin in the southern and eastern margins
and thick in the western and north-western parts. GSI also carried out deep electrical resistivity
soundings (DRS).In order to study the nature of the crustal structures, configuration underlying
sediments, NGRI conducted DSS and Magneto Telluric (MT) and refraction seismic work sponsored by
GSI.ONGC initiated geophysical investigations in Nagpur Pusad-Betul area with the aim of delineating
the thickness of the Deccan traps and the underlying sediments, if any. Under this programme, the first
gravity-magnetic surveys were conducted during 1984-85. Broad conclusions derived from this survey
were that the thickness of sediments is about 2.1 Km in the west of Wardha town and 4.17 to 5.74 Km
(approx.) near Katol.
IJSER
International Journal of Scientific & Engineering Research, Volume 5, Issue 5, May-2014 133 ISSN 2229-5518
IJSER © 2014 http://www.ijser.org
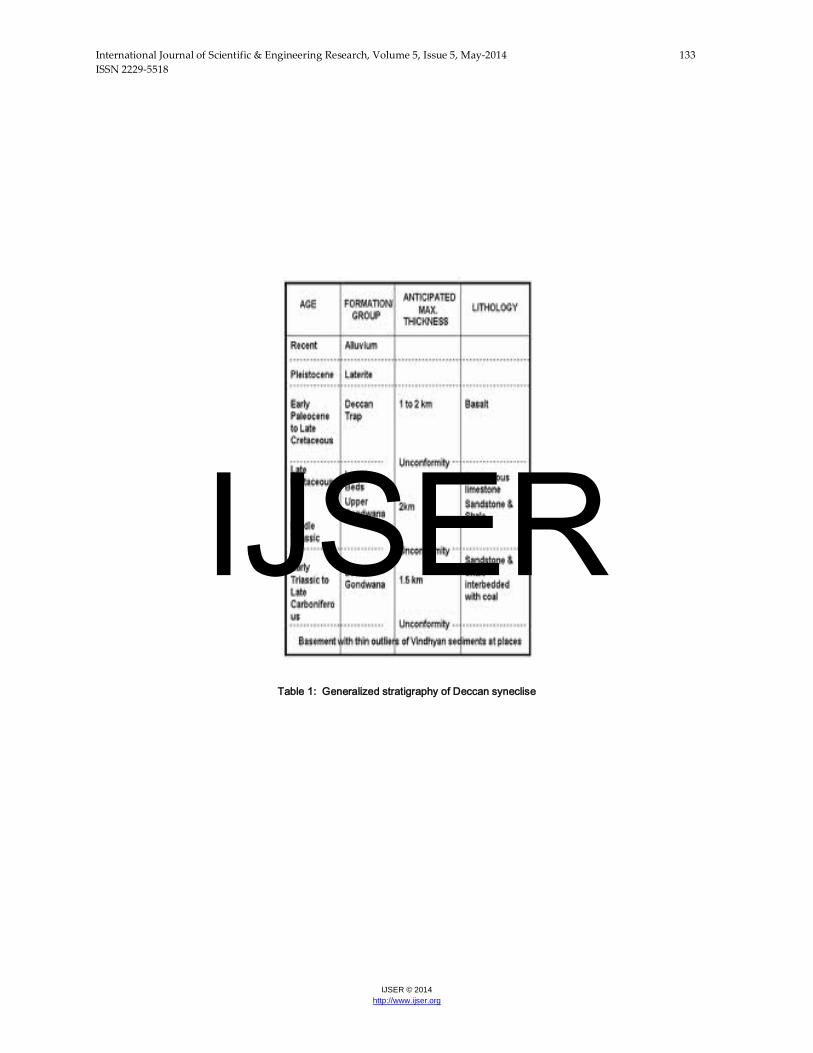
Table 1: Generalized stratigraphy of Deccan syneclise
IJSER

International Journal of Scientific & Engineering Research, Volume 5, Issue 5, May-2014 134 ISSN 2229-5518
IJSER © 2014 http://www.ijser.org
Figure 2: MAGNETO TELLURIC SURVEY OF DECCAN REGION
IJSER

International Journal of Scientific & Engineering Research, Volume 5, Issue 5, May-2014 135 ISSN 2229-5518
IJSER © 2014 http://www.ijser.org
Figure 2 : GRAVITY SURVEY OF DECCAN REGION
1.3 OBJECTIVE
The objective of this study is to illustrate the interpretative resolution of the MT and gravity data in the
deepest part of the basin i.e. Katol low in Nagpur-Wardha area. Both MT and gravity interpretations
have been reviewed and the gravity modeling along the MT line and revised interpretation are
presented in this paper. The contributions of all types of data sets are constrained by the different rock
properties which they measure. The individual contributions are illustrated with structural models and
the benefits of an integrated interpretation are shown. Conclusions are drawn from the final
interpretation.
IJSER

International Journal of Scientific & Engineering Research, Volume 5, Issue 5, May-2014 136 ISSN 2229-5518
IJSER © 2014 http://www.ijser.org
1.4 CONCLUSION
Considering the MT and Gravity data, modeling has been carried out along two profiles which has
indicated that basement depth is of the order of 5000m in Katol low. A thick sequence of Lower
Gondwana sediments below trap is predicted. Sediments of Barakar Formation are estimated to be
around 1500m in it. The incremental thickness of source and reservoir rocks enhances the HC
prospectivity of the basin. Thus, Nagpur-Wardha sector has all favorable factors for making a potential
infra-trappean discovery of hydrocarbon within Deccan syneclise. The gravity lows of less sedimentary
thickness mapped in the region may become important Coal Bed Methane (CBM) exploration target,
since the coal seams occurring within 1000m depth with adequate overburden of basaltic cover are
likely to be of suitable rank.
2 GEOCHEMICAL PROSPECTING:
Near surface geochemical prospecting techniques for hydrocarbons is based on the premise that the
component gases (C1-C4) of subsurface oil/gas accumulations escape and migrate vertically to the
surface and get adsorbed in the near surface soil matrix .These light gaseous hydrocarbons may be
detected either directly or indirectly through geochemical changes they induce and the anamoly at the
surface can be reliably related to a petroleum accumulation at a deeper level.
2.1 SOIL SAMPLING AND ANALYTICAL PROCEDURE
a total of 50 soil samples were collected in part of Deccan Syneclise at an interval of 5km along existing
roads. Samples have been collected in the depth range of 1.2-3.5m using manual augers. The soil cores
collected were wrapped in aluminum foils and sealed in poly-metal packs.
One gram of soil sample is reacted under vacuum with orthophosphoric acid to desorb the soil gases.
The CO2 released was trapped in KOH solution and the light gaseous hydrocarbons were collected by
water displacement in a graduated tube fitted with rubber septa. The volume of desorbed gases is then
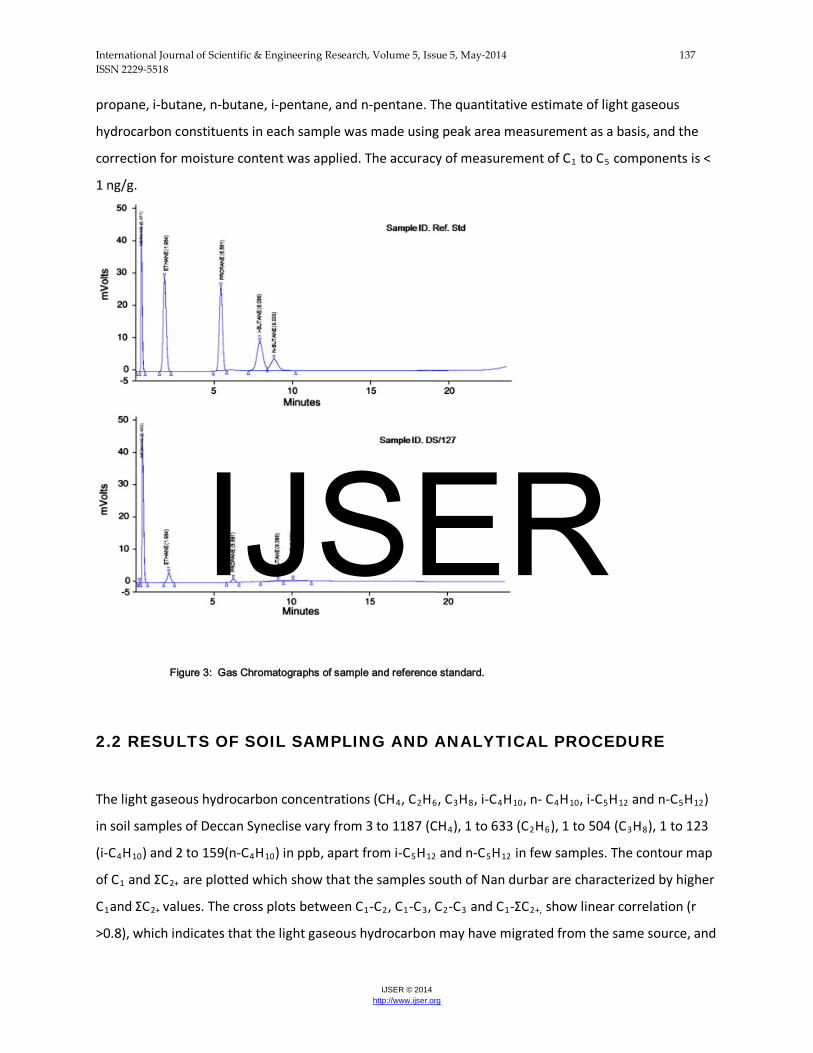
recorded, and 500 μl of desorbed gas sample is injected into the Varian CP-3800 Gas Chromatograph
fitted with Porapak ‘Q’ column, programmable temperature controller, and flame ionization detector.
The GC was calibrated by using an external standard with known concentrations of methane, ethane,
IJSER
International Journal of Scientific & Engineering Research, Volume 5, Issue 5, May-2014 137 ISSN 2229-5518
IJSER © 2014 http://www.ijser.org
propane, i-butane, n-butane, i-pentane, and n-pentane. The quantitative estimate of light gaseous
hydrocarbon constituents in each sample was made using peak area measurement as a basis, and the
correction for moisture content was applied. The accuracy of measurement of C1 to C5 components is <
1 ng/g.
Figure 3: Gas Chromatographs of sample and reference standard.
2.2 RESULTS OF SOIL SAMPLING AND ANALYTICAL PROCEDURE
The light gaseous hydrocarbon concentrations (CH4, C2H6, C3H8, i-C4H10, n- C4H10, i-C5H12 and n-C5H12)
in soil samples of Deccan Syneclise vary from 3 to 1187 (CH4), 1 to 633 (C2H6), 1 to 504 (C3H8), 1 to 123
(i-C4H10) and 2 to 159(n-C4H10) in ppb, apart from i-C5H12 and n-C5H12 in few samples. The contour map
of C1 and ΣC2+ are plotted which show that the samples south of Nan durbar are characterized by higher
C1and ΣC2+ values. The cross plots between C1-C2, C1-C3, C2-C3 and C1-ΣC2+, show linear correlation (r
>0.8), which indicates that the light gaseous hydrocarbon may have migrated from the same source, and
IJSER

International Journal of Scientific & Engineering Research, Volume 5, Issue 5, May-2014 138 ISSN 2229-5518
IJSER © 2014 http://www.ijser.org
the effect of secondary alteration during their seepage toward the surface may be insignificant.
Analyses of the gas samples for the measurement of δ C13 in methane were carried out using Thermo
Finnegan Delta Plus XP Isotope Ratio Mass Spectrometer. The δ C13 values are reported as parts per
thousand (‰) relative to the Peedee belemnite (PDB) standard (precision is ±0.3%). δ C13 in methane
lies in the range of –24 to –39.4‰ PDB suggesting a thermogenic origin. The presence of C1-C5
hydrocarbons in the adsorbed soil gases in the samples collected from part of Deccan Syneclise indicates
that hydrocarbon generation has taken place in the basin and gases are derived from thermogenic
source. The geochemical studies suggest that this part of Deccan Syneclise may prove to be a warm area
for future hydrocarbon exploration and exploitation.
Figure 4: Cross plots of C1–C2 and C1–ΣC2 +.
IJSER

International Journal of Scientific & Engineering Research, Volume 5, Issue 5, May-2014 139 ISSN 2229-5518
IJSER © 2014 http://www.ijser.org
3 SOIL IODINE DETERMINATION OF DECCAN SYNECLISE
The use of iodine as an indirect surface geochemical indicator is based on the affinity of iodine with the
seeping hydrocarbons, resulting in formation and accumulation of covalently bonded iodo-organic
compounds in the surface soils .
3.1 Surface sampling and analytical procedure
Surface sampling is recommended to get the most repeatable values for the iodine as the soil and the
related soil heterogeneity is less uncertain at surface compared to depth.(Tedesco et al., 1987, Gaudge,
2007). About 73samples were collected from a depth of 2-4inches along the existing roads at an interval
of4-5 km and wrapped in poly metal foils with their locations marked (Fig. V)
3.2 Analytical Procedures
One of the key issues for using iodine in hydrocarbon exploration lies in the determination of iodine
concentration in soil .Complete extraction of iodine from soil matrix has always been difficult. The
volatile nature of iodine results in loss of concentration in the form of molecular iodine. The sample
digestion technique is important and varies from acid to alkaline media depending upon the sample type
.Extraction in alkaline media prevents oxidation of iodides and iodates back to elemental iodine to some
extent. Tetra methyl ammonium hydroxide (TMAH), a strong organic alkali is a better extracting agent
and is being widely used in the modern extracting techniques. Several instruments are capable of
determining iodine concentrations but most widely used are inductively coupled plasma emission mass
spectrometer and Ion Chromatograph. With lower concentrations of iodine in soil, it becomes important
to select analytical techniques that can measure iodine in part per million and part per billion ranges
.For geochemical analyses of iodine in soils, a rapid and accurate method for its extraction and
measurement was developed using ICP-MS .A 100 mg of 63 micron size soil sample was treated with 5
ml of 10% Tetra methyl ammonium hydroxide (TMAH) in savillex pressure decomposition vessels at 80°C
for 6hrs. After cooling, the solution was diluted with Millipore water and 1 ml of 250 ppb antimony is
added to act as internal standard and the volume was made up to 25 ml. The final solution containing
2% TMAH and 10 ppb antimony was centrifuged at 3000 rpm for 20 minutes and filtered through
Wattman filter paper No.1 to get the clean solution. Similar procedure was used for the samples, blank
IJSER
International Journal of Scientific & Engineering Research, Volume 5, Issue 5, May-2014 140 ISSN 2229-5518
IJSER © 2014 http://www.ijser.org
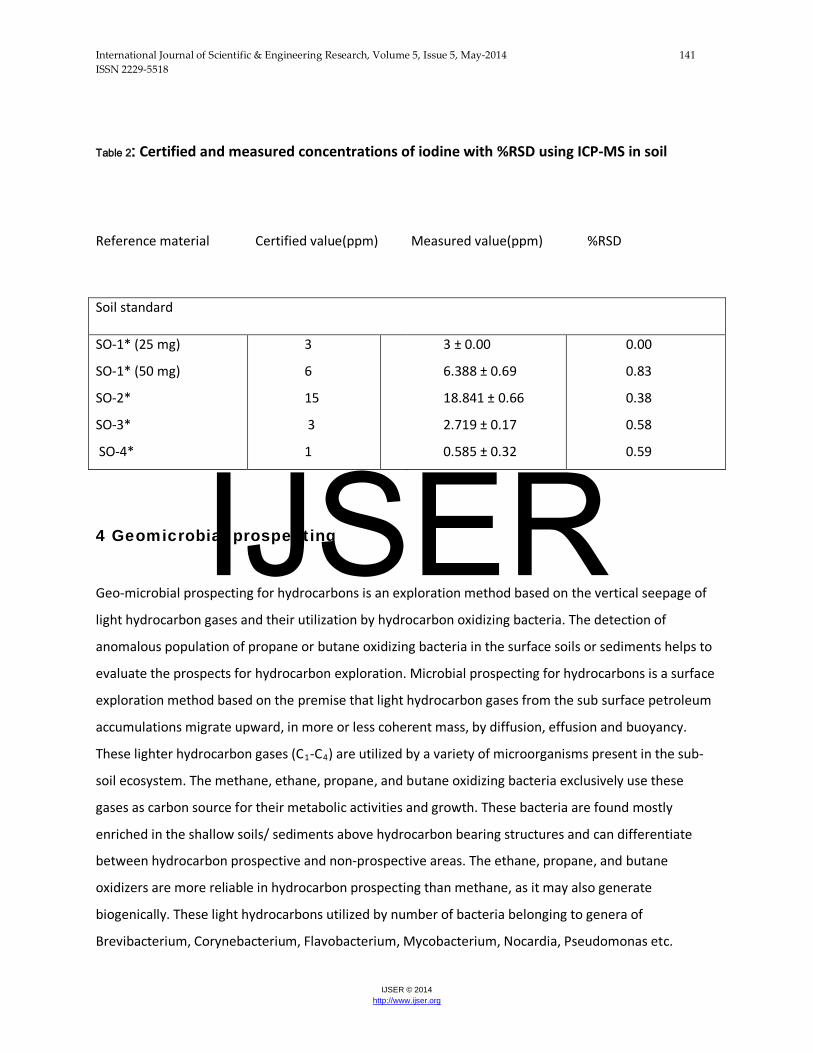
and soil standard (SO-1). The analyses were performed by Perkin Elmer Sciex DRC II ICPMS. .In the
procedure mentioned, SO-1, being a matrix matching international soil standard reference material was
used to calibrate the ICP–MS. To evaluate the accuracy of the methodology, two different dilutions of
soil reference materials SO-1 (25 and 50 mg), SO-2,SO-3 and SO-4 were analyzed as unknown samples
and compared with the certified values .The measured concentrations of iodine in soil standards are
reported in Table II, along with the certified values. The values obtained are in good agreement with the
certified values, except for standard SO-2. The concentration obtained for SO-2 during repeat
measurements in our experiment is 18.84 ppm, whereas the value reported in the literature is 15 ppm .
The relative standard deviation (%RSD) as three times the standard deviation of the blank is <1%and the
limit of detection is 0.027 ppm.
3.3 Output of Soil Iodine Determination Survey
The soil iodine distribution in part of Deccan Syneclise has been studied to know the related
geochemical anomalies and their implication for the hydrocarbon prospect in the basin. The iodine
concentration ranges from 1.9 ppm to 19.3 ppm and are distributed over the entire study area clearly
differentiating the background and the anomalous zones. The northern part of the sampled region
shows significant iodine concentrations especially near Shirpur and Dondaicha. As inferred from the
geophysical studies, this region also has considerable Mesozoic sedimentation about 2 kms and the
Deccan volcanicity during the Late Cretaceous may have aided in meeting the thermal requisites for
hydrocarbon generation. The low iodine concentrations are characteristic of region with lower sediment
thickness of few hundred meters in the southern part. The iodine distribution pattern is supported by
the light hydrocarbon data and geological and geophysical information of the area. The study indicates
the effectiveness of iodine as a geochemical exploration tool for oil and gas and the integration of the
geochemical data with other geoscientific data suggests that Deccan Syneclise holds good potential for
oil and gas prospect.
IJSER
International Journal of Scientific & Engineering Research, Volume 5, Issue 5, May-2014 141 ISSN 2229-5518
IJSER © 2014 http://www.ijser.org
Table 2: Certified and measured concentrations of iodine with %RSD using ICP-MS in soil
Reference material Certified value(ppm) Measured value(ppm) %RSD
4 Geomicrobial prospecting
Geo-microbial prospecting for hydrocarbons is an exploration method based on the vertical seepage of
light hydrocarbon gases and their utilization by hydrocarbon oxidizing bacteria. The detection of
anomalous population of propane or butane oxidizing bacteria in the surface soils or sediments helps to
evaluate the prospects for hydrocarbon exploration. Microbial prospecting for hydrocarbons is a surface
exploration method based on the premise that light hydrocarbon gases from the sub surface petroleum
accumulations migrate upward, in more or less coherent mass, by diffusion, effusion and buoyancy.
These lighter hydrocarbon gases (C1-C4) are utilized by a variety of microorganisms present in the sub-
soil ecosystem. The methane, ethane, propane, and butane oxidizing bacteria exclusively use these
gases as carbon source for their metabolic activities and growth. These bacteria are found mostly
enriched in the shallow soils/ sediments above hydrocarbon bearing structures and can differentiate
between hydrocarbon prospective and non-prospective areas. The ethane, propane, and butane
oxidizers are more reliable in hydrocarbon prospecting than methane, as it may also generate
biogenically. These light hydrocarbons utilized by number of bacteria belonging to genera of
Brevibacterium, Corynebacterium, Flavobacterium, Mycobacterium, Nocardia, Pseudomonas etc.
Soil standard
SO-1* (25 mg)
SO-1* (50 mg)
SO-2*
SO-3*
SO-4*
3
6
15
3
1
3 ± 0.00
6.388 ± 0.69
18.841 ± 0.66
2.719 ± 0.17
0.585 ± 0.32
0.00
0.83
0.38
0.58
0.59
IJSER

International Journal of Scientific & Engineering Research, Volume 5, Issue 5, May-2014 142 ISSN 2229-5518
IJSER © 2014 http://www.ijser.org
4.1 Methodology
About 50gms of soil/sediment, samples were collected from the field in pre-sterilized whirl pack bags
under aseptic conditions from a depth of about 1m and were stored in cryogenic conditions. The
isolation of light hydrocarbon oxidizing bacteria is carried out using standard plate count method. The
Mineral salts medium (MSM) plates were incubated in the environment of hydrocarbons and zero air
(50:50), respectively. The bacterial colonies were reported in Colony forming unit (Cfu/gm) of soil
sample. The bacterial population and anomaly maps were prepared using SURFER-8 software.
4.2 Output of Geomicrobial Prospecting
Dhule area ranges from 1.0 x 10² to 6.7 x 10⁵Cfu/gm of soil. The propane oxidizers anomalies map
.Indicates that the bacterial population is distributed in the north and south western parts of the studied
area. The arithmetic mean and the standard deviation of bacterial counts are found to be 3.32 x 10⁴ and
5.09 x 10⁴ Cfu/gm respectively the study area located in part of Deccan Synclise exposes highly
weathered, zeolitized basalt lava flows of the compound pahoehoe type. Along the Tapi River, Tertiary
and Quaternary alluvium, 30-km wide and 200–400 m thick, caps the basalt pile. The propane oxidizing
bacterial count in the soil samples of the studied.
Parameter Propane oxidizing bacteria
Number of samples 100
Minimum .2 x 102 Cfu/gm
Maximum 3.38 x 10⁵ Cfu/gm
Arithmetic mean 3.32 x 10⁴ Cfu/gm
Standard deviation 5.09 104 Cfu/gm
Table 3: Statistical analysis of Propane Oxidizing Bacteria (POB) in soil samples from part of Deccan Syneclise
IJSER

International Journal of Scientific & Engineering Research, Volume 5, Issue 5, May-2014 143 ISSN 2229-5518
IJSER © 2014 http://www.ijser.org
Figure 5: The propane oxidizing bacterial concentration distribution map of Deccan Syneclise
Conclusion
The geological and geophysical data of this part of the Deccan Syneclise indicate the presence of about
2-3 km thick Mesozoic sediments concealed below up to 2 km thick Deccan trap. The petroleum geology
of the basin shows the expected reservoir rocks as sandstone of Mesozoic sequence & Gondwana group.
The probable source rocks are the dark grey shale and marls of lower Gondwana group and the cap
rocks may be the intraformational shale and the trap flows .Various geochemical surveys were done by
using different anomalies to prove the presence of hydrocarbons. The carbon isotopic signature of
IJSER

International Journal of Scientific & Engineering Research, Volume 5, Issue 5, May-2014 144 ISSN 2229-5518
IJSER © 2014 http://www.ijser.org
methane ranged from −29.5 to −43.0‰ (PDB) and ethane from −19.1 to −20.9‰ (PDB), indicating a
thermogenic source of hydrocarbons. . The iodine concentration ranges from 1.9 ppm to 19.3 ppm and
are distributed over the entire study area clearly differentiating the background and the anomalous
zones. . The propane oxidizing bacterial count in the soil samples of the studied area is ranging from
1.0 x 10² to 6.7 x 10⁵ Cfu/gm, thus the area is prospective for hydrocarbon exploration. By using
integrated method approach, the weak signal of oil and gas reservoirs could be amplified in the
frontier areas and thus may open new vistas for commercial discovery of oil/gas in the Mesozoic of
India.
References
• C.Vishnu Vardhan and Balesh kumar,2008, Hydrocarbon prospects in sub-trappean Mesozoic
Syneclise: Evidence from surface Geochemical prospecting
• Devleena Mani and A.M Dayal : Exploration of hydrocarbon using Iodine as indicator in soil
samples
• M.A Rasheed and S.V Raju,Geo-microbial and light gaseous hydrocarbon anomalies in the near
surface soils of Deccan Syneclise Basin,India:Implications to Hydrocarbon Resource potential
• Todupunuri Madhavi and Dattatray J.Patil : Evidence for a relationship between Hydrocarbon
microseepage and trace metal anomalies : an Implication for Petroleum Exploration
• en.wikipidia.org/wiki/magnetotelluricsbritanica
• www.UKm.my/rahim/gravity%20lecture
• P.Koteswara rao and P.R.Reddy ,2005,A Cost effective strategy in conducting integrated
geophysical studies in trap covered country
• R.S Goyal and K.Venkata Rao,2004,Deep Resistivity Survey Results in Deccan Trap covered area
of Central India
IJSER